Attached files
| file | filename |
|---|---|
| 8-K - FORM 8-K - EXELON GENERATION CO LLC | d8k.htm |
 Bank
of America Merrill Lynch Power & Gas Leaders Conference
September 29, 2010
Chaka Patterson, Vice President and Treasurer
Exhibit 99.1 |
 2
Forward-Looking Statements
This presentation includes forward-looking statements within the meaning of the
Private Securities Litigation Reform Act of 1995, that are subject to risks
and uncertainties. The factors that could cause actual results to differ
materially from these forward-looking statements include those discussed
herein as well as those discussed in (1) Exelon’s 2009 Annual Report on
Form 10-K in (a) ITEM 1A. Risk Factors, (b) ITEM 7. Management’s
Discussion and Analysis of Financial Condition and Results of Operations and
(c) ITEM 8. Financial Statements and Supplementary Data: Note 18; (2)
Exelon’s Second Quarter 2010 Quarterly Report on Form 10-Q in (a) Part II,
Other Information, ITEM 1A. Risk Factors, (b) Part 1, Financial
Information, ITEM 2. Management’s Discussion and Analysis of Financial
Condition and Results of Operations and (c) Part I , Financial Information,
ITEM 1. Financial Statements: Note 12 and (3) other factors discussed in
filings with the Securities and Exchange Commission (SEC) by Exelon
Corporation, Commonwealth Edison Company, PECO Energy Company and Exelon
Generation Company, LLC (Companies). Readers are cautioned not to place
undue reliance on these forward-looking statements, which apply only as of
the date of this presentation. None of the Companies undertakes any obligation to
publicly release any revision to its forward-looking statements to
reflect events or circumstances after the date of this presentation.
|
 2017/
2018
2016/
2017
2015/
2016
2014/
2015
PJM RPM Auctions
Delivery Year
2010
2011
2012
2013
2014
2015
2016
2017
2018
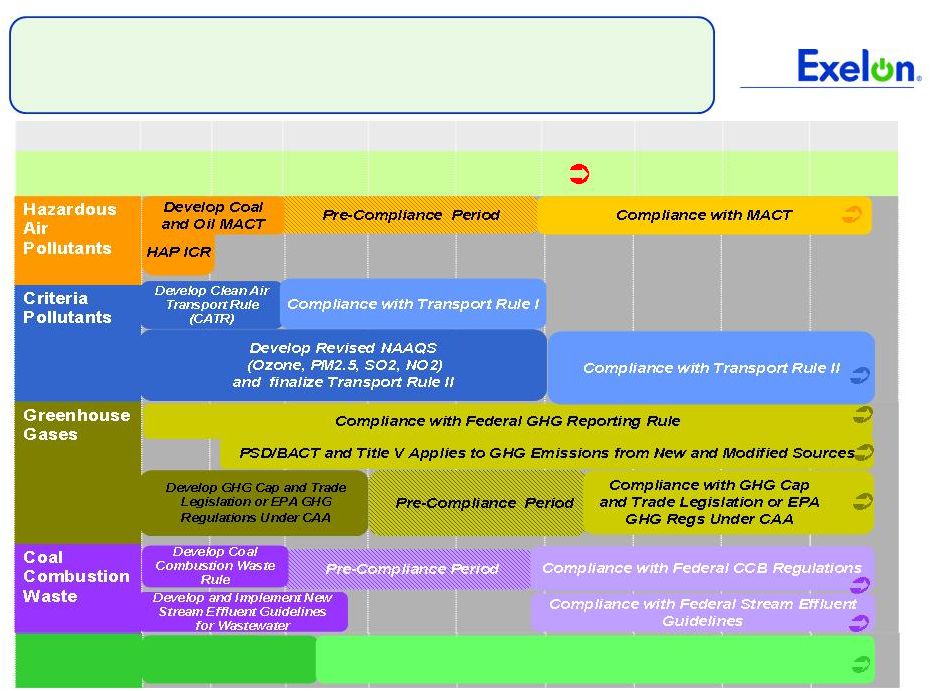
EPA Regulations –
Market Implications
Leading up to 2012 Compliance
Cooling
Water
Develop 316(b)
Regulations
Compliance with 316(b) regulations
3
Notes: Reliability Pricing Model (RPM) auctions take place annually in May.
For definition of the EPA regulations referred to on this slide, please see the EPA’s Terms of
Environment (http://www.epa.gov/OCEPAterms/). |
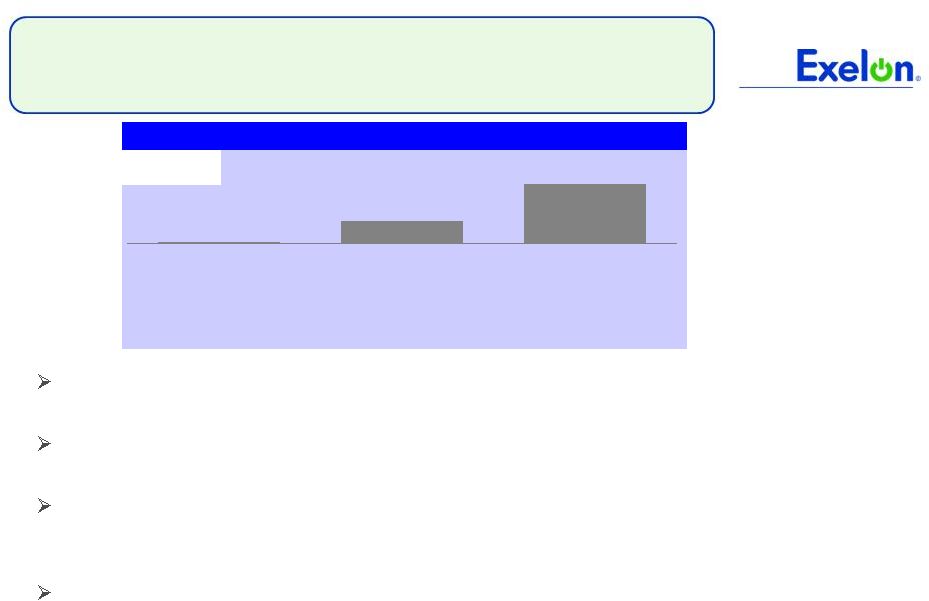
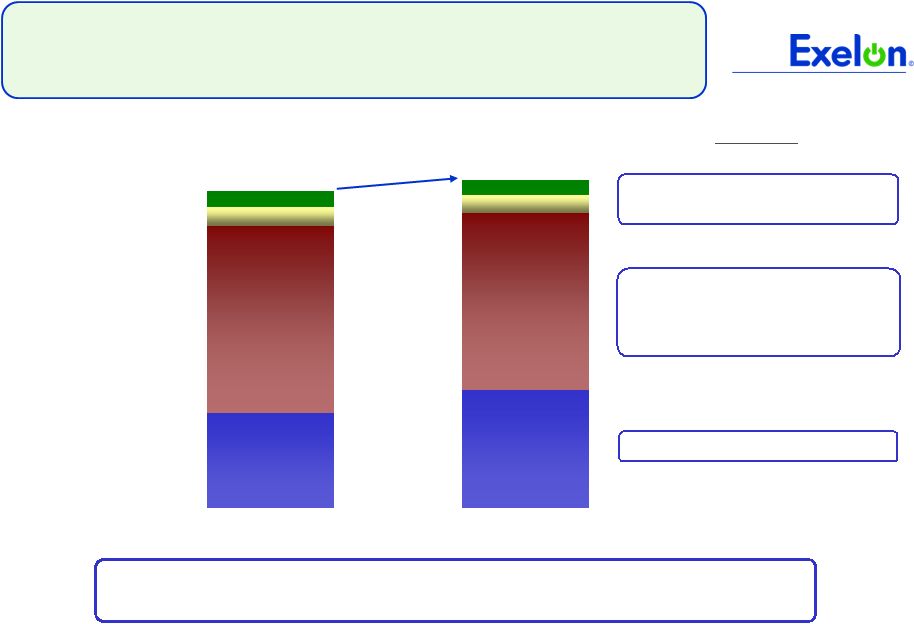
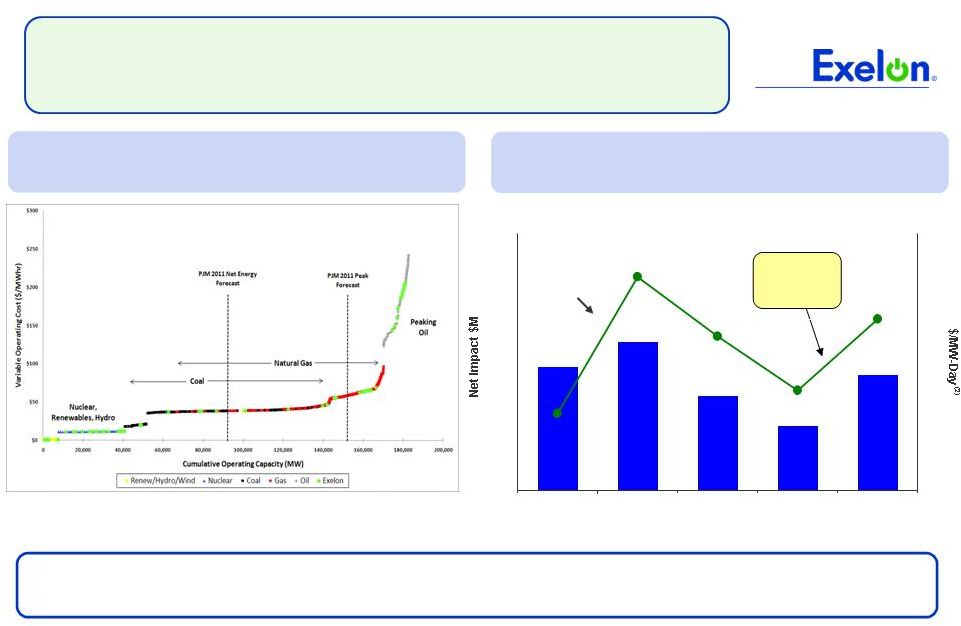 PJM
RPM Capacity Auction Note: Data contained on this slide is rounded.
(1)
Both supply and demand include effects of First Energy’s generation and
forecasted load, respectively, joining PJM. Illustrated unit costs are of existing PJM generation using 2011
fuel prices as of 4/30/2010
(2)
Weighted average $/MW-Day would apply if all generation cleared in the
highlighted zone. PJM RPM Capacity Prices and Auction ($MW-day)
~$400M
Increase
EPA Regulations will put upward pressure on energy and capacity clearing
prices. 2013/14 RPM auction results in $400 million revenue increase to
Exelon over prior auction Left axis
PJM Supply Curve
(1)
Sources: CEMS, Energy Velocity, SNL, Exelon
Proprietary Information
74.75
134.46
174.29
110.00
143.90
0
500
1,000
1,500
2009/2010
2010/2011
2011/2012
2012/2013
2013/2014
0
100
200
300
4 |
 5
EPA Clean Air Standards Will Not Threaten
Electric System Reliability
Proactive steps by EPA, the industry and other agencies will allow orderly plant
retirements without impacting system reliability
M.J. Bradley and Analysis Group report
(1)
in August 2010 concluded industry is
well-positioned to respond to proposed standards
•
System has >100 GWs of excess capacity
•
Regulators
have
tools
to
address
localized
reliability
concerns,
including
appropriate
price signals from capacity markets
•
Industry has proven track record of adding generation capacity and transmission
solutions
New clean air standards will help modernize US power generation
infrastructure •
Proven technologies for controls are commercially available: >50% of coal
units have installed controls demonstrating that compliance costs can be
managed •
Pollution-intensive plant retirements will create room for cleaner, more
efficient generation
(1) M.J. Bradley & Associates, LLC and Analysis Group. 2010. Ensuring a Clean, Modern
Electric Generating Fleet while Maintaining Electric System Reliability. |
 6
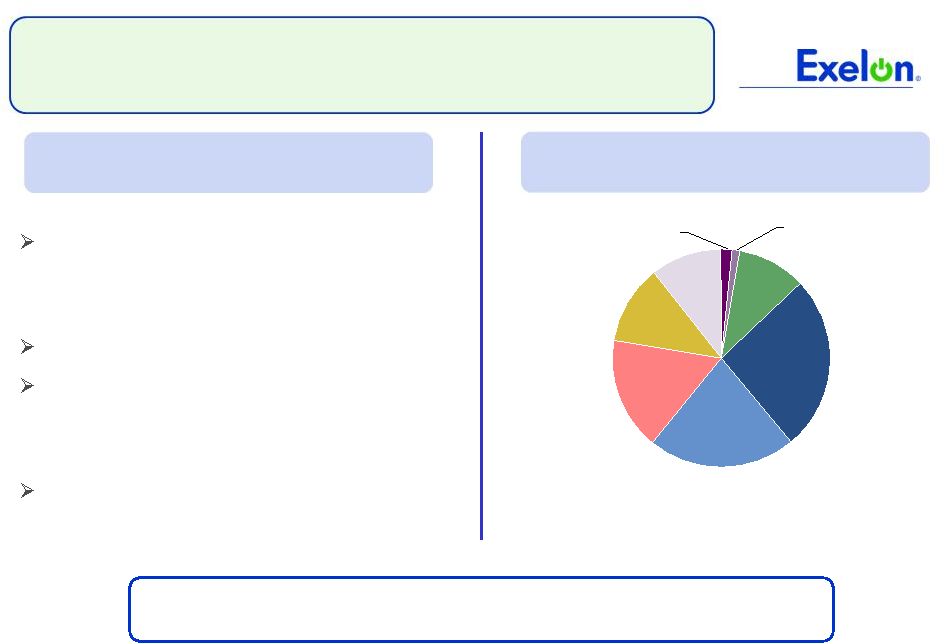
John Deere Renewable Wind Acquisition
735 operating MW of clean, renewable
energy, along with 230 MW in advanced
stages of development in Michigan
75% of the operating portfolio is contracted
Purchase price of $860 million plus an
option for $40 million upon commencement
of construction of the development projects
Attractive economics –
EPS and cash flow
accretive
Acquisition positions Exelon as a large wind operator,
complementing its world-class nuclear fleet
TX, 26%
MO,
22%
MI, 17%
ID, 12%
MN,
11%
OR,
10%
KS, 2%
IL, 1%
Transaction Summary
Operating
Assets
–
Geographical
Distribution |
 7
PECO –
Electric & Gas Distribution
Rate Case Settlements
Joint settlement filed with the PAPUC on August 31, 2010 for both electric and gas
rate cases
Settlements are subject to administrative law judges review and PAPUC approval by
mid-December 2010
$20 million
$225 million
Revenue Requirement Increase in
settlement
(1)
R-2010-2161592
R-2010-2161575
Docket #
<10%
(2)
Electric
~8%
2011 Distribution Price Increase as %
of Overall Customer Bill for Residential
customers
Gas
Rate Case Details
New rates scheduled to go into effect on January 1, 2011
(1)
Settlements are on an overall revenue requirement basis, meaning no details are provided for allowed
ROE, rate base or capital structure. (2)
Excluding Alternative Energy Portfolio Standards and default service surcharge. Assumes results from
final procurement in September 2010 are the same as May 2010 procurement.
Note: Electric and gas rate case filings available on Pennsylvania Public Utility Commission (PAPUC)
website (www.puc.state.pa.us) or www.peco.com/know. |
 8
ComEd Delivery Rate Case
Alternative Regulation (Alt Reg) Proposal
ComEd submitted an Alt Reg filing on August 31, 2010 proposing to recover the costs
of pre- approved projects outside of the traditional rate case
process •
9-month statutory process
$60 million proposal would create a collaborative framework for increased
investments in the future implementation of ICC-approved Smart Grid
investments Customer benefits include:
•
Assured
savings
to
customers
–
$2
million
on
capped
O&M
costs
for
program
costs
(excluding
CARE)
•
An incentive/penalty mechanism for performance above or under budget
Proposal would allow for accelerated modernization of the distribution system,
increased assistance to low-income households and the purchase of electric
vehicles $30
$15
Man-hole refurbishment and cable replacement
-
$10
Expanded
funding
for
low
income
CARE
programs
(1)
$5
-
Electric Vehicle Fleet Purchase
Capital
O&M
$ millions
(1)
CARE = Customers’
Affordable Reliable Energy. Total CARE amount for two-year proposal is $20
million. |
 9
Exelon Generation Hedging Disclosures
(As disclosed on July 22, 2010) |
 10
Important Information
The following slides are intended to provide additional information regarding the hedging
program at Exelon Generation and to serve as an aid for the purposes of modeling Exelon
Generation’s gross margin (operating revenues less purchased power and fuel expense). The
information on the following slides is not intended to represent earnings guidance or a forecast
of future events. In fact, many of the factors that ultimately will determine Exelon
Generation’s actual gross margin are based upon highly variable market factors outside of
our control. The information on the following slides is as of June 30, 2010. We
update this information on a quarterly basis.
Certain information on the following slides is based upon an internal simulation model that
incorporates assumptions regarding future market conditions, including power and commodity
prices, heat rates, and demand conditions, in addition to operating performance and dispatch
characteristics of our generating fleet. Our simulation model and the assumptions therein are
subject to change. For example, actual market conditions and the dispatch profile of our
generation fleet in future periods will likely differ – and may differ significantly –
from the assumptions underlying the simulation results included in the slides. In addition,
the forward- looking information included in the following slides will likely change over time
due to continued refinement of our simulation model and changes in our views on future market
conditions. |
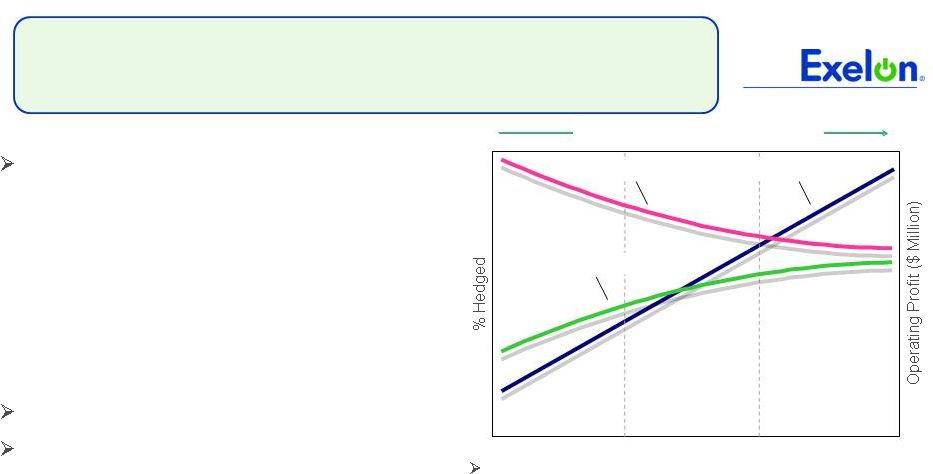 11
Portfolio Management Objective
Align Hedging Activities with Financial Commitments
Power Team utilizes several product types
and channels to market
•
Wholesale and retail sales
•
Block products
•
Load-following products
and load auctions
•
Put/call options
Exelon’s hedging program is designed to
protect the long-term value of our
generating fleet and maintain an
investment-grade balance sheet
•
Hedge enough commodity risk to meet future cash
requirements if prices drop
•
Consider: financing policy (credit rating objectives,
capital structure, liquidity); spending (capital and
O&M); shareholder value return policy
Consider market, credit, operational risk
Approach to managing volatility
•
Increase hedging as delivery approaches
•
Have enough supply to meet peak load
•
Purchase fossil fuels as power is sold
•
Choose hedging products based on generation
portfolio –
sell what we own
•
Heat rate options
•
Fuel products
•
Capacity
•
Renewable credits
% Hedged
High End of Profit
Low End of Profit
Open Generation
with LT Contracts
Portfolio
Optimization
Portfolio
Management
Portfolio Management Over Time |
 12
Percentage of Expected
Generation Hedged
•
How many equivalent MW have been
hedged at forward market prices; all hedge
products used are converted to an
equivalent average MW volume
•
Takes ALL
hedges into account whether
they are power sales or financial products
Equivalent MWs Sold
Expected Generation
=
Our normal practice is to hedge commodity risk on a ratable basis
over the three years leading to the spot market
•
Carry operational length into spot market to manage forced outage and
load-following risks
•
By
using
the
appropriate
product
mix,
expected
generation
hedged
approaches
the
mid-90s percentile as the delivery period approaches
•
Participation in larger procurement events, such as utility auctions, and some
flexibility in the timing of hedging may mean the hedge program is not
strictly ratable from quarter to quarter
Exelon Generation Hedging Program |
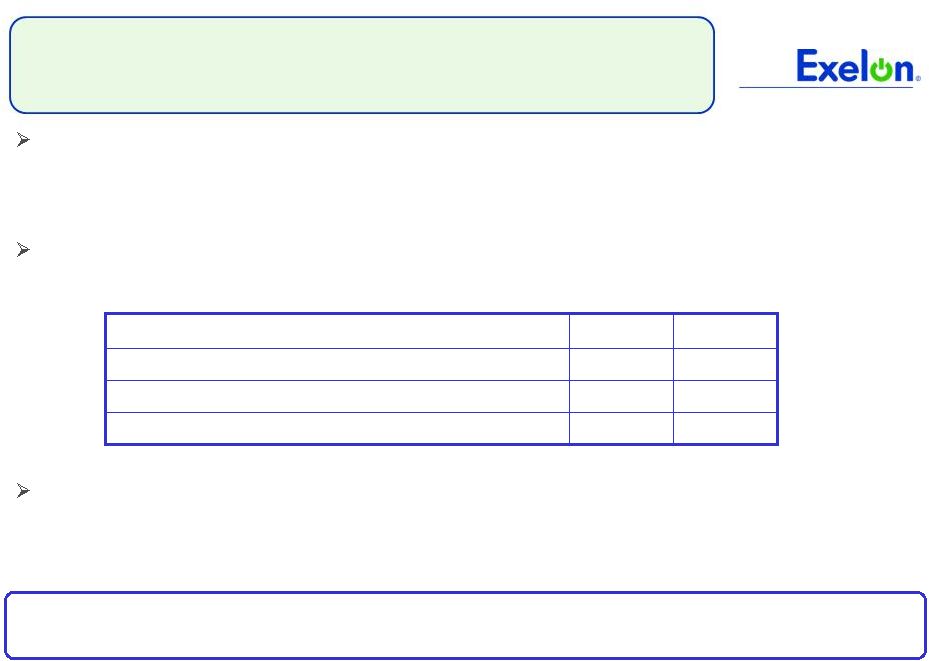
 13
2010
2011
2012
Estimated Open Gross Margin ($ millions)
(1)(2)
$5,700
$5,300
$5,100
Open gross margin assumes all expected generation is
sold at the Reference Prices listed below
Reference Prices
(1)
Henry Hub Natural Gas ($/MMBtu)
NI-Hub ATC Energy Price ($/MWh)
PJM-W ATC Energy Price ($/MWh)
ERCOT
North
ATC
Spark
Spread
($/MWh)
(3)
$4.77
$33.17
$44.76
$1.28
$5.34
$32.63
$45.54
$(0.02)
$5.68
$34.22
$46.86
$0.53
Exelon Generation Open Gross Margin and
Reference Prices
(1)
Based on June 30, 2010 market conditions.
(2)
Gross margin is defined as operating revenues less fuel expense and purchased power expense, excluding
the impact of decommissioning and other incidental revenues. Open gross margin is estimated
based upon an internal model that is developed by dispatching our expected generation to current market power and fossil fuel prices. Open gross margin
assumes there is no hedging in place other than fixed assumptions for capacity cleared in the RPM
auctions and uranium costs for nuclear power plants. Open gross margin contains assumptions for
other gross margin line items such as various ISO bill and ancillary revenues and costs and PPA capacity revenues and payments. The estimation of open gross
margin incorporates management discretion and modeling assumptions that are subject to change.
(3)
ERCOT North ATC spark spread using Houston Ship Channel Gas, 7,200 heat rate, $2.50 variable O&M.
|
 14
2010
2011
2012
Expected Generation
(GWh)
(1)
167,500
163,000
162,600
Midwest
100,000
98,700
97,500
Mid-Atlantic
58,900
57,000
57,000
South
8,600
7,300
8,100
Percentage of Expected Generation Hedged
(2)
96-99%
86-89%
57-60%
Midwest
96-99
86-89
54-57
Mid-Atlantic
96-99
90-93
59-62
South
97-100
66-69
51-54
Effective Realized Energy Price
($/MWh)
(3)
Midwest
$46.00
$43.50
$44.50
Mid-Atlantic
$36.50
$57.50
$51.00
ERCOT North ATC Spark Spread
$0.00
$(2.00)
$(5.50)
Generation Profile
(1)
Expected generation represents the amount of energy estimated to be generated or purchased through
owned or contracted for capacity. Expected generation is based upon a simulated dispatch
model that makes assumptions regarding future market conditions, which are calibrated to market quotes for power, fuel, load following products, and
options. Expected generation assumes 10 refueling outages in 2010 and 11 refueling outages in
2011 and 2012 at Exelon-operated nuclear plants and Salem. Expected generation
assumes capacity factors of 94.1%, 93.2% and 92.9% in 2010, 2011 and 2012 at Exelon-operated nuclear plants. These estimates of expected generation in 2011
and 2012 do not represent guidance or a forecast of future results as Exelon has not completed its
planning or optimization processes for those years. (2)
Percent of expected generation hedged is the amount of equivalent sales divided by the expected
generation. Includes all hedging products, such as wholesale and retail sales of power,
options, and swaps. Uses expected value on options. Reflects decision to permanently retire Cromby Station and Eddystone Units 1&2 as of May 31, 2011.
Current RMR discussions do not impact metrics presented in the hedging disclosure.
(3)
Effective realized energy price is representative of an all-in hedged price, on a per MWh basis,
at which expected generation has been hedged. It is developed by considering the energy
revenues and costs associated with our hedges and by considering the fossil fuel that has been purchased to lock in margin. It excludes uranium costs
and RPM capacity revenue, but includes the mark-to-market value of capacity contracted at
prices other than RPM clearing prices including our load obligations. It can be compared
with the reference prices used to calculate open gross margin in order to determine the mark-to-market value of Exelon Generation's energy hedges. |
 15
Gross
Margin
Sensitivities
with
Existing
Hedges
($
millions)
(1)
Henry Hub Natural Gas
+ $1/MMBtu
-
$1/MMBtu
NI-Hub ATC Energy Price
+$5/MWH
-$5/MWH
PJM-W ATC Energy Price
+$5/MWH
-$5/MWH
Nuclear Capacity Factor
+1% / -1%
2010
$20
$(15)
$10
$(5)
$5
$ -
+/-
$25
2011
$100
$(90)
$75
$(65)
$30
$(25)
+/-
$45
2012
$260
$(245)
$220
$(210)
$130
$(125)
+/-
$45
Exelon Generation Gross Margin Sensitivities
(with Existing Hedges)
(1)
Based on June 30, 2010 market conditions and hedged position. Gas price sensitivities are based on an
assumed gas-power relationship derived from an internal model that is updated
periodically. Power prices sensitivities are derived by adjusting the power price assumption while keeping all other prices inputs constant. Due
to correlation of the various assumptions, the hedged gross margin impact calculated by aggregating
individual sensitivities may not be equal to the hedged gross margin impact calculated when
correlations between the various assumptions are also considered. |
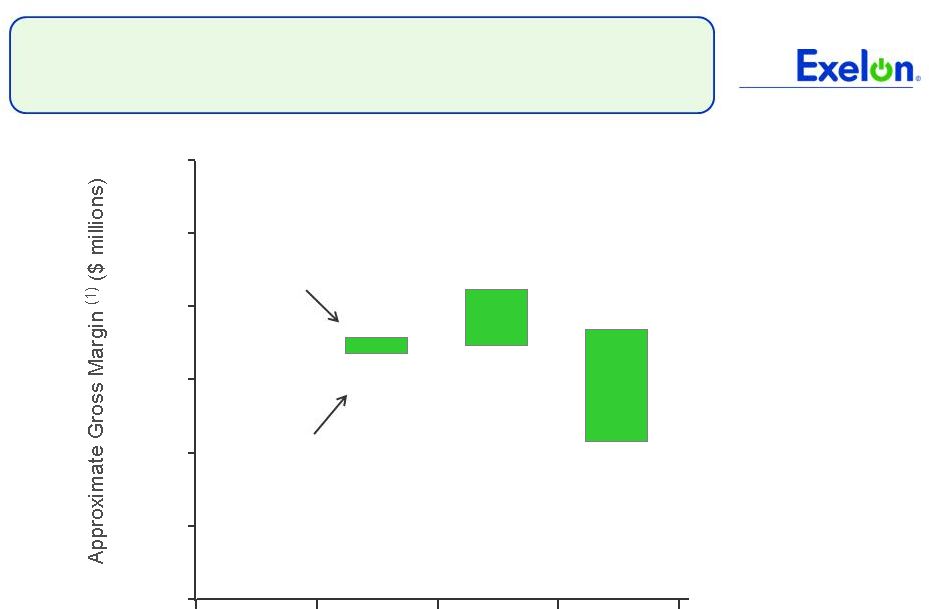 16
95% case
5% case
$6,600
$6,400
$5,100
$7,100
$6,500
$6,600
Exelon Generation Gross Margin Upside / Risk
(with Existing Hedges)
$3,000
$4,000
$5,000
$6,000
$7,000
$8,000
$9,000
2010
2011
2012
(1)
Represents an approximate range of expected gross margin, taking into account hedges in place, between
the 5th and 95th percent confidence levels assuming all unhedged supply is sold into the spot
market. Approximate gross margin ranges are based upon an internal simulation model and are subject to change based upon market inputs,
future transactions and potential modeling changes. These ranges of approximate gross margin in 2011
and 2012 do not represent earnings guidance or a forecast of future results as Exelon has not
completed its planning or optimization processes for those years. The price distributions that generate this range are calibrated to market quotes for
power, fuel, load following products, and options as of June 30, 2010. |
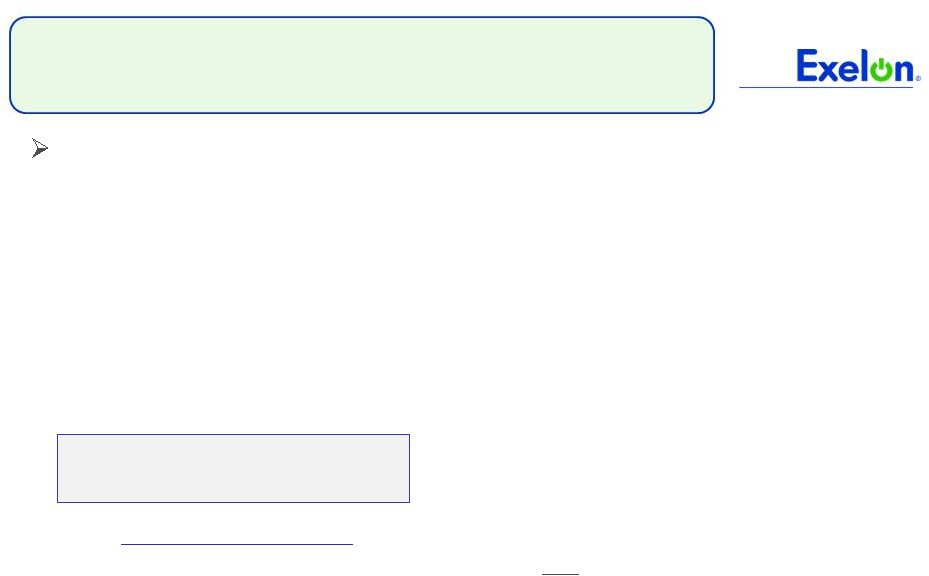
 17
Midwest
Mid-Atlantic
ERCOT
Step 1
Start
with
fleetwide
open
gross
margin
$5.70 billion
Step 2
Determine the mark-to-market value
of energy hedges
100,000GWh * 97% *
($46.00/MWh-$33.17/MWh)
= $1.24 billion
58,900GWh * 97% *
($36.50/MWh-$44.76/MWh)
= $(0.47 billion)
8,600GWh * 98% *
($0.00/MWh-$1.28/MWh)
= $(0.01) billion
Step 3
Estimate
hedged
gross
margin
by
adding open gross margin to mark-to-
market value of energy hedges
Open gross
margin: $5.70 billion
MTM value of energy
hedges: $1.24
billion
+
$(0.47
billion)
+
$(0.01)
billion
Estimated hedged gross margin:
$6.46 billion
Illustrative Example
of Modeling Exelon Generation 2010 Gross Margin
(with Existing Hedges) |
 18
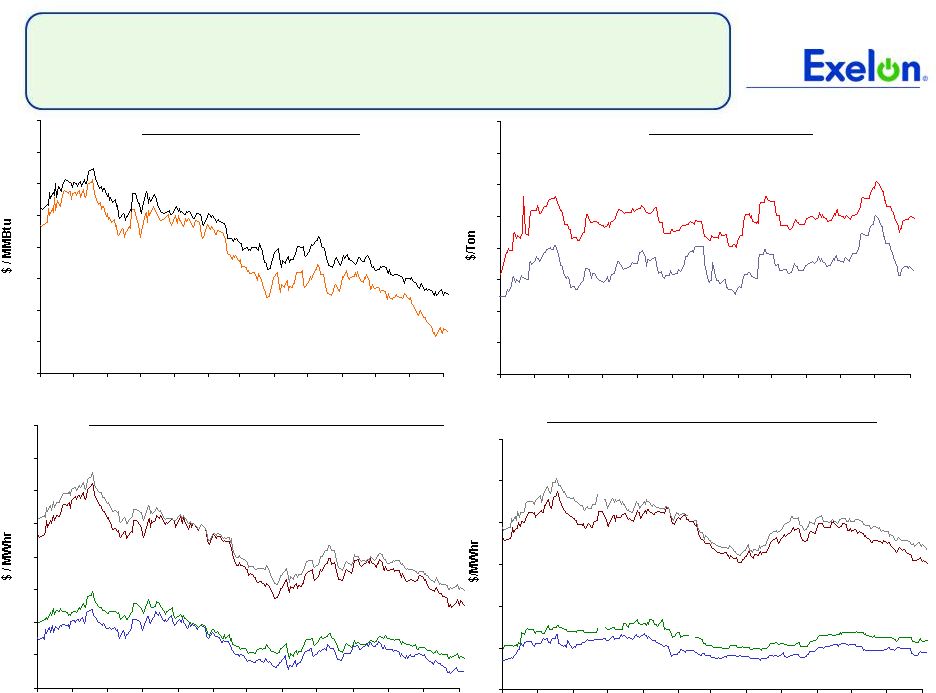
Market Price Snapshot
Forward NYMEX Natural Gas
PJM-West and Ni-Hub On-Peak Forward Prices
PJM-West and Ni-Hub Wrap Forward Prices
2011
$4.64
2012 $5.26
Rolling
12
months,
as
of
September
8
th
,
2010.
Source:
OTC
quotes
and
electronic
trading
system.
Quotes
are
daily.
Forward NYMEX Coal
2011
$66.50
2012
$74.59
2011 Ni-Hub $37.43
2012 Ni-Hub
$39.48
2012 PJM-West $49.82
2011 PJM-West
$47.47
2011 Ni-Hub
$24.48
2012 Ni-Hub
$25.97
2012 PJM-West
$36.76
2011 PJM-West
$35.09
4.0
4.5
5.0
5.5
6.0
6.5
7.0
7.5
8.0
9/09
10/09
11/09
12/09
1/10
2/10
3/10
4/10
5/10
6/10
7/10
8/10
9/10
50
55
60
65
70
75
80
85
90
9/09
10/09
11/09
12/09
1/10
2/10
3/10
4/10
5/10
6/10
7/10
8/10
9/10
35
40
45
50
55
60
65
70
75
9/09
10/09
11/09
12/09
1/10
2/10
3/10
4/10
5/10
6/10
7/10
8/10
9/10
20
25
30
35
40
45
50
9/09
10/09
11/09
12/09
1/10
2/10
3/10
4/10
5/10
6/10
7/10
8/10
9/10 |
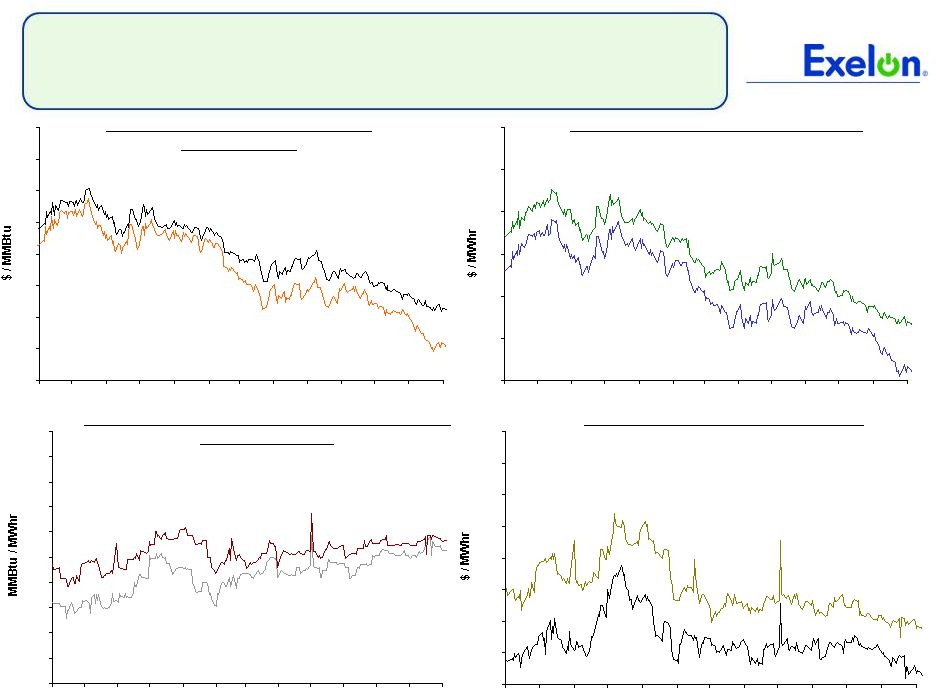 19
Market Price Snapshot
2012
$9.14
2011
$9.04
2011
$40.93
2012
$46.82
2011
$4.53
2012
$5.13
Houston Ship Channel Natural Gas
Forward Prices
ERCOT North On-Peak Forward Prices
ERCOT North On-Peak v. Houston Ship Channel
Implied Heat Rate
2011
$5.76
2012
$7.34
ERCOT North On Peak Spark Spread
Assumes a 7.2 Heat Rate, $1.50 O&M, and $.15 adder
Rolling
12
months,
as
of
September
8
th
,
2010.
Source:
OTC
quotes
and
electronic
trading
system.
Quotes
are
daily.
4.0
4.5
5.0
5.5
6.0
6.5
7.0
7.5
8.0
9/09
10/09
11/09
12/09
1/10
2/10
3/10
4/10
5/10
6/10
7/10
8/10
9/10
8.0
8.2
8.4
8.6
8.8
9.0
9.2
9.4
9.6
9.8
10.0
9/09
10/09
11/09
12/09
1/10
2/10
3/10
4/10
5/10
6/10
7/10
8/10
9/10
40
45
50
55
60
65
70
9/09
10/09
11/09
12/09
1/10
2/10
3/10
4/10
5/10
6/10
7/10
8/10
9/10
5.5
6.5
7.5
8.5
9.5
10.5
11.5
12.5
13.5
9/09
10/09
11/09
12/09
1/10
2/10
3/10
4/10
5/10
6/10
7/10
8/10
9/10 |
  20
Appendix |
 21
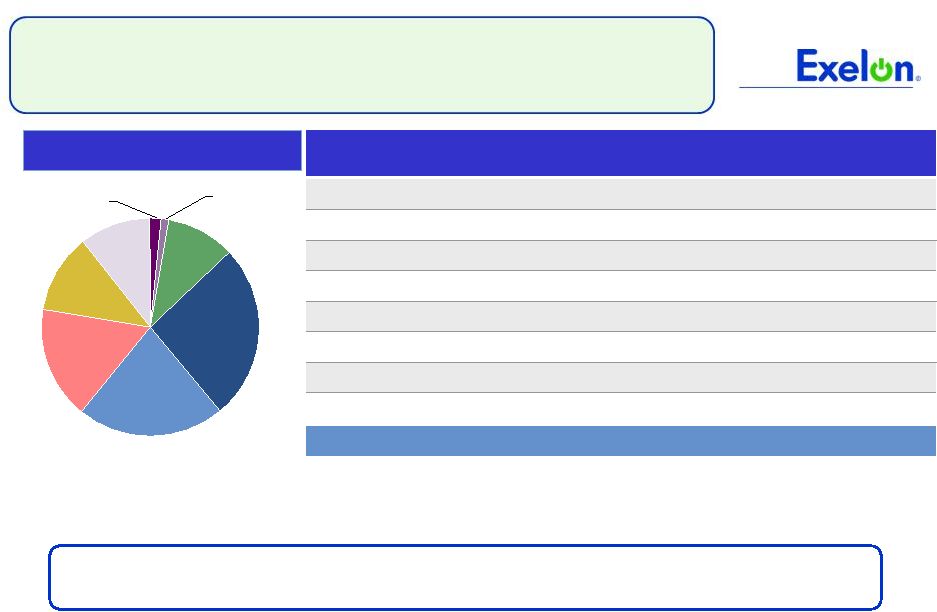
John Deere Renewable Acquisition –
Strategic Rationale
Diversify with additional clean generation
•
JDR’s proven wind platform provides unique opportunity and entry point into
U.S. wind business
•
Provides diversity in geographic presence and generation type
•
Supports Exelon 2020 by adding more “clean”
generation to our portfolio and
positions us for potential federal renewable portfolio standard (RPS)
Contracted portfolio with option for future growth
•
75% of operating portfolio sold under long-term PPAs
•
1,468 additional MW in pipeline, of which 230 MW have executed PPAs
•
Only plan further development of contracted assets
Attractive economics and good fit
•
Purchase price compares favorably with other wind transactions
•
Disciplined investment approach aligned with Exelon’s approach
•
Addition of strong renewable energy development team
Acquisition further enhances Exelon’s strong environmental leadership and
provides future opportunities for incremental development
|
  22
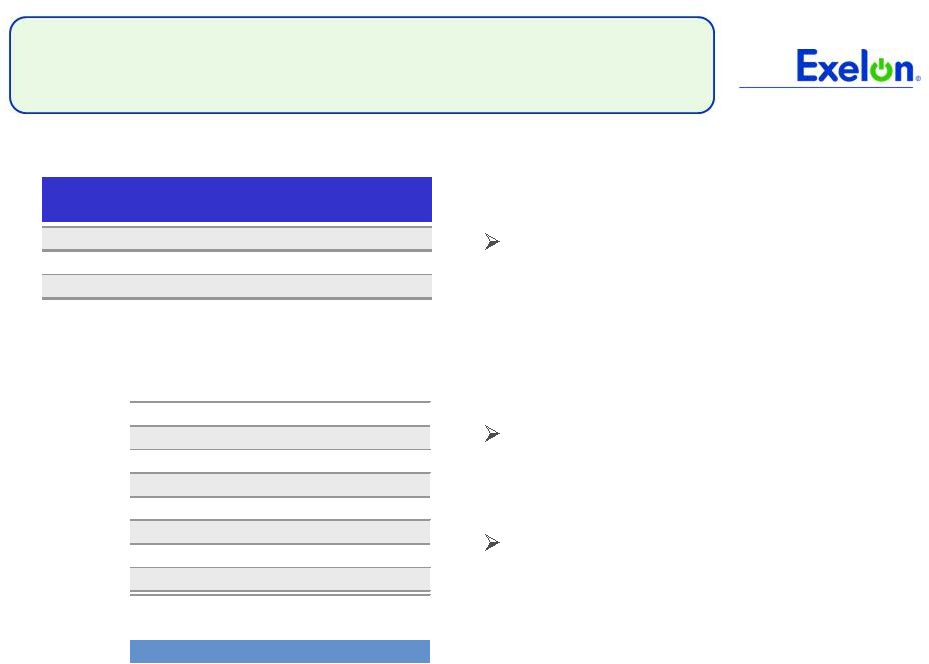
John Deere Renewable Acquisition –
Financials Are Attractive
EPS breakeven in 2011, accretive beginning in 2012
•
Assumes transaction is funded with 100% debt
EBITDA run-rate of ~$150M/year including PTCs
(1)
(including Michigan development
projects)
Free cash flow accretive by 2013
•
Includes estimated capex (before tax incentives) of $450-$500M in
2011-2012 for Michigan development projects
Expect transaction to have minimal impact on credit metrics
EPS Accretion / Dilution
0.0%
0.6%
1.5%
2011E
2012E
2013E
(1) Production Tax Credits |
 23
23
John Deere Renewable Acquisition
Asset Profile –
Operating
The portfolio is largely made up of contracted operating assets
Geographic Distribution
TX, 26%
MO,
22%
MI, 17%
ID, 12%
MN,
11%
OR,
10%
KS, 2%
IL, 1%
Note:
There is ongoing litigation with Southwest Public Service related to PURPA
contracts which could impact the price at which the generation from these
units is sold. Cracking issues experienced by Deere on certain Suzlon
turbine blades have been addressed to our satisfaction.
We have factored both items into our valuation.
Project State
MW
# of Wind
Projects
Ownership
Placed in
Service
Date
PPA End
Date
Federal
Incentive
Off-Taker
Idaho
88.2
3
100%
2009/2010
2028/2030
ITC Grant
Idaho Power
Illinois
8.4
1
99%
2008
2018
PTC
Wabash Valley Power
Kansas
12.5
1
100%
2010
2030
PTC
Kansas Power Pool
Michigan
121.8
2
100%
2008
2018/2028
PTC
Wolverine Power Supply
/ Consumers Energy
Minnesota
77.7
9
94%-100%
2003/2008
2018/2028
PTC
Various
Missouri
162.5
4
99%-100%
2008
2027
PTC
Associated Electric /
MO Joint Municipal
Oregon
74.5
4
99%-100%
2009
2029
ITC Grant
PacifiCorp
Texas
189.8
12
100%
2006/2009
N/A
PTC
Southwest Public Service
Total
735.4
36 |
 24
24
John Deere Renewable Acquisition
Asset Profile –
Development Pipeline
PPAs already executed for these
projects
Development pipeline includes
wind projects ranging from 20 MW
to 300 MW
Development of projects to be
considered on a case-by-case
basis
State
Project Name
MW
MI
Michigan Wind II
90
MI
Harvest II
59
MI
Blissfield (MW IV)
81
Total
230
Projects to be developed by Exelon
Optional projects for development
Ohio
198
Michigan
40
Idaho
20
Texas
760
Maine
50
Colorado
40
Oregon
30
California
100
Total
1,238
Total
1,468 |
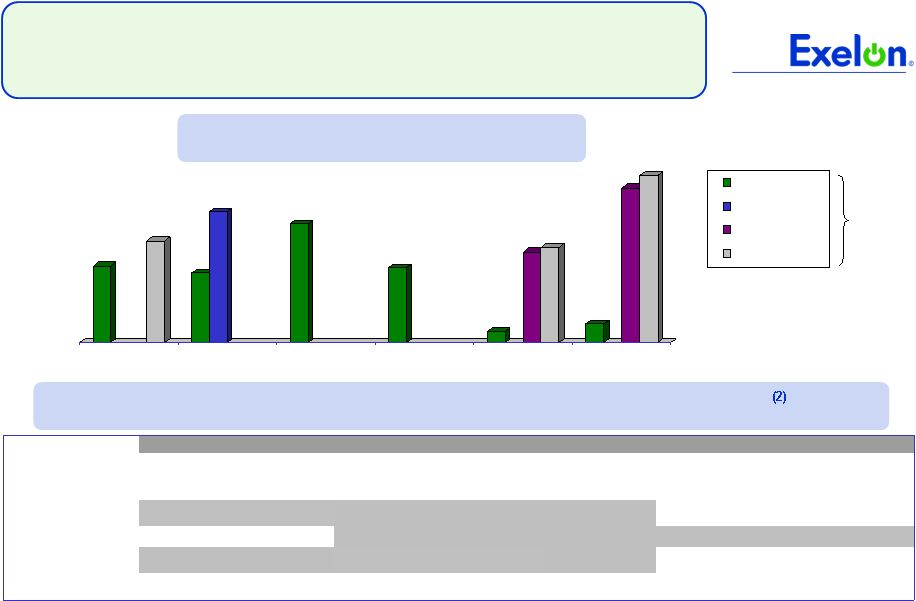 111.91
148.80
102.04
191.32
174.29
110.00
16.46
133.37
139.73
27.73
226.15
245.00
2008/2009
2009/2010
2010/2011
2011/2012
2012/2013
2013/2014
RTO
MAAC + APS
MAAC
Eastern MAAC
Only shown
if cleared
at separate
price and
generation
is located
in that zone
(1)
PJM RPM Auction Results
Note: Data contained on this slide is rounded.
(1)
MAAC = Mid-Atlantic Area Council; APS = Allegheny Power System.
(2)
All generation values are approximate and not inclusive of wholesale
transactions. (3)
All capacity values are in installed capacity terms (summer ratings) located in the
areas. (4)
Obligation represents the remainder of the ComEd auction load that ends in May
2010. (5)
Obligation consists of load obligations from PECO. PECO PPA expires December
2010. (6)
Elwood
contract
expires
on
12/31/12
and
Kincaid
contract
expires
on
2/28/13.
(7)
Reflects decision in December 2010 to permanently retire Cromby Station and
Eddystone Units 1&2
as
of
5/31/11.
None
of
these
933
MW
cleared
in
the
2011/2012
or
2012/2013
auctions.
(8)
Weighted average $/MW-Day would apply if all generation cleared in the
highlighted zones. $134.46
1,500
8,700
(7)
10,300
(6)
Capacity
(3)
2013/2014
2009/2010
2010/2011
2011/2012
2012/2013
in MW
Capacity
(3)
Obligation
Capacity
(3)
Obligation
Capacity
(3)
Capacity
(3)
RTO
12,800
3,800 -
4,100
(5)
23,900
9,300 -
9,400
(4)
23,200
12,100
(6)
EMAAC
9,500
MAAC + APS
11,100
9,300 –
9,400
(5)
MAAC
1,500
Avg ($/MW-Day)
(8)
$143.90
$174.29
$110.00
$74.75
PJM RPM Auction ($MW-day)
25
Exelon Generation Eligible Capacity within PJM Reliability Pricing
Model |
 -10.0%
-7.5%
-5.0%
-2.5%
0.0%
2.5%
5.0%
7.5%
10.0%
1Q09
2Q09
3Q09
4Q09
1Q10
2Q10
3Q10E
4Q10E
-10.0%
-7.5%
-5.0%
-2.5%
0.0%
2.5%
5.0%
7.5%
10.0%
All Customer Classes
Large C&I
Residential
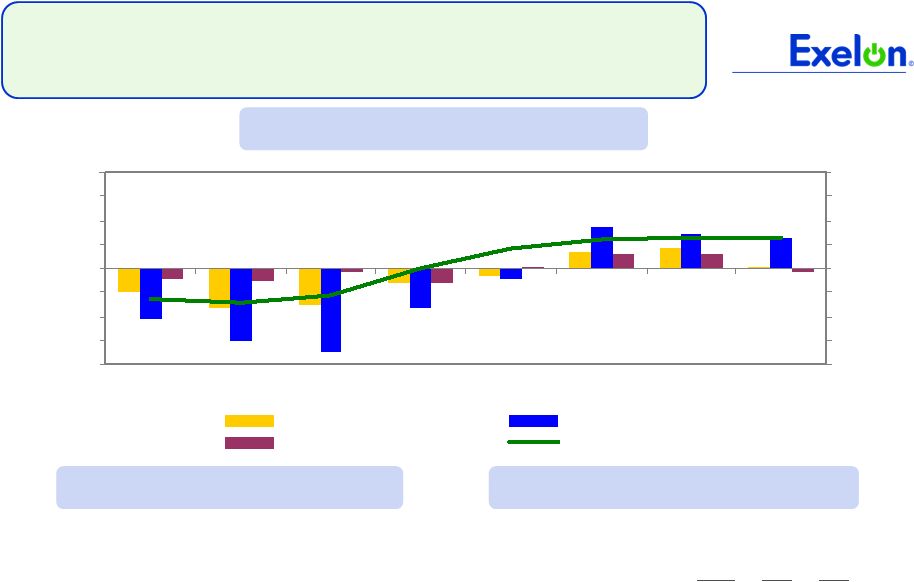
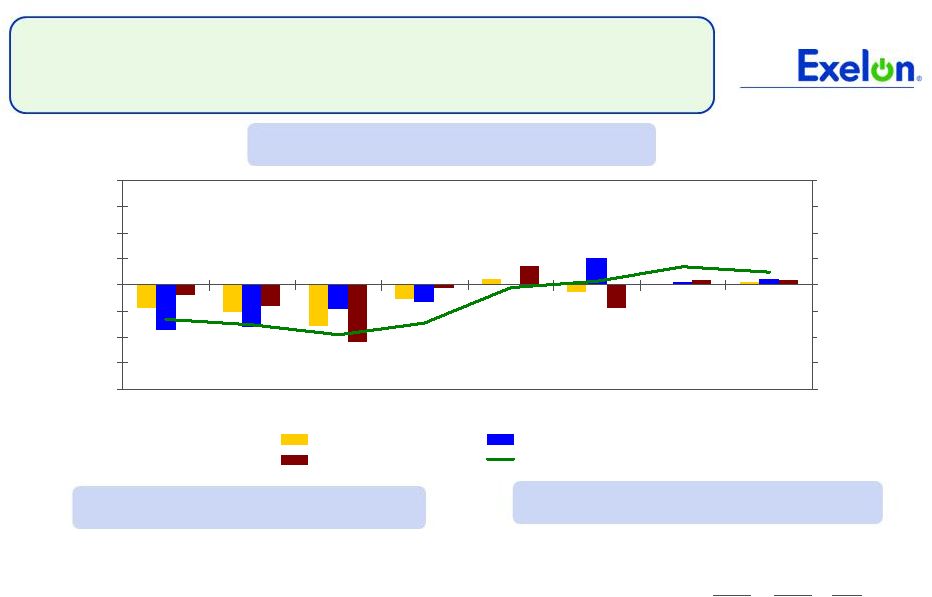
Gross Metro Product
ComEd Load Trends
Note: C&I = Commercial & Industrial
Chicago
Unemployment rate
(1)
10.2%
2010 annualized growth in
gross domestic/metro product
(2)
2.9%
4/10 Home price index
(3)
(1.5)%
(1) Source: Illinois Dept. of Employment Security (June 2010)
(2)
Source: Global Insight (June 2010)
(3)
Source: S&P Case-Shiller Index
(4)
Not adjusted for leap year effect
2009
(4)
2Q10 2010E
Average Customer Growth
(0.4)%
0.2% 0.2%
Average Use-Per-Customer
(1.0)%
1.4%
0.5%
Total Residential
(1.4)%
1.6% 0.7%
Small C&I
(2.2)%
(0.1)% (0.6)%
Large C&I
(6.7)%
4.3% 2.5%
All Customer Classes
(3.3)%
1.8% 0.8%
Weather-Normalized
Load
Year-over-Year
(4)
Key Economic Indicators
Weather-Normalized Load
26 |
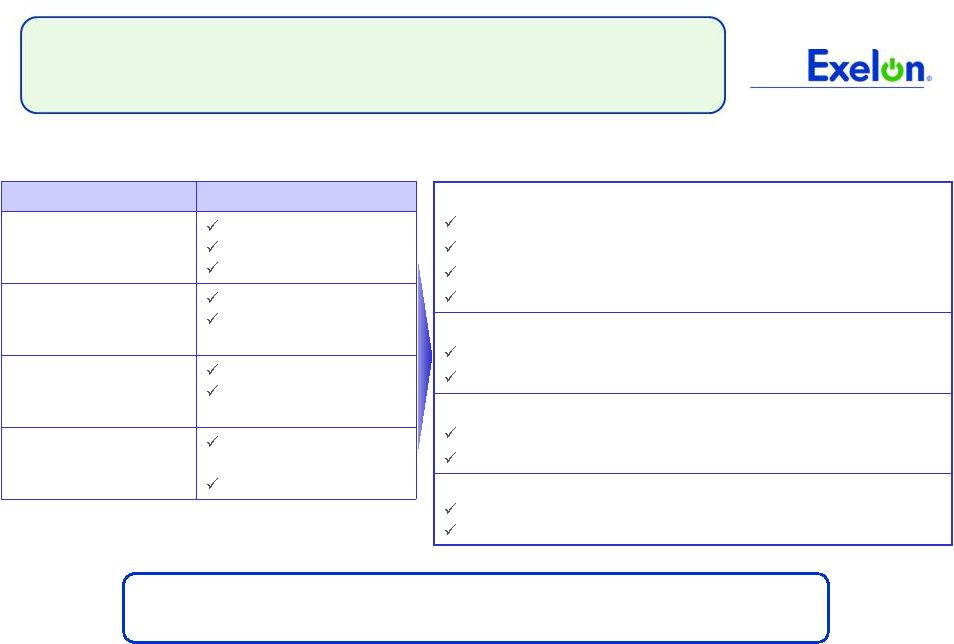
 27
ComEd Delivery Service
Rate Case Filing Summary
$396
Total ($2,337 million revenue requirement)
(6)
$45
Other adjustments
(5)
$22
Bad debt costs (resets base level of bad debt to 2009 test year)
$55
Pension and Post-retirement health care expenses
(4)
$95
Capital Structure
(3)
: ROE –
11.50% /
Common
Equity
–
47.33%
/
ROR
–
8.99%
$179
(2)
Rate Base: $7,717 million
(1)
Requested Revenue
Increase
($ in millions)
Primary drivers of rate request are new plant investment, pension/retiree
health care and cost of capital
(1)
Filed
June
30,
2010
based
on
2009
test
year,
including
pro
forma
capital
additions
through
June
2011,
and
certain
other
2010
pro
forma adjustments. ICC Docket #: 10-0467,
http://www.icc.illinois.gov/docket/casedetails.aspx?no=10-0467. (2)
Includes increased depreciation expense.
(3)
Requested capital structure does not include goodwill; ICC docket 07-0566
allowed 10.3% ROE, 45.04% equity ratio and 8.36% ROR. ROE includes 0.40%
adder for energy efficiency incentive. (4)
Reflects 2010 expense levels, compared to 2007 expense levels allowed in last rate
case. (5)
Includes reductions to O&M and taxes other than income, offset by wage
increases, normalization of storm costs and the Illinois Electric
Distribution
Tax,
other
O&M
increases,
and
decreases
in
load.
(6)
Net of Other Revenues.
Note: ROE = Return on Equity, ROR = Return on Rate Base, ICC = Illinois
Commerce Commission. |
 28
3.82
4.73
7.44
7.03
0.73
0.73
0.65
0.60
ComEd Delivery Rate Case
Residential Rate Impacts 2010 to 2011
(1)
(1)
Reflects change in distribution rates only. Assumes Energy, Transmission and
all other components remain constant as of June 2010, except as noted
above. (2)
"All Other" includes impact of riders that are applicable to residential
bills. Unit rates: cents / kWh
All Other
(2)
Transmission
Energy
Distribution
Approximately
4% increase
July 1, 2010
July 1, 2011
Transmission: Subject to FERC
formula rate annual update
Comments
Energy: Reflects reduced PJM capacity
price that PJM has published for the
June 2011 –
May
2012 planning
period. Energy component may vary
Distribution: As proposed
12.63
13.09
Note: Amounts may not add due to rounding.
Proposed residential rate impact of 7% will be mitigated by impact
of lower capacity prices resulting in a net increase of 4%
|
 29
ComEd Delivery Service Rate Case
Schedule
Delivery
Service
Rate
Case
Filed
–
June
30,
2010
Alt
Reg
Proposal
Filed
–
August
31,
2010
Intervenor
and
Rebuttal
Testimony
–
4Q
2010
Hearings –
January 2011
Administrative
Law
Judge
Order
–
March
31,
2011
Final
Order
Expected
–
May
2011
New Rates Effective –
June 2011 |
 PECO
Load Trends Philadelphia
Unemployment rate
(1)
9.2%
2010 annualized growth in
gross
domestic/metro
product
(2)
0.8%
Note: C&I = Commercial & Industrial
Weather-Normalized
Load
Year-over-Year
(3)
Key Economic Indicators
Weather-Normalized Load
2009
(3)
2Q10 2010E
Average Customer Growth
(0.2)%
0.2%
0.0%
Average Use-Per-Customer
(2.1)%
(2.5)%
0.3%
Total Residential
(2.3)%
(2.3)% 0.2%
Small C&I
(2.7)%
(5.1)% (1.8)%
Large C&I
(3.0)%
2.6% 0.9%
All Customer Classes
(2.6)%
(0.7)% 0.1%
(1) Source: U.S Dept. of Labor Preliminary data (June 2010)
(2)
Source: PECO estimate
(3)
Not adjusted for leap year effect
-10.0%
-7.5%
-5.0%
-2.5%
0.0%
2.5%
5.0%
7.5%
10.0%
1Q09
2Q09
3Q09
4Q09
1Q10
2Q10
3Q10E
4Q10E
-10.0%
-7.5%
-5.0%
-2.5%
0.0%
2.5%
5.0%
7.5%
10.0%
All Customer Classes
Large C&I
Residential
Gross Metro Product
30 |
 31
PECO Procurement
(1)
See PECO Procurement website (http://www.pecoprocurement.com) for additional
details regarding PECO’s procurement plan and RFP results. (2)
Wholesale prices. No Small/Medium Commercial products were procured in the
June 2009 RFP. September 2010 results will be public in October.
(3)
For Large C&I customers who have opted to participate in the 2011
fixed-priced full requirements product. Large Commercial and
Industrial Average price of $77.55/MWh
100%
of
fixed-price
full
requirements
procured
in
May
’10
(3)
Medium Commercial
Sept ’09 / May ’10 RFP aggregate result $77.89/MWh
Remaining 42% of full requirements procured in Sep ‘10
Residential
June ’09 RFP average price of $88.61/MWh
Sept ’09 RFP average price of $79.96/MWh
May ‘10 RFP average price of $69.38/MWh
Remaining 28% of full requirements procured in Sep ‘10
Small Commercial
Sept ’09 / May ’10 RFP aggregate result $77.65/MWh
Remaining 40% of full requirements procured in Sep ‘10
85% full requirements
15% full requirements
spot
Medium Commercial
(peak demand >100
kW but <= 500 kW)
Fixed-priced full
requirements
(3)
Hourly full requirements
Large Commercial &
Industrial
(peak
demand >500 kW)
90% full requirements
10% full requirements
spot
75% full requirements
20% block energy
5% energy only spot
Products
Small Commercial
(peak demand <100
kW)
Residential
Customer Class
PECO Procurement Plan
(1)
2011 Supply Procured
(2)
Final RFP for 2011 supply was held on September 20, 2010; results
will be public on October 14, 2010 |
 32
Exelon Investor Relations Contacts
Exelon Investor Relations
10 South Dearborn Street
Chicago, Illinois 60603
312-394-2345
312-394-4082 (Fax)
For copies of other presentations,
annual/quarterly reports, or to be added
to our email distribution list please
contact:
Martha Chavez, Executive Admin
Coordinator
312-394-4069
Martha.Chavez@ExelonCorp.com
Investor Relations Contacts:
Stacie Frank, Vice President
312-394-3094
Stacie.Frank@ExelonCorp.com
Melissa Sherrod, Director
312-394-8351
Melissa.Sherrod@ExelonCorp.com
Paul Mountain, Manager
312-394-2407
Paul.Mountain@ExelonCorp.com
Marybeth Flater, Manager
312-394-8354
Marybeth.Flater@ExelonCorp.com
Sandeep Menon, Principal Analyst
312-394-7279
Sandeep.Menon@ExelonCorp.com |