Attached files
| file | filename |
|---|---|
| 8-K - FLORIDIAN FINANCIAL GROUP INC | i00416_floridian-8k.htm |
September 2010
Dear Shareholder:
As you are probably aware, the economy in Florida is struggling to achieve positive trends. This difficult environment has contributed to additional provisions for loan losses at the Corporation’s banks during the second quarter of 2010, while overall non-performing assets2 continue to perform better than the median of all commercial banks in Florida.1 Floridian Financial Group continues to report favorable financial measures from an operating standpoint, excluding these increases to the allowance for loan losses. In spite of the poor economic trends, the Corporation’s banks continue to originate quality loans and grow core deposits. Further, Floridian Financial Group continues to maintain capital levels in excess of all well capitalized regulatory measures.
Earnings and Asset Quality
During the first quarter where we saw positive signs that the Florida economy was improving, the second quarter reflected a slowing economy and declining credit quality. Consistent with this “observation”, we reported positive earnings results in the first quarter of 2010, while results for the second quarter were heavily influenced by a $3.6 million provision for loan losses. In keeping with our commitment to our shareholders, we continue to aggressively and proactively recognize potential problem loans and value those loans appropriately. The results for the six months ended June 30, 2010 were favorable compared to the same period last year, except for this provision.
Net interest income increased $1.4 million, or 24.3%, in the first six months of 2010 compared to the same period in 2009. Interest income increased $1.2 million primarily due to average loans growing $31.5 million or 10.3%. Interest on deposits declined a net $195 thousand as average interest bearing liabilities grew $39.2 million, or 12.4%, which increased interest expense $631 thousand; however, the cost of those liabilities declined 35 basis points reducing interest expense $826 thousand. The net interest margin increased to 3.26% for the six months ended June 30, 2010 from 2.93% in the same period ended June 30, 2009. Noninterest expense declined $736 thousand through the first six months 2010 compared to the same period in 2009. In 2009, a $570 thousand operating loss was recognized and the loss was partially recovered in 2010 resulting in a recovery of $450 thousand. Occupancy expenses increased $193 thousand primarily reflecting higher costs associated with a new branch opened in the fourth quarter of 2009. Expenses related to repossessed real estate and personal property increased $205 thousand.
As noted above, the Corporation has experienced declining credit quality in the second quarter of 2010 as exemplified by the $3.6 million addition to the allowance for loan losses. This deterioration was concentrated in only three commercial real estate loans totaling $14 million. It should be noted that Floridian Financial Group continues to outperform the median of all commercial banks based in the State of Florida as measured by non-performing assets2 as a percent of total assets. As of June 30, 2010, the Corporation’s non-performing assets as a percent of total assets was 1.1% compared to the median of 4.6% in the State of Florida. 1
The allowance for loan losses (“ALL”) at June 30, 2010 was $7.9 million or 2.37% of total loans. The ALL to total loans was 2.68% and 1.22% at December 31, 2009 and June 30, 2009, respectively. In the second quarter of 2010, we added $3.6 million to the allowance for loan losses compared to $423 thousand for the
_________________________
1 The Carson Medlin Company, Florida Asset Quality Review, Second Quarter 2010
2 Loans 90+ days past due, non-accrual loans and other real estate owned
same period last year. The addition to the ALL in the second quarter of 2010 was due to loss estimates associated with loans modified with below market terms and loans to small businesses experiencing financial difficulties. Net loan charge-offs for the quarter and year-to-date were $4.8 million, 5.6% of average loans, and $4.9 million, 2.9% of average loans, respectively.
Growth
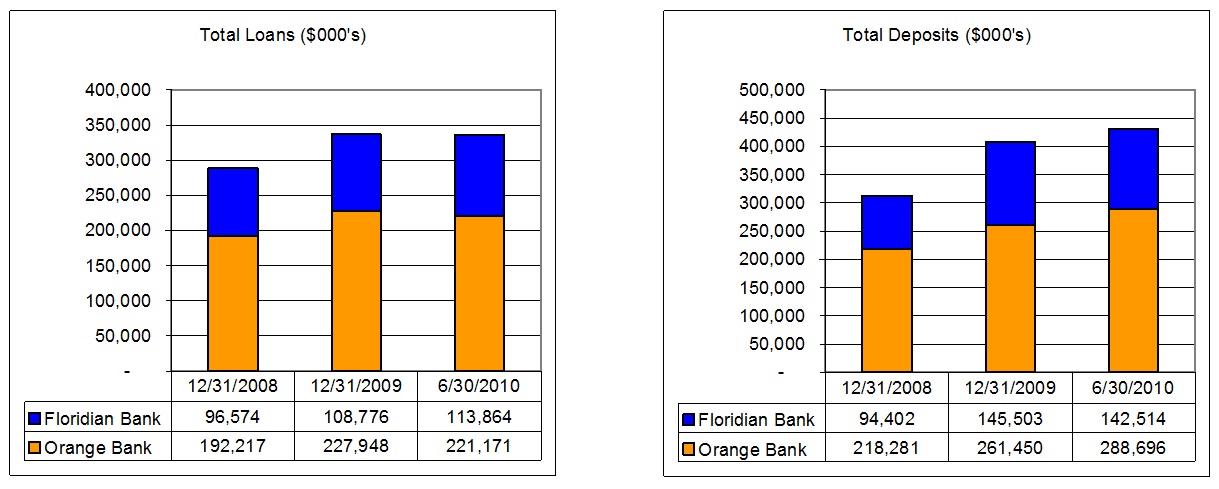
Total assets increased $37.5 million, or 8.3%, from $450.3 million at June 30, 2009 to $487.8 million at June 30, 2010. Loans increased $12.9 million, or 4.0%, from June 30, 2009. Residential mortgage loans increased $4.5 million, commercial real estate loans increased $17.0 million, and commercial loans decreased $7.0 million. Loans ended the quarter at $335.0 million, a decrease of $1.7 million compared to December 31, 2009. During the first half of 2010, the Corporation originated approximately $17.0 million in new loans, but experienced significant loan payoffs totaling approximately $14.3 million and also recorded loan charge-offs of $4.9 million.
Deposits were $431.1 million at June 30, 2010, up $53.5 million, or 14.2%, from June 30, 2009. Time deposits grew $53.9 million, demand deposit accounts increased $18.8 million and money market accounts decreased $19.1 million.
We believe these growth strategies are attributable to our outstanding staff, as well as the confidence our customers have in the Banks.
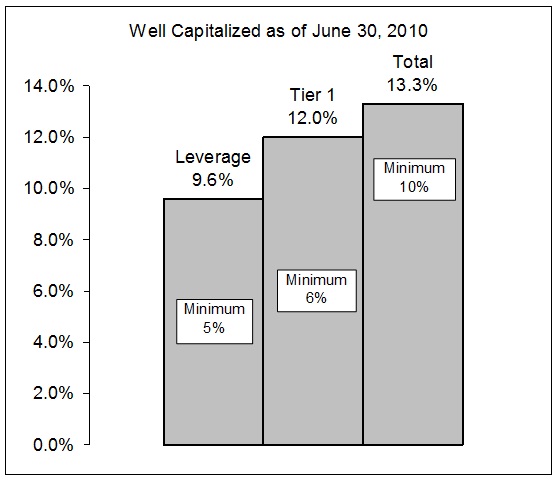
Capital Resources
At June 30, 2010 capital remains above all “well capitalized” regulatory measures as evidenced in the following table:
|
(millions) |
|
As of June 30, 2010 |
|
Well Capitalized |
||||
|
Total risk based capital |
|
$ |
50.4 |
|
|
$ |
38.0 |
|
|
Tier 1 capital |
|
$ |
45.6 |
|
|
$ |
22.8 |
|
|
Leverage capital |
|
$ |
45.6 |
|
|
$ |
23.9 |
|
The above regulatory measures have been the traditional benchmarks used in the industry. However, it is a fact that the regulatory bodies have raised the bar on capital adequacy measures as evidenced by the regulatory orders imposed on troubled banks. It is important to be aware of this phenomenon even for a healthy bank holding company such as Floridian Financial Group, which may be required to seek additional capital in the future. During the second quarter, our banks were examined by the regulators, and capital levels were determined to be adequate.
In closing, your management continues to focus on asset quality and improved operating results in the near term. We remain engaged with our customers as the economic downturn prolongs. The quality of our loan portfolio is being actively monitored as we work with small businesses faced with continuing economic uncertainty. While opportunities for new, good quality loans remain limited, we continue to identify lending opportunities as we leverage our banking team’s service driven reputation and knowledge of the marketplace. We expect improved operating results as we pursue smart loan growth and manage our deposit mix and deposit costs. Further, we have not lost sight of our long term strategy of affiliating with financial institutions of similar corporate cultures and welcome these opportunities as they arise.
We appreciate the shareholders who are customers that continue to expand their relationship with us. Each effort you take makes a positive impact on our earnings and on shareholder value.
Our People Make the Difference!
Thank you for your interest and support,
|
Charlie W. Brinkley, Jr. |
Thomas H. Dargan, Jr. |
|
Chairman/ CEO |
President |
2
Floridian Bank located in Volusia and Flagler Counties, Orange Bank of Florida operating in Orange, Seminole, Citrus and Lake Counties, along with Floridian Financial Mortgage headquartered in Orlando, are all the principal subsidiaries of Floridian Financial Group.
|
|
• |
Below are the Floridian Financial Group, Inc. results in graph form |
3
Floridian Financial Group, Inc.
Selected Financial Data
(Unaudited except for December 31, 2009 amounts)
(Dollars in thousands except per share amounts)
|
|
|
June 30, |
|
|
December 31, |
|
June 30, |
|
|||
|
Balance Sheet Data |
|
2010 |
|
|
2009 |
|
2009 |
|
|||
|
Total assets |
|
$ |
487,818 |
|
|
$ |
466,897 |
|
$ |
450,321 |
|
|
Loans, net of unearned fees |
|
$ |
335,035 |
|
|
$ |
336,724 |
|
$ |
322,143 |
|
|
Allowance for loan losses |
|
$ |
7,944 |
|
|
$ |
9,038 |
|
$ |
3,936 |
|
|
Securities available for sale |
|
$ |
65,755 |
|
|
$ |
81,707 |
|
$ |
69,846 |
|
|
Securities held to maturity |
|
$ |
10,156 |
|
|
$ |
12,259 |
|
$ |
12,363 |
|
|
Deposits |
|
$ |
431,091 |
|
|
$ |
406,652 |
|
$ |
377,553 |
|
|
Shareholders' equity |
|
$ |
48,192 |
|
|
$ |
50,483 |
|
$ |
58,842 |
|
|
|
|
|
|
|
|
|
|
|
|
|
|
|
Asset Quality Ratios |
|
|
|
|
|
|
|
|
|
|
|
|
Non-performing loans / total loans |
|
|
5.19 |
% |
|
|
2.85 |
% |
|
1.52 |
% |
|
Non-performing assets / total assets |
|
|
4.04 |
% |
|
|
2.70 |
% |
|
1.31 |
% |
|
Non-performing assets excluding non- |
|
|
|
|
|
|
|
|
|
|
|
|
performing restructured loans/total assets (2) |
|
|
1.11 |
% |
|
|
1.31 |
% |
|
1.31 |
% |
|
Allowance for loan losses / total loans |
|
|
2.37 |
% |
|
|
2.68 |
% |
|
1.22 |
% |
|
Net charge-offs (recoveries) / average loans |
|
|
2.93 |
%(1) |
|
|
1.73 |
% |
|
1.87 |
% |
|
|
|
|
|
|
|
|
|
|
|
|
|
|
Capital Ratios |
|
|
|
|
|
|
|
|
|
|
|
|
Equity / assets |
|
|
9.9 |
% |
|
|
10.8 |
% |
|
13.0 |
% |
|
Leverage |
|
|
9.6 |
% |
|
|
10.0 |
% |
|
12.8 |
% |
|
Tier 1 Risk-based |
|
|
12.0 |
% |
|
|
12.5 |
% |
|
14.7 |
% |
|
Total Risk-based |
|
|
13.3 |
% |
|
|
13.8 |
% |
|
15.7 |
% |
|
|
|
|
|
|
|
|
|
|
|
|
|
|
|
(1) |
Annualized |
|
|
(2) |
Ratio is an alternative measure of credit quality used in the banking industry |
4
|
|
For The Three Months Ended |
|
|||||||||
|
|
June 30, |
|
|||||||||
|
Income Statement Data |
2010 |
|
|
2009 |
|
|
Change |
|
|||
|
Interest income |
$ |
5,156 |
|
|
$ |
4,660 |
|
|
$ |
496 |
|
|
Interest expense |
|
1,541 |
|
|
|
1,622 |
|
|
|
(81 |
) |
|
Net interest income |
|
3,615 |
|
|
|
3,038 |
|
|
|
577 |
|
|
Provision for loan losses |
|
3,634 |
|
|
|
423 |
|
|
|
3,211 |
|
|
Non-interest income |
|
282 |
|
|
|
240 |
|
|
|
42 |
|
|
Non-interest expense |
|
3,625 |
|
|
|
4,205 |
|
|
|
(580 |
) |
|
Income tax expense (benefit) |
|
— |
|
|
|
— |
|
|
|
— |
|
|
Net income (loss) |
$ |
(3,362 |
) |
|
$ |
(1,350 |
) |
|
$ |
(2,012 |
) |
|
|
|
|
|
|
|
|
|
|
|
|
|
|
Per Share Data |
|
|
|
|
|
|
|
|
|
|
|
|
Basic earnings (loss) per share |
|
($0.54 |
) |
|
|
($0.22 |
) |
|
|
|
|
|
|
|
|
|
|
|
|
|
|
|
|
|
|
Selected Operating Ratios |
|
|
|
|
|
|
|
|
|
|
|
|
Return on average assets |
|
(2.81 |
%) |
|
|
(1.23 |
%) |
|
|
|
|
|
Return on average equity |
|
(26.41 |
%) |
|
|
(9.02 |
%) |
|
|
|
|
|
Yield on earning assets |
|
4.65 |
% |
|
|
4.74 |
% |
|
|
|
|
|
Cost of interest bearing liabilities |
|
1.75 |
% |
|
|
2.07 |
% |
|
|
|
|
|
Net interest margin |
|
3.26 |
% |
|
|
3.09 |
% |
|
|
|
|
|
|
For The Six Months Ended |
|
|||||||||
|
|
June 30, |
|
|||||||||
|
Income Statement Data |
2010 |
|
|
2009 |
|
|
Change |
|
|||
|
Interest income |
$ |
10,304 |
|
|
$ |
9,104 |
|
|
$ |
1,200 |
|
|
Interest expense |
$ |
3,175 |
|
|
|
3,370 |
|
|
|
(195 |
) |
|
Net interest income |
$ |
7,129 |
|
|
$ |
5,734 |
|
|
|
1,395 |
|
|
Provision for loan losses |
$ |
3,823 |
|
|
|
738 |
|
|
|
3,085 |
|
|
Non-interest income |
$ |
575 |
|
|
|
636 |
|
|
|
(61 |
) |
|
Non-interest expense |
$ |
6,954 |
|
|
|
7,690 |
|
|
|
(736 |
) |
|
Income tax expense (benefit) |
$ |
— |
|
|
|
— |
|
|
|
— |
|
|
Net income (loss) |
$ |
(3,073 |
) |
|
$ |
(2,058 |
) |
|
$ |
(1,015 |
) |
|
|
|
|
|
|
|
|
|
|
|
|
|
|
Per Share Data |
|
|
|
|
|
|
|
|
|
|
|
|
Basic earnings (loss) per share |
|
($0.50 |
) |
|
|
($0.33 |
) |
|
|
|
|
|
|
|
|
|
|
|
|
|
|
|
|
|
|
Selected Operating Ratios |
|
|
|
|
|
|
|
|
|
|
|
|
Return on average assets |
|
(1.29 |
%) |
|
|
(0.94 |
%) |
|
|
|
|
|
Return on average equity |
|
(12.14 |
%) |
|
|
(6.84 |
%) |
|
|
|
|
|
Yield on earning assets |
|
4.71 |
% |
|
|
4.66 |
% |
|
|
|
|
|
Cost of interest bearing liabilities |
|
1.80 |
% |
|
|
2.15 |
% |
|
|
|
|
|
Net interest margin |
|
3.26 |
% |
|
|
2.93 |
% |
|
|
|
|
5