Attached files
Table of Contents
UNITED STATES
SECURITIES AND EXCHANGE COMMISSION
Washington, DC 20549
Form 10-K
| þ | ANNUAL REPORT PURSUANT TO SECTION 13 OR 15(d) OF THE SECURITIES EXCHANGE ACT OF 1934 |
For the fiscal year ended July 31, 2010
OR
| ¨ | TRANSITION REPORT PURSUANT TO SECTION 13 OR 15(d) OF THE SECURITIES EXCHANGE ACT OF 1934 |
For the transition period from to
Commission File Number 0-6715
Analogic Corporation
(Exact name of registrant as specified in its charter)
| Massachusetts | 04-2454372 | |
| (State or other jurisdiction of incorporation or organization) |
(I.R.S. Employer Identification No.) | |
| 8 Centennial Drive, Peabody, Massachusetts | 01960 | |
| (Address of principal executive offices) | (Zip Code) | |
(978) 326-4000
(Registrant’s telephone number, including area code)
Securities registered pursuant to Section 12(b) of the Act:
| Title of Each Class |
Name of Each Exchange on Which Registered | |
| Common Stock, $.05 par value | NASDAQ Global Select Market |
Securities registered pursuant to Section 12(g) of the Act:
None
Indicate by check mark if the registrant is a well-known seasoned issuer, as defined in Rule 405 of the Securities Act. Yes ¨ No þ
Indicate by check mark if the registrant is not required to file report pursuant to Section 13 or Section 15(d) of the Act. Yes ¨ No þ
Indicate by check mark whether the registrant (1) has filed all reports required to be filed by Section 13 or 15(d) of the Securities Exchange Act of 1934 during the preceding 12 months (or for such shorter period that the registrant was required to file such reports), and (2) has been subject to such filing requirements for the past 90 days. Yes þ No ¨
Indicate by check mark whether the registrant has submitted electronically and posted on its corporate Web site, if any, every Interactive Data File required to be submitted and posted pursuant to Rule 405 of Regulation S-T during the preceding 12 months (or for such shorter period that the registrant was required to submit and post such files). Yes ¨ No ¨
Indicate by check mark if disclosure of delinquent filers pursuant to Item 405 of Regulation S-K is not contained herein, and will not be contained, to the best of registrant’s knowledge, in definitive proxy or information statements incorporated by reference in Part III of this Form 10-K or any amendment to this Form 10-K. ¨
Indicate by check mark whether the registrant is a large accelerated filer, an accelerated filer, a non-accelerated filer, or a smaller reporting company. See the definitions of “large accelerated filer”, “accelerated filer”, and “smaller reporting company” in Rule 12b-2 of the Exchange Act.
| Large accelerated filer ¨ |
Accelerated filer þ | |||||
| Non-accelerated filer ¨ (Do not check if a smaller reporting company) | Smaller reporting company ¨ | |||||
Indicate by check mark whether the registrant is a shell company (as defined in Rule 12b-2 of the Exchange Act.) Yes ¨ No þ
The aggregate market value of the registrant’s common stock held by non-affiliates of the registrant at January 31, 2010 was approximately $515,577,000. As of September 15, 2010, there were 12,882,910 shares of common stock outstanding.
DOCUMENTS INCORPORATED BY REFERENCE:
Portions of the registrant’s definitive proxy statement, which will be issued in connection with the 2011 Annual Meeting of Stockholders, are incorporated by reference in Part III of this Annual Report on Form 10-K.
Table of Contents
Table of Contents
| Item 1. | Business |
Throughout this Annual Report on Form 10-K, unless the context states otherwise, the words “we,” “us,” “our” and “Analogic” refer to Analogic Corporation and all of its subsidiaries taken as a whole, and “our board of directors” refers to the board of directors of Analogic Corporation. All dollar amounts in this Item 1 are in thousands.
Available Information
Our website address is www.analogic.com. The information on our website is not incorporated by reference into this document and should not be considered to be a part of this document. Our website address is included in this document as an inactive textual reference only.
We make available free of charge through our website our Annual Report on Form 10-K, Quarterly Reports on Form 10-Q, Current Reports on Form 8-K, and amendments to the reports as soon as reasonably practicable after we electronically file such material with, or furnish such material to, the Securities and Exchange Commission (“SEC”).
Description of Business
Analogic is a high technology company that designs and manufactures advanced medical imaging and security systems and subsystems sold to Original Equipment Manufacturers (“OEMs”) and end users primarily in the healthcare and airport security markets. We were incorporated in the Commonwealth of Massachusetts in November 1967 and are recognized worldwide for advancing state-of-the-art technology in the areas of medical Computed Tomography (“CT”), Magnetic Resonance Imaging (“MRI”), Digital Mammography, Specialized Ultrasound, and Automatic Explosives Detection Systems (“EDS”) for airport security.
Our OEM customers incorporate our technology into systems they in turn sell for various medical and security applications. We also sell our ultrasound products directly into specialized clinical end-user markets through our direct worldwide sales force under the brand name B-K Medical (“B-K Medical”).
We operate primarily within two major markets: Medical Technology and Security Technology. Our Medical Technology business consists of three reporting segments:
| • | CT and MRI, which primarily includes electronic systems and subsystems for CT and MRI medical imaging equipment; |
| • | Specialized Ultrasound, which designs, manufactures, and distributes ultrasound systems and probes in the urology, ultrasound-guided surgery, anesthesia and general radiology markets; and |
| • | Digital Radiography, which consists primarily of state-of-the-art, direct conversion amorphous selenium-based, digital, flat-panel, x-ray detectors for diagnostic and interventional applications in mammography. |
Our Security Technology business consists of advanced explosives and weapons detection systems for aviation security.
2
Table of Contents
See Note 17 to the Notes to Consolidated Financial Statements included in this Annual Report on Form 10-K for financial information regarding our segments. The following chart shows net revenue by segment for the fiscal year ended July 31, 2010 (“fiscal year 2010”):
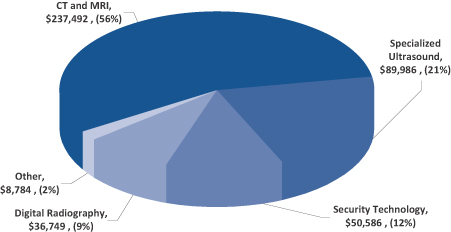
CT and MRI
Our CT and MRI business, which accounted for approximately 56% of our net revenue in fiscal year 2010, consists primarily of electronic systems and subsystems for medical imaging, sold globally to OEM producers of CT, MRI, and Ultrasound equipment.
We are an industry leader in the development and sale of CT x-ray detectors, data acquisition systems (“DAS”), data management systems (“DMS”) and integrated gantries that become part of OEM CT imaging systems around the world. Our detection and DAS subsystems convert x-ray energy to useful digital signals for the generation of anatomical images for medical diagnostics and disease treatment. The detector, DAS and DMS products we sell range from low slice count sub-systems to the most advanced multi-slice (>256 slices) systems enabling advanced diagnostics such as cardiac imaging. Our CT products are designed to allow our customers to remain at the forefront of this rapidly advancing field. Leveraging our experience in integrating CT components and technology, we have also developed higher-level integrated systems for the radiotherapy market primarily used for image guided radiation treatment of cancerous tumors.
For OEM producers of MRI equipment, we supply MRI power products that include Radio Frequency (“RF”) and gradient amplifiers. These amplifiers are key components in MRI systems and provide power to the magnetic coils. We have developed a wide range of amplifier solutions for our customers ranging from low-magnetic-field systems (< 0.3 Tesla) to ultra high-field systems (> 7.0 Tesla) designed for academic research hospitals.
We also design and manufacture precision motion control systems, which we supply to OEM customers for use in computer-controlled automation systems primarily in the semiconductor and medical markets.
Specialized Ultrasound
Our Specialized Ultrasound business, which designs and manufactures ultrasound systems and probes for specialized end-user markets in urology, surgery, anesthesia as well as radiology, accounted for approximately 21% of our net revenue in fiscal year 2010. Our ultrasound scanners use acoustic waves to generate real-time images of the internal anatomy that are used for medical diagnostic and interventional procedures. These ultrasound systems are also used for guiding surgical procedures and for guiding prostate cancer treatment employing a procedure called brachytherapy.
3
Table of Contents
In fiscal year 2009, we introduced a new family of ultrasound scanners called the Flex Focus, under the brand name B-K Medical, and in fiscal year 2010 introduced the Flex Focus 400 Anesthesia, particularly suited for guiding the placement of nerve blocks prior to surgical procedures. The Flex Focus system has a unique award winning design in a small footprint that can be easily moved from room to room in a hospital. With its large 19” screen and high resolution imaging engine, the Flex Focus provides a unique solution in the mobile ultrasound market. This system is a portable unit that can be used for multiple applications in a variety of settings. Our B-K Medical business operates primarily on a direct sales basis in Europe and the U.S, and with a network of independent distributors worldwide.
Digital Radiography
Our Digital Radiography products accounted for approximately 9% of our net revenue in fiscal year 2010. Digital Radiography products consist primarily of digital mammography Selenium based x-ray detectors manufactured and sold through our ANRAD Corporation (“Anrad”) subsidiary, which sells directly to OEM customers for diagnostic and interventional applications in mammography. These x-ray detector plates are used by OEMs in mammography systems to convert x-ray signals into high resolution 2-D as well as 3-D images of the breast tissues to aid in the diagnosis of breast cancer. Currently, the detectors plates for mammography applications are sold to medical OEMs for use in products sold outside of the U.S. Our largest customer in this business is currently awaiting U.S Food and Drug Administration (“FDA”) approval for its products to be sold in the U.S.
Security Technology
Our Security Technology business, which provides advanced explosives and weapons detection systems for aviation security, accounted for approximately 12% of our net revenue in fiscal year 2010. Utilizing our medical CT technology, we design and manufacture EDS for airport security for both checked bag and checkpoint applications. These systems generate data for three-dimensional images of objects contained within a piece of baggage. The EDS for checked baggage is marketed by L-3 Communications Corporation (“L-3”) under the eXaminer product family name. In 2010, we signed an agreement with Smiths Detection (“Smiths”), based in London, England, to develop advanced imaging subsystems for use in a next-generation explosives detection system to be manufactured and marketed by Smiths. The agreement provides for Smiths Detection to fund the engineering development over a period of approximately two years.
The eXaminer product family is sold to the U.S. Federal Government for installation at major U.S. airports to scan checked baggage and to international airport security authorities for installation at airports in Europe, Asia, and Central America.
Other
Other, which consists primarily of our hotel business and general corporate income and expenses, accounted for approximately 2% of our net revenue in fiscal year 2010. We own a hotel, managed for us under a contract with Marriott Corporation, which is located on approximately 7.5 acres of land adjacent to our principal executive offices and manufacturing facility in Peabody, Massachusetts. The facility is strategically situated in an industrial park and is in close proximity to the historic and tourist area of Boston’s North Shore, approximately 18 miles from Boston. It has 256 guest rooms, a ballroom, several function rooms, and recreational facilities.
Competition
We are subject to competition based upon product design, performance, pricing, quality, and service. We believe that our innovative engineering and product reliability have been important factors in our historical growth. While we try to maintain competitive pricing on those products that are directly comparable to products manufactured by others, in many instances, our products conform to more exacting specifications and carry a higher price than analogous products manufactured by others.
4
Table of Contents
Our CT and MRI systems are customized for the needs of our customers. We consider selection by our OEM customers for the design and manufacture of these products and our other medical products to be due more to the “make-or-buy” decision of the individual OEM customers rather than a function of other competitors in the field. Many OEM customers and potential OEM customers of ours have the capacity to design and manufacture these products for themselves. In our area of expertise, the continued signing of new contracts indicates strength in our relationships with our major customers.
Our primary competitors in the security market for CT-level explosives detection are dominated by divisions of a small number of large companies, our customer, L-3, Safran Morpho (formerly GE’s security business), and Science Applications International Corp., which acquired Reveal Imaging Technologies in August 2010.
Our Specialized Ultrasound business participates in niche markets primarily focused in urology and image guided surgery. We compete in these specialized markets based on image quality, ease of use, mobility, reliability and flexibility with a variety of ultrasound probes. Our competitors are primarily smaller companies focused in these niche areas and small business units of larger medical device companies.
Marketing and Distribution
Our CT and MRI, Digital Radiography, and Security Technology businesses, which currently only sell to OEM customers, sell products domestically and abroad directly primarily through our headquarters in the United States. Products are sold through our subsidiaries in Europe, Canada, and the United States, and on occasion through a network of our independent sales representatives and distributors located around the world.
B-K Medical distributes its products to end users globally both through a direct sales force and through independent distributors. B-K Medical’s subsidiaries, which accounted for 78% of the B-K Medical revenues in fiscal year 2010 generated from product sales, service and application support, are present in the main markets including United States, Germany, Benelux, United Kingdom, Italy, and Scandinavia. B-K Medical’s remaining revenue is generated through a network of non-exclusive, specialized independent distributors in more than 50 other countries.
Seasonal Aspect of Business
There are no material seasonal elements to our business, although plant closings in the summer, particularly in Europe, tend to decrease the procurement activities of certain customers during the first quarter of our fiscal year. In addition, many of our Medical Technology customers tend to purchase more products during the last two months of the calendar year, which falls within the second quarter of our fiscal year.
Material Customers
We had three customers, as set forth in the table below, who accounted for 10% or more of our net product and engineering revenue during fiscal year 2010, the fiscal year ended July 31, 2009 (“fiscal year 2009”), or the fiscal year ended July 31, 2008 (“fiscal year 2008”).
| Year Ended July 31, | |||||||||
| 2010 | 2009 | 2008 | |||||||
| Koninklijke Philips Electronics N.V. (“Philips”) |
15 | % | 15 | % | * | ||||
| Toshiba Corporation (“Toshiba”) |
12 | % | 14 | % | 17 | % | |||
| L-3 Communications Corporation (“L-3”) |
* | 11 | % | 11 | % | ||||
Note (*): Total net product and engineering revenue was less than 10% in this fiscal year.
5
Table of Contents
Philips’s product and engineering revenue are in the CT and MRI segment, Toshiba’s product and engineering revenue are in the CT and MRI and Digital Radiography segments, and L-3’s product and engineering revenue are in the Security Technology segment.
Our ten largest customers as a group accounted for 66%, 67%, and 67% of our net product and engineering revenue for fiscal years 2010, 2009, and 2008, respectively. Loss of any one of these customers would have a material adverse effect on our business. Philips accounted for 16% and 12%, respectively, of net accounts receivable at July 31, 2010 and 2009, respectively, and L-3 accounted for 13% of net accounts receivable at July 31, 2010 and 2009.
Backlog
Our OEM business involves large customers whose placement of large orders can vary based on timing. Our backlog, which consists of cancellable and non-cancellable orders that are expected to ship primarily within the next 12 months, was $119,105 at July 31, 2010 as compared to $78,434 at July 31, 2009. The increase in backlog of $40,671 was due primarily to increased backlog of $21,995 and $7,824 in CT and MRI and Security Technology. The increase in demand for CT and MRI was due primarily to the improving economy. Also contributing to the increase in CT and MRI was the transition to maintain consignment inventories for some of our OEM customers during fiscal year 2009 that reduced backlog at July 31, 2009. The increase in backlog for Security Technology was due primarily to an engineering project that began in December 2009 for an OEM customer.
Government Contracts
We do a significant amount of business with agencies of the Federal Government, either directly or as a subcontractor. Our contracts with government agencies, and the government contracts of other parties under which we serve as a subcontractor, are subject to termination at the election of the government agency. While none of our government contracts or subcontracts provide for renegotiation of profits at the election of the Government, it is possible that the government agency could request, and that we could under certain circumstances agree to, the renegotiation of the payments provided for under such contracts. However, we have not in the past renegotiated significant payment terms under our government contracts or subcontracts.
Sources of Raw Materials and Components
In general, our products are composed of internally-designed electronic and mechanical elements, including proprietary integrated circuits, printed circuit boards, detectors, power supplies, and displays manufactured by us and others in accordance with our specifications. We believe that items procured from third-party suppliers are available from more than one source. However, it might become necessary, if a given component ceases to be available, for us to modify a product design to adapt to a substitute component, or to purchase new tooling to enable a new supplier to manufacture the component, either of which could result in additional expense and/or delay in product sales. Also, from time to time the availability of certain electronic components has been disrupted. Accordingly, we carry a safety stock of raw materials and components in an effort to ensure our ability to make timely delivery to our customers.
In fiscal year 2010, there were capacity constraints in the components industry that were driven by the economic downturn. As economic conditions improved, the subsequent demand increase caused material shortages that added expediting costs. This impacted manufacturing efficiencies when meeting customer demand. As the market stabilizes, we may see improvement in the component market, but this is as yet unseen.
Patents and Licenses
We hold patents of varying duration issued in the United States, which cover technologies that we have developed. In many instances, we hold corresponding foreign patents. We regularly file U.S. patent applications
6
Table of Contents
and, where appropriate, foreign patent applications. We also file continuations to cover both new and improved methods, apparatus, processes, designs, and products.
We also rely on a combination of trade secret, copyright, and trademark laws, as well as contractual agreements to safeguard our proprietary rights in technology and products. In seeking to limit access to sensitive information to the greatest practical extent, we routinely enter into confidentiality and assignment of invention agreements with each of our employees, and confidentiality agreements with our key customers and vendors.
We believe that any legal protection afforded by patent and copyright laws is of secondary importance as a factor in our ability to compete. Future prospects are more a function of the continuing level of excellence and creativity of our engineers in developing products that satisfy customer needs, and the marketing skills and managerial competence of our personnel in selling those products. Moreover, we believe that market positioning and rapid market entry are important to the success of our products. Management is of the opinion that the loss of patent protection would not have a material effect on our competitive position.
Research and Product Development
Research and product development (“R&D”) is a significant element of our business. We maintain a constant and comprehensive R&D program directed toward the creation of new products, the improvement and refinement of our present products, and the expansion of their applications. Certain R&D projects are funded by our OEM customers and such funding is generally treated as engineering revenue, with the associated costs classified as engineering cost of sales. The cost of internally-funded R&D efforts are included within operating expenses.
The cost of internally-funded R&D, included in operating expenses, amounted to $49,150 in fiscal year 2010, $45,276 in fiscal year 2009, and $48,947 in fiscal year 2008. The cost of customer-funded R&D, which is classified as engineering cost of sales, amounted to $18,566 in fiscal year 2010, $21,398 in fiscal year 2009, and $14,480 in fiscal year 2008.
We capitalized $461 and $1,672 in fiscal year 2010 and fiscal year 2009, respectively, of computer software testing and coding costs incurred after technological feasibility was established. These costs are amortized into product cost of sales using a straight-line method over the estimated economic life of the related products, generally three years.
Environment
Our manufacturing facilities are subject to numerous environmental laws and regulations, particularly with respect to industrial waste and emissions. Compliance with these laws and regulations has not had a material impact on our capital expenditures, earnings, or competitive position.
Employees
As of July 31, 2010, we employed approximately 1,400 employees.
Financial Information about Foreign and Domestic Operations and Export Revenue
Our domestic and foreign revenues were $327,598, or 77% of total revenues, and $95,999, or 23% of total revenues, respectively, in fiscal year 2010 as compared to $309,885, or 78%, and $86,264, or 22%, respectively, in fiscal year 2009, and $327,181, or 79%, and $86,328, or 21%, respectively, in fiscal year 2008.
7
Table of Contents
| Item 1A. | Risk Factors |
This Annual Report on Form 10-K contains statements, which, to the extent that they are not a recitation of historical facts, constitute “forward-looking statements” pursuant to the safe harbor provisions of the Private Securities Litigation Reform Act of 1995. Investors are cautioned that all forward-looking statements, including without limitation, statements about product development, market and industry trends, strategic initiatives, regulatory approvals, sales, profits, expenses, price trends, research and development expenses and trends, and capital expenditures, involve risk and uncertainties, and actual events and results may differ significantly from those indicated in any forward-looking statement as a result of a number of important factors, including those discussed below and elsewhere in this Form 10-K. In some cases these forward-looking statements can be identified by the use of words such as “may,” “will,” “could,” “should,” “would,” “expect,” “project,” “predict,” “potential” or the negative of these words or comparable words.
You should carefully consider the risks described below before making an investment decision with respect to our common stock. Additional risks not presently known to us, or that we currently deem immaterial, may also impair our business. Any of these could have a material and negative effect on our business, financial condition, or results of operations.
Because a significant portion of our revenue currently comes from a small number of customers, any decrease in revenue from these customers could harm our operating results.
We depend on a small number of customers for a large portion of our business, and changes in our customers’ orders could have a significant impact on our operating results. If a major customer significantly reduces the amount of business it does with us, there would be an adverse impact on our operating results.
We had three customers, as set forth in the table below, who accounted for 10% or more of our net product and engineering revenue during fiscal years 2010, 2009, or 2008.
| Year Ended July 31, | |||||||||
| 2010 | 2009 | 2008 | |||||||
| Philips |
15 | % | 15 | % | * | ||||
| Toshiba |
12 | % | 14 | % | 17 | % | |||
| L-3 |
* | 11 | % | 11 | % | ||||
Note (*): Total net product and engineering revenue was less than 10% in this fiscal year.
Our ten largest customers as a group accounted for 66%, 67%, and 67% of our net product and engineering revenue for fiscal years 2010, 2009, and 2008, respectively. Philips accounted for 16% and 12%, respectively, of net accounts receivable at July 31, 2010 and 2009, respectively, and L-3 accounted for 13% of net accounts receivable at July 31, 2010 and 2009.
Although we seek to broaden our customer base, we will continue to depend on sales to a relatively small number of major customers. Because it often takes significant time to replace lost business, it is likely that our operating results would be adversely affected if one or more of our major customers were to cancel, delay, or reduce significant orders in the future. Our customer agreements typically permit the customer to discontinue future purchases after timely notice.
In addition, we generate significant accounts receivable in connection with the products we sell and the services we provide to our major customers. Although our major customers are large corporations, if one or more of our customers were to become insolvent or otherwise be unable to pay for our products and services, our operating results and financial condition could be adversely affected.
8
Table of Contents
Competition from existing or new companies in the medical and security imaging technology industry could cause us to experience downward pressure on prices, fewer customer orders, reduced margins, the inability to take advantage of new business opportunities, and the loss of market share.
We operate in a highly competitive industry. We are subject to competition based on product design, performance, pricing, quality, and service offerings, and we believe our innovative engineering and product reliability have been important factors in our historical growth. While we try to maintain competitive pricing on those products which are directly comparable to products manufactured by others, in many instances our products conform to more exacting specifications and may carry a higher price than analogous products manufactured by others.
Our competitors include divisions of larger, more diversified organizations as well as specialized companies. Some of them have greater resources and larger staffs than we have. Many of our existing and potential OEM customers have the ability to design and manufacture internally the products that we manufacture for them. We face competition from the research and product development groups and manufacturing operations of our existing and potential customers, who continually compare the benefits of internal research, product development, and manufacturing with the costs and benefits of outsourcing.
We depend on our suppliers, some of which are the sole-source for certain components, and our production could be substantially curtailed if these suppliers were not able to meet our demands and alternative sources were not available.
We order raw materials and components to complete our customers’ orders, and some of these raw materials and components are ordered from sole-source suppliers. Although we work with our customers and suppliers to minimize the impact of shortages in raw materials and components, we sometimes experience short-term adverse effects due to price fluctuations and delayed shipments. In the past, there have been industry-wide shortages of electronics components. If a significant shortage of raw materials or components were to occur, we might have to delay shipments or pay premium pricing, which could adversely affect our operating results. In some cases, supply shortages of particular components could substantially curtail our production of products using these components. We are not always able to pass on price increases to our customers. Accordingly, some raw material and component price increases could adversely affect our operating results. We also depend on a small number of suppliers to provide many of the other raw materials and components that we use in our business. Some of these suppliers are affiliated with customers or competitors, and others are small companies. If we were unable to continue to purchase these raw materials and components from our suppliers, our operating results could be adversely affected. Because many of our costs are fixed, our margins depend on the volume of output at our facilities, and a reduction in volume could adversely affect our margins.
We rely on successful performance by and relationships with subcontractors. This reliance could have a material adverse effect on our results of operations and financial condition.
We have formed arrangements with subcontractors for various services and components. We have formed these arrangements because it is commercially more efficient to outsource these services and purchase these components than it would be for us to perform or manufacture these services and components, which in some cases require, among other things, a high degree of technical skill and advanced equipment that is not practical or cost-effective for us to develop or acquire. As a result, if one of our subcontractors were to experience quality problems, capacity constraints, decreased yields, or delivery delays, or were to raise prices significantly, we could face product liability claims, product shortages, decreased revenues or lost customers, which could adversely affect our operating results.
If we were to be left with excess inventory, our operating results could be adversely affected.
Because of long lead times and specialized product designs, in certain cases we purchase components and manufacture products in anticipation of customer orders based on customer forecasts. For a variety of reasons,
9
Table of Contents
such as decreased end-user demand for our products, our customers might not purchase all the products that we have manufactured or for which we have purchased components. In either event, we would attempt to recoup material and manufacturing costs by means such as returning components to our vendors, disposing of excess inventory through other channels, or requiring our OEM customers to purchase or otherwise compensate us for such excess inventory. Some of our significant customer agreements do not give us the ability to require our OEM customers to do this. To the extent that we were unsuccessful in recouping our material and manufacturing costs, our net sales and operating results could be adversely affected. Moreover, carrying excess inventory would reduce the working capital we have available to continue to operate and grow our business.
Uncertainties and adverse trends affecting our industry or any of our major customers could adversely affect our operating results.
Our business operates primarily within two major markets within the electronics industry, Medical Technology and Security Technology. These markets are subject to rapid technological change and pricing and margin pressure and have historically been cyclical and subject to significant downturns characterized by diminished product demand, rapid declines in average selling prices, and production over-capacity. In addition, changes in government policy relating to reimbursement for the purchase or use of medical and security-related capital equipment could also affect our sales. Our customers’ markets are also subject to economic cycles and are likely to experience recessionary periods in the future. The economic conditions affecting our industry in general, or any of our major customers in particular, might adversely affect our operating results. Our other businesses are subject to the same or greater technological and cyclical pressures.
In Security Technology, our OEM customers’ purchasing dynamics are generally affected by the level of government funding, the expansion of airport terminals and the fluctuations in airline passenger volume.
Our customers’ delay in obtaining or inability to obtain any necessary United States or foreign regulatory clearances or approvals for their products could have a material adverse effect on our business.
Our products are used by a number of our customers in the production of medical devices that are subject to a high level of regulatory oversight. A delay in obtaining or inability to obtain any necessary United States or foreign regulatory clearances or approvals for products could have a material adverse effect on our business. The process of obtaining clearances and approvals can be costly and time-consuming. There is a further risk that any approvals or clearances, once obtained, might be withdrawn or modified. Medical devices cannot be marketed in the United States without clearance from the FDA. Medical devices sold in the United States must also be manufactured in compliance with FDA rules and regulations, which regulate the design, manufacturing, packing, storage, and installation of medical devices. Moreover, medical devices are required to comply with FDA regulations relating to investigational research and labeling. States may also regulate the manufacturing, sale, and use of medical devices. Medical devices are also subject to approval and regulation by foreign regulatory and safety agencies.
Our business strategy involves the pursuit of acquisitions or business combinations, which, if consummated, could be difficult to integrate, disrupt our business, dilute stockholder value, or divert management attention.
As part of our business strategy, we might seek attractive acquisitions and other business combinations. Acquisitions are typically accompanied by a number of risks, including the difficulty of integrating the operations and personnel of the acquired companies, the potential disruption of our ongoing business and distraction of management, expenses related to the acquisition, and potential unknown or underestimated liabilities associated with acquired businesses. If we do not successfully complete acquisitions that we pursue in the future, we could incur substantial expenses and devote significant management time and resources without generating any benefit to us. In addition, substantial portions of our available cash might be utilized as consideration for these acquisitions.
10
Table of Contents
Our annual and quarterly operating results are subject to fluctuations, which could affect the market price of our common stock.
Our annual and quarterly results could vary significantly depending on various factors, many of which are beyond our control, and may not meet the expectations of securities analysts or investors. If this occurs, the price of our common stock could decline. These factors include:
| • | variations in the timing and volume of customer orders relative to our manufacturing capacity; |
| • | introduction and market acceptance of our customers’ new products; |
| • | changes in demand for our customers’ existing products; |
| • | the timing of our expenditures in anticipation of future orders; |
| • | effectiveness in managing our manufacturing processes; |
| • | changes in competitive and economic conditions generally or in our customers’ markets; |
| • | changes in the cost or availability of components or skilled labor; |
| • | changes in our effective tax rate; |
| • | fluctuations in manufacturing yields; |
| • | foreign currency exposure; and |
| • | investor and analyst perceptions of events affecting us, our competitors, and/or our industry. |
A delay in anticipated sales could result in the deferral of the associated revenue beyond the end of a particular quarter, which would have a significant effect on our operating results for that quarter. In addition, most of our operating expenses do not vary directly with net revenue and are difficult to adjust in the short term. As a result, if revenue for a particular quarter was below our expectations, we could not proportionately reduce operating expenses for that quarter. Hence, the revenue shortfall could have a disproportionate adverse effect on our operating results for that quarter.
Loss of any of our key personnel could hurt our business because of their industry experience and their technological expertise.
We operate in a highly competitive industry and depend on the services of our key senior executives and our technological experts. The loss of the services of one or several of our key employees or an inability to attract, train, and retain qualified and skilled employees, specifically engineering and operations personnel, could result in the loss of customers or otherwise inhibit our ability to operate and grow our business successfully.
If we are unable to maintain our expertise in research and product development, manufacturing processes, and marketing new products, we might not be able to compete successfully.
We believe that our future success depends upon our ability to provide research and product development, provide manufacturing services that meet the changing needs of our customers, and market new products. This requires that we successfully anticipate and respond to technological changes in design and manufacturing processes in a cost-effective and timely manner. As a result, we continually evaluate the advantages and feasibility of new product designs and manufacturing processes. We may not be able to develop and introduce new and improved products in a timely or efficient manner, and new and improved products, if developed, may not achieve market acceptance.
Major terrorist attacks and threats have increased financial expectations that may not materialize.
Major terrorist attacks and threats have created increased interest in our security and inspection systems. However, the level of demand for our products is not predictable and may vary over time. We do not know what solutions will continue to be adopted by the U.S. Department of Homeland Security as a result of terrorism and
11
Table of Contents
whether our products will continue to be a part of the solutions. Additionally, should our products be considered as a part of the future security solution, it is unclear what the level of purchases may be and how quickly funding to purchase our products may be made available. These factors could adversely impact us and create unpredictability in our revenues and operating results.
We are exposed to risks associated with international operations and markets.
We market, manufacture, and sell products in international markets, and have established offices and subsidiaries in Europe, Canada, and China. Net revenue outside the United States accounted for 23%, 22%, and 21% of our total revenue for fiscal years 2010, 2009, and 2008, respectively. From our U.S. operations, we also ship directly to customers in Europe and Asia, for which shipments accounted for 42%, 40%, and 29% of our total net revenue for fiscal years 2010, 2009, and 2008, respectively. There are inherent risks in transacting business internationally, including:
| • | changes in applicable laws and regulatory requirements; |
| • | export and import restrictions; |
| • | export controls relating to technology; |
| • | tariffs and other trade barriers; |
| • | intellectual property laws that offer less protection for our proprietary rights; |
| • | difficulties in staffing and managing foreign operations; |
| • | longer payment cycles; |
| • | problems in collecting accounts receivable; |
| • | political instability; |
| • | fluctuations in currency exchange rates; |
| • | expatriation controls; and |
| • | potential adverse tax consequences. |
Any one or more of these factors may have a material adverse effect on our future international activities and, consequently, on our business and results of operations.
If we become subject to intellectual property infringement claims, we could incur significant expenses and could be prevented from selling specific products.
We may become subject to claims that we infringe the intellectual property rights of others in the future. We cannot ensure that, if made, these claims will not be successful. Any claim of infringement could cause us to incur substantial costs defending against the claim even if the claim is invalid, and could distract management from other business. Any judgment against us could require substantial payment in damages and could also include an injunction or other court order that could prevent us from offering certain products.
If operators of our security and inspection systems fail to detect weapons, explosives or other devices that are used to commit a terrorist act, we could be exposed to product liability and related claims for which we may not have adequate insurance coverage.
Our business exposes us to potential product liability risks that are inherent in the development, manufacturing, sale and service of security inspection systems. Our customers use our security and inspection systems to help them detect items that could be used in performing terrorist acts or other crimes. The training, reliability and competence of the customer’s operators are crucial to the detection of suspicious items. In addition, our security and inspection systems are not designed to work under all circumstances. We test the reliability of our security and inspection systems during both their development and manufacturing phases. We
12
Table of Contents
also perform such tests if we are requested to perform installation, warranty or post-warranty servicing. However, our security inspection systems are advanced mechanical and electronic devices and therefore can malfunction.
As a result of the September 11, 2001, and 1993 World Trade Center terrorist attacks, and the potential for future attacks, product liability insurance coverage for such threats is extremely difficult and costly to obtain. It is possible, subject to the applicability of the Support Anti-terrorism by Fostering Effective Technologies Act of 2002 (the “SAFETY Act”), that if we were found liable following a major act of terrorism, our insurance might not fully cover the claims for damages.
The SAFETY Act is a Federal law enacted to provide certain legal liability protections for providers of certain anti-terrorism technologies. If applicable to claims against Analogic, the SAFETY Act could mitigate some of this risk.
Our security and inspections systems business depends in part on purchases of products and services by the U.S. Federal Government and its agencies, which purchases may be only partially funded, and are subject to potential termination and reductions and delays in government spending.
Sales of our security and inspection systems, in some cases as an indirect subcontractor or team member with prime contractors and in other cases directly to the U.S. Government and its agencies, accounted for approximately 12% of our total net revenue in each of fiscal years 2010, 2009, and 2008, respectively. Our security and inspection systems are included in many different domestic programs. Over the lifetime of a program, the award of many different individual contracts and subcontracts could impact our products’ requirements. The funding of U.S. Government programs is subject to Congressional appropriations. Although multiple-year contracts may be planned in connection with major procurements, Congress generally appropriates funds only on a single fiscal year basis. Consequently, programs are often only partially funded initially, and additional funds are committed only as Congress makes further appropriations and prime contracts receive such funding. The reduction or delay in funding or termination of a government program in which we are involved could result in a loss of or delay in receiving anticipated future revenues attributable to that program and contracts or orders received. The U.S. Government could reduce or terminate a prime contract under which we are a subcontractor or team member irrespective of the quality of our products or services. The termination of a program or delays in the reduction in or failure to commit additional funds to a program in which we are involved could negatively impact our revenue and have a material adverse effect on our financial condition and results of operations.
Changes in laws affecting the health care industry could adversely affect our business, operations and financial condition.
In recent years, the healthcare industry has undergone significant changes driven by various efforts to reduce costs, including increased levels of managed care, cuts in Medicare, consolidation of healthcare distribution companies and collective purchasing arrangements by office-based healthcare practitioners. In addition, numerous governments have undertaken efforts to control healthcare costs through legislation and regulation. In the United States, the Federal government recently passed comprehensive healthcare reform legislation. Many of the details regarding the implementation of this legislation are yet to be determined and we currently cannot predict whether or to what extent such implementation or adoption of reforms may affect our business. We anticipate that the current administration, Congress and certain state legislatures will continue to review and assess alternative healthcare delivery systems and payment methods with an objective of ultimately reducing healthcare costs and expanding access. Public debate of these issues will likely continue in the future. The implementation of health care reform and medical cost containment measures in the United States and in foreign countries in which we operate could:
| • | limit the use of our products and adversely affect the use of new therapies for which our products may be targeted ; |
| • | reduce reimbursement available to our customers for using our products; and |
13
Table of Contents
| • | decrease the price we might establish for our products and products that we may develop, which would result in lower product revenues to us. |
In addition, because we operate in a highly regulated industry, other governmental actions may adversely affect our business, operations and financial condition, including:
| • | changes in the FDA and foreign regulatory approval processes that may delay or prevent the approval of new products and result in lost market opportunity; |
| • | changes in FDA and foreign regulations that may require additional safety monitoring, labeling changes, restrictions on product distribution or use, or other measures after the introduction of our products to market, which could increase our costs of doing business, or otherwise adversely affect the market for our products; |
| • | new laws, regulations and judicial decisions affecting pricing or marketing practices; and |
| • | changes in the tax laws relating to our operations. |
| Item 1B. | Unresolved Staff Comments |
Not applicable
| Item 2. | Properties |
We own the land and building for our principal executive offices and major manufacturing facility located in Peabody, Massachusetts. This facility consists of approximately 514,000 square feet of manufacturing, engineering, and office space. We own approximately 65 acres of land at this location, which can accommodate future expansion as required. We use approximately 7.5 acres of this land for the Peabody Marriott Hotel, which is owned by one of our wholly owned subsidiaries and managed by the Marriott Corporation.
We and our subsidiaries own and lease various other office, manufacturing, engineering, and sales facilities in both the United States and abroad. We believe that our existing facilities are generally adequate to meet our current needs, and that suitable additional or substitute space will be available on commercially reasonable terms when needed.
See Notes to Consolidated Financial Statements for further information concerning certain leases.
| Item 3. | Legal Proceedings |
Not applicable
| Item 4. | Removed and Reserved |
Executive Officers of the Registrant
Our current executive officers are:
| Name |
Age | Position | Date Since Office Has Been Held | |||
| James W. Green |
52 | President and Chief Executive Officer | 2007 | |||
| Michael L. Levitz |
37 | Vice President, Chief Financial Officer, and Treasurer | 2009 | |||
| John J. Fry |
48 | Vice President, General Counsel, and Secretary | 2007 | |||
| Donald B. Melson |
58 | Vice President and Corporate Controller | 2006 |
14
Table of Contents
Our executive officers are elected annually by our Board of Directors (the “Board”) and hold office until their successors are chosen and qualified, subject to earlier removal by the Board.
There are no arrangements or understandings between any of our executive officers and any other person(s) pursuant to which such executive officer was selected as an officer.
James W. Green joined us as President and Chief Executive Officer in May 2007. Mr. Green was previously Regional Vice President, California Division, of Quest Diagnostics Incorporated, a leading provider of diagnostic testing, information, and services, from April 2005 to May 2007. Before joining Quest Diagnostics Incorporated, Mr. Green was Senior Vice President & General Manager of Computed Tomography for Philips Medical Systems, a global leader in the business of developing, manufacturing, and marketing computed tomography equipment used in medical imaging applications, from October 2001 to April 2005.
Michael L. Levitz joined us as Vice President, Chief Financial Officer, and Treasurer in July 2009. From October 2007 to July 2009, Mr. Levitz was Vice President and Controller of the Cytyc business unit of Hologic Inc., a developer, manufacturer, and supplier of premium diagnostic products, medical imaging systems, and surgical products focused on the healthcare needs of women. From April 2006 until Cytyc Corporation’s merger with Hologic Inc. in October 2007, Mr. Levitz was Vice President and Corporate Controller of Cytyc Corporation, a global leader in innovative diagnostic and medical devices focused on women’s health. Mr. Levitz was Assistant Corporate Controller of Cytyc Corporation from September 2002 to April 2006. Prior to this position, Mr. Levitz was Controller at NEON Communications, Inc. from 2001 to 2002 and Director of Financial Reporting from 2000 to 2001. From 1995 to 2000, Mr. Levitz served in various positions in the high technology audit practice of Arthur Andersen LLP, most recently as Audit Manager.
John J. Fry joined us as Vice President, General Counsel, and Secretary in November 2007. From April 2005 until joining us, Mr. Fry was a principal of the law firm, Driggs, Hogg, & Fry Co., L.P.A. (formerly Driggs, Lucas, Brubaker & Hogg Co., L.P.A.), where his practice focused primarily on technology and intellectual property law. From August 1995 to April 2005, he held various legal positions at Philips Medical Systems (formerly Marconi Medical Systems and Picker International), including Senior Corporate Counsel and Intellectual Property Manager and counsel to Philips’ computed tomography business.
Donald B. Melson joined us as Vice President and Corporate Controller in March 2006. Mr. Melson was previously Vice President and Corporate Controller of Millipore Corporation, a publicly held global manufacturer of products and services for biopharmaceutical manufacturing and life science laboratories, from 2000 to 2006. Prior to this position, Mr. Melson held a number of financial management positions in Millipore Corporation and W. R. Grace & Co. Mr. Melson began his career in the audit practice of Ernst & Young and is a certified public accountant.
15
Table of Contents
| Item 5. | Market for the Registrant’s Common Equity, Related Stockholder Matters and Issuer Purchases of Equity Securities |
Our common stock trades on the NASDAQ Global Select Market under the symbol: ALOG. The following table sets forth the high and low sales prices per share of our common stock, as reported by the NASDAQ Global Select Market, for each quarterly period indicated in the table below:
| Fiscal Year |
High | Low | ||||
| 2009 |
||||||
| First Quarter |
$ | 76.93 | $ | 34.57 | ||
| Second Quarter |
44.00 | 24.63 | ||||
| Third Quarter |
37.23 | 24.39 | ||||
| Fourth Quarter |
39.34 | 33.39 | ||||
| 2010 |
||||||
| First Quarter |
$ | 41.26 | $ | 33.20 | ||
| Second Quarter |
42.01 | 34.40 | ||||
| Third Quarter |
48.51 | 37.35 | ||||
| Fourth Quarter |
48.58 | 40.70 | ||||
As of August 31, 2010, there were approximately 885 holders of record of our common stock. Because many of the shares are held by brokers and other institutions on behalf of stockholders, we are unable to estimate the total number of individual stockholders represented by these holders of record. Our Board declared cash dividends of $0.10 per share for each of the quarters of fiscal years 2010 and 2009. Our policy is to retain sufficient earnings to provide funds for the operation and expansion of our business.
The following table contains information about our purchases of our equity securities during the three months ended July 31, 2010. All of the shares shown as purchased in the table below were surrendered by our employees in order to meet tax withholding obligations in connection with the vesting of restricted stock awards. These transactions were not part of a publicly announced program to repurchase shares of our common stock.
| Period |
Total Number of Shares Purchased |
Average Price Paid per Share (1) |
Total Number of Shares Purchased as Part of Publicly Announced Plans or Programs |
Maximum Number (or Approximate Dollar Value) of Shares that May Yet Be Purchased Under the Plans or Programs | |||||
| 5/1/10-5/31/10 |
786 | $ | 41.93 | — | — | ||||
| 6/1/10-6/30/10 |
— | — | — | — | |||||
| 7/1/10-7/31/10 |
1,424 | 44.56 | — | — | |||||
| Total |
2,210 | $ | 43.63 | — | — | ||||
| (1) | For purposes of determining the number of shares to be surrendered, the price per share deemed to be paid was the closing price of our common stock on the NASDAQ Global Select Market on the vesting date. |
16
Table of Contents
Securities Authorized for Issuance Under Equity Compensation Plans
The following table provides information about the shares of our common stock authorized for issuance under our equity compensation plans as of July 31, 2010:
Equity Compensation Plan Information
| Plan Category |
(a) Number of Securities to be Issued Upon Exercise of Outstanding Options, Warrants and Rights |
(b) Weighted-Average Exercise Price of Outstanding Options, Warrants and Rights |
(c) Number of Securities Remaining Available for Future Issuance Under Equity Compensation Plans (Excluding Securities Reflected in Column (a)) |
|||||
| Equity compensation plans approved by security holders |
320,009 | $ | 54.38 | 2,127,840 | (1) | |||
| Equity compensation plans not approved by security holders |
— | — | — | |||||
| Total |
320,009 | $ | 54.38 | 2,127,840 | (1) | |||
| (1) | Includes 446,038 shares issuable under our Employee Stock Purchase Plan in connection with current and future offering periods under that plan. |
17
Table of Contents
Comparison of Five-Year Cumulative Total Returns
The graph below compares the cumulative total stockholder return on our common stock with the cumulative total return of the Center for Research in Security Prices of the University of Chicago (“CRSP”) Total Return Index for the NASDAQ Stock Market (U.S. Companies) and the CRSP Total Return Index for all NASDAQ stocks with SIC Codes related to our business in the areas of measuring instruments, photo goods, medical goods, optical goods, and timepieces. The graph below also compares the cumulative total stockholder return on our common stock with the cumulative total return of the Russell 2000 Index, which we plan to use going forward instead of the NASDAQ Stock Market (US Companies). The reason for this change is because our investors predominantly use the Russell 2000 Index to benchmark their investment performance. The graph assumes $100 invested on July 31, 2005, in our common stock and $100 invested at that time in each of the NASDAQ indexes. The comparison assumes that all dividends are reinvested.
Comparison of Five-Year Cumulative Total Returns
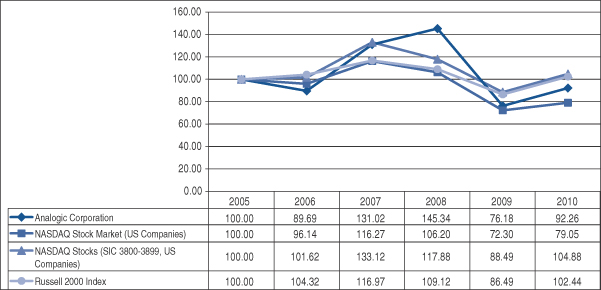
The stock price performance included in this graph is not necessarily indicative of future stock price performance.
18
Table of Contents
| Item 6. | Selected Financial Data |
The following selected consolidated financial data are derived from our Consolidated Financial Statements and notes thereto and should be read in connection with, and are qualified in their entirety by, our Consolidated Financial Statements and notes thereto and other financial information included elsewhere in this Annual Report on Form 10-K.
| (In thousands, except per share data) | |||||||||||||||||
| Year Ended July 31, | |||||||||||||||||
| 2010 | 2009 | 2008 | 2007 | 2006 | |||||||||||||
| Total net revenue (A) |
$ | 423,597 | $ | 396,149 | $ | 413,509 | $ | 340,782 | $ | 351,445 | |||||||
| Total cost of sales (B) |
273,516 | 270,953 | 262,411 | 223,567 | 230,310 | ||||||||||||
| Gross margin |
150,081 | 125,196 | 151,098 | 117,215 | 121,135 | ||||||||||||
| Income (loss) from operations (B) |
20,995 | (4,185 | ) | 24,311 | 2,325 | (5,249 | ) | ||||||||||
| Income from continuing operations before discontinued operations and cumulative effect of change in accounting principle (C) |
15,555 | 3,705 | 23,486 | 15,380 | 4,600 | ||||||||||||
| Income from discontinued operations, net of tax |
— | — | — | — | 139 | ||||||||||||
| Gain on disposal of discontinued operations, net of tax (D) |
— | — | — | — | 20,207 | ||||||||||||
| Cumulative effect of change in accounting principle, net of tax |
— | — | — | — | 120 | ||||||||||||
| Net income (E) |
$ | 15,555 | $ | 3,705 | $ | 23,486 | $ | 15,380 | $ | 25,066 | |||||||
| Basic net income per share: |
|||||||||||||||||
| Income from continuing operations |
$ | 1.24 | $ | 0.29 | $ | 1.78 | $ | 1.11 | $ | 0.34 | |||||||
| Income from discontinued operations, net of tax |
— | — | — | — | 0.01 | ||||||||||||
| Gain on disposal of discontinued operations, net of tax |
— | — | — | — | 1.47 | ||||||||||||
| Cumulative effect of change in accounting principle, net of tax |
— | — | — | — | 0.01 | ||||||||||||
| Based net income per share |
$ | 1.24 | $ | 0.29 | $ | 1.78 | $ | 1.11 | $ | 1.83 | |||||||
| Diluted net income per share: |
|||||||||||||||||
| Income from continuing operations |
$ | 1.23 | $ | 0.29 | $ | 1.77 | $ | 1.10 | $ | 0.33 | |||||||
| Income from discontinued operations, net of tax |
— | — | — | — | 0.01 | ||||||||||||
| Gain on disposal of discontinued operations, net of tax |
— | — | — | — | 1.46 | ||||||||||||
| Cumulative effect of change in accounting principle, net of tax |
— | — | — | — | 0.01 | ||||||||||||
| Diluted net income per share |
$ | 1.23 | $ | 0.29 | $ | 1.77 | $ | 1.10 | $ | 1.81 | |||||||
| Cash dividends declared per common share |
$ | 0.40 | $ | 0.40 | $ | 0.40 | $ | 0.40 | $ | 0.38 | |||||||
| Weighted average shares outstanding: |
|||||||||||||||||
| Basic |
12,584 | 12,835 | 13,180 | 13,814 | 13,704 | ||||||||||||
| Diluted |
12,655 | 12,932 | 13,290 | 13,946 | 13,853 | ||||||||||||
| Cash, cash equivalents, and marketable securities |
$ | 169,254 | $ | 160,293 | $ | 186,442 | $ | 228,545 | $ | 258,237 | |||||||
| Working capital |
281,727 | 264,140 | 287,260 | 300,114 | 334,955 | ||||||||||||
| Total assets |
485,776 | 464,114 | 511,165 | 459,141 | 488,645 | ||||||||||||
| Long-term liabilities |
6,665 | 6,444 | 8,993 | 456 | 840 | ||||||||||||
| Stockholders’ equity |
409,042 | 397,519 | 428,506 | 393,357 | 431,925 | ||||||||||||
| (A) | We acquired Copley Controls Corporation (“Copley”) on April 14, 2008. The Copley business accounted for net revenue of $18,300 during fiscal year 2008. |
19
Table of Contents
| (B) | In fiscal year 2009, we recorded a $6,619 restructuring charge for the severance and personnel related costs of 201 employees that were involuntarily terminated as well as for facility exit costs, all of which were recorded in operating expenses. Also, in fiscal year 2009, we recorded $811 in general and administrative expenses for a settlement of a dispute with a customer. In fiscal year 2008, we recorded a pre-tax voluntary retirement charge of $3,419 related to a fiscal year 2008 voluntary retirement program and a pre-tax restructuring charge of $597 for severance and personnel related costs for the involuntary termination of 32 employees, all of which were recorded in operating expenses. In fiscal year 2007, we recorded $9,705 of pre-tax charges related primarily to the future use and realizability of certain inventory, software license, and capitalized software. Of the total charges, $8,625 was recorded in cost of sales and $1,080 was recorded in operating expenses. In fiscal year 2006, we recorded $14,876 of pre-tax charges related primarily to the future use and realizability of certain inventory and capitalized software. Of the total charges, $7,361 was recorded in cost of sales and $7,515 was recorded in operating expenses. |
| (C) | In fiscal year 2007, we recorded a gain on the sale of other investments on a pre-tax basis of $4,036 related to the sale of equity interests in fiscal year 2007. In fiscal year 2008, we recorded a gain on the sale of other investments on a pre-tax basis of $2,000 related to our sale of 20% of our 45% equity interest in a China based company (for a remaining interest of 25%). |
| (D) | We recorded a gain on the sale of Camtronics Medical Systems, Ltd. (“Camtronics”) as a discontinued operation in fiscal year 2006. |
| (E) | We had an income tax benefit in fiscal year 2009 of $4,915, which was due primarily to Internal Revenue Service (“IRS”) refunds of $8,143 received in fiscal year 2009. The impact of these refunds, which included $1,262 of interest, was a reduction of unrecognized tax benefits by approximately $3,280, of which $1,356 was recorded as a tax benefit in fiscal year 2009. Also contributing to the income tax benefit for fiscal year 2009 were the reversal of $920 of tax reserves due to the expiration of statutes of limitations, and $1,820 for the reversal of a valuation allowance on Belgium net operating loss carryforwards that management has determined are more likely than not to be recognized. |
| Item 7. | Management’s Discussion and Analysis of Financial Condition and Results of Operations |
The following discussion provides an analysis of our financial condition and results of operations and should be read in conjunction with the audited consolidated financial statements and notes thereto included elsewhere in this Annual Report on Form 10-K. The discussion contains statements, which, to the extent that they are not a recitation of historical facts, constitute “forward-looking statements” pursuant to the safe harbor provisions of the Private Securities Litigation Reform Act of 1995. All statements, other than statements of historical fact, including statements about product development, market and industry trends, strategic initiatives, regulatory approvals, sales, profits, expenses, price trends, research and development expenses and trends, and capital expenditures, we make in this document or in any document incorporated by reference are forward-looking. Such forward-looking statements involve known and unknown risks, uncertainties, and other factors, which may cause our actual results, performance, or achievements to differ from the projected results. See “Risk Factors” in Item 1A for a discussion of the primary risks and uncertainties known to us at this time.
Our Management’s Discussion and Analysis is presented in six sections as follows:
| • | Business Overview |
| • | Fiscal Year 2010 Overview |
| • | Results of Operations |
| • | Liquidity and Capital Resources |
| • | Critical Accounting Policies |
| • | New Accounting Pronouncements |
We report our financial condition and results of operations on a fiscal year basis ending July 31. All dollar amounts in this Item 7 are in thousands except per share data.
20
Table of Contents
Business Overview
Analogic is a high technology company that designs and manufactures advanced medical imaging and security systems and subsystems sold to OEMs and end users primarily in the healthcare and airport security markets. We were incorporated in the Commonwealth of Massachusetts in November 1967 and are recognized worldwide for advancing state-of-the-art technology in the areas of medical CT, MRI, Digital mammography, Specialized Ultrasound, and EDS for airport security. Our OEM customers incorporate our technology into systems they in turn sell for various medical and security applications. We also sell our ultrasound products directly into specialized clinical end-user markets through our direct worldwide sales force under the brand name B-K Medical.
We operate primarily within two major markets: Medical Technology and Security Technology. Medical Technology consists of three reporting segments: CT and MRI, Digital Radiography, and Specialized Ultrasound.
A significant portion of our products are sold to OEMs, whose purchasing dynamics have an impact on our reported sales. OEMs that purchase our CT and MRI and Digital Radiography products generally incorporate those products as components in their systems, which are in turn sold to end users, primarily hospitals and medical clinics. In our Security Technology business, a major OEM customer purchases and resells our products to end users including domestic and foreign airports as well as the U.S Transportation Security Administration (“TSA”). In Security Technology, our OEM customers’ purchasing dynamics are affected by the level of government funding, the expansion of airport terminals and fluctuations in airline passenger volume.
Fiscal Year 2010 Overview
The following is a summary of the matters that our management believes are most important in understanding our results of operations for the periods indicated. This summary is not a substitute for the detail provided in the following pages or for the audited consolidated financial statements and notes that appear elsewhere in this document.
| Percentage Change |
|||||||||||
| Fiscal Year | |||||||||||
| 2010 | 2009 | ||||||||||
| Total net revenue |
$ | 423,597 | $ | 396,149 | 7 | % | |||||
| Income (loss) from operations |
20,995 | (4,185 | ) | N/A | |||||||
| Operating margin percentage |
5 | % | -1 | % | |||||||
| Net income |
$ | 15,555 | $ | 3,705 | 320 | % | |||||
| Diluted net income per share |
1.23 | 0.29 | 324 | % | |||||||
The increase in net revenue, income from operations, net income, and diluted net income per share in fiscal year 2010 as compared to fiscal year 2009 primarily reflected the improvement in hospital spending on capital equipment, which drove increased demand in our Medical Technology business, the impact of new innovative products in both Medical Technology and Security Technology, and a diligent focus on cost containment and operational efficiency, which enabled the positive recovery from the downturn of fiscal year 2009.
We had cash and cash equivalents and marketable securities of $169,254 and $160,293 at July 31, 2010 and 2009, respectively. The interest earned on our cash and cash equivalents over the past 12 month continued to be impacted by the global decline in interest rates. We have historically invested primarily in U.S government backed securities, bonds, and certificates of deposit. The interest rates of these instruments have declined significantly over the last year. The following table sets forth an overview of cash flows for fiscal years 2010 and 2009.
| Year ended July 31, | ||||||||
| 2010
|
2009
|
|||||||
| Net cash provided by operating activities |
$ | 27,117 | $ | 16,728 | ||||
| Net cash provided by (used for) investing activities |
28,899 | (38,495 | ) | |||||
| Net cash used for financing activities |
(4,520 | ) | (30,185 | ) | ||||
| Effect of exchange rate changes on cash |
(2,097 | ) | (2,105 | ) | ||||
| Net increase (decrease) in cash and cash equivalents |
$ | 49,399 | $ | (54,057 | ) | |||
21
Table of Contents
During fiscal year 2010, our cash from our operating activities improved notably from fiscal year 2009 due primarily to the significant increase in income from operations of $25,180 on higher revenues and operating margins. The net cash provided by investing activities in fiscal year 2010 was due primarily to the maturity of $40,438 of short-term held-to-maturity marketable securities, which was partially offset by property, plant, and equipment additions of $9,407 and an investment in an affiliate of $1,920. The net cash used for financing activities in fiscal year 2010 was due primarily to $5,044 of dividends paid to stockholders.
Results of Operations
Fiscal Year 2010 Compared to Fiscal Year 2009
Net Revenue
Product Revenue
Product revenue for fiscal year 2010 as compared with fiscal year 2009 is summarized in the table below.
| Year Ended July 31, | Percentage Change |
||||||||
| 2010 | 2009 | ||||||||
| Product Revenue: |
|||||||||
| Medical Technology : |
|||||||||
| CT and MRI |
$ | 228,408 | $ | 210,691 | 8 | % | |||
| Digital Radiography |
36,227 | 31,902 | 14 | % | |||||
| Specialized Ultrasound |
89,986 | 82,599 | 9 | % | |||||
| Total Medical Technology |
354,621 | 325,192 | 9 | % | |||||
| Security Technology |
39,144 | 40,578 | -4 | % | |||||
| Total |
$ | 393,765 | $ | 365,770 | 8 | % | |||
CT and MRI
The increase in product revenue for our CT and MRI segment for fiscal year 2010 versus the prior year was due primarily to increases in demand by our OEM customers as a result of the improvement in hospital spending on capital equipment, as well as the impact of new products introduced in fiscal year 2010.
Digital Radiography
The increase in product revenue for Digital Radiography Products for fiscal year 2010 versus the prior year was due primarily to increased shipments of mammography detectors to OEM customers outside the United States. As of July 31, 2010, our major OEM customer for mammography detectors had not yet received clearance from the United States Food and Drug Administration to market their system, which incorporates our selenium-based detector, in the United States.
Specialized Ultrasound
The increase in Specialized Ultrasound product revenue in fiscal year 2010 versus the prior year was due primarily to increases in demand for our new product lines, the Flex Focus and Pro Focus UltraView ultrasound scanners, which were introduced late in the second and third quarters of fiscal year 2009, respectively, the improvement in hospital spending on capital equipment in general, and expansion of our direct sales force.
Security Technology
The decrease in product revenue for Security Technology in fiscal year 2010 versus the prior year was due primarily to the fluctuating demand by our OEM customer as a result of changing requirements and procurement
22
Table of Contents
procedures in the United States by the TSA. This decrease was offset in large part by an increase in sales of spare parts and accessories and initial revenues from the introduction of our new high-speed explosives detection system, which was certified by the TSA in fiscal year 2010.
Engineering Revenue
Engineering revenue for fiscal year 2010 as compared with fiscal year 2009 is summarized in the table below.
| Year Ended July 31, | Percentage Change |
||||||||
| 2010 | 2009 | ||||||||
| Engineering Revenue: |
|||||||||
| Medical Technology : |
|||||||||
| CT and MRI |
$ | 9,084 | $ | 11,554 | -21 | % | |||
| Digital Radiography |
522 | 1,058 | -51 | % | |||||
| Specialized Ultrasound |
— | — | 0 | % | |||||
| Total Medical Technology |
9,606 | 12,612 | -24 | % | |||||
| Security Technology |
11,442 | 8,478 | 35 | % | |||||
| Total |
$ | 21,048 | $ | 21,090 | 0 | % | |||
CT and MRI
The decrease in CT and MRI engineering revenue in fiscal year 2010 versus the prior year was due primarily to the timing of completed milestones on projects for various OEM customers.
Digital Radiography
The decrease in Digital Radiography engineering revenue in fiscal year 2010 versus the prior year was due primarily to the timing of completed milestones on a project for an OEM customer in fiscal year 2010 as compared to the prior year.
Security Technology
The increase in Security Technology engineering revenue in fiscal year 2010 versus the prior year was due primarily to an engineering project that began in December 2009 for an OEM customer. This was partially offset by a decrease in engineering revenue on a time and materials project with an OEM customer to transition the high-speed eXaminer XLB explosive detection system from a prototype into a manufacturable product.
Other Revenue
Other Revenue for fiscal year 2010 as compared with fiscal year 2009 is summarized in the table below.
| Year Ended July 31, |
Percentage Change |
||||||||
| 2010 | 2009 | ||||||||
| Other Revenue: |
|||||||||
| Hotel |
$ | 8,784 | $ | 9,289 | -5 | % | |||
The decreases in fiscal year 2010 versus the prior year comparable period was due primarily to lower occupancy and a decline in room rates at the hotel due to lower business and personal travel as a result of the continuing economic pressures in the consumer market.
23
Table of Contents
Gross Margin
Product Gross Margin
Product gross margin for fiscal year 2010 as compared with fiscal year 2009 is summarized in the table below.
| Year Ended July 31, | Percentage Change |
||||||||||
| 2010 | 2009 | ||||||||||
| Product gross margin |
$ | 145,415 | $ | 122,913 | 18.3 | % | |||||
| Product gross margin % |
36.9 | % | 33.6 | % | |||||||
Product gross margin percentage increased in fiscal year 2010 versus the prior year due primarily to lower labor costs as a result of restructuring, improved manufacturing efficiency as a result of higher production throughput and improved component pricing from our vendors.
Engineering Gross Margin
Engineering gross margin for fiscal year 2010 as compared with fiscal year 2009 is summarized in the table below.
| Year Ended July 31, | Percentage Change | |||||||||
| 2010 | 2009 | |||||||||
| Engineering gross margin (loss) |
$ | 2,482 | $ | (308 | ) | N/A | ||||
| Engineering gross margin % |
11.8 | % | -1.5 | % | ||||||
The increases in the engineering gross margin in fiscal year 2010 versus the prior year comparable period was due primarily to the improved pricing for non-recurring engineering projects undertaken for OEM customers partially offset by costs in excess of revenues on CT and MRI business projects. We incurred a gross loss on engineering revenue in fiscal year 2009 primarily as a result of the write down of deferred engineering costs of $365 due to the settlement agreement that was reached with CAS Medical Systems, Inc. (“CAS”) in August 2009 and costs incurred in excess of revenue on certain customer funded CT and MRI projects.
Operating Expenses
Operating expenses decreased $295, or 0.2%, in fiscal year 2010 as compared with fiscal year 2009 as shown below.
| Fiscal Year | Percentage of Net Revenue | |||||||||||
| 2010 | 2009 | 2010 | 2009 | |||||||||
| Research and product development |
$ | 49,150 | $ | 45,276 | 11.6 | % | 11.5 | % | ||||
| Selling and marketing |
37,653 | 37,320 | 8.9 | % | 9.4 | % | ||||||
| General and administrative |
41,593 | 40,166 | 9.8 | % | 10.1 | % | ||||||
| Restructuring and voluntary retirement charges |
690 | 6,619 | 0.2 | % | 1.7 | % | ||||||
| Total operating expenses |
$ | 129,086 | $ | 129,381 | 30.5 | % | 32.7 | % | ||||
Research and product development expenses increased $3,874 for fiscal year 2010 versus the prior year due primarily to an increase in performance-based variable cash and share-based compensation expense of $2,545 as a result of improved operating results. These increases were partially offset by realizing the benefit of the workforce reductions that took place in fiscal year 2009.
Selling and marketing expenses increased $333 for fiscal year 2010 versus the prior year due primarily to an increase in performance-based variable cash and share-based compensation expense of $300 as a result of
24
Table of Contents
improved operating results. Also contributing to the increase were increased sales commissions of $374 due to increased sales of specialized ultrasound products and expansion of our direct sales force. These increases were partially offset by realizing the benefit of the workforce reductions that took place in fiscal year 2009.
General and administrative expenses increased $1,427 for fiscal year 2010 versus the prior year due primarily to an increase in performance-based variable cash and share-based compensation expense of $4,185 as a result of improved operating results. These increases were partially offset by realizing the benefit of the workforce reductions that took place in fiscal year 2009, $1,160 of contingent professional fees related to income tax refunds and related interest of $8,389 received from the IRS and the State of Massachusetts in fiscal year 2009, and $811 related to the settlement agreement reached with CAS in August 2009.
Restructuring and voluntary retirement charges decreased $5,929 for fiscal year 2010 versus the prior year. The fiscal year 2010 amount includes severance and personnel-related costs of $764 for involuntary terminations and $420 for facility exit costs primarily related to our office facility in Canton, MA. This was offset in part by a reversal of prior year severance and related benefit expenses of $494 due to a change in estimated severance benefits and changes in the employee population expected to receive such benefits. The fiscal year 2009 amount includes severance and personnel related costs of $5,561 for involuntary terminations and $1,058 for facility exit costs primarily related to vacating 50% of our office facility in Canton, MA on July 31, 2009 as a result of moving certain operations to our Peabody, MA facility.
Other Income (Expense)
| Year Ended July 31, | ||||||||
| 2010 | 2009 | |||||||
| Interest income, net |
$ | 636 | $ | 2,573 | ||||
| Gain on sale of other investments |
— | 838 | ||||||
| Other expense: |
(487 | ) | (436 | ) | ||||
The decrease in net interest income in fiscal year 2010 versus the prior year was due primarily to a decline in interest rates.
The gain on sale of other investments for fiscal year 2009 was due to the receipt of escrow proceeds of $838 in fiscal year 2009 relating to the sale of our 17% ownership interest in another company during fiscal year 2007.
Net other expense during fiscal years 2010 and 2009 consisted predominantly of foreign currency exchange losses from our Canadian, Danish, and British subsidiaries.
Provision (Benefit) for Income Taxes
| Year Ended July 31, | ||||||||
| 2010 | 2009 | |||||||
| Provision (benefit) for income taxes |
$ | 5,589 | $ | (4,915 | ) | |||
| Effective tax rate |
26 | % | 406 | % | ||||
For fiscal year 2010, the effective tax rate of 26% as compared to the U.S. statutory rate of 35% was due primarily to lower foreign tax rates and discrete benefits of approximately $1,750 due primarily to the reversal of tax reserves as a result of the expiration of the statute of limitations for fiscal years 2004 and 2006 in fiscal year 2010 and the settlement of foreign and domestic tax audits. Also contributing to the reduced effective tax rate were federal research and experimentation credits.
For fiscal year 2009, the benefit for income taxes was due primarily to IRS refunds of $8,143 received in fiscal year 2009. The refunds, which included $1,262 of interest, were for the carryback of a loss and research
25
Table of Contents
and development credits from fiscal year 2004 and from additional research and development tax credits and timing items claimed on amended income tax returns for fiscal years 2001 through 2006. We had recognized $2,701 of these refunds and related interest within stockholders’ equity in fiscal year 2008. The impact of these refunds and related interest was a reduction of unrecognized tax benefits by approximately $3,280, of which $1,356 was recorded as a tax benefit in fiscal year 2009. Also contributing to the benefit for income taxes in fiscal year 2009 was $1,820 for the reversal of a valuation allowance on Belgium net operating loss carryforwards that management has determined are more likely than not to be recognized and the reversal of $920 of tax reserves due to the expiration of statutes of limitations. These benefits were partially offset by additional provisions for agreed federal and state adjustments and typical taxes owed related to our operations in that period.
Net Income and Diluted Net Income per Share
Net income and diluted net income per share for fiscal years 2010 and 2009 were as follows:
| Year Ended July 31, | ||||||||
| 2010 | 2009 | |||||||
| Net income |
$ | 15,555 | $ | 3,705 | ||||
| % of net revenue |
3.7 | % | 0.9 | % | ||||
| Diluted net income per share |
$ | 1.23 | $ | 0.29 | ||||
The increase in net income and diluted net income per share for fiscal year 2010 versus the prior year was due primarily to increases in sales volumes and gross margins driven by increased demand in the Medical Technology business. Also contributing to the increases were lower restructuring charges in fiscal year 2010 versus the prior year comparable period. These increases were partially offset by a decrease in interest income, an increase in performance-based variable cash and share-based compensation expense as a result of improved operating results, and lower income tax benefits.
Fiscal Year 2009 Compared to Fiscal Year 2008
Net Revenue
Product Revenue
Product revenue for fiscal year 2009 as compared with fiscal year 2008 is summarized in the table below.
| Year Ended July 31, | Percentage Change |
||||||||
| 2009 | 2008 | ||||||||
| Product Revenue: |
|||||||||
| Medical Technology : |
|||||||||
| CT and MRI |
$ | 210,691 | $ | 224,905 | -6 | % | |||
| Digital Radiography |
31,902 | 26,676 | 20 | % | |||||
| Specialized Ultrasound |
82,599 | 92,968 | -11 | % | |||||
| Total Medical Technology |
325,192 | 344,549 | -6 | % | |||||
| Security Technology |
40,578 | 43,957 | -8 | % | |||||
| Total |
$ | 365,770 | $ | 388,506 | -6 | % | |||
CT and MRI
The decrease in product revenue for CT and MRI for fiscal year 2009 versus the prior year was due primarily to a decline in demand for data acquisition systems detectors and CT subsystems, which reflects the impact of the Deficit Reduction Act and the global economic slowdown. The decrease was partially offset by the
26
Table of Contents
full-year impact of net revenue from the Copley business, which was acquired in April 2008, and accounted for $62,490 and $18,300 of product revenue in fiscal year 2009 and 2008, respectively.
Digital Radiography
The increase in product revenue for Digital Radiography for fiscal year 2009 versus the prior year was due primarily to an increase in shipments of mammography detectors to an OEM customer partially offset by the winding down of non-mammography product sales to another OEM customer. We expect this business to transition primarily to the sale of mammography detectors in fiscal year 2010.
Specialized Ultrasound
The decrease in Specialized Ultrasound product revenue in fiscal year 2009 versus the prior year was due primarily to unfavorable changes in the foreign currency exchange rate and a decline in demand due to the global economic slowdown. Also contributing to the decrease were customer order delays in anticipation of the introduction of two new ultrasound product lines, one of which we introduced late in the second quarter of fiscal year 2009, and the other of which we introduced late in the third quarter of fiscal year 2009.
Security Technology
The decrease in product revenue for Security Technology in fiscal year 2009 versus the prior year was due primarily to a decrease in sales of spare parts and accessories of approximately $5,500. The decrease was partially offset by more baggage scanners being shipped in fiscal year 2009 as compared to fiscal year 2008.
Engineering Revenue
Engineering revenue for fiscal year 2009 as compared with fiscal year 2008 is summarized in the table below.
| Year Ended July 31, | Percentage Change |
||||||||
| 2009 | 2008 | ||||||||
| Engineering Revenue: |
|||||||||
| Medical Technology : |
|||||||||
| CT and MRI |
$ | 11,554 | $ | 6,775 | 71 | % | |||
| Digital Radiography |
1,058 | 1,444 | -27 | % | |||||
| Specialized Ultrasound |
— | — | 0 | % | |||||
| Total Medical Technology |
12,612 | 8,219 | 53 | % | |||||
| Security Technology |
8,478 | 5,870 | 44 | % | |||||
| Total |
$ | 21,090 | $ | 14,089 | 50 | % | |||
CT and MRI
The increase in CT and MRI engineering revenue in fiscal year 2009 versus the prior year was due primarily to an increase in activity on customer funded engineering projects. Our large OEM customers have continued to fund new product development despite the current market conditions.
Digital Radiography
The decrease in Digital Radiography engineering revenue in fiscal year 2009 versus the prior year was due primarily to less activity on a funded engineering project for an OEM customer.
27
Table of Contents
Security Technology
The increase in Security Technology engineering revenue in fiscal year 2009 versus the prior year was due primarily to engineering revenue on a time and materials project with the TSA to transition the eXaminer XLB from a prototype into a product that can be manufactured. This increase was partially offset by the completion of a project in fiscal year 2008, which was accounted for under the completed contract method and generated revenue of $2,417 in fiscal year 2008.
Other Revenue
Other Revenue for fiscal year 2009 as compared with fiscal year 2008 is summarized in the table below.
| Year Ended July 31, | Percentage Change |
||||||||
| 2009 | 2008 | ||||||||
| Other Revenue: |
|||||||||
| Hotel |
$ | 9,289 | $ | 10,914 | -15 | % | |||
The decrease in fiscal year 2009 versus the prior year was due primarily to lower occupancy and a decline in room rates at the hotel due to lower business and personal travel as a result of the economic slowdown.
Gross Margin
Product Gross Margin
Product gross margin for fiscal year 2009 as compared with fiscal year 2008 is summarized in the table below.
| Year Ended July 31, |
Percentage Change |
||||||||||
| 2009 | 2008 | ||||||||||
| Product gross margin |
$ | 122,913 | $ | 147,849 | -16.9 | % | |||||
| Product gross margin % |
33.6 | % | 38.1 | % | |||||||
Product gross margin percentage decreased in fiscal year 2009 versus the prior year due primarily to a decline in the gross margin of CT and MRI, offset in part by growth in higher margin Specialized Ultrasound sales as a percentage of total net revenue. The decline in the CT and MRI gross margin percentage was due primarily to pricing reductions on CT and MRI, reduced manufacturing efficiency caused by lower production volumes, and a higher mix of lower margin Copley products. The decline in the CT and MRI gross margin percentage was partially offset by an increase in the product gross margin percentage of Digital Radiography due primarily to higher volume and improved manufacturing yields.
Engineering Gross Margin
Engineering gross margin for fiscal year 2009 as compared with fiscal year 2008 is summarized in the table below.
| Year Ended July 31, |
Percentage Change |
||||||||||
| 2009 | 2008 | ||||||||||
| Engineering gross margin (loss) |
$ | (308 | ) | $ | (391 | ) | 21.2 | % | |||
| Engineering gross margin % |
-1.5 | % | -2.8 | % | |||||||
We incurred a gross loss on engineering revenue in fiscal year 2009 primarily as a result of the write down of deferred engineering costs of $365 due to the settlement agreement that was reached with CAS in August 2009. We had a gross loss on engineering revenue in fiscal year 2009 and the prior year, due primarily to costs incurred in excess of revenue on certain customer funded CT and MRI projects.
28
Table of Contents
Operating Expenses
Operating expenses increased $2,594, or 2%, in fiscal year 2009 as compared with fiscal year 2008 as shown below.
| Fiscal Year | Percentage of Net Revenue |
|||||||||||
| 2009 | 2008 | 2009 | 2008 | |||||||||
| Research and product development |
$ | 45,276 | $ | 48,947 | 11.5 | % | 11.8 | % | ||||
| Selling and marketing |
37,320 | 34,528 | 9.4 | % | 8.3 | % | ||||||
| General and administrative |
40,166 | 39,296 | 10.1 | % | 9.6 | % | ||||||
| Restructuring and voluntary retirement charges |
6,619 | 4,016 | 1.7 | % | 1.0 | % | ||||||
| Total operating expenses |
$ | 129,381 | $ | 126,787 | 32.7 | % | 30.7 | % | ||||
Research and product development expenses decreased $3,671 for fiscal year 2009 versus the prior year. The decrease was due primarily to an increase in customer funded engineering projects whose costs are recorded in engineering cost of sales. Also contributing to the decrease were reductions in our workforce late in fiscal year 2008 and during fiscal year 2009 to align our cost structure with market conditions as well as lower performance-based incentive compensation expenses. These decreases were partially offset by the acquisition of Copley in April 2008, which accounted for research and product development expenses of $6,923 and $1,971 in fiscal years 2009 and 2008, respectively.
Selling and marketing expenses increased $2,792 for fiscal year 2009 versus the prior year. The increase was due primarily to the acquisition of Copley in April 2008, which accounted for selling and marketing expenses of $3,706 and $1,548 in fiscal years 2009 and 2008, respectively. The increase was partially offset by reductions in our workforce late in fiscal year 2008 and during fiscal year 2009 to align our cost structure with market conditions as well as lower performance-based incentive compensation expenses.
General and administrative expenses increased $870 for fiscal year 2009 versus the prior year. The increase was due primarily to the full-year impact of the general and administrative expenses of Copley, which was acquired in April 2008. Copley accounted for general and administrative expenses of $2,699 and $866 in fiscal years 2009 and 2008, respectively. Also, contributing to the increase was $811 related to the settlement agreement reached with CAS in August 2009 and $1,160 of contingent professional fees related to income tax refunds and related interest of $8,389 received from the IRS and the State of Massachusetts in fiscal year 2009. These increases were partially offset by reductions in our workforce late in fiscal year 2008 and during fiscal year 2009 to align our cost structure with market conditions as well as lower performance-based incentive compensation expenses.
Restructuring and voluntary retirement charges increased $2,603 for fiscal year 2009 versus the prior year. The fiscal year 2009 amount includes severance and personnel related costs of $5,561 for involuntary terminations and $1,058 for facility exit costs primarily related to vacating 50% of our office facility in Canton, MA on July 31, 2009 as a result of moving certain operations to our Peabody, MA facility. The fiscal year 2008 amount includes severance and personnel related costs of $3,419 for our voluntary retirement program and severance and personnel related costs of $597 for involuntary terminations.
Other Income (Expense)
| July 31, | |||||||
| 2009 | 2008 | ||||||
| Interest income, net |
$ | 2,573 | $ | 7,935 | |||
| Gain on sale of other investments |
838 | 2,084 | |||||
| Other income (expense): |
(436 | ) | 715 | ||||
29
Table of Contents
The decrease in net interest income in fiscal year 2009 versus the prior year was due primarily to lower invested cash balances as a result of the acquisition of Copley, our $25,022 common stock repurchase in the first and second quarters of fiscal year 2009, and a decline in interest rates.
The gain on sale of other investments for fiscal year 2009 was due to the receipt of escrow proceeds of $838 in fiscal year 2009 relating to the sale of our 17% ownership interest in another company during fiscal year 2007. Fiscal year 2008 includes $2,000 from the sale of 20% of our 45% equity interest in a China based company (for a remaining interest of 25%) and the receipt of escrow proceeds of $84 in fiscal year 2008 relating to the sale of our 17% ownership interest in another company during fiscal year 2007.
Net other income (loss) during fiscal year 2009 consisted predominantly of foreign currency exchange losses from our Canadian, Danish, and British subsidiaries. Net other income during fiscal year 2008 consisted primarily of $555 we received from our insurance company as reimbursement for legal fees incurred in relation to an indemnification matter related to the sale of our wholly owned subsidiary, Camtronics, during fiscal year 2006.
Provision for Income Taxes
| Year Ended July 31, | ||||||||
| 2009 | 2008 | |||||||
| Provision (benefit) for income taxes |
$ | (4,915 | ) | $ | 11,559 | |||
| Effective tax rate |
406 | % | 33 | % | ||||
For fiscal year 2009, the benefit for income taxes was due primarily to IRS refunds of $8,143 received in fiscal year 2009. The refunds, which included $1,262 of interest, were for the carryback of a loss and research and development credits from fiscal year 2004 and from additional research and development tax credits and timing items claimed on amended income tax returns for fiscal years 2001 through 2006. We had recognized $2,701 of these refunds and related interest within stockholders’ equity, in fiscal year 2008. The impact of these refunds and related interest was a reduction of unrecognized tax benefits by approximately $3,280, of which $1,356 was recorded as a tax benefit in fiscal year 2009. Also contributing to the benefit for income taxes in fiscal year 2009 was $1,820 for the reversal of a valuation allowance on Belgium net operating loss carryforwards that management has determined are more likely than not to be recognized and the reversal of $920 of tax reserves due to the expiration of statutes of limitations. These benefits were partially offset by additional provisions for agreed federal and state adjustments and typical taxes owed related to our operations in that period.
For fiscal year 2008, our effective tax rate varied from the statutory tax rate primarily as a result of the mix of income attributable to foreign versus domestic jurisdictions. Our effective tax rate for fiscal year 2008 included benefits of 3% and 1% from foreign operations and the U.S. domestic production deduction, respectively, as well as a benefit of 1% for the U.S. research and experimentation credit, which expired on December 31, 2007. These benefits were offset by a 3% provision due to an increase in tax reserves.
Net Income and Diluted Net Income per Share
Net income and diluted net income per share for fiscal year 2009 and fiscal year 2008 were as follows:
| Year Ended July 31, | ||||||||
| 2009 | 2008 | |||||||
| Net income |
$ | 3,705 | $ | 23,486 | ||||
| % of net revenue |
0.9 | % | 5.7 | % | ||||
| Diluted net income per share |
$ | 0.29 | $ | 1.77 | ||||
30
Table of Contents
The decrease in net income and diluted net income per share for fiscal year 2009 versus the prior year were due primarily to declines in sales volumes, gross margins, and interest income, as well as an increase in the amount of restructuring charges in fiscal year 2009 versus the prior year comparable period. These factors were partially offset by a benefit from income taxes and a decline in the weighted average shares outstanding due to the common stock repurchase program completed in the second quarter of fiscal year 2009.
Liquidity and Capital Resources
Key liquidity and capital resources information is summarized in the table below.
| July 31, 2010 | July 31, 2009 | |||||
| Cash and cash equivalents and marketable securities |
$ | 169,254 | $ | 160,293 | ||
| Working capital |
281,727 | 264,140 | ||||
| Short and long term debt |
— | — | ||||
| Stockholders' equity |
409,042 | 397,519 | ||||
The increase in working capital from July 31, 2009 to July 31, 2010 was due primarily to increases in cash, cash equivalents, and marketable securities, accounts receivable, and inventories, of $8,961, $13,006, and $7,435, respectively, reflecting increased sales volumes and increased customer demand during fiscal year 2010.
We periodically review our investment portfolio to determine if any investments are impaired due to changes in credit risk or other potential valuation concerns. We believe that our cash equivalents were appropriately valued at July 31, 2010 and we are not aware of any market events that would impact their valuation. This could change in the future should new developments arise in the credit markets.
We face exposure to financial market risks, including adverse movements in foreign currency exchange rates, and changes in interest rates. These exposures can change over time as business practices evolve and could have a material adverse impact on our financial results. Our primary exposure is related to fluctuations between the U.S. dollar and local currencies for our subsidiaries in Canada and Europe. Our investment in international subsidiaries is sensitive to fluctuations in currency exchange rates. The effect of a change in currency exchange rates on our net investment in international subsidiaries is reflected in the “accumulated other comprehensive income” component of stockholders’ equity. A 10% depreciation in the July 31, 2010 and 2009 functional currencies, relative to the U.S. dollar, would result in a reduction of stockholders’ equity of approximately $700 and $1,200, respectively.
The carrying amounts reflected in the consolidated balance sheets of cash and cash equivalents, trade receivables, and trade payables approximate fair value at July 31, 2010, due to the short maturities of these instruments.
Cash and cash equivalents totaled $169,254 at July 31, 2010 and consisted entirely of highly liquid investments with maturities of three months or less from the time of purchase.
Cash Flows
The following table summarizes our sources and uses of cash over the periods indicated:
| Year Ended July 31, | ||||||||||||
| 2010 | 2009 | 2008 | ||||||||||
| Net cash provided by operating activities |
$ | 27,117 | $ | 16,728 | $ | 47,810 | ||||||
| Net cash provided by (used for) investing activities |
28,899 | (38,495 | ) | (99,050 | ) | |||||||
| Net cash used for financing activities |
(4,520 | ) | (30,185 | ) | (2,376 | ) | ||||||
| Effect of exchange rate changes on cash |
(2,097 | ) | (2,105 | ) | 983 | |||||||
| Net increase (decrease) in cash and cash equivalents |
$ | 49,399 | $ | (54,057 | ) | $ | (52,633 | ) | ||||
31
Table of Contents
The cash flows generated from operating activities in fiscal year 2010 primarily reflects our pre-tax earnings of $21,144, which included depreciation and amortization expenses of $17,569 and non-cash share-based compensation expense of $5,791. The impact of our operating earnings on cash flows were partially offset by increases in accounts receivables, inventories, and other assets of $13,006, $7,435, and $2,489, respectively, net of a decrease in refundable incomes taxes of $2,831 and increases in accounts payable and accrued income taxes of $3,021 and $2,387, respectively.
Accounts receivable increased primarily due to growth in unbilled receivables on engineering projects throughout fiscal year 2010 and increased revenue in the fourth quarter of fiscal year 2010 as compared to the fourth quarter of fiscal year 2009. Inventories increased due primarily to an increase in customer demand and production volumes in part associated with the transition of certain manufacturing activities to our recently established subsidiary in Shanghai, China. The increase in other assets was due primarily to an advance paid as part of a technology development arrangement, which is expected to be repaid over the next nine months according to the development plan that includes milestones and increases in deferred engineering costs.
The decrease in refundable income taxes was due primarily to income tax refunds that were received in fiscal year 2010. The increase in accounts payable was due primarily to the timing of vendor payments and an increase in inventories due to increased customer demand and production volumes. The increase in accrued income taxes was due to the increase in income earned in fiscal year 2010 as compared to fiscal year 2009.
The net cash provided by investing activities in fiscal year 2010 was due primarily to the maturity of $40,438 of short-term held-to-maturity marketable securities, which was partially offset by property, plant, and equipment additions of $9,407 and an investment in an affiliate of $1,920.
Net cash used for financing activities in fiscal year 2010 consisted primarily of $5,044 for dividends paid to stockholders.
We believe that our balances of cash, cash equivalents, and marketable securities, and cash flows expected to be generated by future operating activities will be sufficient to meet our cash requirements for at least the next 12 months.
Commitments, Contractual Obligations and Off-Balance Sheet Arrangements
Our contractual obligations at July 31, 2010, and the effect such obligations are expected to have on liquidity and cash flows in future periods are as follows:
| Contractual Obligation |
Total | Less than
1 year |
1 - 3 years | More than 3 years - 5 years |
More than 5 years | ||||||||||
| Operating leases |
$ | 8,770 | $ | 2,698 | $ | 2,044 | $ | 1,285 | $ | 2,743 | |||||
| Purchasing obligations |
62,854 | 60,105 | 2,749 | — | — | ||||||||||
| $ | 71,624 | $ | 62,803 | $ | 4,793 | $ | 1,285 | $ | 2,743 | ||||||
As of July 31, 2010, the total liabilities associated with uncertain tax positions were $6,586. Due to the complexity associated with our tax uncertainties, we cannot make a reasonably reliable estimate of the period in which we expect to settle the non-current liabilities associated with these uncertain tax positions. Therefore, these amounts have not been included in the contractual obligations table.
We currently have approximately $22,500 in revolving credit facilities with banks available for direct borrowings. Our revolving credit facility agreements contain a number of covenants, including a covenant requiring us to maintain a tangible net worth (as defined in the revolving credit facility agreement) of no less than $255,000 as of the end of any fiscal quarter. We were in compliance with this covenant at July 31, 2010 with a
32
Table of Contents
tangible net worth of approximately $364,000. As of July 31, 2010, we had no direct borrowings or off-balance sheet arrangements.
Recent Accounting Pronouncements
Recently adopted
Hierarchy of Generally Accepted Accounting Principles
In June 2009, the Financial Accounting Standards Board (“FASB”) released the FASB Accounting Standards Codification™ and the Hierarchy of Generally Accepted Accounting Principles (the “Codification”), effective for financial statements issued for interim and annual periods ending after September 15, 2009. The Codification does not change accounting principles generally accepted in the United States of America (“GAAP”), but does significantly change the way in which the accounting literature is organized, combining all authoritative standards in a comprehensive, topically organized database. All existing accounting standards documents were superseded and all other accounting literature not included in the Codification is considered nonauthoritative, other than guidance issued by the SEC. We adopted the provisions of this guidance during the quarter ended October 31, 2009, which had no impact on our financial position, results of operations, or cash flows.
Business combinations and noncontrolling interests
Effective August 1, 2009, we adopted FASB guidance that requires an acquiring entity in a business combination to record all assets acquired and liabilities assumed at their respective acquisition date fair values, changes the recognition of assets acquired and liabilities assumed arising from contingencies, changes the recognition and measurement of contingent consideration, and requires the expensing of acquisition-related costs as incurred. This guidance also requires additional disclosure of information surrounding a business combination, such that users of the entity’s financial statements can more fully understand the nature and financial impact of the business combination. This guidance applies prospectively to business combinations for which the acquisition date is on or after the beginning of the first annual reporting period beginning on or after December 15, 2008, which is our fiscal year 2010.
Effective August 1, 2009, we adopted FASB guidance that establishes accounting and reporting standards for ownership interests in subsidiaries held by parties other than the parent, the amount of consolidated net income attributable to the parent and to the noncontrolling interest, changes in a parent’s ownership interest, and the valuation of retained noncontrolling equity investments when a subsidiary is deconsolidated. This guidance also establishes disclosure requirements that clearly identify and distinguish between the interests of the parent and the interests of the noncontrolling owners. This guidance was effective as of the beginning of the first annual reporting period that began after December 15, 2008. The adoption of this guidance did not have a material impact on our financial position, results of operations, or cash flows.
Effective August 1, 2009, we adopted FASB guidance amending the factors that should be considered in developing renewal or extension assumptions used to determine the useful life of a recognized intangible asset and requiring enhanced related disclosures. The guidance improves the consistency between the useful life of a recognized intangible asset and the period of expected cash flows used to measure the fair value of the asset. This guidance must be applied prospectively to all intangible assets acquired as of and subsequent to fiscal years beginning after December 15, 2008. Although future transactions involving intangible assets may be affected by this guidance, it did not impact our financial position, results of operations, or cash flows during fiscal year 2010.
Effective August 1, 2009, we adopted FASB guidance that amends and clarifies the initial recognition and measurement, subsequent measurement and accounting, and related disclosures of assets and liabilities arising from contingencies in a business combination. The impact of the adoption on our consolidated financial statements will largely depend on the size and nature of any business combinations.
33
Table of Contents
Fair value
Effective August 1, 2009, we adopted FASB guidance requiring disclosures about fair value of financial instruments for interim and annual reporting periods and is effective for interim reporting periods ending after June 15, 2009. The adoption did not have a material impact on our financial position, results of operations, or cash flows.
Earnings per share
Effective August 1, 2009, we adopted FASB guidance that classifies unvested share-based payment awards that contain nonforfeitable rights to dividends or dividend equivalents (whether paid or unpaid) as participating securities and requires them to be included in the computation of earnings per share pursuant to the two-class method. The guidance was effective for financial statements issued for fiscal years beginning after December 15, 2008, and interim periods within those years. All prior-period earnings per share data presented are to be adjusted retrospectively (including interim financial statements, summaries of earnings, and selected financial data) to conform with this guidance, with early application not permitted. The adoption of this guidance did not have a material impact on our financial position, results of operations, or cash flows.
Revenue recognition
In October 2009, the FASB issued an amendment which eliminates the residual method of allocation for multiple-deliverable revenue arrangements and requires that arrangement consideration be allocated at the inception of an arrangement to all deliverables using the relative selling price method. The amendment also establishes a selling price hierarchy for determining the selling price of a deliverable, which includes: (1) vendor specific objective evidence (“VSOE”) if available; (2) third-party evidence (“TPE”) if VSOE is not available; and (3) estimated selling price (“ESP”) if neither VSOE nor TPE is available. Additionally, the amendment expands the disclosure requirements related to a vendor’s multiple-deliverable revenue arrangements. This amendment is effective for us on August 1, 2010; however, we elected to early adopt as permitted by the amendment and have prospectively applied the provisions of the amendment to all revenue arrangements entered into or materially modified after July 31, 2009. The adoption of the amendment did not have a material impact on our financial position, results of operations, or cash flows. See Note 1 in the Notes to the audited Consolidated Financial Statements for further discussion.
In October 2009, the FASB issued an amendment which amends the accounting model for revenue arrangements that include both tangible products and software elements, such that tangible products containing both software and non-software components that function together to deliver the tangible product’s essential functionality are no longer within the scope of software revenue guidance. This amendment was effective for us on August 1, 2010; however, we elected to early adopt as permitted by the amendment and have prospectively applied the provisions of the amendment to all revenue arrangements entered into or materially modified after July 31, 2009. The adoption of the amendment did not have a material impact on our financial position, results of operations, or cash flows.
Not yet effective
Special purpose entities
In June 2009, the FASB issued guidance that eliminates the concept of a qualified special-purpose entity and related guidance, creates more stringent conditions for reporting a transfer of a portion of a financial asset as a sale, clarifies other sale-accounting criteria, and changes the initial measurement of a transferor’s interest in transferred financial assets. This guidance is effective as of the beginning of the first annual reporting period that begins after November 15, 2009. We do not expect the adoption of this guidance to have a material impact on our financial position, results of operations, or cash flows.
34
Table of Contents
In June 2009, the FASB issued guidance that requires former qualified special-purpose entities to be evaluated for consolidation, changes the approach to determining a variable interest entity’s (“VIE”) primary beneficiary, and requires companies to more frequently reassess whether they must consolidate VIEs. This guidance is effective as of the beginning of the first annual reporting period that begins after November 15, 2009. We do not expect the adoption of this guidance to have a material impact on our financial position, results of operations, or cash flows.
Revenue recognition
In March 2010, the FASB issued guidance related to revenue recognition that applies to arrangements with milestones relating to research or development deliverables. This guidance provides criteria that must be met to recognize consideration that is contingent upon achievement of a substantive milestone in its entirety in the period in which the milestone is achieved. This guidance is effective for us on August 1, 2010 and is not expected to have a material impact on our financial position, results of operations, or cash flows.
Critical Accounting Policies
Management’s discussion and analysis of our financial condition and results of operations are based on our consolidated financial statements, which have been prepared in accordance with accounting principles generally accepted in the United States of America. Our most critical accounting policies, and the estimates involved in their application, have a significant impact on the preparation of these consolidated financial statements. These policies involve significant estimates and judgments that affect the reported amounts of assets, liabilities, revenues and expense, and related disclosures of contingent assets and liabilities. We continue to evaluate our estimates and judgments on an on-going basis. By their nature, the policies discussed below require management to make its most difficult and subjective estimates and judgments, often on matters that are inherently uncertain. Our estimates and judgments are based on our historical experience, terms of existing contracts, our observance of trends in the industry, information provided by our customers, and information available from other outside sources, as appropriate.
For a complete discussion of our significant accounting policies, see Note 1, Summary of business operations and significant accounting policies, of the Notes to Consolidated Financial Statements, included in Item 15, Exhibits and Financial Statements Schedule, of this Annual Report on Form 10-K. We believe the following accounting policies require management to make the most difficult estimates and judgments in the preparation of our consolidated financial statements and accordingly are critical to an understanding of our financial statements.
Revenue Recognition
Policy—We provide engineering services to some of our customers on a contractual basis and generally recognize revenue using the percentage of completion method. We generally estimate the progress towards completion on contracts with a fixed-fee arrangement on a monthly basis utilizing costs incurred to date as a percentage of total estimated costs at completion of the project or on a milestone basis based on contractual terms, as appropriate. When total cost estimates exceed revenues, we accrue for the estimated losses immediately.
Judgments and Uncertainties—Our revenue recognition accounting methodology for engineering services with a fixed fee arrangement involves uncertainties because it requires management to make estimates of our total estimated costs at completion of projects. The timing of when revenue, profits, and loss reserves are recognized may fluctuate if changes to the estimates of costs at completion of projects are needed.
Effect if Actual Results Differ From Assumptions—We have not made any material changes in the accounting methodology used to determine our estimated costs at completion of projects during the past three fiscal years. If actual results are not consistent with our estimates or assumptions, we may be exposed to losses or gains that could be material.
35
Table of Contents
Allocation of Consideration in Multiple Element Revenue Arrangements
Policy—We allocate arrangement consideration to each deliverable in an arrangement based on its relative selling price. We determine selling price using VSOE, if it exists, and otherwise TPE. If neither VSOE nor TPE of selling price exists for a unit of accounting, we use ESP. We generally expect that we will not be able to establish TPE due to the nature of the markets in which we compete, and, as such, we typically will determine selling price using VSOE or if not available, ESP. If we are unable to establish selling price using VSOE or TPE, and the order was received or materially modified after July 31, 2009, we use ESP in the allocation of arrangement consideration. The objective of ESP is to determine the price at which we would transact if the product or service were sold by us on a standalone basis.
Judgments and Uncertainties—Our determination of ESP involves a weighting of several factors based on the specific facts and circumstances of the arrangement. Specifically, we will consider the cost to produce the deliverable, the anticipated margin on that deliverable, the selling price and profit margin for similar parts, our ongoing pricing strategy and policies (as evident in the price list as established and updated on a regular basis), the value of any enhancements that have been built into the deliverable and the characteristics of the varying markets in which the deliverable is sold.
Effect if Actual Results Differ From Assumptions—There is no risk of difference between the ESP and actual selling price since an actual selling price does not exist for the deliverables in these arrangements.
Inventory Reserves
Policy—We value our inventory at the lower of the cost of the inventory or fair market value through the establishment of inventory reserves. Management assesses the recoverability of inventory based on types and levels of inventory held, product life cycles, and changes in technology. A variety of methodologies are used to determine the amount of inventory reserves necessary for excess and obsolete inventory. Reserves are based upon the age of the inventory, lower of cost or market, along with significant management judgments concerning future demands for the inventory. If actual demand for our products is less than our estimates, or we experience a higher incidence of inventory obsolescence because of rapidly changing technology and customer requirements, additional reserves for existing inventories might be recorded in future periods. Once recorded, inventory valuation reserves are not subsequently reversed until the inventory is used or disposed of.
Judgments and uncertainties—Our inventory reserves involve uncertainties because the calculation requires management to make assumptions and to apply judgment regarding inventory aging, forecasted customer demand, and technological obsolescence.
Effect if actual results differ from assumptions—We have not made any material changes in the accounting methodology we use to establish our inventory reserves during the past three fiscal years. If estimates regarding customer demand are inaccurate or changes in technology affect demand for certain products in an unforeseen manner, we may be exposed to losses that could be material. A 10% difference in our actual reserves at July 31, 2010, would have affected net earnings by approximately $256 in fiscal year 2010.
Share-based compensation
Policy—We have share-based compensation plans, which include stock options and unvested restricted stock awards, and an employee stock purchase plan. We estimate the fair value of stock options using the Black-Scholes valuation model and the fair value of the Company’s restricted stock awards, which include shares of restricted stock and restricted stock units, based on the quoted market price of its common stock or the use of a Monte-Carlo Simulation Model.
We recognize the associated share-based compensation expense for time-based awards on a straight-line basis over the vesting periods of the awards, net of estimated forfeitures. Forfeiture rates are estimated based
36
Table of Contents
on historical pre-vesting forfeitures and are updated on the vesting dates to reflect actual forfeitures. The amount of share-based compensation expense for performance-based unvested restricted stock awards that is recognized on a straight-line basis over the performance period is based upon the number of shares that management ultimately expects to vest.
For performance-based awards with an earnings per share related target, management evaluates the probability of meeting the performance criteria at each balance sheet date and related compensation cost is amortized over the performance period on a straight-line basis because such awards vest only at the end of the measurement period. Changes to the probability assessment and the estimate of shares expected to vest will result in adjustments to the related share-based compensation expense that will be recorded in the period of the change. If the performance is not achieved, no compensation cost is recognized and any previously recognized compensation cost is reversed. For performance-based awards with a market condition related target, related compensation cost is amortized over the performance period on a straight-line basis, net of estimated forfeitures, regardless of whether the awards are ultimately earned.
Judgments and uncertainties—Option-pricing models and generally accepted valuation techniques require management to make assumptions and to apply judgment to determine the fair value of our awards. These assumptions and judgments include estimating the future volatility of our stock price, expected dividend yield, future employee turnover rates and future employee stock option exercise behaviors. Performance-based non-vested restricted stock awards require management to make assumptions regarding the likelihood of achieving company or personal performance goals. Changes in these assumptions can materially affect the fair value estimate and the amount of compensation expense we recognize.
Effect if actual results differ from assumptions—We have not made any material changes in the accounting methodology we use to determine our share-based compensation expense during the past three fiscal years. If actual results are not consistent with our estimates or assumptions, particularly those used in determining the accrual percentage for performance-based non-vested restricted stock awards, we may be exposed to changes in share-based compensation expense that could be material. A 10% change in our share-based compensation expense for the year ended July 31, 2010, would have affected net earnings by approximately $579 in fiscal year 2010.
Warranty Reserves
Policy—We estimate the costs of product warranties based on specific warranty claims, historical data, and engineering estimates, where applicable.
Judgments and uncertainties—Our warranty reserve involves uncertainties because the calculation requires management to make assumptions based on specific warranty claims, historical data, and engineering estimates, where applicable.
Effect if actual results differ from assumptions—We have not made any material changes in the accounting methodology we use to establish our warranty reserves during the past three fiscal years. If actual product failure rates or service delivery costs differ from our estimates, revisions to the estimated warranty liability would be required. Such revisions could adversely affect our operating results. A 10% change in our warranty reserve at July 31, 2010, would have affected net earnings by approximately $610 in fiscal year 2010.
Purchase Price Allocation For Business Combinations
Policy—We apply the purchase accounting method to account for business combinations, which requires extensive use of accounting estimates and judgments to assign the purchase price to the fair value of the assets and liabilities purchased, with the excess value, if any, being classified as goodwill. For those assets with finite lives, useful lives are assigned to those intangibles and their values are amortized over their remaining life.
37
Table of Contents
Judgments and uncertainties—Our purchase price allocation methodology involves uncertainties because it requires management to make assumptions and to apply judgment to estimate the fair value of acquired assets and liabilities. Management estimates the fair value of assets and liabilities based upon widely accepted valuation techniques, including discounted cash flows and market multiple analyses. Unanticipated events or circumstances may occur which could affect the accuracy of our fair value estimates, including assumptions regarding industry economic factors and business strategies.
Effect if actual results differ from assumptions—During the last three fiscal years, we completed one significant acquisition, which was the acquisition of Copley in April 2008 for $74,032, including transaction costs. See Note 3, Business combination, to the Notes to Consolidated Financial Statements, included in this Annual Report on Form 10-K, for the complete purchase price allocation. If actual results are not consistent with our estimates or assumptions, accelerated amortization for intangible assets with finite lives or impairment charges for intangible assets or goodwill could be required.
Impairment of Goodwill and Indefinite Lived Intangible Assets
Policy—We evaluate goodwill and indefinite lived intangible assets for impairment annually and whenever events or changes in circumstances indicate the carrying value of the goodwill or other intangible assets may not be recoverable. We conduct our impairment evaluation by performing internal valuation analyses, which consider both the market approach and income approach for goodwill and the relief from royalty approach for the indefinite lived intangible assets. Under the market approach, the fair value of the reporting unit is based on trading and acquisition multiples. Under the income approach, the fair value of the reporting unit is based on the present value of estimated future cash flows. Under the relief from royalty approach, the fair value of the indefinite lived intangible asset is based on after tax royalty rate and discount rate applied to future forecasted sales. In the second quarter of fiscal years 2010 and 2009, we completed our annual impairment testing of goodwill and indefinite lived intangible assets using the methodologies described herein, and determined there was no impairment.
The carrying values of goodwill and indefinite lived intangible assets related to the acquisition of Copley at July 31, 2010 were $1,849 and $7,607, respectively.
Judgments and uncertainties—The valuation analyses described above involve uncertainties because they require management to make assumptions and to apply judgment to estimate industry economic factors and the profitability of future business strategies. It is our policy to conduct impairment testing based on our current business strategy in light of present industry and economic conditions, as well as our future expectations.
Effect if actual results differ from assumptions—If actual results are not consistent with our estimates or assumptions, we may be exposed to an impairment charge that could be material. A 10% change in our calculation of the reporting unit’s fair value at December 31, 2009 would have had no effect on net earnings in fiscal year 2010.
Income tax contingencies
Policy—Our income tax returns, like those of most companies, are periodically audited by domestic and foreign tax authorities. These audits include questions regarding our tax filing positions, including the timing and amount of deductions and the allocation of income among various tax jurisdictions. At any one time, multiple tax years are subject to audit by the various tax authorities. In evaluating the exposures associated with our various tax filing positions, we record a liability for exposures subject to a minimum threshold of more likely than not before any benefit is recognized. A number of years may elapse before a particular matter, for which we have established a liability, is audited and fully resolved or clarified. We adjust our liability for unrecognized tax benefits and income tax provision in the period in which an uncertain tax position is effectively settled, the statute of limitations expires for the relevant taxing authority to examine the tax position or when more information becomes available.
38
Table of Contents
In fiscal year 2008, we adopted guidance, which requires management to perform a two-step evaluation of all tax positions, ensuring that these tax return positions meet the “more likely than not” recognition threshold and can be measured with sufficient precision to determine the benefit recognized in the financial statements. These evaluations provide management with a comprehensive model for how a company should recognize, measure, present, and disclose in its financial statements certain tax positions that we have taken or expect to take on our income tax returns.
Judgments and uncertainties—Our liability for unrecognized tax benefits involves uncertainties because management is required to make assumptions and to apply judgment to estimate the exposures associated with our various filing positions.
Effect if actual results differ from assumptions—Although we believe that the judgments and estimates discussed herein are reasonable, actual results could differ, and we may be exposed to losses or gains that could be material. To the extent we prevail in matters for which a liability has been established, or are required to pay amounts in excess of our established liability, the effective income tax rate in a given financial statement period could be materially affected. An unfavorable tax settlement generally would require use of our cash and result in an increase in our effective income tax rate in the period of resolution. A favorable tax settlement would be recognized as a reduction in our effective income tax rate in the period of resolution.
Deferred tax valuation allowances
Policy—We are required to estimate our income taxes in each of the jurisdictions within which we operate. This process involves assessing temporary differences resulting from different treatment of items for tax and accounting purposes. These differences result in deferred tax assets and liabilities, which are included within the balance sheet. We must then assess the likelihood that the deferred tax assets will be recovered from future taxable income and, to the extent that recovery is not more than likely, a valuation allowance must be established. To the extent a valuation allowance is established, we must include an expense within the tax provision in the statement of operations.
Judgments and uncertainties—Our effective income tax rate is affected by changes in tax law, the tax jurisdiction of new business ventures, the level of earnings, and the results of tax audits. Our deferred tax valuation allowances involve uncertainties because the calculations require management to make assumptions based on historical data, future book income, and tax-planning strategies.
Effect if actual results differ from assumptions—We have not made any material changes in the accounting methodology we use to establish our deferred tax asset valuation allowances during the past three fiscal years. In the event that actual results differ from the estimates and assumptions we use in determining our effective tax rate, the provision for income taxes and results of operations could be materially impacted.
| Item 7A. | Quantitative and Qualitative Disclosures About Market Risk |
All dollar amounts in this Item 7A are in thousands.
Certain of our foreign operations enter into transactions in currencies other than their functional currency, primarily the U.S. dollar and the Euro. We also have foreign currency exposure arising from the translation of our net equity investment in our foreign operations to U.S. dollars. We generally view our investments in foreign operations with functional currencies other than the U.S. dollar as long-term. The currencies to which we are exposed are the British pound, Chinese yuan, Canadian dollar, Danish kroner, and Euro. A 10% depreciation in the July 31, 2010 and 2009 functional currencies, relative to the U.S. dollar, would result in a reduction of stockholders’ equity of approximately $700 and $1,200, respectively.
We place our cash investments in high quality financial instruments and, by policy, limit the amount of credit exposure to any one financial institution. Our cash and investments include cash equivalents, which we
39
Table of Contents
consider to be investments purchased with original maturities of three months or less. Investments having original maturities in excess of three months are stated at amortized cost, which approximates fair value, and are classified as held to maturity. Total interest income for fiscal year 2010 was $636. An interest rate change of 10% would not have a material impact on the fair value of our portfolio or on future earnings.
| Item 8. | Financial Statements and Supplementary Data |
The financial statements and supplementary data are listed under Part IV, Item 15 in this Annual Report on Form 10-K and are included at the end of this Annual Report on Form 10-K.
| Item 9. | Changes in and Disagreements with Accountants on Accounting and Financial Disclosure |
Not applicable.
| Item 9A. | Controls and Procedures |
Disclosure Controls and Procedures
Our management, with the participation of our chief executive officer and chief financial officer, evaluated the effectiveness of our disclosure controls and procedures as of July 31, 2010. The term “disclosure controls and procedures”, as defined in Rules 13a-15(e) and 15d-15(e) under the Securities Exchange Act of 1934, as amended (the “Exchange Act”), means controls and other procedures of a company that are designed to ensure that information required to be disclosed by the company in the reports that its files or submits under the Exchange Act is recorded, processed, summarized, and reported, within the time periods specified in the SEC’s rules and forms. Disclosure controls and procedures include, without limitation, controls and procedures designed to ensure that information required to be disclosed by a company in the reports that it files or submits under the Exchange Act is accumulated and communicated to the company’s management, including its principal executive officer and principal financial officer, as appropriate, to allow timely decisions to be made regarding required disclosure. It should be noted that any system of controls and procedures, however well designed and operated, can provide only reasonable, and not absolute, assurance that the objectives of the system are met and that management necessarily applies its judgment in evaluating the cost-benefit relationship of possible controls and procedures. Based on the evaluation of our disclosure controls and procedures as of July 31, 2010, our chief executive officer and chief financial officer concluded that, as of such date, our disclosure controls and procedures were effective at the reasonable assurance level.
Management’s Annual Report on Internal Control over Financial Reporting
Our management is responsible for establishing and maintaining adequate internal control over financial reporting (as defined in Rules 13a-15(f) and 15d-15(f) under the Exchange Act). A company’s internal control over financial reporting is a process designed to provide reasonable assurance regarding the reliability of financial reporting and the preparation of financial statements for external purposes in accordance with generally accepted accounting principles. Internal control over financial reporting includes those policies and procedures that (i) pertain to the maintenance of records that, in reasonable detail, accurately and fairly reflect the transactions and dispositions of the assets of the company; (ii) provide reasonable assurance that transactions are recorded as necessary to permit preparation of financial statements in accordance with generally accepted accounting principles, and that receipts and expenditures of the company are being made only in accordance with authorizations of management and directors of the company; and (iii) provide reasonable assurance regarding prevention or timely detection of unauthorized acquisition, use, or disposition of the company’s assets that could have a material effect on the interim or annual consolidated financial statements. Because of its inherent limitations, internal control over financial reporting may not prevent or detect misstatements. Also, projections of any evaluation of effectiveness to future periods are subject to the risk that controls may become inadequate
40
Table of Contents
because of changes in conditions, or that the degree of compliance with the policies or procedures may deteriorate.
Our management, with the participation of our chief executive officer and chief financial officer, conducted an evaluation of the effectiveness of our internal control over financial reporting as of July 31, 2010, based on the framework in Internal Control Integrated Framework issued by the Committee of Sponsoring Organizations of the Treadway Commission. Based on this assessment, our management concluded that, as of July 31, 2010, our internal control over financial reporting was effective based on those criteria.
The effectiveness of our internal control over financial reporting as of July 31, 2010 has been audited by PricewaterhouseCoopers LLP, an independent registered public accounting firm, as stated in their report which appears herein.
Changes in Internal Control Over Financial Reporting
There were no changes to our internal control over financial reporting during the fourth quarter ended July 31, 2010 that have materially affected, or are reasonably likely to materially affect, our internal control over financial reporting.
| Item 9B. | Other Information |
Not applicable.
41
Table of Contents
| Item 10. | Directors, Executive Officers and Corporate Governance |
We will furnish to the SEC a definitive proxy statement for our 2011 Annual Meeting of Stockholders not later than 120 days after the close of fiscal year 2010 (the “Proxy Statement”). Certain information required by this item is incorporated herein by reference to the Proxy Statement under the captions “Proposal 1 – Election of Directors”, “Corporate Governance” and “Section 16(a) Beneficial Ownership Reporting Compliance”. Also see “Executive Officers of the Registrant” in Part I of this Annual Report on Form 10-K.
We have a code of ethics that applies to all of our employees and non-employee directors. This code (available on our website) satisfies the requirements set forth in Item 406 of Regulation S-K and applies to all relevant persons set forth therein. We intend to disclose on our website at www.analogic.com amendments to, and, if applicable, waivers of, our code of ethics.
| Item 11. | Executive Compensation |
The information required by this item is incorporated herein by reference to the Proxy Statement under the captions “Executive Compensation”, “Director Compensation”, “Compensation Committee Interlocks and Insider Participation” and “Compensation Committee Report”.
| Item 12. | Security Ownership of Certain Beneficial Owners and Management and Related Stockholder Matters |
The information required by this item is incorporated herein by reference to the Proxy Statement under the captions “Security Ownership of Certain Beneficial Owners, Directors, and Management” and “Securities Authorized for Issuance Under Equity Compensation Plans”.
| Item 13. | Certain Relationships and Related Transactions, and Director Independence |
The information required by this item is incorporated herein by reference to the Proxy Statement under the captions “Corporate Governance” and “Certain Relationships and Related Transactions”.
| Item 14. | Principal Accountant Fees and Services |
The information required by this item is incorporated herein by reference to the Proxy Statement under the caption “Independent Registered Public Accounting Firm’s Fees”.
42
Table of Contents
| Item 15. | Exhibits and Financial Statement Schedules |
| Page Number | ||||||
| (a) |
||||||
| 1. | Financial Statements | |||||
| Report of Independent Registered Public Accounting Firm | 45 | |||||
| Consolidated Balance Sheets at July 31, 2010 and 2009 | 46 | |||||
| Consolidated Statements of Operations for the years ended July 31, 2010, 2009, and 2008 | 47 | |||||
| Consolidated Statements of Changes in Stockholders’ Equity for the years ended July 31, 2010, 2009, and 2008 | 48 | |||||
| Consolidated Statements of Cash Flows for the years ended July 31, 2010, 2009, and 2008 | 49 | |||||
| Notes to Consolidated Financial Statements | 50 | |||||
| 2. | Financial Statement Schedule II—Valuation and Qualifying Accounts | 87 | ||||
| Other schedules have been omitted because they are not required, not applicable, or the required information is furnished in the consolidated statements or notes hereto |
(b) The Index to Exhibits immediately following the Company’s Financial Statements and Financial Statement Schedule II is incorporated herein by reference.
43
Table of Contents
Pursuant to the requirements of Section 13 or 15(d) of the Securities Exchange Act of 1934, the registrant has duly caused this report to be signed on its behalf by the undersigned, thereunto duly authorized.
| ANALOGIC CORPORATION | ||||||
| By |
/s/ JAMES W. GREEN | |||||
| Date: September 23, 2010 |
James W. Green President and Chief Executive Officer | |||||
Pursuant to the requirements of the Securities Exchange Act of 1934, this report has been signed below by the following persons on behalf of the registrant and in the capacities and on the dates indicated.
| Name |
Title |
Date | ||
| /s/ JAMES. W. GREEN James W. Green |
President and Chief Executive Officer (Principal Executive Officer) and Director | September 23, 2010 | ||
| /s/ MICHAEL L. LEVITZ Michael L. Levitz |
Vice President, Chief Financial Officer, and Treasurer (Principal Financial Officer) |
September 23, 2010 | ||
| /s/ DONALD B. MELSON Donald B. Melson |
Vice President - Corporate Controller (Principal Accounting Officer) | September 23, 2010 | ||
| /s/ EDWARD F. VOBORIL Edward F. Voboril |
Chairman of the Board | September 23, 2010 | ||
| /s/ GERALD L. WILSON Gerald L. Wilson |
Vice Chairman of the Board | September 23, 2010 | ||
| /s/ BERNARD C. BAILEY Bernard C. Bailey |
Director | September 23, 2010 | ||
| /s/ JEFFREY P. BLACK Jeffrey P. Black |
Director | September 23, 2010 | ||
| /s/ M. ROSS BROWN M. Ross Brown |
Director | September 23, 2010 | ||
| /s/ JAMES J. JUDGE James J. Judge |
Director | September 23, 2010 | ||
| /s/ KEVIN C. MELIA Kevin C. Melia |
Director | September 23, 2010 | ||
| /s/ MICHAEL T. MODIC Michael T. Modic |
Director | September 23, 2010 | ||
| /s/ FRED B. PARKS Fred B. Parks |
Director | September 23, 2010 | ||
| /s/ SOPHIE V. VANDEBROEK Sophie V. Vandebroek |
Director | September 23, 2010 | ||
44
Table of Contents
REPORT OF INDEPENDENT REGISTERED PUBLIC ACCOUNTING FIRM
To Board of Directors and Stockholders of Analogic Corporation:
In our opinion, the consolidated financial statements listed in the index appearing under Item 15(a)(1) present fairly, in all material respects, the financial position of Analogic Corporation and its subsidiaries at July 31, 2010 and July 31, 2009, and the results of their operations and their cash flows for each of the three years in the period ended July 31, 2010 in conformity with accounting principles generally accepted in the United States of America. In addition, in our opinion, the financial statement schedule listed in the index appearing under Item 15(a)(2) present fairly, in all material respects, the information set forth therein when read in conjunction with the related consolidated financial statements. Also in our opinion, the Company maintained, in all material respects, effective internal control over financial reporting as of July 31, 2010, based on criteria established in Internal Control—Integrated Framework issued by the Committee of Sponsoring Organizations of the Treadway Commission (COSO). The Company’s management is responsible for these financial statements and financial statement schedule, for maintaining effective internal control over financial reporting and for its assessment of the effectiveness of internal control over financial reporting, included in Management’s Report on Internal Control over Financial Reporting appearing under Item 9A. Our responsibility is to express opinions on these financial statements, on the financial statement schedule, and on the Company’s internal control over financial reporting based on our integrated audits. We conducted our audits in accordance with the standards of the Public Company Accounting Oversight Board (United States). Those standards require that we plan and perform the audits to obtain reasonable assurance about whether the financial statements are free of material misstatement and whether effective internal control over financial reporting was maintained in all material respects. Our audits of the financial statements included examining, on a test basis, evidence supporting the amounts and disclosures in the financial statements, assessing the accounting principles used and significant estimates made by management, and evaluating the overall financial statement presentation. Our audit of internal control over financial reporting included obtaining an understanding of internal control over financial reporting, assessing the risk that a material weakness exists, and testing and evaluating the design and operating effectiveness of internal control based on the assessed risk. Our audits also included performing such other procedures as we considered necessary in the circumstances. We believe that our audits provide a reasonable basis for our opinions.
A company’s internal control over financial reporting is a process designed to provide reasonable assurance regarding the reliability of financial reporting and the preparation of financial statements for external purposes in accordance with generally accepted accounting principles. A company’s internal control over financial reporting includes those policies and procedures that (i) pertain to the maintenance of records that, in reasonable detail, accurately and fairly reflect the transactions and dispositions of the assets of the company; (ii) provide reasonable assurance that transactions are recorded as necessary to permit preparation of financial statements in accordance with generally accepted accounting principles, and that receipts and expenditures of the company are being made only in accordance with authorizations of management and directors of the company; and (iii) provide reasonable assurance regarding prevention or timely detection of unauthorized acquisition, use, or disposition of the company’s assets that could have a material effect on the financial statements.
Because of its inherent limitations, internal control over financial reporting may not prevent or detect misstatements. Also, projections of any evaluation of effectiveness to future periods are subject to the risk that controls may become inadequate because of changes in conditions, or that the degree of compliance with the policies or procedures may deteriorate.
PricewaterhouseCoopers LLP
Boston, Massachusetts
September 23, 2010
45
Table of Contents
CONSOLIDATED BALANCE SHEETS
(In thousands, except share data)
| July 31, | ||||||
| 2010 | 2009 | |||||
| Assets | ||||||
| Current assets: |
||||||
| Cash and cash equivalents |
$ | 169,254 | $ | 119,855 | ||
| Marketable securities, at fair value |
— | 40,438 | ||||
| Accounts receivable, net of allowance for doubtful accounts of $616 and $728 as of July 31, 2010 and 2009, respectively |
74,493 | 64,874 | ||||
| Inventories |
86,060 | 79,011 | ||||
| Refundable and deferred income taxes |
8,860 | 11,131 | ||||
| Other current assets |
13,129 | 8,982 | ||||
| Total current assets |
351,796 | 324,291 | ||||
| Property, plant, and equipment, net |
78,613 | 83,688 | ||||
| Capitalized software, net |
3,223 | 5,037 | ||||
| Intangible assets, net |
39,761 | 40,792 | ||||
| Goodwill |
1,849 | 2,043 | ||||
| Other assets |
1,630 | 328 | ||||
| Deferred income tax assets |
8,904 | 7,935 | ||||
| Total Assets |
$ | 485,776 | $ | 464,114 | ||
| Liabilities and Stockholders’ Equity | ||||||
| Current liabilities: |
||||||
| Accounts payable |
$ | 24,813 | $ | 22,064 | ||
| Accrued liabilities |
33,291 | 30,330 | ||||
| Advance payments and deferred revenue |
9,048 | 7,757 | ||||
| Accrued income taxes |
2,917 | — | ||||
| Total current liabilities |
70,069 | 60,151 | ||||
| Long-term liabilities: |
||||||
| Accrued income taxes |
4,777 | 5,541 | ||||
| Other long-term liabilities |
1,528 | 903 | ||||
| Deferred income tax liabilities |
360 | — | ||||
| Total long-term liabilities |
6,665 | 6,444 | ||||
| Commitments, guarantees, and contingencies (Notes 10 and 11) |
||||||
| Stockholders’ equity: |
||||||
| Common stock, $.05 par value; 30,000,000 shares authorized and 12,884,708 shares issued and outstanding as of July 31, 2010; 30,000,000 shares authorized and 12,808,734 shares issued and outstanding as of July 31, 2009 |
645 | 640 | ||||
| Capital in excess of par value |
77,085 | 70,704 | ||||
| Retained earnings |
326,590 | 316,079 | ||||
| Accumulated other comprehensive income |
4,722 | 10,096 | ||||
| Total stockholders’ equity |
409,042 | 397,519 | ||||
| Total Liabilities and Stockholders’ Equity |
$ | 485,776 | $ | 464,114 | ||
The accompanying notes are an integral part of these consolidated financial statements.
46
Table of Contents
CONSOLIDATED STATEMENTS OF OPERATIONS
(In thousands, except per share data)
| Year Ended July 31, | |||||||||||
| 2010 | 2009 | 2008 | |||||||||
| Net revenue: |
|||||||||||
| Product |
$ | 393,765 | $ | 365,770 | $ | 388,506 | |||||
| Engineering |
21,048 | 21,090 | 14,089 | ||||||||
| Other |
8,784 | 9,289 | 10,914 | ||||||||
| Total net revenue |
423,597 | 396,149 | 413,509 | ||||||||
| Cost of sales: |
|||||||||||
| Product |
248,350 | 242,857 | 240,657 | ||||||||
| Engineering |
18,566 | 21,398 | 14,480 | ||||||||
| Other |
6,600 | 6,698 | 7,274 | ||||||||
| Total cost of sales |
273,516 | 270,953 | 262,411 | ||||||||
| Gross margin |
150,081 | 125,196 | 151,098 | ||||||||
| Operating expenses: |
|||||||||||
| Research and product development |
49,150 | 45,276 | 48,947 | ||||||||
| Selling and marketing |
37,653 | 37,320 | 34,528 | ||||||||
| General and administrative |
41,593 | 40,166 | 39,296 | ||||||||
| Restructuring and voluntary retirement charges |
690 | 6,619 | 4,016 | ||||||||
| Total operating expenses |
129,086 | 129,381 | 126,787 | ||||||||
| Income (loss) from operations |
20,995 | (4,185 | ) | 24,311 | |||||||
| Other income (expense): |
|||||||||||
| Interest income, net |
636 | 2,573 | 7,935 | ||||||||
| Gain on sale of other investments |
— | 838 | 2,084 | ||||||||
| Other, net |
(487 | ) | (436 | ) | 715 | ||||||
| Total other income |
149 | 2,975 | 10,734 | ||||||||
| Income (loss) before income taxes |
21,144 | (1,210 | ) | 35,045 | |||||||
| Provision for (benefit from) income taxes |
5,589 | (4,915 | ) | 11,559 | |||||||
| Net income |
$ | 15,555 | $ | 3,705 | $ | 23,486 | |||||
| Net income per share: |
|||||||||||
| Basic |
$ | 1.24 | $ | 0.29 | $ | 1.78 | |||||
| Diluted |
$ | 1.23 | $ | 0.29 | $ | 1.77 | |||||
| Weighted average shares outstanding: |
|||||||||||
| Basic |
12,584 | 12,835 | 13,180 | ||||||||
| Diluted |
12,655 | 12,932 | 13,290 | ||||||||
The accompanying notes are an integral part of these consolidated financial statements.
47
Table of Contents
CONSOLIDATED STATEMENTS OF CHANGES IN STOCKHOLDERS’ EQUITY
Years Ended July 31, 2010, 2009, and 2008
(In thousands, except share data)
| Common Stock | Capital in Excess of Par Value |
Retained Earnings |
Accumulated Other Comprehensive Income |
Total | |||||||||||||||||
| Shares | Amount | ||||||||||||||||||||
| Balance, July 31, 2007 |
13,237,554 | $ | 662 | $ | 64,186 | $ | 318,284 | $ | 10,225 | $393,357 | |||||||||||
| Shares issued for: |
|||||||||||||||||||||
| Stock options exercised |
64,560 | 3 | 2,657 | — | — | 2,660 | |||||||||||||||
| Restricted stock grants, net of cancellations |
138,629 | 7 | (458 | ) | — | — | (451) | ||||||||||||||
| Stock purchase plan |
6,897 | — | 389 | — | — | 389 | |||||||||||||||
| Tax benefit of share-based compensation |
— | — | 435 | — | — | 435 | |||||||||||||||
| Share-based compensation expense |
— | — | 3,384 | — | — | 3,384 | |||||||||||||||
| Dividends paid ($0.40 per share) |
— | — | — | (5,340 | ) | — | (5,340) | ||||||||||||||
| Cumulative effect of a change in accounting principle (Note 14) |
— | — | — | 2,239 | — | 2,239 | |||||||||||||||
| Comprehensive income: |
|||||||||||||||||||||
| Net income for the year |
— | — | — | 23,486 | — | 23,486 | |||||||||||||||
| Actuarial gain on pension plan (net of tax provision of $178) |
— | — | — | — | 271 | 271 | |||||||||||||||
| Translation adjustments (net of tax provision of $162) |
— | — | — | — | 8,076 | 8,076 | |||||||||||||||
| Total comprehensive income |
31,833 | ||||||||||||||||||||
| Balance, July 31, 2008 |
13,447,640 | 672 | 70,593 | 338,669 | 18,572 | 428,506 | |||||||||||||||
| Shares issued for: |
|||||||||||||||||||||
| Stock options exercised |
4,475 | — | 198 | — | — | 198 | |||||||||||||||
| Restricted stock grants, net of cancellations |
79,263 | 4 | (313 | ) | — | — | (309) | ||||||||||||||
| Stock purchase plan |
14,050 | 1 | 320 | — | — | 321 | |||||||||||||||
| Provision for share-based compensation |
— | — | (188 | ) | — | — | (188) | ||||||||||||||
| Share-based compensation expense |
— | — | 3,968 | — | — | 3,968 | |||||||||||||||
| Repurchase of common stock |
(736,694 | ) | (37 | ) | (3,874 | ) | (21,111 | ) | — | (25,022) | |||||||||||
| Dividends paid ($0.40 per share) |
— | — | — | (5,184 | ) | — | (5,184) | ||||||||||||||
| Comprehensive loss: |
|||||||||||||||||||||
| Net income for the year |
— | — | — | 3,705 | — | 3,705 | |||||||||||||||
| Actuarial loss on pension plan (net of tax benefit of $1,309) |
— | — | — | — | (1,998 | ) | (1,998) | ||||||||||||||
| Translation adjustments (net of tax benefit of $264) |
— | — | — | — | (6,478 | ) | (6,478) | ||||||||||||||
| Total comprehensive loss |
(4,771) | ||||||||||||||||||||
| Balance, July 31, 2009 |
12,808,734 | 640 | 70,704 | 316,079 | 10,096 | 397,519 | |||||||||||||||
| Shares issued for: |
|||||||||||||||||||||
| Stock options exercised |
17,883 | 1 | 691 | — | — | 692 | |||||||||||||||
| Restricted stock grants, net of cancellations |
46,974 | 4 | (304 | ) | — | — | (300) | ||||||||||||||
| Stock purchase plan |
11,117 | — | 350 | — | — | 350 | |||||||||||||||
| Provision for share-based compensation |
— | — | (147 | ) | — | — | (147) | ||||||||||||||
| Share-based compensation expense |
— | — | 5,791 | — | — | 5,791 | |||||||||||||||
| Dividends paid ($0.40 per share) |
— | — | — | (5,044 | ) | — | (5,044) | ||||||||||||||
| Comprehensive income: |
|||||||||||||||||||||
| Net income for the year |
— | — | — | 15,555 | — | 15,555 | |||||||||||||||
| Actuarial loss on pension plan (net of tax provision of $90) |
— | — | — | — | (191 | ) | (191) | ||||||||||||||
| Translation adjustments (net of tax provision of $508) |
— | — | — | — | (5,183 | ) | (5,183) | ||||||||||||||
| Total comprehensive income |
10,181 | ||||||||||||||||||||
| Balance, July 31, 2010 |
12,884,708 | $ | 645 | $ | 77,085 | $ | 326,590 | $ | 4,722 | $409,042 | |||||||||||
The accompanying notes are an integral part of these consolidated financial statements.
48
Table of Contents
CONSOLIDATED STATEMENTS OF CASH FLOWS
(In thousands)
| Year Ended July 31, | ||||||||||||
| 2010 | 2009 | 2008 | ||||||||||
| OPERATING ACTIVITIES: |
||||||||||||
| Net income |
$ | 15,555 | $ | 3,705 | $ | 23,486 | ||||||
| Adjustments to reconcile net income to net cash provided by operating activities: |
||||||||||||
| (Benefit from) provision for deferred income taxes |
(2,216 | ) | (1,164 | ) | 5,836 | |||||||
| Depreciation and amortization |
17,569 | 17,964 | 15,620 | |||||||||
| Allowance for doubtful accounts and notes receivable |
112 | 270 | (29 | ) | ||||||||
| Gain on sale of other investments |
— | (838 | ) | (2,084 | ) | |||||||
| Net loss (gain) on sale of property, plant, and equipment |
26 | (73 | ) | (197 | ) | |||||||
| Restructuring and voluntary retirement charges |
690 | 6,619 | 4,016 | |||||||||
| Share-based compensation expense |
5,791 | 3,968 | 3,384 | |||||||||
| Excess tax provision for (benefit from) share-based compensation |
146 | 189 | (366 | ) | ||||||||
| Net changes in operating assets and liabilities, net of acquired business (Note 16) |
(10,556 | ) | (13,912 | ) | (1,856 | ) | ||||||
| NET CASH PROVIDED BY OPERATING ACTIVITIES |
27,117 | 16,728 | 47,810 | |||||||||
| INVESTING ACTIVITIES: |
||||||||||||
| Investments in and advances to affiliated companies |
(1,920 | ) | (2 | ) | 17 | |||||||
| Additions to property, plant, and equipment |
(9,407 | ) | (10,230 | ) | (14,688 | ) | ||||||
| Acquisition of business, net of cash acquired |
— | (350 | ) | (73,682 | ) | |||||||
| Capitalized software development costs |
(461 | ) | (1,672 | ) | (2,719 | ) | ||||||
| Purchase of short-term held-to-maturity marketable securities |
— | (220,945 | ) | (131,223 | ) | |||||||
| Maturities of short-term held-to-maturity marketable securities |
40,438 | 193,037 | 118,693 | |||||||||
| Maturities of short-term available-for-sale marketable securities |
— | — | 2,000 | |||||||||
| Proceeds from the sale of other investments |
— | 838 | 2,084 | |||||||||
| Proceeds from the sale of property, plant, and equipment |
249 | 829 | 468 | |||||||||
| NET CASH PROVIDED BY (USED FOR) INVESTING ACTIVITIES |
28,899 | (38,495 | ) | (99,050 | ) | |||||||
| FINANCING ACTIVITIES: |
||||||||||||
| Issuance of stock pursuant to exercise of stock options, employee stock purchase plan, and non-employee director stock plan |
670 | 210 | 2,598 | |||||||||
| Excess tax (benefit from) provision for share-based compensation |
(146 | ) | (189 | ) | 366 | |||||||
| Purchase of common stock |
— | (25,022 | ) | — | ||||||||
| Dividends paid to shareholders |
(5,044 | ) | (5,184 | ) | (5,340 | ) | ||||||
| NET CASH USED FOR FINANCING ACTIVITIES |
(4,520 | ) | (30,185 | ) | (2,376 | ) | ||||||
| EFFECT OF EXCHANGE RATE CHANGES ON CASH |
(2,097 | ) | (2,105 | ) | 983 | |||||||
| NET INCREASE (DECREASE) IN CASH AND CASH EQUIVALENTS |
49,399 | (54,057 | ) | (52,633 | ) | |||||||
| CASH AND CASH EQUIVALENTS, BEGINNING OF PERIOD |
119,855 | 173,912 | 226,545 | |||||||||
| CASH AND CASH EQUIVALENTS, END OF PERIOD |
$ | 169,254 | $ | 119,855 | $ | 173,912 | ||||||
| Supplemental disclosures of cash flow information: |
||||||||||||
| Refunds received (cash paid) for income taxes, net |
$ | (3,183 | ) | $ | 8,892 | $ | (9,362 | ) | ||||
| Interest paid |
— | — | 1 | |||||||||
The accompanying notes are an integral part of these consolidated financial statements.
49
Table of Contents
NOTES TO CONSOLIDATED FINANCIAL STATEMENTS
(In thousands, except share and per share data)
1. Summary of business operations and significant accounting policies:
Business operations:
Analogic Corporation (the “Company”) was incorporated in the Commonwealth of Massachusetts in November 1967. The Company is a high technology company that designs and manufactures advanced medical imaging and security systems and subsystems sold to Original Equipment Manufacturers (“OEMs”) and end users primarily in the healthcare and airport security markets. The Company is recognized worldwide for advancing state-of-the-art technology in the areas of medical Computed Tomography (“CT”), Magnetic Resonance Imaging (“MRI”), Digital Mammography, Specialized Ultrasound, and Automatic Explosives Detection Systems for airport security. The Company’s OEM customers incorporate its technology into systems they in turn sell for various medical and security applications. The Company also sells its ultrasound products directly into specialized clinical end-user markets through its direct worldwide sales force under the brand name B-K Medical (“B-K Medical”).
The Company reports its financial condition and results of operations on a fiscal year basis ending on July 31 st of each year.
Significant accounting policies:
(a) Principles of consolidation:
The consolidated financial statements include the accounts of the Company and its subsidiaries, all of which are wholly owned. Investments in companies in which ownership interests range from 10 to 50 percent, and the Company exercises significant influence over the investee’s operating and financial policies, are accounted for using the equity method. Other investments are accounted for using the cost method. All intercompany accounts and transactions have been eliminated.
(b) Inventories:
The Company values inventory at the lower of cost or market using the first-in, first-out (FIFO) method. Management assesses the recoverability of inventory based on types and levels of inventory held, product life cycle, and changes in technology. A variety of methodologies are used to determine the amount of inventory reserves necessary for excess and obsolete inventory. The reserves are based upon the age of the inventory, lower of cost or market, along with other significant management judgments concerning future demands for the inventory. Once recorded, inventory valuation provisions are not subsequently reversed, unless the inventory is used or disposed of.
(c) Property, plant, and equipment:
Property, plant, and equipment is recorded at cost and depreciated using the straight-line method over their estimated useful lives. Leasehold improvements are amortized over the shorter of their estimated useful lives or the term of the respective leases. Upon retirement or disposal, the cost of the asset disposed of and the related accumulated depreciation are removed from the accounts and any gain or loss is reflected in the Company’s Statements of Operations. Expenditures for maintenance and repairs are charged to expense when incurred while the costs of significant improvements, which extend the life of the underlying asset, are capitalized.
50
Table of Contents
ANALOGIC CORPORATION
NOTES TO CONSOLIDATED FINANCIAL STATEMENTS
(Continued)
The annual provisions for depreciation and amortization have been computed in accordance with the following ranges of estimated useful lives:
| Buildings |
35 to 40 years | |
| Manufacturing equipment |
4 to 7 years | |
| Furniture, fixtures, and computer equipment |
3 to 8 years | |
| Leasehold improvements |
shorter of useful life or the lease term | |
| Motor vehicles |
3 to 5 years |
The Company reviews property, plant, and equipment for impairment whenever events or changes in circumstances indicate that the carrying amount of assets may not be recoverable. Recoverability of these assets is measured by comparison of their carrying amount to the future undiscounted cash flows the assets are expected to generate over their remaining economic lives. If such assets are considered to be impaired, the impairment to be recognized in earnings equals the amount by which the carrying value of the assets exceeds their fair market value determined by either a quoted market price, if any, or a value determined by utilizing a discounted cash flow technique. If such assets are not impaired, but their useful lives have decreased, the remaining net book value is amortized over the revised useful life.
Property, plant, and equipment consisted of the following:
| July 31, | ||||||||
| 2010 | 2009 | |||||||
| Property, plant, and equipment: |
||||||||
| Land and land improvements |
$ | 6,515 | $ | 6,795 | ||||
| Building and improvements |
71,465 | 72,599 | ||||||
| Leasehold and capital lease improvements |
10,008 | 9,029 | ||||||
| Manufacturing equipment |
130,652 | 126,829 | ||||||
| Furniture, fixtures, and computer equipment |
57,145 | 55,897 | ||||||
| Motor vehicles |
1,643 | 1,987 | ||||||
| 277,428 | 273,136 | |||||||
| Less accumulated depreciation and amortization |
(198,815 | ) | (189,448 | ) | ||||
| $ | 78,613 | $ | 83,688 | |||||
Total depreciation of property, plant, and equipment was $12,717, $13,373, and $12,209 for fiscal years 2010, 2009, and 2008, respectively. The Company did not capitalize any interest in fiscal years 2010, 2009, or 2008.
(d) Revenue recognition and accounts receivable:
The Company recognizes revenue related to product sales upon shipment provided that title and risk of loss have passed to the customer, there is persuasive evidence of an arrangement, the sales price is fixed or determinable, collection of the related receivable is reasonably assured and customer acceptance criteria, if any, have been successfully demonstrated. For product sales with acceptance criteria that are not successfully demonstrated prior to shipment, revenue is recognized upon customer acceptance, provided all other revenue recognition criteria have been met. The Company’s sales contracts generally provide for the customer to accept title and risk of loss when the product leaves the Company’s facilities. When shipping terms or local laws do not allow for passage of title and risk of loss at the shipping point, the Company defers recognizing revenue until title
51
Table of Contents
ANALOGIC CORPORATION
NOTES TO CONSOLIDATED FINANCIAL STATEMENTS
(Continued)
and risk of loss transfer to the customer. The Company classifies shipping and handling invoiced to customers as revenue and the related costs in cost of sales. Sales and other taxes collected from customers and subsequently remitted to government authorities are recorded as accounts receivable with a corresponding offset recorded to sales taxes payable. These balances are removed from the consolidated balance sheet when the cash is remitted to the tax authority. The Company includes service revenue, related primarily to extended warranty contracts and repairs, in the product revenue line item of its Consolidated Statement of Operations, as they are deemed immaterial for separate classification.
The Company’s transactions sometimes involve multiple elements (i.e., products and services). At the inception of an agreement, the Company allocates arrangement consideration to each deliverable qualifying as a separate unit of accounting in an arrangement based on its relative selling price. The Company determines selling price using vendor specific objective evidence (“VSOE”), if it exists, and otherwise third party evidence (“TPE”). If neither VSOE nor TPE of selling price exists for a unit of accounting, the Company uses estimated selling price (“ESP”). The Company generally expects that it will not be able to establish TPE due to the nature of the markets in which the Company competes, and, as such, the Company typically will determine selling price using VSOE or if not available, ESP.
VSOE is generally limited to the price charged when the same or similar product or service is sold separately or, if applicable, the stated substantive renewal rate in the agreement. If a product or service is seldom sold separately, it is unlikely that the Company can determine VSOE for the product or service. The Company defines VSOE as a median price of recent standalone transactions that are priced within a narrow range, as defined by the Company, or stated renewal rates in contracts.
TPE is determined based on the prices charged by competitors of the Company for a similar deliverable when sold separately. As noted above, the Company typically is not able to use TPE, as the Company is usually not able to obtain sufficient information on competitor pricing to substantiate TPE.
If the Company is unable to establish selling price using VSOE or TPE, and the order was received or materially modified after July 31, 2009, the Company will use ESP in its allocation of arrangement consideration. The objective of ESP is to determine the price at which the Company would transact if the product or service were sold by the Company on a standalone basis.
The Company’s determination of ESP involves a weighting of several factors based on the specific facts and circumstances of the arrangement. Specifically, the Company will consider the cost to produce the deliverable, the anticipated margin on that deliverable, the selling price and profit margin for similar parts and the Company’s ongoing pricing strategy and policies.
The Company will determine ESP for deliverables in future agreements based on the specific facts and circumstances of the arrangement. The Company plans to analyze the selling prices used in its allocation of arrangement consideration at least annually. Selling prices will be analyzed on a more frequent basis if a significant change in the Company’s business necessitates a more timely analysis or if the Company experiences significant variances in its selling prices.
Maintenance or service revenues are recognized ratably over the life of the contract.
The Company provides engineering services to some of its customers on a contractual basis and recognizes revenue using the percentage of completion method and the completed contract method. The Company generally
52
Table of Contents
ANALOGIC CORPORATION
NOTES TO CONSOLIDATED FINANCIAL STATEMENTS
(Continued)
estimates the progress towards completion on contracts with a fixed-fee arrangement on a monthly basis utilizing costs incurred to date as a percentage of total estimated costs at completion of the project or on a milestone basis based on contractual terms, as appropriate. When total cost estimates exceed revenues, the Company accrues for the estimated losses immediately. Unbilled receivables are included within accounts receivable and noncurrent other assets in the Consolidated Balance Sheets.
Deferred revenue is comprised of maintenance and other service revenues for which payment has been received and for which services have not yet been performed.
Revenue related to the hotel operations is recognized as services are performed.
The Company grants credit to domestic and foreign original equipment manufacturers, distributors, and end users, and performs ongoing credit evaluations of its customers’ financial condition. The Company continuously monitors collections and payments from its customers and maintains a provision for estimated credit losses based upon specific customer collection issues that have been identified.
(e) Warranty costs:
The Company provides for the estimated cost of product warranties at the time products are shipped. Although the Company engages in extensive product-quality programs and processes, its warranty obligations are affected by product failure rates and service delivery costs incurred to correct product failures. Should actual product failure rates or service delivery costs differ from the Company’s estimates (which are based on specific warranty claims, historical data, and engineering estimates, where applicable), revisions to the estimated warranty liability would be required. Such revisions could adversely affect the Company’s operating results. Generally, the Company warrants that its products will perform in all material respects in accordance with its standard published specifications in effect at the time of delivery of the products to the customer for a period ranging from 12 to 24 months from the date of delivery.
(f) Research and development and capitalized software development costs:
Research and product development costs are expensed as incurred and include primarily engineering salaries, share-based compensation, overhead and materials used in connection with research and product development activities. Research and product development costs related to non-recurring engineering projects undertaken for customers are reclassified to engineering cost of sales if the project is accounted for under the percentage of completion method or deferred costs if the project is accounted for under the completed contract method.
Software development costs incurred subsequent to establishing technological feasibility through general release of the software products are capitalized. Technological feasibility is demonstrated by the completion of a detailed program design. Capitalized costs are amortized on a straight-line basis over the economic lives of the related products, generally three years. Amortization expense of software development expense was $1,921, $809, and $926 in fiscal years 2010, 2009, and 2008, respectively, and is included in product cost of sales. The unamortized balance of capitalized software was $3,223 and $5,037 at July 31, 2010 and 2009, respectively.
(g) Income taxes:
The Company accounts for income taxes under the asset and liability method, which requires recognition of deferred tax assets, subject to valuation allowances, and liabilities for the expected future tax consequences of
53
Table of Contents
ANALOGIC CORPORATION
NOTES TO CONSOLIDATED FINANCIAL STATEMENTS
(Continued)
events that have been included in the financial statements or tax returns. Deferred income taxes reflect the net tax effects of temporary differences between the carrying amounts of asset and liabilities for financial reporting and income tax purposes. A valuation allowance is established if it is more likely than not that all or a portion of the net deferred tax assets will not be realized. The Company does not provide for U.S. Federal income taxes on undistributed earnings of all consolidated foreign subsidiaries as such earnings are considered to be indefinitely reinvested in those operations. For disclosure purposes, calculations of the potential deferred income tax liability on these undistributed earnings is not practicable because such liability, if any, is dependent on circumstances existing if and when remittance occurs.
(h) Net income per share:
Basic net income per share is computed using the weighted average number of common shares outstanding during the period. Diluted net income per share is computed using the weighted average number of common and diluted common equivalent shares outstanding during the period. Dilutive common equivalent shares consist of stock options and restricted stock.
(i) Cash and cash equivalents:
The Company considers all highly liquid investments with a maturity of three months or less at acquisition date to be cash equivalents. Cash and cash equivalents, primarily in short-term investments of certificates of deposit 100% insured by the Federal Depository Insurance Corporation (“FDIC”) at July 31, 2010 and government agency discounted notes at July 31, 2009, amounted to $169,254 and $119,855 at July 31, 2010 and 2009, respectively.
(j) Concentration of credit risk:
Financial instruments that potentially subject the Company to concentrations of credit risk consist principally of cash and cash equivalents, marketable securities, and accounts receivable. Cash and cash equivalents not required for working capital purposes are placed in short-term investments of government agency discounted notes or certificates of deposit instruments that are 100% insured by the FDIC or money market funds of banks that meet stringent credit rating requirements. The Company grants credit to domestic and foreign original equipment manufacturers, distributors, and end users, and performs ongoing credit evaluations on its customers’ financial condition.
(k) Marketable securities:
The Company’s marketable securities are categorized as available-for-sale and held-to-maturity securities. Unrealized marketable securities gains and losses are reflected as a net amount under the caption of “accumulated other comprehensive income” within the Consolidated Statements of Changes in Stockholders’ Equity for available-for-sale securities. Realized gains and losses are recorded within the Statements of Operations under the caption “Other income (expense)”. For the purpose of computing realized gains and losses, cost is identified on a specific identification basis.
(l) Use of estimates:
The preparation of financial statements in conformity with accounting principles generally accepted in the United States of America requires management to make estimates and assumptions that affect the reported
54
Table of Contents
ANALOGIC CORPORATION
NOTES TO CONSOLIDATED FINANCIAL STATEMENTS
(Continued)
amounts of assets and liabilities and disclosures of contingent assets and liabilities at the date of the financial statements and the reported amounts of sales and expenses during the reporting periods. Such management estimates include allowances for doubtful accounts receivable; provisions for inventory to reflect net realizable value; estimates of percentage of completion of contracts; estimates of fair value for investments in privately held companies; intangible assets; valuation allowances against deferred tax assets; and accruals for product warranty, other liabilities, income taxes, and various estimates used in the calculation of share-based compensation. Actual results could differ from those estimates.
(m) Comprehensive income:
Components of comprehensive income include net income and certain transactions that have generally been reported in the Consolidated Statements of Changes in Stockholders’ Equity. Other comprehensive income consists of reported foreign currency translation gains and losses (net of taxes), changes in the unrealized value of marketable securities (net of taxes), and actuarial gains and losses on pension plan assets (net of taxes). As of July 31, 2010 and 2009, accumulated other comprehensive income in stockholders’ equity totaled $4,722 and $10,096, respectively.
(n) Share-Based Compensation:
The Company accounts for share-based compensation expense for equity instruments exchanged for employee and director services. Share-based compensation cost is measured at the grant date, based on the fair value of the award, and is recognized as an expense over the employee’s requisite service period (generally the vesting period of the equity grant).
The Company estimates the fair value of stock options using the Black-Scholes valuation model and the fair value of the Company’s restricted stock awards, which include shares of restricted stock and restricted stock units, based on the quoted market price of its common stock or the use of a Monte-Carlo Simulation Model. For time or service-based awards, the Company recognizes the associated share-based compensation expense on a straight-line basis over the vesting periods of the awards, net of estimated forfeitures. Forfeiture rates are estimated based on historical pre-vesting forfeitures and are updated on the vesting dates to reflect actual forfeitures. For performance-based awards with an earnings per share related target, management evaluates the probability of meeting the performance criteria at each balance sheet date and related compensation cost, if probable, is amortized over the performance period on a straight-line basis because such awards vest only at the end of the measurement period. Changes to the probability assessment and the estimate of shares expected to vest will result in adjustments to the related share-based compensation expense that will be recorded in the period of the change. If the performance is not achieved, no compensation cost is recognized and any previously recognized compensation cost is reversed. For performance-based awards with a market condition related target, related compensation cost is amortized over the performance period on a straight-line basis, net of estimated forfeitures, regardless of whether the awards are ultimately earned.
(o) Fair value of financial instruments:
The carrying amounts of cash equivalents and receivables approximate fair value due to their short-term nature. The fair values of marketable securities are estimated based on quoted market price for these securities.
55
Table of Contents
ANALOGIC CORPORATION
NOTES TO CONSOLIDATED FINANCIAL STATEMENTS
(Continued)
(p) Impairment of long-lived assets:
The Company evaluates the recoverability of its long-lived assets recognizing the impairment of long-lived assets in the event the net book value of such assets exceeds the estimated future undiscounted cash flows attributable to such assets. If impairment is indicated, the asset is written down to its estimated fair value based on a discounted cash flow analysis. The Company reviews long-lived assets for impairment whenever events or changes in business circumstances indicate that the carrying amount of the assets may not be fully recoverable or that the useful lives of these assets are no longer appropriate. Each impairment test is based on a comparison of the estimated undiscounted cash flows of the asset as compared to the recorded value of the asset.
(q) Segment information:
The Company operates primarily within two major markets: Medical Technology and Security Technology. Medical Technology consists of three reporting segments: CT and MRI (formerly Medical Imaging Products), which consists primarily of electronic systems and subsystems for CT and MRI medical imaging equipment sold primarily through Original Equipment Manufacturers (OEMs); Specialized Ultrasound (formerly B-K Medical) for ultrasound systems and probes in the urology, ultrasound-guided surgery, anesthesia, and general radiology markets sold primarily through our direct sales force; and Digital Radiography, which consists primarily of state-of-the-art, direct conversion amorphous selenium-based, digital, flat-panel, x-ray detectors for diagnostic and interventional applications in mammography sold through OEMs. Security Technology consists of advanced weapon and threat detection aviation security systems and subsystems sold primarily through an OEM customer.
(r) Translation of foreign currencies:
The assets and liabilities of the Company’s foreign subsidiaries, whose cash flows are primarily in their local currency, have been translated into U.S. dollars using the current exchange rates at each balance sheet date. The operating results of these foreign subsidiaries have been translated at average exchange rates that prevailed during each reporting period. Adjustments resulting from translation of foreign currency financial statements are reflected as accumulated other comprehensive income in the consolidated balance sheet. Exchange gains and losses resulting from foreign currency transactions (transactions denominated in a currency other than that of the entities primary cash flow), excluding long-term intercompany receivables, payables, and investments, are included in operations in the period in which they occur and are reflected in the results of operations under the caption (“Other, net”). The Company had foreign exchange losses totaling $612 and $828 in fiscal years 2010 and 2009, respectively, and foreign exchange gains $440 in fiscal year 2008.
(s) Business Combinations:
In accordance with the purchase method of accounting, the fair values of assets acquired and liabilities assumed are determined and recorded as of the date of the acquisition. Costs to acquire the business prior to August 1, 2009, including transaction costs, were allocated to the fair value of net assets acquired. Any excess of the purchase price over the estimated fair value of the net assets acquired is recorded as goodwill.
As part of the allocation of purchase price, the Company records liabilities that include idle facility space and certain employee severance costs.
(t) Intangible assets and goodwill:
Intangible assets consist of intellectual property, licenses, capitalized software, and certain identifiable intangible assets resulting from business combinations, including trade names, customer relationships, backlog,
56
Table of Contents
ANALOGIC CORPORATION
NOTES TO CONSOLIDATED FINANCIAL STATEMENTS
(Continued)
and developed technology. These assets are reviewed for impairment whenever events or changes in circumstances indicate that the carrying value of assets may not be recoverable. Recoverability of these assets is measured by comparison of their carrying value to future undiscounted cash flows the assets are expected to generate over their remaining economic life. If such assets are considered to be impaired, the impairment to be recognized in earnings equals the amount by which the carrying value of the assets exceeds their fair market value determined by either a quoted market price, if any, or a value determined by utilizing a discounted cash flow technique. Evaluation of impairment of long-lived assets requires estimates of future operating results that are used in the preparation of the expected future undiscounted cash flows. Actual future operating results and the remaining economic lives of long-lived assets could differ from the estimates used in assessing the recoverability of these assets. These differences could result in impairment charges, which could have a material adverse impact on the Company’s results of operations.
The Company performs annual reviews in its second quarter of each fiscal year for impairment of goodwill and indefinite lived intangible assets related to the acquisitions or whenever events or changes in circumstances indicate that the carrying values may not be recoverable. Goodwill may be considered to be impaired if the Company determines that the carrying value of the reporting unit, including goodwill, exceeds the reporting unit’s fair value. Assessing the impairment of goodwill requires the Company to make assumptions and judgments regarding the fair value of the net assets of its reporting units. The Company estimates the fair value of its reporting units using a combination of valuation techniques, including discounted cash flows and cash earnings multiples, and compares the values to its estimated overall market capitalization.
An indefinite lived intangible asset may be considered to be impaired if the Company determines that the carrying value exceeds the assets fair value. Assessing the impairment of an indefinite lived intangible asset requires the Company to make assumptions and judgments regarding the fair value of the asset using the relief from royalty approach valuation technique.
(u) New accounting pronouncements:
Recently adopted
Hierarchy of generally accepted accounting principles
In June 2009, the Financial Accounting Standards Board (“FASB”) released the FASB Accounting Standards Codification and the Hierarchy of Generally Accepted Accounting Principles (the “Codification”), effective for financial statements issued for interim and annual periods ending after September 15, 2009. The Codification does not change GAAP, but does significantly change the way in which the accounting literature is organized, combining all authoritative standards in a comprehensive, topically organized database. All existing accounting standards documents were superseded and all other accounting literature not included in the Codification is considered nonauthoritative, other than guidance issued by the SEC. The Company adopted the provisions of this guidance during the quarter ended October 31, 2009, which had no impact on the Company’s financial position, results of operations, or cash flows.
Fair value
Effective August 1, 2009, the Company adopted FASB guidance requiring disclosures about fair value of financial instruments for interim and annual reporting periods and is effective for interim reporting periods ending after June 15, 2009. The adoption did not have a material impact on the Company’s financial position, results of operations, or cash flows.
57
Table of Contents
ANALOGIC CORPORATION
NOTES TO CONSOLIDATED FINANCIAL STATEMENTS
(Continued)
In August 2009, the FASB issued an update, which provides clarification and guidance regarding how to value a liability when a quoted price in an active market is not available for that liability. The changes as a result of this update were effective for the Company on November 1, 2009. The Company’s adoption of these changes did not have a material effect on its financial position, results of operations, or cash flows.
In January 2010, the FASB issued updated guidance related to fair value measurements and disclosures, which requires a reporting entity to disclose separately the amounts of significant transfers in and out of Level 1 and Level 2 fair value measurements and to describe the reasons for the transfers. In addition, in the reconciliation for fair value measurements using significant unobservable inputs, or Level 3, a reporting entity should disclose separately information about purchases, sales, issuances and settlements (that is, on a gross basis rather than one net number). The updated guidance also requires that an entity should provide fair value measurement disclosures for each class of assets and liabilities and disclosures about the valuation techniques and inputs used to measure fair value for both recurring and non-recurring fair value measurements for Level 2 and Level 3 fair value measurements. The updated guidance is effective for interim or annual financial reporting periods beginning after December 15, 2009, except for the disclosures about purchases, sales, issuances and settlements in the roll forward activity in Level 3 fair value measurements, which are effective for fiscal years beginning after December 15, 2010 and for interim periods within those fiscal years. The Company does not expect adoption of the updated guidance to have a material impact on its financial position, results of operations, or cash flows.
In February 2007, the FASB issued guidance that allows entities to choose, at specified election dates, to measure eligible financial assets and liabilities at fair value that are not otherwise required to be measured at fair value. If a company elects the fair value option for an eligible item, changes in that item’s fair value in subsequent reporting periods must be recognized in current earnings. The Company adopted the guidance on August 1, 2008 without an impact on the Company’s financial position, results of operations, or cash flows.
Business Combinations and Noncontrolling interests
Effective August 1, 2009, the Company adopted FASB guidance that requires an acquiring entity in a business combination to record all assets acquired and liabilities assumed at their respective acquisition date fair values, changes the recognition of assets acquired and liabilities assumed arising from contingencies, changes the recognition and measurement of contingent consideration, and requires the expensing of acquisition-related costs as incurred. This guidance also requires additional disclosure of information surrounding a business combination, such that users of the entity’s financial statements can more fully understand the nature and financial impact of the business combination. This guidance applies prospectively to business combinations for which the acquisition date is on or after the beginning of the first annual reporting period beginning on or after December 15, 2008, which is the Company’s fiscal year 2010.
Effective August 1, 2009, the Company adopted FASB guidance that establishes accounting and reporting standards for ownership interests in subsidiaries held by parties other than the parent, the amount of consolidated net income attributable to the parent and to the noncontrolling interest, changes in a parent’s ownership interest, and the valuation of retained noncontrolling equity investments when a subsidiary is deconsolidated. This guidance also establishes disclosure requirements that clearly identify and distinguish between the interests of the parent and the interests of the noncontrolling owners. This guidance was effective as of the beginning of the first annual reporting period that began after December 15, 2008. The adoption of this guidance did not have a material impact on the Company’s financial position, results of operations, or cash flows.
Effective August 1, 2009, the Company adopted FASB guidance amending the factors that should be considered in developing renewal or extension assumptions used to determine the useful life of a recognized
58
Table of Contents
ANALOGIC CORPORATION
NOTES TO CONSOLIDATED FINANCIAL STATEMENTS
(Continued)
intangible asset and requiring enhanced related disclosures. The guidance improves the consistency between the useful life of a recognized intangible asset and the period of expected cash flows used to measure the fair value of the asset. This guidance must be applied prospectively to all intangible assets acquired as of and subsequent to fiscal years beginning after December 15, 2008. Although future transactions involving intangible assets may be affected by this guidance, it did not impact the Company’s financial position, results of operations, or cash flows in fiscal year 2010.
Effective August 1, 2009, the Company adopted FASB guidance that amends and clarifies the initial recognition and measurement, subsequent measurement and accounting, and related disclosures of assets and liabilities arising from contingencies in a business combination. The impact of the adoption on the Company’s consolidated financial statements will largely depend on the size and nature of any business combinations.
Earnings per share
Effective August 1, 2009, the Company adopted FASB guidance that classifies unvested share-based payment awards that contain nonforfeitable rights to dividends or dividend equivalents (whether paid or unpaid) as participating securities and requires them to be included in the computation of earnings per share pursuant to the two-class method. The guidance was effective for financial statements issued for fiscal years beginning after December 15, 2008, and interim periods within those years. All prior-period earnings per share data presented are to be adjusted retrospectively (including interim financial statements, summaries of earnings, and selected financial data) to conform with this guidance, with early application not permitted. The adoption of this guidance did not have a material impact on the Company’s financial position, results of operations, or cash flows.
Revenue recognition
In October 2009, the FASB issued an amendment which eliminates the residual method of allocation for multiple-deliverable revenue arrangements and requires that arrangement consideration be allocated at the inception of an arrangement to all deliverables using the relative selling price method. The amendment also establishes a selling price hierarchy for determining the selling price of a deliverable, which includes: (1) vendor specific objective evidence (“VSOE”) if available; (2) third-party evidence (“TPE”) if VSOE evidence is not available; and (3) estimated selling (“ESP”) price if neither VSOE nor TPE is available. Additionally, the amendment expands the disclosure requirements related to a vendor’s multiple-deliverable revenue arrangements. This amendment is effective for the Company on August 1, 2010; however, the Company has elected to early adopt as permitted by the amendment and has prospectively applied the provisions of the amendment to all revenue arrangements entered into or materially modified after July 31, 2009. The adoption of the amendment did not have a material impact on the Company’s financial position, results of operations, or cash flows.
In October 2009, the FASB issued an amendment to the accounting model for revenue arrangements that include both tangible products and software elements, such that tangible products containing both software and non-software components that function together to deliver the tangible product’s essential functionality are no longer within the scope of software revenue guidance. This amendment was effective for the Company on August 1, 2010; however, the Company has elected to early adopt as permitted by the amendment and has prospectively applied the provisions of the amendment to all revenue arrangements entered into or materially modified after July 31, 2009. The adoption of the amendment did not have a material impact on the Company’s financial position, results of operations, or cash flows.
59
Table of Contents
ANALOGIC CORPORATION
NOTES TO CONSOLIDATED FINANCIAL STATEMENTS
(Continued)
Not yet effective
Special purpose entities
In June 2009, the FASB issued guidance that eliminates the concept of a qualified special-purpose entity and related guidance, creates more stringent conditions for reporting a transfer of a portion of a financial asset as a sale, clarifies other sale-accounting criteria, and changes the initial measurement of a transferor’s interest in transferred financial assets. This guidance is effective as of the beginning of the first annual reporting period that begins after November 15, 2009. The Company does not expect the adoption of this guidance to have a material impact on its financial position, results of operations, or cash flows.
In June 2009, the FASB issued guidance that requires former qualified special-purpose entities to be evaluated for consolidation, changes the approach to determining a variable interest entity’s (“VIE”) primary beneficiary, and requires companies to more frequently reassess whether they must consolidate VIEs. This guidance is effective as of the beginning of the first annual reporting period that begins after November 15, 2009. The Company does not expect the adoption of this guidance to have a material impact on its financial position, results of operations, or cash flows.
Revenue recognition
In March 2010, the FASB issued guidance related to revenue recognition that applies to arrangements with milestones relating to research or development deliverables. This guidance provides criteria that must be met to recognize consideration that is contingent upon achievement of a substantive milestone in its entirety in the period in which the milestone is achieved. This guidance is effective for the Company on August 1, 2010 and is not expected to have a material impact on its financial position, results of operations, or cash flows.
(v) Basis of presentation:
Certain financial statement items have been reclassified to conform to the current period presentation.
2. Share-based payment:
The following table presents share-based compensation expenses for continuing operations included in the Company’s consolidated statements of operations for fiscal years 2010, 2009, and 2008:
| Year Ended July 31, | ||||||||||||
| 2010 | 2009 | 2008 | ||||||||||
| Cost of product sales |
$ | 445 | $ | 272 | $ | 213 | ||||||
| Research and product development |
1,558 | 887 | 884 | |||||||||
| Selling and marketing |
657 | 504 | 131 | |||||||||
| General and administrative |
3,131 | 2,305 | 2,156 | |||||||||
| Share-based compensation expense before tax |
5,791 | 3,968 | 3,384 | |||||||||
| Income tax benefit |
(1,921 | ) | (1,231 | ) | (646 | ) | ||||||
| Net share-based compensation expense |
$ | 3,870 | $ | 2,737 | $ | 2,738 | ||||||
60
Table of Contents
ANALOGIC CORPORATION
NOTES TO CONSOLIDATED FINANCIAL STATEMENTS
(Continued)
The Company estimates the fair value of stock options using the Black-Scholes valuation model. Key input assumptions used to estimate the fair value of stock options include the exercise price of the award, the expected option term, the expected volatility of the Company’s stock over the option’s expected term, the risk-free interest rate over the option’s expected term, and the Company’s expected annual dividend yield. The Company believes that the valuation technique and the approach utilized to develop the underlying assumptions are appropriate in calculating the fair values of the Company’s outstanding stock options granted during fiscal years 2010, 2009, and 2008. The Company estimates the fair value of performance based restricted stock and restricted stock units with market conditions based on the use of a Monte-Carlo Simulation Model. Estimates of fair value are not intended to predict actual future events or the value ultimately realized by persons who receive equity awards.
The fair value of each option grant was estimated on the grant date using the Black-Scholes option-pricing model with the following assumptions for fiscal years 2010, 2009, and 2008 as follows:
| Year Ended July 31, | |||||||||
| 2010 | 2009 | 2008 | |||||||
| Expected option term (1) |
4.84 years | 4.74 years | 4.75 years | ||||||
| Expected volatility factor (2) |
43 | % | 34 | % | 31 | % | |||
| Risk-free interest rate (3) |
2.20 | % | 3.04 | % | 4.71 | % | |||
| Expected annual dividend yield |
1.0 | % | 0.6 | % | 0.6 | % | |||
| (1) | The option life was determined by estimating the expected option life, using historical data. |
| (2) | The stock volatility for each grant is determined based on the review of the experience of the weighted average of historical daily price changes of the Company’s common stock over the most recent five years, which approximates the expected option life of the grant. |
| (3) | The risk-free interest rate for periods equal to the expected term of the stock option is based on the U.S. Treasury yield curve in effect at the time of grant. |
Stock Incentive Plans
On January 29, 2010, the Company’s stockholders approved a new share-based compensation plan named the “2009 Stock Incentive Plan”. Under the Company’s 2009 Stock Incentive Plan, up to 1,600,000 shares of the Company’s common stock, $.05 par value per share, may be awarded. Awards may be in the form of stock options, stock appreciation rights (“SARs”), shares of restricted stock, restricted stock units or other stock-based awards. Stock options granted under the 2009 Stock Incentive Plan may not be granted at an exercise price less than 100% of the fair market value of the common stock on the date of grant. Options may not be granted for a term in excess of ten years. Except in certain circumstances, options that vest based on continued service of the optionee may not vest earlier than one year from the date of grant. SARs granted under the 2009 Stock Incentive Plan must have a measurement price not less than 100% of the fair market value on the date of grant. SARs may not be granted for a term in excess of ten years. Restricted stock may be granted subject to the Company’s right to repurchase all or part of such shares at their issue price or other stated or formula price (or to require forfeiture if such shares are issued at no cost) from the recipient in the event that conditions of the grant are not satisfied prior to the end of the restriction period. Such conditions may include the achievement of performance goals or continued service with the Company. Except in certain circumstances, restricted stock that vests solely based on the passage of time will not vest prior to the first anniversary of the date of grant, be no more than one-third vested prior to the second anniversary of the date of grant, and be no more than two-thirds vested prior to the third anniversary of the date of grant.
61
Table of Contents
ANALOGIC CORPORATION
NOTES TO CONSOLIDATED FINANCIAL STATEMENTS
(Continued)
On January 28, 2008, the Company’s stockholders approved a new share-based director compensation plan for the non-employee members of the Company’s Board of Directors (the “Board”) named the “Analogic Corporation Non-Employee Director Stock Plan” (the “Director Plan”). During fiscal years 2009 and 2008, 2,800 and 1,104 shares, respectively, were granted under this plan. The Director Plan provides for an Annual Share Retainer to be granted to each participant on each February 1. The Annual Share Retainer for calendar years 2010 and 2009 each had a value of $35.00. Each participant may elect to receive some or all of (i) his or her Annual Share Retainer for a given calendar year or (ii) his or her Annual Cash Retainer (which consists of the annual base cash compensation he or she receives for service on the Board and on any committees of the Board, and, if applicable, all other compensation received for service as Chairman of the Board and as a Committee Chairman) in the form of “Deferred Stock Units”, as elected by the participant no later than December 15 of the preceding calendar year. The value of the Deferred Stock Units credited to this account changes in relation to changes in the value of a share of the Company’s common stock. Additional Deferred Stock Units are credited to this account based on the value of dividend equivalents that are earned on Deferred Stock Units, and which will be equal to dividends that are paid on a corresponding number of shares of common stock. The payout of the deferred stock units’ value shall be made in a single cash payment within thirty days following a Director’s termination of service on the Board or sooner, if so elected by the Director. During fiscal year 2010, approximately $210 of Annual Share Retainers and $50 of Annual Cash Retainers were deferred into approximately 6,533 Deferred Stock Units at a weighted average price of $38.81 per share. Dividend equivalents on deferred stock units were deferred into approximately 165 Deferred Stock Units during fiscal year 2010. During fiscal year 2009, approximately $210 of Annual Share Retainers and $38 of Annual Cash Retainers were deferred into approximately 9,580 Deferred Stock Units at a weighted average price of $25.83 per share. Dividend equivalents on deferred stock units were deferred into approximately 99 Deferred Stock Units during fiscal year 2009.
During fiscal year 2007, the Company’s stockholders approved two share-based compensation plans, named the “2007 Stock Option Plan” and the “2007 Restricted Stock Plan”.
Under the Company’s 2007 Stock Option Plan, options may either be non-qualified options or incentive stock options and may not be granted at an exercise price less than 100% of the fair market value of the common stock on the date of grant (or less than 110% of the fair market value in the case of incentive stock options granted to optionees holding more than 10% of the voting power of the Company). Options may not be granted for a term in excess of ten years (or five years in the case of incentive stock options granted to optionees holding more than 10% of the voting power of the Company). Except in certain circumstances, options that vest based on continued service of the optionee may not vest earlier than one year from the date of grant. Unless otherwise provided by the Compensation Committee of the Board (the “Committee”) in the specific option agreement, each option will vest as to 25% of the number of shares of common stock underlying the option on each of the second, third, fourth, and fifth anniversaries of the date of grant.
Under the Company’s 2007 Restricted Stock Plan, recipients are awarded shares of common stock, subject to the right of the Company to repurchase all or part of such shares from the recipient in the event that the conditions specified in the applicable award are not satisfied prior to the end of the applicable restriction period established for such award. Such conditions may include the achievement of performance goals or continued service with the Company. Except in certain circumstances, awards that vest based on continued service may not vest earlier than in three equal installments on each of the first three anniversaries of the date of grant. The Committee may condition an award on the recipient not competing with the Company for a one-year period following termination of such recipient’s employment with the Company.
62
Table of Contents
ANALOGIC CORPORATION
NOTES TO CONSOLIDATED FINANCIAL STATEMENTS
(Continued)
Beginning in fiscal year 2008, the Committee began granting performance contingent restricted stock awards. In fiscal year 2008, the Committee granted 100,183 performance contingent restricted shares (“performance awards”) under the Company’s 2007 Restricted Stock Plan, of which 15,239 shares have since been forfeited through July 31, 2010. These shares vested if specific pre-established levels of performance were achieved at the end of a three-year performance cycle, which was July 31, 2010 for the outstanding 84,944 shares granted. The performance goal for the performance awards was based solely on the compound annual growth rate of an adjusted earnings per share metric for the Company. The actual number of shares issued was determined at the end of the three-year performance cycle and could range from zero to 200% of the target award. The actual number of shares issued included the payment of dividends on the actual number of shares earned. Compensation expense was recognized over the performance period based on the number of shares that were deemed to be probable of vesting at the end of the three-year performance cycle. The total number of shares that vested at July 31, 2010 was approximately 15,700. The expense (income) on these vested shares was approximately $1,100, of which $429, ($349), and $1,020 was recorded in fiscal years 2010, 2009, and 2008, respectively.
In fiscal year 2009, the Committee granted 45,751 performance awards under the Company’s 2007 Restricted Stock Plan, of which 5,663 shares have since been forfeited through July 31, 2010. These shares will vest if specific pre-established levels of performance are achieved at the end of a three-year performance cycle, which is July 31, 2011 for the outstanding 40,088 shares granted. The performance goal for the performance awards is based solely on the compound annual growth rate of an adjusted earnings per share metric for the Company. The actual number of shares to be issued will be determined at the end of each three-year performance cycle and can range from zero to 200% of the target award, or up to 80,176 shares based upon the shares outstanding. The actual number of shares to be issued will also include the payment of dividends on the actual number of shares earned. The maximum compensation expense for the performance awards was $4,678 based on a weighted average grant date fair value of $58.35 per share. Compensation expense is being recognized over the performance period based on the number of shares that is deemed to be probable of vesting at the end of the three-year performance cycle. As of July 31, 2010, the Company estimated that no shares were deemed probable of vesting. During fiscal years 2010 and 2009 compensation expense (income) of ($63) and $63, respectively, was recognized for the performance awards based on the number of shares deemed probable of vesting.
In fiscal year 2010, the Committee granted 223,834 performance awards in the form of shares of restricted stock and restricted stock units pursuant to the Company’s 2007 Restricted Stock Plan and 2009 Stock Incentive Plan, of which 7,960 performance awards have since been forfeited through July 31, 2010. These awards will vest as follows: 107,941, will vest based upon achievement of certain targets over the three-year period ending July 31, 2012 with respect to the Company’s cumulative non-GAAP earnings per share and 107,933 will vest based upon achievement of certain targets over the three-year period ending July 31, 2012 with respect to the Company’s relative total shareholder return (“TSR”) as determined against a specified peer group. The actual number of shares to be issued will be determined at the end of the three-year performance cycle and can range from zero to 200% of the target award, or up to 431,748 shares/units. The issuance of the shares will be accompanied by the payment of accumulated dividends on the actual number of shares earned. The maximum compensation expense for the performance awards with the non-GAAP earnings per share target is $8,648, based on a weighted average grant date fair value of $40.06 per share as determined by the closing stock price on the date of grant. Compensation expense is being recognized over the performance period for the performance awards with the non-GAAP earnings per share target based on the number of shares that are deemed to be probable of vesting at the end of each three-year performance cycle. As of July 31, 2010, the Company estimated that total non-GAAP earnings per share awards covering 53,090 shares and units with a value of $2,127 were deemed probable of vesting. During fiscal year 2010, the Company recognized compensation expense of $468 for the performance awards with the non-GAAP earnings per share target based on the number of shares deemed
63
Table of Contents
ANALOGIC CORPORATION
NOTES TO CONSOLIDATED FINANCIAL STATEMENTS
(Continued)
probable of vesting. The compensation expense for the performance awards with the TSR target is $5,123, which will be recognized on a straight-line basis, net of estimated forfeitures, over a derived service period of 2.7 years. The weighted average grant date fair values of awards granted with a TSR target was $47.47 per share during fiscal year 2010. The fair value of awards with a TSR target at date of grant was estimated using a Monte-Carlo Simulation Model with the following assumptions:
| Year Ended July 31, |
||||
| 2010 | ||||
| Stock Price (1) |
$ | 40.06 | ||
| Expected volatility factor (2) |
51 | % | ||
| Risk-free interest rate (3) |
1.19 | % | ||
| Expected annual dividend yield (4) |
0.0 | % | ||
| (1) | The stock price is the weighted average closing price of the Company’s common stock on the dates of grant. |
| (2) | The stock volatility for each grant is determined based on the historical volatility for the peer group companies over a period equal to the remaining term of the performance period from the date of grant for all awards. |
| (3) | The risk-free interest rate for periods equal to the performance period is based on the U.S. Treasury yield curve in effect at the time of grant. |
| (4) | Dividends are considered reinvested when calculating TSR. For the purpose of the fair value model, the dividend yield is therefore considered to be 0%. |
Prior to fiscal year 2007, the Company had two key employee stock option plans (one of which has lapsed as to the granting of options), two key employee stock bonus plans, two non-employee director stock option plans (one of which has lapsed as to the granting of options), and one employee stock purchase plan.
Options granted under the two key employee stock option plans generally become exercisable in installments commencing no earlier than two years from the date of grant and ending no later than six years from the date of grant. Unexercised options expire up to seven years from date of grant. Options issued under the plans are non-qualified options or incentive stock options and are issued at prices of not less than 100% of the fair market value of the common stock at the date of grant. Options granted under the two non-employee director stock option plans become exercisable in equal installments over three years commencing one year from the date of grant and remain exercisable for ten years from the date of grant. Options issued under the plans are non-qualified options and are issued at prices of 100% of the fair market value of the common stock at the date of grant.
Under the Company’s key employee stock bonus plans, restricted common stock may be granted to key employees under terms and conditions as determined by the Board. Generally, participants under the stock bonus plans may not dispose or otherwise transfer stock granted for three years from date of grant. Stock granted under these plans generally vest in four equal installments beginning in the third year from the date of grant.
Under the employee stock purchase plan, eligible participants are granted options to purchase the Company’s common stock twice a year at the lower of 85% of market value at the beginning or end of each period. Calculation of the number of options granted, and subsequent purchase of these shares, is based upon voluntary payroll deductions during each six-month period. The number of options granted to each employee under this plan, when combined with options issued under other plans, is limited to a maximum outstanding value of $25 during each calendar year.
64
Table of Contents
ANALOGIC CORPORATION
NOTES TO CONSOLIDATED FINANCIAL STATEMENTS
(Continued)
The fair value of each option granted under the employee stock purchase plan was estimated on the expected grant date using the Black-Scholes option pricing model with the following assumptions:
| Year Ended July 31, | |||||||||
| 2010 | 2009 | 2008 | |||||||
| Expected option term |
.5 years | .5 years | .5 years | ||||||
| Expected volatility factor |
50 | % | 50 | % | 33 | % | |||
| Risk-free interest rate |
2.58 | % | 2.08 | % | 4.40 | % | |||
| Expected annual dividend yield |
1.1 | % | 1.3 | % | 0.6 | % | |||
At July 31, 2010, 2,127,840 shares were reserved for grant under the above stock option, bonus and purchase plans.
The following table sets forth the stock option and restricted stock awards transactions for fiscal year 2010:
| Stock Options Outstanding | Time-Based Unvested Restricted Stock Awards |
Performance-Based Unvested Restricted Awards | |||||||||||||||||||||
| Number of Shares |
Weighted Average Exercise Price |
Weighted Average Remaining Contractual Term (years) |
Aggregate Intrinsic Value |
Number of Shares/ Units |
Weighted Average Grant Date Fair Value |
Number of Shares/ Units |
Weighted Average Grant Date Fair Value | ||||||||||||||||
| Outstanding at July 31, 2009 |
415,021 | $ | 53.84 | 4.55 | $ | 167 | 113,309 | $ | 55.62 | 137,909 | $ | 58.55 | |||||||||||
| Granted |
11,000 | 42.27 | 35,800 | 44.43 | 223,834 | 43.77 | |||||||||||||||||
| Exercised |
(17,883 | ) | 38.74 | ||||||||||||||||||||
| Vesting of restricted stock |
— | — | (33,527 | ) | 53.84 | — | — | ||||||||||||||||
| Cancelled (forfeited and expired) |
(88,129 | ) | 52.48 | (6,766 | ) | 58.81 | (20,837 | ) | 54.00 | ||||||||||||||
| Outstanding at July 31, 2010 |
320,009 | 54.38 | 4.66 | $ | 754 | 108,816 | 52.26 | 340,906 | 49.12 | ||||||||||||||
| Options vested or expected to vest at July 31, 2010 |
299,272 | 54.25 | 4.61 | 701 | |||||||||||||||||||
| Options exercisable at July 31, 2010 |
133,047 | 51.41 | 3.37 | 282 | |||||||||||||||||||
The weighted average fair value of stock options granted during fiscal years 2010, 2009, and 2008 were $15.39, $18.14, and $22.46 per share, respectively.
During fiscal years 2010, 2009, and 2008, the total intrinsic value of options exercised (i.e., the difference between the market price and the price paid by the employee to exercise the options) was $80, $101, and $1,750, respectively, and the total amount of cash received from the exercise of these options was $693, $198, and $2,660, respectively. The total fair value of restricted stock grants that vested during fiscal years 2010, 2009, and 2008 was $1,379, $1,580, and $1,774, respectively.
65
Table of Contents
ANALOGIC CORPORATION
NOTES TO CONSOLIDATED FINANCIAL STATEMENTS
(Continued)
The following table summarizes information about stock options outstanding at July 31, 2010:
| Options Outstanding | Vested Options | |||||||||||
| Range of Exercise Prices |
Number of Shares |
Weighted Average of Remaining Contract Life (years) |
Weighted Average Exercise Price |
Number Exercisable |
Weighted Average Exercise Price | |||||||
| $27.11 - $41.32 |
72,470 | 5.17 | $ | 36.51 | 31,249 | $ | 39.79 | |||||
| 41.34 - 58.41 |
70,485 | 2.62 | 46.89 | 57,360 | 45.87 | |||||||
| 61.47 - 61.47 |
10,000 | 7.50 | 61.47 | 6,668 | 61.47 | |||||||
| 62.72 - 67.72 |
96,054 | 5.08 | 62.72 | 1,017 | 62.72 | |||||||
| 64.70 - 75.35 |
71,000 | 5.22 | 67.77 | 36,753 | 67.79 | |||||||
| $27.11 - $75.35 |
320,009 | 4.66 | 54.38 | 133,047 | 51.41 | |||||||
As of July 31, 2010, there was $10,918 of total unrecognized compensation cost related to non-vested share-based compensation arrangements granted under the Company’s stock option and restricted stock bonus plans. That cost is expected to be recognized over a weighted-average period of 1.71 years. The Company amortizes share-based compensation on the straight-line method with the exception of performance contingent restricted stock.
The actual tax benefit realized for the tax deductions from option exercises totaled $28, $25, and $366 for fiscal years 2010, 2009, and 2008, respectively.
3. Business combination
On April 14, 2008, the Company acquired all of the outstanding capital stock of Copley Controls Corporation (“Copley”). Copley is a supplier of gradient amplifiers for MRI and precision motion control systems used in computer-controlled automation systems. This acquisition has enabled the Company to expand its product offerings to its OEM customers, enhance its position as a provider of medical subsystems for MRI scanners, and provide additional opportunities in the high-technology automation market.
The purchase price, net of cash acquired, was $74,032, which consisted of $76,875 of cash paid upon closing, $734 of transaction costs, which primarily consisted of fees incurred by the Company for financial advisory, legal, and accounting services, $1,066 for working capital adjustment payments, of which the entire amount was paid prior to July 31, 2008, and $350 due to the former stockholders of Copley to reimburse them for the additional tax costs of making an election to treat the acquisition as an asset sale for tax purposes, net of cash acquired of $4,993. The total amount paid through July 31 2009, net of cash acquired, was $74,032.
The Company’s consolidated financial statements include the results of Copley from the date of acquisition. The purchase price has been allocated to the assets acquired and the liabilities assumed based on estimated fair values as of the acquisition date.
66
Table of Contents
ANALOGIC CORPORATION
NOTES TO CONSOLIDATED FINANCIAL STATEMENTS
(Continued)
The following represents the purchase price allocation:
| Current assets |
$ | 36,152 | ||||
| Property, plant, and equipment |
3,912 | |||||
| Goodwill |
2,043 | |||||
| Intangible assets: |
||||||
| Developed technology (weighted-average useful life of 11 years) |
11,771 | |||||
| Customer relationships (weighted-average useful life of 14 years) |
25,200 | |||||
| Tradename (indefinite life) |
7,607 | |||||
| Backlog (estimated useful life of 0.5 years) |
2,063 | |||||
| Total intangible assets |
46,641 | |||||
| Current liabilities |
(9,723 | ) | ||||
| Total purchase price |
$ | 79,025 | ||||
In determining the purchase price allocation, the Company considered, among other factors, its intention to use the acquired assets and the historical and estimated future demand for Copley products and services. The fair value of developed technology and tradename intangible assets were based upon the relief from royalty approach while the customer relationship and backlog intangible assets were based on the income approach. The rate used to discount the estimated future net cash flows to their present values for each intangible asset was based upon a weighted average cost of capital ranging from 15.5% to 20.0%. The discount rate was determined after consideration of market rates of return on debt and equity capital, the weighted average return on invested capital and the risk associated with achieving forecasted sales related to the technology and assets acquired from Copley.
The total weighted average amortization period for the intangible assets is approximately 12 years. The intangible assets are being amortized on a straight-line basis, which is consistent with the pattern that the economic benefits of the intangible assets are expected to be utilized based upon estimated cash flows generated from such assets. The goodwill is classified within the Company’s CT and MRI segment.
In connection with the acquisition of Copley, the Company commenced integration activities which have resulted in recognizing $1,276 in liabilities for personnel-related costs and $150 for idle facility space. The Company paid $1,025 of the liabilities associated with the personnel-related costs through July 31, 2009 and reduced goodwill by the remaining $375 that will not be paid.
The following pro forma (unaudited) information gives effect to the acquisition of Copley as if the acquisition occurred at the beginning of each period for which pro forma results have been shown. The pro forma results are not necessarily indicative of what actually would have occurred had the acquisition been in effect for the periods presented:
| Year Ended July 31, 2008 | |||
| Net revenue |
$ | 471,204 | |
| Net income |
21,977 | ||
| Net income per share, basic |
1.67 | ||
| Net income per share, diluted |
1.65 | ||
The pro forma results for fiscal year 2008 include $3,661 of expenses related to the amortization of the backlog intangible asset and inventory fair value adjustment from the purchase accounting. The backlog and
67
Table of Contents
ANALOGIC CORPORATION
NOTES TO CONSOLIDATED FINANCIAL STATEMENTS
(Continued)
inventory valuation adjustment were completely amortized over 6 and 3 months, respectively, from the date of acquisition.
4. Restructuring and voluntary retirement charges:
In the second quarter of fiscal year 2010, the Company reduced its workforce by 17 employees worldwide. The total costs of this plan, including severance and personnel related costs, was $764 and was recorded as a restructuring charge during fiscal year 2010.
In the fourth quarter of fiscal year 2010, the Company recorded an additional restructuring charge of $420 for estimated sub-lease income that is no longer expected to be received for facility space the Company exited in the fourth quarter of fiscal year 2010. Offsetting this expense was an adjustment of severance and related benefit expenses of $494 related to a change in estimated severance benefits as well as changes in the employee population expected to receive such benefits.
In the second quarter of fiscal year 2009, the Company reduced its workforce by 145 employees worldwide and recorded a restructuring charge of $3,488 for severance and personnel related costs. Included in the second quarter restructuring for Copley were 29 employees. The severance and personnel related costs for the Copley employees of $323 were accrued for in fiscal year 2008 in connection with the acquisition.
In the fourth quarter of fiscal year 2009, the Company recorded a restructuring charge of $3,131. The restructuring charge included $2,073 in severance and personnel related costs for the reduction of its workforce by 85 employees worldwide and $1,058 for facility exit costs, due primarily to the Company vacating 50% of its office facility in Canton, MA on July 31, 2009 as a result of moving certain operations to its Peabody, MA facility. The facility exit costs consist primarily of ongoing lease payments less estimated sublease income for the vacated portion of the Canton lease over the remainder of the lease term, which ends in calendar year 2011.
In the fourth quarter of fiscal year 2008, the Company recorded restructuring and voluntary retirement charges of $4,016. These costs included $3,419 of severance and personnel related costs for 52 employees who participated in the Company’s U.S. voluntary retirement program that was substantially completed by September 30, 2008. Also included was a restructuring charge of $597 for the severance and personnel related costs of 32 employees in various departments of the organization who were terminated.
68
Table of Contents
ANALOGIC CORPORATION
NOTES TO CONSOLIDATED FINANCIAL STATEMENTS
(Continued)
The following table summarizes accrued voluntary retirement and other restructuring costs activity from July 31, 2007 through July 31, 2010:
| Involuntary Employee Severance |
Facility Exit Costs |
Voluntary Retirement Program |
Copley Acquisition |
Total | ||||||||||||||||
| Balance at July 31, 2007 |
$ | — | $ | — | $ | — | $ | — | $ | — | ||||||||||
| Restructuring charge |
597 | — | — | — | 597 | |||||||||||||||
| Copley acquisition restructuring accrual |
— | — | — | 1,426 | 1,426 | |||||||||||||||
| Voluntary retirement costs |
— | — | 3,419 | — | 3,419 | |||||||||||||||
| Cash payments |
(288 | ) | — | (24 | ) | (50 | ) | (362 | ) | |||||||||||
| Balance at July 31, 2008 |
309 | — | 3,395 | 1,376 | 5,080 | |||||||||||||||
| Restructuring charge |
5,561 | 1,058 | — | — | 6,619 | |||||||||||||||
| Cash payments |
(3,171 | ) | — | (3,395 | ) | (975 | ) | (7,541 | ) | |||||||||||
| Reversal through goodwill |
— | — | — | (375 | ) | (375 | ) | |||||||||||||
| Foreign exchange |
29 | — | — | — | 29 | |||||||||||||||
| Balance at July 31, 2009 |
2,728 | 1,058 | — | 26 | 3,812 | |||||||||||||||
| Restructuring charge |
764 | 420 | — | — | 1,184 | |||||||||||||||
| Adjustment |
(494 | ) | — | — | — | (494 | ) | |||||||||||||
| Cash payments |
(2,854 | ) | (756 | ) | — | (26 | ) | (3,636 | ) | |||||||||||
| Foreign exchange |
9 | — | — | — | 9 | |||||||||||||||
| Balance at July 31, 2010 |
$ | 153 | $ | 722 | $ | — | $ | — | $ | 875 | ||||||||||
The $1,426 Copley acquisition restructuring accrual was included in the Copley purchase price allocation and was not included in operating expenses in the Company’s Consolidated Statements of Operations under the caption “Restructuring and voluntary retirement charges”.
The cash expenditures subsequent to July 31, 2010 for approximately $153 in employee severance and $722 of facility exit costs will be paid within the next six and fifteen months, respectively.
5. Net income per share:
Basic net income per share is computed using the weighted average number of common shares outstanding during the period. Diluted net income per share is computed using the sum of the weighted average number of common shares outstanding during the period and, if dilutive, the weighted average number of potential shares of common stock, including unvested restricted stock awards and the assumed exercise of stock options using the treasury stock method.
69
Table of Contents
ANALOGIC CORPORATION
NOTES TO CONSOLIDATED FINANCIAL STATEMENTS
(Continued)
The following table sets forth the computation of basic and diluted net income per share for fiscal years 2010, 2009, and 2008:
| (In thousands, except per share data) | |||||||||
| Year Ended July, 31 | |||||||||
| 2010 | 2009 | 2008 | |||||||
| Net income |
$ | 15,555 | $ | 3,705 | $ | 23,486 | |||
| Weighted average number of common shares outstanding-basic |
12,584 | 12,835 | 13,180 | ||||||
| Effect of dilutive securities: |
|||||||||
| Stock options and restricted stock awards |
71 | 97 | 110 | ||||||
| Weighted average number of common shares outstanding-diluted |
12,655 | 12,932 | 13,290 | ||||||
| Net income per share: |
|||||||||
| Basic |
$ | 1.24 | $ | 0.29 | $ | 1.78 | |||
| Diluted |
$ | 1.23 | $ | 0.29 | $ | 1.77 | |||
| Anti-dilutive shares related to outstanding stock options |
344 | 432 | 77 | ||||||
Anti-dilutive shares related to outstanding stock options may become dilutive in future years.
6. Risks and uncertainties:
The Company is subject to risks common to companies in the medical and security technology industries. These risks, which could have a material and negative impact on the Company’s business, financial condition, and results of operations, include, but are not limited to, loss of any significant customer, dependence on key suppliers, and United States and foreign regulatory clearances and approvals.
Customers
The Company had three customers, as set forth in the table below, who accounted for 10% or more of the net product and engineering revenue during fiscal years 2010, 2009, and 2008.
| Year Ended July 31, | |||||||||
| 2010 | 2009 | 2008 | |||||||
| Koninklijke Philips Electronics N.V. (“Philips”) |
15 | % | 15 | % | * | ||||
| Toshiba Corporation (“Toshiba”) |
12 | % | 14 | % | 17 | % | |||
| L-3 Communications Corporation (“L-3”) |
* | 11 | % | 11 | % | ||||
Note (*): Total net product and engineering revenue was less than 10% in this fiscal year.
Philips’s product and engineering revenue are in the CT and MRI segment, Toshiba’s product and engineering revenue are in the CT and MRI and Digital Radiography segments, and L-3’s product and engineering revenue are in the Security Technology segment.
The Company’s ten largest customers as a group accounted for 66%, 67%, and 67% of the Company’s net product and engineering revenue for fiscal years 2010, 2009, and 2008, respectively. Philips accounted for 16% and 12%, respectively, of net accounts receivable at July 31, 2010 and 2009, respectively, and L-3 accounted for 13% of net accounts receivable at July 31, 2010 and 2009.
70
Table of Contents
ANALOGIC CORPORATION
NOTES TO CONSOLIDATED FINANCIAL STATEMENTS
(Continued)
Although the Company is seeking to broaden its customer base, the Company will continue to depend on sales to a relatively small number of major customers. Because it often takes significant time to replace lost business, it is likely that operating results would be adversely affected if one or more major customers were to cancel, delay, or reduce significant orders in the future. Customer agreements typically permit the customer to discontinue future purchases after timely notice. In addition, the Company generates significant accounts receivable in connection with the products it sells and the services it provides to its major customers. Although its major customers are large well established corporations, if one or more of its customers were to become insolvent or otherwise be unable to pay for the Company’s products and services, the Company’s operating results and financial condition could be adversely affected.
7. Marketable securities and fair value:
Fair value is defined as the exchange price that would be received for an asset or paid to transfer a liability (an exit price) in the principal or most advantageous market for the asset transaction between market participants on the measurement date. Valuation techniques used to measure fair value must maximize the use of observable inputs and minimize the use of unobservable inputs. The Company uses a fair value hierarchy based on three levels of inputs, of which the first two are considered observable and the last unobservable, that may be used to measure fair value:
Level 1 – Quoted prices in active markets for identical assets or liabilities.
Level 2 – Inputs other than Level 1 that are observable, either directly or indirectly, such as quoted prices for similar assets or liabilities; quoted prices in markets that are not active; or other inputs that are observable or can be corroborated by observable market data for substantially the full term of the assets or liabilities.
Level 3 – Unobservable inputs that are supported by little or no market activity and that are significant to the fair value of the assets or liabilities.
The Company’s cash equivalents and marketable securities are comprised primarily of certificates of deposits.
The Company did not have any financial or non-financial assets or liabilities measured at fair value at July 31, 2010 or 2009.
All investments held at July 31, 2010 are due within one year and 100% insured by the FDIC.
There are no realized gains or losses on marketable securities, as the Company has not sold any marketable securities during the periods presented and cost has approximated fair value at the maturity dates.
71
Table of Contents
ANALOGIC CORPORATION
NOTES TO CONSOLIDATED FINANCIAL STATEMENTS
(Continued)
8. Balance sheet information:
Additional information for certain balance sheet accounts is as follows for the years ended:
| July 31, | ||||||
| 2010 | 2009 | |||||
| Inventories: |
||||||
| Raw materials |
$ | 54,106 | $ | 49,828 | ||
| Work-in-process |
12,896 | 13,194 | ||||
| Finished goods |
19,058 | 15,989 | ||||
| $ | 86,060 | $ | 79,011 | |||
| Accrued liabilities: |
||||||
| Accrued employee compensation and benefits |
$ | 18,765 | $ | 12,076 | ||
| Accrued restructuring and voluntary retirement charges |
875 | 3,812 | ||||
| Accrued warranty |
6,103 | 5,918 | ||||
| Other |
7,548 | 8,524 | ||||
| $ | 33,291 | $ | 30,330 | |||
| Advance payments and deferred revenue: |
||||||
| Deferred revenue |
$ | 5,492 | $ | 5,647 | ||
| Customer deposits |
3,556 | 2,110 | ||||
| $ | 9,048 | $ | 7,757 | |||
9. Goodwill and other intangible assets:
The carrying amount of the goodwill at July 31, 2010 and July 31, 2009 was $1,849 and $2,043, respectively. The decrease in goodwill of $194 from July 31, 2009 to July 31, 2010 was due to an adjustment to the purchase price of Copley, which was released to the Company from escrow in the first quarter of fiscal year 2010.
Other intangible assets include the value assigned to intellectual property and other technology, patents, customer contracts and relationships, a trade name, and in-process research and development. The estimated useful lives for all of these intangible assets, excluding the tradename as it is considered to have an indefinite life, are 10 to 14 years.
Intangible assets at July 31, 2010 and 2009 consisted of the following:
| July 31, 2010 | July 31, 2009 | |||||||||||||||||
| Cost | Accumulated Amortization |
Net | Cost | Accumulated Amortization |
Net | |||||||||||||
| Developed technology |
$ | 11,771 | $ | 2,578 | $ | 9,193 | $ | 11,771 | $ | 1,450 | $ | 10,321 | ||||||
| Customer relationships |
25,200 | 4,139 | 21,061 | 25,200 | 2,336 | 22,864 | ||||||||||||
| Tradename |
7,607 | — | 7,607 | 7,607 | — | 7,607 | ||||||||||||
| In-process research and development |
1,900 | — | 1,900 | — | — | — | ||||||||||||
| Total |
$ | 46,478 | $ | 6,717 | $ | 39,761 | $ | 44,578 | $ | 3,786 | $ | 40,792 | ||||||
Amortization expense related to acquired intangible assets was $2,931, $3,782, and $2,441 for fiscal years 2010, 2009, and 2008, respectively.
72
Table of Contents
ANALOGIC CORPORATION
NOTES TO CONSOLIDATED FINANCIAL STATEMENTS
(Continued)
The estimated future amortization expenses related to intangible assets for each of the five succeeding fiscal years is expected to be as follows:
| 2011 |
$ | 2,931 | |
| 2012 |
2,931 | ||
| 2013 |
2,931 | ||
| 2014 |
2,931 | ||
| 2015 |
2,931 | ||
| $ | 14,655 | ||
The Company’s goodwill and indefinite lived intangible assets are tested for impairment on an annual basis and between annual tests if an event occurs or circumstances change that would indicate the carrying value is not recoverable. Goodwill represents the purchase price in excess of the net amount assigned to assets acquired and liabilities assumed by the Company in connection with the acquisition of Copley on April 14, 2008. The tradename represents the value allocated to the Copley tradename in connection with the acquisition of Copley. The goodwill and Copley tradename are part of the OEM reporting unit (the “Reporting Unit”), both of which the Company tests for impairment during the second quarter of each fiscal year.
In the second quarter of fiscal year 2010, the Company performed the first step of the two-step impairment test for goodwill and tradename. For the goodwill, the Company compared the fair value of the OEM reporting unit to its carrying value during the second quarter of fiscal year 2010. The Company’s approach considered both the market approach and income approach. Equal weight was given to each approach. Under the market approach, the fair value of the reporting unit is based on trading multiples. In the market approach, the Company assumed a control premium of 15% for the reporting unit, which was determined based on an analysis of control premiums for relevant recent acquisitions. Under the income approach, the fair value of the reporting unit is based on the present value of estimated future cash flows. The income approach is dependent on a number of significant management assumptions including estimates of future sales, future gross margin percentage, and discount rates. The discount rate of 15.7% was determined after consideration of market rates of return on debt and equity capital, the weighted average return on invested capital and the risk associated with achieving forecasted sales for the reporting unit. The Company determined that the fair value of the reporting unit was more than the carrying value of the net assets of the reporting unit, and thus it was not necessary for the Company to perform step two of the impairment test for the goodwill.
For the tradename, the Company compared the fair value of the Copley tradename using the relief from royalty approach to its carrying value during the second quarter of fiscal year 2010. The relief from royalty approach utilized a 1.3% aftertax royalty rate and a discount rate of 17.7%. The aftertax royalty rate was determined based on royalty research and margin analysis while the discount rate was determined after consideration of market rates of return on debt and equity capital, the weighted average return on invested capital and the risk associated with achieving forecasted sales for the Copley tradename. The Company determined that the fair value of the Copley tradename was more than its carrying value.
Given the current economic environment and the uncertainties regarding its impact on the Company’s business, there can be no assurance that the Company’s estimates and assumptions regarding the duration of the ongoing economic downturn, or the period or strength of recovery, made for purposes of its goodwill and tradename impairment testing during the second quarter of fiscal year 2010 will prove to be accurate predictions of the future. If the Company’s assumptions regarding forecasted revenue or margin growth rates of the reporting
73
Table of Contents
ANALOGIC CORPORATION
NOTES TO CONSOLIDATED FINANCIAL STATEMENTS
(Continued)
unit and tradename are not achieved, the Company may be required to record an impairment charge for the goodwill and tradename in future periods, whether in connection with the Company’s next annual impairment testing in the second quarter of the fiscal year ending July 31, 2011, or prior to that if any such change constitutes a triggering event outside of the quarter from when the annual goodwill and tradename impairment test is performed. It is not possible at this time to determine if any such future impairment charge would result or, if it does, whether such charge would be material.
10. Commitments, guarantees, and contingencies:
In August 2009, the Company reached a settlement related to a claim associated with a former distributor of Medical Imaging Products, CAS Medical Systems, Inc. (“CAS”), in which the Company agreed to pay CAS the sum of $811 in full satisfaction of all matters in dispute. The $811 was recorded in general and administrative expenses in fiscal year 2009. The Company and CAS have negotiated an orderly conclusion to their contractual relationship by allowing CAS to continue distributing products until July 31, 2010. In connection with the settlement agreement, the Company also wrote down deferred engineering costs of $365 to engineering cost of sales in fiscal year 2009.
The following is a summary of agreements that the Company determined require to be recognized at the inception of a guarantee, a liability for the fair value of the obligation undertaken by issuing the guarantee.
The Company’s standard OEM and supply agreements entered in the ordinary course of business typically contain an indemnification provision pursuant to which the Company indemnifies, holds harmless, and agrees to reimburse the indemnified party for losses suffered or incurred by the indemnified party in connection with any United States patent, or any copyright or other intellectual property infringement claim by any third party with respect to the Company’s products. Such provisions generally survive termination or expiration of the agreements. The potential amount of future payments the Company could be required to make under these indemnification provisions is, in some instances, unlimited. The Company has never incurred costs to defend lawsuits or settle claims related to these indemnification agreements. As a result, the Company believes that its estimated exposure on these agreements is currently minimal. Accordingly, the Company has no liabilities recorded for these agreements as of July 31, 2010.
Generally, the Company warrants that its products will perform in all material respects in accordance with its standard published specifications in effect at the time of delivery of the products to the customer for a period ranging from 12 to 24 months from the date of delivery. The Company provides for the estimated cost of product and service warranties based on specific warranty claims, claim history, and engineering estimates, where applicable.
The following table presents the Company’s product warranty liability for the years then ended:
| July 31, | ||||||||
| 2010 | 2009 | |||||||
| Balance at the beginning of the period |
$ | 5,918 | $ | 5,403 | ||||
| Accrual |
5,307 | 4,202 | ||||||
| Settlements made in cash or in kind during the period |
(5,122 | ) | (3,687 | ) | ||||
| Balance at the end of the period |
$ | 6,103 | $ | 5,918 | ||||
The Company currently has approximately $22,500 in revolving credit facilities with banks available for direct borrowings. The Company’s revolving credit facility agreements contains a number of covenants,
74
Table of Contents
ANALOGIC CORPORATION
NOTES TO CONSOLIDATED FINANCIAL STATEMENTS
(Continued)
including a covenant requiring the Company to maintain a tangible net worth (as defined in the revolving credit facility agreement) of no less than $255,000 as of the end of any fiscal quarter. The Company was in compliance with this covenant at July 31, 2010 with a tangible net worth of approximately $364,000. As of July 31, 2010, there were no direct borrowings or off-balance sheet arrangements.
11. Leases and other commitments:
Certain of the Company’s subsidiaries lease manufacturing and office space under non-cancelable operating leases. These leases contain renewal options. The Company leases certain other real property and equipment under operating leases which, in the aggregate, are not significant.
Rent expense associated with the Company’s operating leases was approximately $2,560, $3,539, and $2,205 in fiscal years 2010, 2009 and 2008, respectively.
The following is a schedule by year of future minimum lease payments at July 31, 2010:
| Operating Leases | |||
| Fiscal Year |
|||
| 2011 |
$ | 2,698 | |
| 2012 |
1,215 | ||
| 2013 |
829 | ||
| 2014 |
678 | ||
| 2015 |
607 | ||
| Thereafter |
2,743 | ||
| $ | 8,770 | ||
At July 31, 2010, the Company had outstanding non-cancelable purchase orders aggregating to $62,854. The purchase orders are for manufacturing and non-manufacturing related goods and services.
12. Other income (expense):
Other income (expense) consists primarily of interest income on short- and long-term marketable securities, gain or (loss) attributable to investments on unconsolidated affiliates, which the Company accounts for under the cost or equity method, and foreign exchange gains (losses).
The Company recorded a gain on sale of other investments in fiscal year 2008 of $2,000 from the sale of 20% of its 45% equity interest in a Chinese based company (for a remaining interest of 25%). The Company recorded a gain on sale of other investments for the receipt of escrows proceeds in fiscal years 2009 and 2008 of $838 and $84, respectively, relating to the sale of the Company’s 17% ownership interest in another company in fiscal year 2007.
The Company had foreign exchange losses totaling $612 and $828 in fiscal years 2010 and 2009, respectively, and foreign exchange gains totaling $440 in fiscal year 2008.
13. Retirement Plans:
401(k) Plan
The Company has a qualified retirement plan called the Analogic 401(k) Plan (the “Plan”) to provide retirement income for eligible employees through employee contributions and contributions from the Company.
75
Table of Contents
ANALOGIC CORPORATION
NOTES TO CONSOLIDATED FINANCIAL STATEMENTS
(Continued)
Employer contributions are discretionary and may be in the form of a direct profit sharing contribution or a discretionary matching contribution as determined and approved by the Board. The Company contribution each year shall in no event exceed the maximum allowable under applicable provisions of the Internal Revenue Code. All contributions vest immediately.
The Plan, as allowed under Section 401(k) of the Internal Revenue Code, permits tax-deferred salary/wage deductions for eligible employees. Employees may contribute from 1% to 80% of their eligible compensation to the Plan, limited to a maximum annual amount as determined by the Internal Revenue Service.
Beginning in fiscal year 2003, the Company decided to contribute 5% of its net income, as defined by the Plan, to the Plan. For fiscal years 2008, the Company decided to contribute to the Plan the greater of 5% of its net income, as defined by the Plan, or $1,200. Beginning in fiscal year 2009, the Company began matching employee contributions up to 4% of eligible compensation. The Company’s contributions to the Plan totaled $2,632, $2,792, and $1,285, in fiscal years 2010, 2009, and 2008, respectively.
Defined Benefit Retirement Plan
The Company’s Canadian subsidiary, ANRAD Corporation, sponsors a defined benefit retirement plan called the Anrad Retirement Plan (the “Anrad Plan”). The Anrad Plan provides benefits to employees based on a formula recognizing length of service and final average earnings. The measurement date used for the plan is July 31. The Company recognizes the periodic pension expense in its consolidated statement of operations and the associated assets or liabilities on its consolidated balance sheet.
The estimated net prior service cost, net transition asset, and net actuarial loss for the Anrad Plan that are expected to be amortized from stockholders’ equity into pension cost in fiscal year 2011 are $9, $26, and $172, respectively. Comparable amortized amounts of net prior service cost, net transition asset, and net actuarial loss in fiscal year 2010 were $9, $25, and $174, respectively.
Amounts Recognized in Accumulated Other Comprehensive Loss
| Year Ended July 31, |
||||||||
| 2010 | 2009 | |||||||
| Net actuarial loss |
$ | (191 | ) | $ | (1,998 | ) | ||
| Net amount recognized |
$ | (191 | ) | $ | (1,998 | ) | ||
Net Periodic Benefit Cost
| July 31, | ||||||||||||
| 2010 | 2009 | 2008 | ||||||||||
| Service cost |
$ | 982 | $ | 547 | $ | 804 | ||||||
| Interest cost |
392 | 275 | 310 | |||||||||
| Expected return on plan assets |
(429 | ) | (355 | ) | (370 | ) | ||||||
| Amortization of transition asset obligations |
(25 | ) | (23 | ) | (26 | ) | ||||||
| Amortization of prior service costs |
9 | 8 | 10 | |||||||||
| Amortization of net actuarial loss recognized |
174 | — | (16 | ) | ||||||||
| Total cost |
$ | 1,103 | $ | 452 | $ | 712 | ||||||
76
Table of Contents
ANALOGIC CORPORATION
NOTES TO CONSOLIDATED FINANCIAL STATEMENTS
(Continued)
Actuarial Assumptions
Actuarial assumptions for the Anrad Plan are described below. The discount rates at July 31 were used to measure the year-end benefit obligations and the earnings effects for the subsequent year.
| July 31, | |||||||||
| 2010 | 2009 | 2008 | |||||||
| Discount rate |
5.50 | % | 5.50 | % | 6.50 | % | |||
| Expected return on assets |
6.25 | % | 6.50 | % | 6.50 | % | |||
| Salary increase |
4.00 | % | 4.00 | % | 4.00 | % | |||
To determine the expected long-term rate of return on the Anrad Plan assets, the Company considers the current and expected asset allocations, as well as historical and expected returns on various categories of plan assets.
The Company amortizes experienced gains and losses, as well as the effects of changes in actuarial assumptions and plan provisions over a period no longer than the average future service of employees.
Funding Policy
The funding policy for the Anrad Plan is to contribute amounts sufficient to meet minimum funding requirements as set forth in employee benefit and tax laws plus such additional amounts as the Company may determine to be appropriate. During fiscal years 2010, 2009, and 2008, the Company made contributions to the Anrad Plan of $1,256, $1,156, and $1,275, respectively, and made payments for benefits and administrative expenses of $169, $363, and $449, respectively. In fiscal year 2011, the Company expects to make contributions and payments for benefits and administrative expenses of $1,002 and $241, respectively.
Projected Benefit Obligation
| 2010 | 2009 | |||||||
| Balance at August 1 |
$ | 7,010 | $ | 4,219 | ||||
| Current service cost |
982 | 547 | ||||||
| Foreign currency exchange loss |
364 | 22 | ||||||
| Interest cost |
392 | 275 | ||||||
| Net actuarial loss |
242 | 2,250 | ||||||
| Plan participant contributions |
104 | 34 | ||||||
| Benefit payments |
(129 | ) | (337 | ) | ||||
| Balance at July 31 |
$ | 8,965 | $ | 7,010 | ||||
Accumulated Benefit Obligation
ABO balances for the Anrad Plan were $5,532 and $4,510 at July 31, 2010 and 2009, respectively.
77
Table of Contents
ANALOGIC CORPORATION
NOTES TO CONSOLIDATED FINANCIAL STATEMENTS
(Continued)
Fair Value of Plan Assets
| 2010 | 2009 | |||||||
| Balance at August 1 |
$ | 5,846 | $ | 5,680 | ||||
| Actual return on plan assets |
577 | (439 | ) | |||||
| Employer contributions |
1,256 | 1,156 | ||||||
| Plan participant contributions |
104 | 34 | ||||||
| Benefits paid |
(129 | ) | (337 | ) | ||||
| Foreign currency exchange (gain) loss |
311 | (248 | ) | |||||
| Balance at July 31 |
$ | 7,965 | $ | 5,846 | ||||
Plan Assets
The Anrad Plan assets are held in trust, as follows:
| July 31, 2010 | July 31, 2009 | ||||||||
| Target allocation |
Actual allocation |
Actual allocation |
|||||||
| Equity securities |
65.0 | % | 66.0 | % | 63.4 | % | |||
| Debt securities |
35.0 | % | 34.0 | % | 36.6 | % | |||
| Total |
100.0 | % | 100.0 | % | 100.0 | % | |||
The Pension Committee of the Anrad Plan sets investment policies and strategies for the Anrad Plan. Long-term strategic investment objectives include preserving the funded status of the Anrad Plan and balancing risk and return. The Pension Committee oversees the investment allocation process, which includes selecting investment managers, commissioning periodic asset-liability studies, setting long-term strategic targets and monitoring asset allocations.
Target allocation ranges are guidelines, not limitations, and occasionally the Pension Committee will approve allocations above or below a target range.
The fair value of the Anrad pension assets by asset category are as follows.
| Fair Value Measurements at July 31, 2010 using | ||||||||||||
| Assets |
Quoted Prices in Active Markets for Indentical Assets Level 1 |
Significant Other Observable Inputs Level 2 |
Significant Unobservable Inputs Level 3 |
Assets at Fair Value | ||||||||
| Pooled funds (a) |
$ | — | $ | — | $ | 7,965 | 7,965 | |||||
| Total |
$ | — | $ | — | $ | 7,965 | $ | 7,965 | ||||
| (a) | -This comprises debt and equity securities which have an underlying value traded on an active market based on the closing price of each trading day. |
78
Table of Contents
ANALOGIC CORPORATION
NOTES TO CONSOLIDATED FINANCIAL STATEMENTS
(Continued)
| Fair
Value Measurements Using Significant Unobservable Inputs (Level 3) | |||
| Balance at July 31, 2009 |
$ | 5,846 | |
| Actual return on plan assets |
|||
| Relating to assets still held at July 31, 2010 |
616 | ||
| Relating to assets sold during the period |
— | ||
| Purchase, sales, and settlements |
1,192 | ||
| Transfers in and/or out of Level 3 |
— | ||
| Foreign currency exchange loss |
311 | ||
| Balance at July 31, 2010 |
$ | 7,965 | |
Estimated Future Benefit Payments
Estimated future benefit payments under the Anrad Plan are as follows:
| 2011 |
2012 |
2013 |
2014 |
2015 |
2016-20 | |||||
| $186 |
$204 | $219 | $230 | $260 | $1,867 |
Funded Status
The amounted recognized on the Company’s balance sheet for the Anrad Plan were as follows:
| July 31, | ||||||||
| 2010 | 2009 | |||||||
| Noncurrent liabilities |
$ | (1,000 | ) | $ | (1,164 | ) | ||
| Net balance sheet asset (liability) |
$ | (1,000 | ) | $ | (1,164 | ) | ||
14. Income taxes:
A reconciliation of income taxes at the United States statutory rate to the effective tax rate follows:
| Year Ended July 31, | |||||||||
| 2010 | 2009 | 2008 | |||||||
| U.S. Federal statutory tax rate |
35 | % | -35 | % | 35 | % | |||
| State income taxes, net of federal tax benefit |
-1 | % | -74 | % | -1 | % | |||
| Incentive stock options net of disqualified dispositions |
0 | % | 18 | % | 1 | % | |||
| Domestic production benefit |
-2 | % | -6 | % | -1 | % | |||
| General business credit |
-2 | % | -216 | % | -1 | % | |||
| Valuation allowance |
3 | % | -108 | % | 1 | % | |||
| Effect of international operations |
-4 | % | -9 | % | -3 | % | |||
| Increase (decrease) in tax reserves |
-4 | % | 3 | % | 3 | % | |||
| Nondeductable meals and entertainment |
0 | % | 4 | % | 0 | % | |||
| Lobbying expense |
0 | % | 17 | % | 0 | % | |||
| Other items, net |
1 | % | 0 | % | -1 | % | |||
| Effective tax rate |
26 | % | -406 | % | 33 | % | |||
79
Table of Contents
ANALOGIC CORPORATION
NOTES TO CONSOLIDATED FINANCIAL STATEMENTS
(Continued)
The components of the provision (benefit) for income taxes on operations are as follows:
| July 31, | |||||||||||
| 2010 | 2009 | 2008 | |||||||||
| Current income taxes (benefit): |
|||||||||||
| Federal |
$ | 7,644 | $ | (3,770 | ) | $ | 5,255 | ||||
| State |
344 | (54 | ) | 21 | |||||||
| Foreign |
(183 | ) | 73 | 447 | |||||||
| 7,805 | (3,751 | ) | 5,723 | ||||||||
| Deferred income taxes (benefit): |
|||||||||||
| Federal |
(2,361 | ) | 1,961 | 5,024 | |||||||
| State |
107 | 309 | 134 | ||||||||
| Foreign |
38 | (3,434 | ) | 678 | |||||||
| (2,216 | ) | (1,164 | ) | 5,836 | |||||||
| $ | 5,589 | $ | (4,915 | ) | $ | 11,559 | |||||
Income (loss) before income taxes from domestic and foreign operations is as follows:
| July 31, | ||||||||||
| 2010 | 2009 | 2008 | ||||||||
| Domestic |
$ | 16,013 | $ | (2,664 | ) | $ | 32,272 | |||
| Foreign |
5,131 | 1,454 | 2,773 | |||||||
| $ | 21,144 | $ | (1,210 | ) | $ | 35,045 | ||||
Net deferred taxes, detailed below, recognize the impact of temporary differences between the amounts of assets and liabilities recorded for financial statement purposes and such amounts measured in accordance with tax laws:
| July 31, | ||||||||
| 2010 | 2009 | |||||||
| Depreciation related |
$ | (3,314 | ) | $ | (4,197 | ) | ||
| Goodwill and intangibles |
2,452 | 2,635 | ||||||
| Compensation |
6,482 | 2,765 | ||||||
| Accruals and reserves |
3,966 | 3,974 | ||||||
| Comprehensive income |
3,225 | 4,506 | ||||||
| Net operating loss and credit carryforwards |
7,272 | 7,580 | ||||||
| Other |
1,023 | 1,528 | ||||||
| $ | 21,106 | $ | 18,791 | |||||
| Valuation allowance |
(4,890 | ) | (4,109 | ) | ||||
| Total deferred taxes |
$ | 16,216 | $ | 14,682 | ||||
The Company does not provide for U.S. Federal income taxes on undistributed earnings of consolidated foreign subsidiaries, as such earnings are intended to be indefinitely reinvested in those operations. Determination of the potential deferred income tax liability on these undistributed earnings is not practicable because such liability, if any, is dependent on circumstances that exist if and when remittance occurs.
80
Table of Contents
ANALOGIC CORPORATION
NOTES TO CONSOLIDATED FINANCIAL STATEMENTS
(Continued)
As of July 31, 2010, the Company had net operating loss carryforwards in Belgium and Denmark of approximately $4,133 and $3,454, respectively, which have no expiration date and losses of $1,510 in China, which will expire in 2015. As of July 31, 2010, the Company also had state tax credit carryforwards of $6,943 that will expire in 2025.
Management has determined that it is more likely than not that the Company will not recognize the benefit of certain foreign losses, state losses, and tax credits and, as a result, valuation allowances have been established at July 31, 2010 and July 31, 2009. The change in the valuation allowance in fiscal year 2010 is primarily the result of the establishment of the valuation allowance of a new operation in China of $378 and the addition of state tax credits where use cannot be assured.
At the beginning of fiscal year 2008, the Company adopted FASB guidance related to accounting for uncertainty in income taxes. The guidance requires management to perform a two-step evaluation of all tax positions, ensuring that these tax return positions meet the “more likely than not” recognition threshold and can be measured with sufficient precision to determine the benefit recognized in the financial statements. These evaluations provide management with a comprehensive model for how a company should recognize, measure, present, and disclose in its financial statements certain tax positions that the Company has taken or expects to take on its income tax returns. As a result of the implementation of the guidance, the Company recognized a net increase of $2,239 to the August 1, 2007 retained earnings balance, which consisted of a non-current other asset and accrued income taxes of $3,806 and $1,567, respectively.
The following table summarizes the changes in the Company’s unrecognized income tax benefits for fiscal years 2010 and 2009:
| 2010 | 2009 | |||||||
| Balance as of beginning of fiscal year |
$ | 12,877 | $ | 18,296 | ||||
| Increases based on tax positions related to current year |
733 | 1,016 | ||||||
| Increases for tax positions of prior years |
— | 503 | ||||||
| Decreases for tax positions of prior years |
(33 | ) | (544 | ) | ||||
| Decreases due to settlements with taxing authorities |
(411 | ) | (5,560 | ) | ||||
| Decreases due to lapse of the applicable statute of limitations |
(1,001 | ) | (762 | ) | ||||
| Adjustment due to foreign exchange rate |
(41 | ) | (72 | ) | ||||
| Balance as of end of fiscal year |
$ | 12,124 | $ | 12,877 | ||||
| Net interest as of end of fiscal year |
$ | 1,270 | $ | 1,341 | ||||
The unrecognized tax benefits have decreased to $12,124 at July 31, 2010 and, if recognized in a future period, the timing of which is not estimable, the net unrecognized tax benefit of approximately $12,124 would reduce the Company’s effective tax rate. During fiscal year 2009, the Company received IRS refunds of $8,143, which included $1,262 of interest, for the carryback of a loss and research and development credits from fiscal year 2004 and from additional research and development tax credits and timing items claimed on amended income tax returns for fiscal years 2001 through 2006. The Company had recognized $2,701 of these refunds and related interest within stockholders’ equity upon the adoption of the guidance. The impact of these refunds and related interest was a reduction of unrecognized tax benefits by approximately $3,280, of which $1,356 was recorded as a tax benefit in fiscal year 2009.
The Company is subject to U.S. Federal income tax as well as the income tax of multiple state and foreign jurisdictions. The Company has concluded all U.S. Federal income tax matters through fiscal year 2002 and for
81
Table of Contents
ANALOGIC CORPORATION
NOTES TO CONSOLIDATED FINANCIAL STATEMENTS
(Continued)
fiscal years 2004 through 2006. In the next four fiscal quarters, the statute of limitations may close on the 2003 and 2007 federal and state income tax returns. It is reasonably expected that net unrecognized benefits of $1,810 from these jurisdictions may be recognized within the next four quarters. During fiscal year 2010, the Company reversed $1,750 of tax reserves due to the expiration of federal, state and foreign statutes of limitation and the effective settlements of foreign and domestic tax audits. During fiscal year 2009, the Company reversed $920 of tax reserves due to the expiration of statutes of limitations, which were partially offset by additional provisions for agreed federal and state adjustments and typical taxes owed related to the Company’s operations in that period.
The Company accrues interest and, if applicable, penalties for any uncertain tax positions. This interest and penalty expense is treated as a component of income tax expense. At July 31, 2010 and 2009, the Company had approximately $1,270 and $1,341, respectively, accrued for interest on unrecognized tax benefits.
Refundable and deferred income taxes at July 31, 2010 consisted of deferred tax assets of $7,672 and refundable income tax assets of $1,188. Refundable and deferred income taxes at July 31, 2009 consisted of deferred tax assets of $6,748 and refundable income tax assets of $4,383. The refundable income tax assets include expected federal, state, and foreign refunds that are expected to be received within the next twelve months.
15. Quarterly results of operations (unaudited):
The following is a summary of unaudited quarterly results of operations for fiscal years 2010 and 2009:
| Fiscal Year 2010 | |||||||||||||
| First Quarter |
Second Quarter |
Third Quarter |
Fourth Quarter |
||||||||||
| Net revenue |
$ | 95,377 | $ | 103,264 | $ | 107,200 | $ | 117,756 | |||||
| Gross margin |
30,862 | 38,202 | 38,040 | 42,977 | |||||||||
| Net income |
26 | 3,624 | 4,836 | 7,069 | |||||||||
| Diluted net income per share |
$ | — | $ | 0.29 | $ | 0.38 | $ | 0.56 | |||||
| Fiscal Year 2009 | |||||||||||||
| First Quarter |
Second Quarter |
Third Quarter |
Fourth Quarter |
||||||||||
| Net revenue |
$ | 101,552 | $ | 102,715 | $ | 93,593 | $ | 98,289 | |||||
| Gross margin |
31,295 | 32,903 | 30,961 | 30,037 | |||||||||
| Net income (loss) |
320 | 1,419 | 2,251 | (285 | ) | ||||||||
| Diluted net income (loss) per share |
$ | 0.02 | $ | 0.11 | $ | 0.18 | $ | (0.02 | ) | ||||
82
Table of Contents
ANALOGIC CORPORATION
NOTES TO CONSOLIDATED FINANCIAL STATEMENTS
(Continued)
16. Supplemental disclosure of cash flow information:
Changes in operating assets and liabilities, net of the impact of acquisitions, are as follows:
| Year Ended July 31, | ||||||||||||
| 2010 | 2009 | 2008 | ||||||||||
| Accounts and notes receivable |
$ | (13,006 | ) | $ | 198 | $ | 7,798 | |||||
| Inventories |
(7,435 | ) | (800 | ) | (5,391 | ) | ||||||
| Other assets |
(2,489 | ) | (418 | ) | 433 | |||||||
| Refundable income taxes |
2,831 | 5,557 | (2,202 | ) | ||||||||
| Accounts payable, trade |
3,021 | (4,648 | ) | 203 | ||||||||
| Accrued liabilities |
1,964 | (10,367 | ) | (1,972 | ) | |||||||
| Other liabilities |
625 | 569 | — | |||||||||
| Advance payments and deferred revenue |
1,546 | (3,662 | ) | (1,556 | ) | |||||||
| Accrued income taxes |
2,387 | (341 | ) | 831 | ||||||||
| Net changes in operating assets and liabilities |
$ | (10,556 | ) | $ | (13,912 | ) | $ | (1,856 | ) | |||
Supplemental disclosure of non-cash investing activities:
In connection with the acquisition of Copley, the Company estimated at July 31, 2008 that it would pay up to $1,000 to the former stockholders of Copley to reimburse them for the additional tax costs of making an election to treat the acquisition as an asset sale for tax purposes. The final amount that was actually paid to the former stockholders of Copley for the additional tax costs in the third quarter of fiscal year 2009 was $350.
17. Segment and geographic information:
The Company operates primarily within two major markets: Medical Technology and Security Technology. During the first quarter of fiscal year 2010, as part of a strategic review, the Company evaluated the appropriateness and naming of its segments. The Company decided to retain the composition of its reporting segments but change the names to more accurately depict the nature of those segments. Medical Technology consists of three reporting segments: CT and MRI (formerly Medical Imaging Products), which consists primarily of electronic systems and subsystems for CT and MRI medical imaging equipment sold primarily through OEMs; Digital Radiography, which consists primarily of state-of-the-art, direct conversion amorphous selenium-based, digital, flat-panel, x-ray detectors for diagnostic and interventional applications in mammography sold through OEMs; and Specialized Ultrasound (formerly B-K Medical), which consists of ultrasound systems and probes for the urology, ultrasound-guided surgery sold primarily through our direct sales force, and radiology markets. Security Technology consists of advanced weapon and threat detection aviation security systems and subsystems sold through an OEM customer. The Company’s Other segment represents the Company’s hotel business and general corporate income and expenses.
83
Table of Contents
ANALOGIC CORPORATION
NOTES TO CONSOLIDATED FINANCIAL STATEMENTS
(Continued)
The table below presents information about the Company’s reportable segments:
| Year Ended July 31, | ||||||||||||
| 2010 | 2009 | 2008 | ||||||||||
| Net Revenue: |
||||||||||||
| Medical Technology from external customers: |
||||||||||||
| CT and MRI (A) |
$ | 237,492 | $ | 222,245 | $ | 231,680 | ||||||
| Digital Radiography |
36,749 | 32,960 | 28,120 | |||||||||
| Specialized Ultrasound |
89,986 | 82,599 | 92,968 | |||||||||
| Total Medical Technology |
364,227 | 337,804 | 352,768 | |||||||||
| Security Technology from external customers |
50,586 | 49,056 | 49,827 | |||||||||
| Other |
8,784 | 9,289 | 10,914 | |||||||||
| Total |
$ | 423,597 | $ | 396,149 | $ | 413,509 | ||||||
| Income (loss) from operations |
||||||||||||
| Medical Technology: |
||||||||||||
| CT and MRI (B) |
$ | 9,524 | $ | (9,959 | ) | $ | 18,608 | |||||
| Digital Radiography (C) |
3,417 | 3,655 | (5,299 | ) | ||||||||
| Specialized Ultrasound (D) |
1,941 | (2,061 | ) | 4,921 | ||||||||
| Total Medical Technology |
14,882 | (8,365 | ) | 18,230 | ||||||||
| Security Technology (E) |
6,438 | 5,333 | 4,953 | |||||||||
| Other (F) |
(325 | ) | (1,153 | ) | 1,128 | |||||||
| Total income (loss) from operations |
20,995 | (4,185 | ) | 24,311 | ||||||||
| Total other income, net |
149 | 2,975 | 10,734 | |||||||||
| Income (loss) from continuing operations before income taxes |
$ | 21,144 | $ | (1,210 | ) | $ | 35,045 | |||||
| July 31, | ||||||
| 2010 | 2009 | |||||
| Identifiable assets: |
||||||
| CT and MRI (G) |
$ | 153,232 | $ | 134,202 | ||
| Digital Radiography |
33,262 | 28,562 | ||||
| Specialized Ultrasound |
88,873 | 92,551 | ||||
| Security Technology |
17,506 | 11,849 | ||||
| Corporate and other (H) |
192,903 | 196,950 | ||||
| Total |
$ | 485,776 | $ | 464,114 | ||
| (A) | The Copley revenue of $18,300 for fiscal year 2008 only includes the period of April 14, 2008 through July 31, 2008, as Copley was acquired on April 14, 2008. |
| (B) | Includes restructuring and voluntary retirement charges of $483 for fiscal year 2010. Includes restructuring and voluntary retirement charges of $4,581 and $811 for settlement of a dispute with a customer in fiscal year 2009. Includes restructuring and voluntary retirement charges of $3,624 for fiscal year 2008. |
| The Copley income before taxes of $2,328 for fiscal year 2008 only includes the period of April 14, 2008 through July 31, 2008, as Copley was acquired on April 14, 2008. |
| (C) | Includes restructuring and voluntary retirement charges of $44 for fiscal year 2010. Includes restructuring and voluntary retirement charges of $21 for fiscal year 2009. Includes restructuring and voluntary retirement charges of $46 for fiscal year 2008. |
84
Table of Contents
ANALOGIC CORPORATION
NOTES TO CONSOLIDATED FINANCIAL STATEMENTS
(Continued)
| (D) | Includes restructuring and voluntary retirement charges of $1,591 for fiscal year 2009. Includes restructuring and voluntary retirement charges of $77 for fiscal year 2008. |
| (E) | Includes restructuring and voluntary retirement charges of $163 for fiscal year 2010. Includes restructuring and voluntary retirement charges of $426 for fiscal year 2009. Includes restructuring and voluntary retirement charges of $269 for fiscal year 2008. |
| (F) | Includes the gains from the receipt of escrow proceeds of $838 and $84 during fiscal years 2009 and 2008, respectively, related to the sale of an investment in another company during fiscal year 2007. Includes the gains on the sales of a portion of the Company’s interest in a China based company of $2,000. Includes interest income of $525, $2,010, and $6,699 in fiscal years 2010, 2009, and 2008, respectively. |
| (G) | Includes goodwill and net intangible assets from the acquisition of Copley of $1,849 and $37,861, respectively, at July 31, 2010, and $2,043 and $40,792, respectively, at July 31, 2009. |
| (H) | Includes cash equivalents and marketable securities of $134,219 and $131,084 as of July 31, 2010 and 2009, respectively. |
Information regarding geographic areas for fiscal years 2010, 2009, and 2008 are as follows:
| Fiscal |
United States |
Japan | Germany | Netherlands | Other | Total | ||||||||||||||
| 2010 |
Net revenue from external customers | $ | 148,258 | $ | 72,545 | $ | 49,358 | $ | 50,011 | $ | 103,425 | $ | 423,597 | |||||||
| Long-lived assets | 46,461 | — | — | — | 35,375 | 81,836 | ||||||||||||||
| 2009 |
Net revenue from external customers | $ | 155,372 | $ | 67,984 | $ | 46,497 | $ | 44,653 | $ | 81,643 | $ | 396,149 | |||||||
| Long-lived assets | 49,458 | — | — | — | 39,267 | 88,725 | ||||||||||||||
| 2008 |
Net revenue from external customers | $ | 182,882 | $ | 84,862 | $ | 42,863 | $ | 14,227 | $ | 88,675 | $ | 413,509 | |||||||
| Long-lived assets | 53,515 | — | — | — | 41,312 | 94,827 | ||||||||||||||
Revenues are attributed to countries based on the location of the Company’s customers.
Other long-lived assets are primarily in Denmark and Canada.
18. Common stock repurchases:
On October 13, 2008, the Company announced that, on the same date, its Board had authorized the repurchase of up to $25,000 of the Company’s common stock. The Company completed the repurchase program, which was funded using the Company’s available cash, in the second quarter of fiscal year 2009. During fiscal year 2009, the Company repurchased 736,694 shares of common stock under this repurchase program for $25,022 at an average purchase price per share of $33.97. Included in the $25,022 paid for the common stock under this program was $22 of commissions and fees to the Company’s broker.
19. Related party transactions:
In April 2010, the Company invested $1,900 in a start-up company with proprietary technology expected to be utilized in the Company’s Specialized Ultrasound business. The Company has received $438 of engineering services from this start-up Company during fiscal year 2010.
At July 31, 2010, the Company had a net advance payments and deferred revenue balance of $954 from its China based affiliate. At July 31, 2009, the Company had a net receivable $160 from its China based affiliate. Sales to this China based affiliate for fiscal years 2010, 2009, and 2008 were approximately $1,289, $1,915, and $989 respectively.
85
Table of Contents
ANALOGIC CORPORATION
NOTES TO CONSOLIDATED FINANCIAL STATEMENTS
(Continued)
During fiscal year 2008, Ross Brown, who serves on the Board, received payments from the Company of $4 for consulting services provided to the Company.
20. Subsequent events:
On September 22, 2010, the Company announced that its Board, on September 17, 2010, declared a dividend of $0.10 per common share payable on October 20, 2010 to stockholders of record on October 6, 2010.
86
Table of Contents
SCHEDULE II—VALUATION AND QUALIFYING ACCOUNTS
(In thousands)
| Description |
Balance at Beginning of Period |
Charged to Costs and Expenses |
Deductions | Balance at End of Period | |||||||||
| Allowance for doubtful accounts |
|||||||||||||
| Year ended July 31, 2010 |
$ | 728 | $ | 587 | $ | (699 | ) | $ | 616 | ||||
| Year ended July 31, 2009 |
998 | 427 | (697 | ) | 728 | ||||||||
| Year ended July 31, 2008 |
1,427 | 459 | (888 | ) | 998 | ||||||||
| Description |
Balance at Beginning of Period |
Charged to Costs and Expenses |
Deductions | Balance at End of Period | |||||||||
| Year ended July 31, 2010 income tax valuation allowance |
$ | 4,109 | $ | 781 | $ | — | $ | 4,890 | |||||
| Year ended July 31, 2009 income tax valuation allowance |
4,647 | 1,282 | (1,820 | ) | 4,109 | ||||||||
| Year ended July 31, 2008 income tax valuation allowance |
3,864 | 934 | (151 | ) | 4,647 | ||||||||
Changes in valuation allowance represents changes in Federal, state and foreign tax attributes for which the Company believes it is more likely than not that they will not be able to utilize.
87
Table of Contents
| Title |
Incorporated by Reference to | |||||
| 2.1 | Shares Purchase Agreement, dated as of January 30, 2008, between Analogic Corporation and Chonqing Anke Medical Equipment Co. | Exhibit 2.1 to the Company’s Current Report on Form 8-K filed on February 5, 2008 | ||||
| 2.2 | Termination Agreement, dated as of January 30, 2008, between Analogic Corporation and Shenzhen Anke High-Tech Company Limited | Exhibit 2.2 to the Company’s Current Report on Form 8-K filed on February 5, 2008 | ||||
| 2.3 | Agreement and Plan of Merger, dated as of March 5, 2008, by and among Analogic Corporation, Canton Merger Corporation, Copley Controls Corporation (“Copley”), the Principal Shareholders of Copley named therein, the Additional Shareholders of Copley named therein and Matthew Lorber, as the Securityholders’ Representative | Exhibit 2.1 to the Company’s Current Report on Form 8-K filed on March 6, 2008 | ||||
| 3.1 | Restated Articles of Organization, as amended | Exhibit 3.1 to the Company’s Current Report on Form 8-K filed on January 30, 2009 | ||||
| 3.2 | By-laws, as amended | Exhibit 3.1 to the Company’s Current Report on Form 8-K filed on February 3, 2010 | ||||
| * |
10.1 | Form of Indemnity Agreement | Exhibit 10.19 to the Company’s Annual Report on Form 10-K for the fiscal year ended July 31, 1987 | |||
| * |
10.2 | Form of Indemnity Agreement for Directors and Executive Officers of Analogic Corporation | Exhibit 10.1 to the Company’s Current Report on Form 8-K filed on October 9, 2007 | |||
| * |
10.3 | Key Employee Stock Bonus Plan dated March 14, 1983, as amended on January 27, 1988 | Exhibit 10.1 to the Company’s Quarterly Report on Form 10-Q for the three months ended January 31, 2006 | |||
| * |
10.4 | Form of Restricted Stock Grant for Key Employee Stock Bonus Plan dated March 14, 1983, as amended on January 27, 1988 | Exhibit 10.23 to the Company’s Annual Report on Form 10-K for the fiscal year ended July 31, 2007 | |||
| * |
10.5 | Employee Qualified Stock Purchase Plan dated June 10, 1986, as amended October 9, 1997 and October 15, 2002 | Exhibit 10.1 to the Company’s Post-Effective Amendment No. 2 to Registration Statement on Form S-8 filed on July 24, 2003 | |||
| * |
10.6 | Key Employee Incentive Stock Option Plan dated June 11, 1993, as amended October 12, 2000, November 16, 2001, and September 20, 2006 | Exhibit 10.7 to the Company’s Annual Report on Form 10-K for the fiscal year ended July 31, 2006 | |||
| * |
10.7 | 1997 Non-Qualified Stock Option Plan for Non-Employee Directors dated January 31, 1997, as amended December 8, 2003 and September 20, 2006 | Exhibit 10.8 to the Company’s Annual Report on Form 10-K for the fiscal year ended July 31, 2006 | |||
| * |
10.8 | Form of Stock Option Grant for 1997 Non-Qualified Stock Option Plan for Non-Employee Directors dated January 31, 1997, as amended December 8, 2003 and September 20, 2006 | Exhibit 10.29 to the Company’s Annual Report on Form 10-K for the fiscal year ended July 31, 2004 | |||
88
Table of Contents
| Title |
Incorporated by Reference to | |||||
| * |
10.9 | Key Employee Incentive Stock Option Plan dated June 11, 1998, as amended October 12, 2000, November 16, 2001, and September 20, 2006 | Exhibit 10.9 to the Company’s Annual Report on Form 10-K for the fiscal year ended July 31, 2006 | |||
| * |
10.10 | Form of Stock Options Grant for Key Employee Incentive Stock Option Plan dated June 11, 1998, as amended October 12, 2000, November 16, 2001, and September 20, 2006 | Exhibit 10.30 to the Company’s Annual Report on Form 10-K for the fiscal year ended July 31, 2004 | |||
| * |
10.11 | Key Employee Stock Bonus Plan dated October 12, 2000, as amended March 11, 2003 | Appendix A to the Company’s Definitive Proxy Statement dated December 15, 2003 for the Company’s Annual Meeting of Stockholders held January 16, 2004 | |||
| * |
10.12 | Form of Restricted Stock Grant for Key Employee Stock Bonus Plan dated October 12, 2000, as amended March 11, 2003 | Exhibit 10.31 to the Company’s Annual Report on Form 10-K for the fiscal year ended July 31, 2004 | |||
| * |
10.13 | 2007 Stock Option Plan | Exhibit 10.1 to the Company’s Current Report on Form 8-K filed on February 2, 2007 | |||
| * |
10.14 | Form of Stock Option Award Agreement for 2007 Stock Option Plan | Exhibit 10.3 to the Company’s Current Report on Form 8-K filed on February 2, 2007 | |||
| * |
10.15 | 2007 Restricted Stock Plan | Exhibit 10.2 to the Company’s Current Report on Form 8-K filed on February 2, 2007 | |||
| * |
10.16 | Form of Restricted Stock Award Agreement for 2007 Restricted Stock Plan used for awards granted prior to October 14, 2009 | Exhibit 10.4 to the Company’s Current Report on Form 8-K filed on February 2, 2007 | |||
| * |
10.17 | Form of Restricted Stock Award Agreement for 2007 Restricted Stock Plan used for awards granted on October 14, 2009 | ||||
| * |
10.18 | Analogic Corporation 2009 Stock Incentive Plan | Exhibit 10.1 to the Company’s Current Report on Form 8-K filed on February 3, 2010 | |||
| * |
10.19 | Form of Performance-Based Restricted Stock Unit Award Agreement for the Analogic Corporation 2009 Stock Incentive Plan | Exhibit 10.2 to the Company’s Current Report on Form 8-K filed on February 3, 2010 | |||
| * |
10.20 | Form of Time-Based Restricted Stock Unit Agreement for 2009 Stock Incentive Plan | Exhibit 10.3 to the Company’s Quarterly Report on Form 10-Q for the six months ended January 31, 2010 | |||
| * |
10.21 | Form of Nonstatutory Stock Option Agreement for 2009 Stock Incentive Plan | Exhibit 10.4 to the Company’s Quarterly Report on Form 10-Q for the six months ended January 31, 2010 | |||
| * |
10.22 | Non-Employee Director Stock Plan | Exhibit 10.1 to the Company’s Current Report on Form 8-K filed on February 1, 2008 | |||
| * |
10.23 | Nonqualified Deferred Compensation Plan | Exhibit 10.1 to the Company’s Current Report on Form 8-K filed on August 14, 2008 | |||
89
Table of Contents
| Title |
Incorporated by Reference to | |||||
| * |
10.24 | Analogic 401(k) Plan (January 1, 2007 Restatement) | Exhibit 10.22 to the Company’s Annual Report on Form 10-K for the fiscal year ended July 31, 2007 | |||
| * |
10.25 | Form of Notice to Executive Officers (at Vice President or higher level) regarding the Analogic Corporation Annual Incentive Plan for Fiscal Year 2010 | Exhibit 10.1 to the Company’s Quarterly Report on Form 10-Q for the three months ended October 31, 2009 | |||
| * |
10.26 | Form of Notice to Executive Officers (who are Business Unit heads) regarding the Analogic Corporation Annual Incentive Plan for Fiscal Year 2010 | Exhibit 10.2 to the Company’s Quarterly Report on Form 10-Q for the three months ended October 31, 2009 | |||
| * |
10.27 | Severance and Settlement Agreement and Release between Analogic Corporation and John W. Wood Jr., dated January 29, 2007 | Exhibit 10.5 to the Company’s Current Report on Form 8-K filed on February 2, 2007 | |||
| * |
10.28 | Letter Agreement between Analogic Corporation and James Green, dated April 20, 2007 and accepted and agreed to by Mr. Green on May 1, 2007 | Exhibit 10.1 to the Company’s Current Report on Form 8-K filed on May 7, 2007 | |||
| * |
10.29 | Amendment, dated December 24, 2008, to the Letter Agreement between Analogic Corporation and James Green, dated April 20, 2007 | Exhibit 10.2 to the Company’s Quarterly Report on Form 10-Q for the three months ended January 31, 2009 | |||
| * |
10.30 | Letter Agreement, dated as of November 23, 2007, between Analogic Corporation and Bernard M. Gordon | Exhibit 10.1 to the Company’s Current Report on Form 8-K filed on November 29, 2007 | |||
| * |
10.31 | Separation Agreement, dated as of January 31, 2008, between Analogic Corporation and Alex A. Van Adzin | Exhibit 10.1 to the Company’s Current Report on Form 8-K filed on February 5, 2008 | |||
| * |
10.32 | Letter Agreement between Analogic Corporation and John J. Fry, dated October 29, 2007 and accepted and agreed to by Mr. Fry on October 30, 2007 | Exhibit 10.3 to the Company’s Quarterly Report on Form 10-Q for the three months ended October 31, 2007 | |||
| * |
10.33 | Amendment, dated December 24, 2008, to Letter Agreement between Analogic Corporation and John J. Fry, dated October 29, 2007 | Exhibit 10.3 to the Company’s Quarterly Report on Form 10-Q for the three months ended January 31, 2009 | |||
| * |
10.34 | Form of Change of Control Agreement for Certain Executive Officers of Analogic Corporation | Exhibit 10.1 to the Company’s Current Report on Form 8-K filed on May 24, 2007 | |||
| * |
10.35 | Change of Control Agreement, dated December 24, 2008, between Analogic Corporation and John Millerick | Exhibit 10.1 to the Company’s Quarterly Report on Form 10-Q for the three months ended January 31, 2009 | |||
| * |
10.36 | Incumbent Director Resignation Policy | Appendix C to the Company’s Definitive Proxy Statement dated November 28, 2008 for the Company’s Annual Meeting of Stockholders held January 26, 2009 | |||
90
Table of Contents
| Title |
Incorporated by Reference to | |||||
| * |
10.37 | Severance Plan for Management Employees, as Amended and Restated, effective as of December 31, 2008 | Exhibit 10.4 to the Company’s Quarterly Report on Form 10-Q for the three months ended January 31, 2009 | |||
| * |
10.38 | Separation Agreement, dated June 10, 2009, between Analogic Corporation and John J. Millerick | Exhibit 10.1 to the Company’s Current Report on Form 8-K filed on June 12, 2009 | |||
| * |
10.39 | Employment Agreement, dated June 8, 2009, between Analogic Corporation and Michael L. Levitz | Exhibit 10.2 to the Company’s Current Report on Form 8-K filed on June 12, 2009 | |||
| 10.40 | Stock Purchase Agreement dated as of November 1, 2005, between Analogic Corporation and Emageon Inc. | Exhibit 2.1 to the Company’s Current Report on Form 8-K filed on November 4, 2005 | ||||
| 21 | List of Subsidiaries | |||||
| 23 | Consent of PricewaterhouseCoopers LLP | |||||
| 31.1 | Certification of Chief Executive Officer pursuant to Rule 13a-14(a)/Rule 15d-14(a) of the Securities Exchange Act of 1934, as amended | |||||
| 31.2 | Certification of Chief Financial Officer pursuant to Rule 13a-14(a)/Rule 15d-14(a) of the Securities Exchange Act of 1934, as amended | |||||
| 32.1 | Certification of Chief Executive Officer pursuant to 18 U.S.C. Section 1350, as adopted pursuant to Section 906 of the Sarbanes-Oxley Act of 2002 | |||||
| 32.2 | Certification of Chief Financial Officer pursuant to 18 U.S.C. Section 1350, as adopted pursuant to Section 906 of the Sarbanes-Oxley Act of 2002 | |||||
| * | Management contract or compensatory plan or arrangement |
91