Attached files
| file | filename |
|---|---|
| EX-21 - SUBSIDIARIES - TPC Group Inc. | dex21.htm |
| EX-32.2 - CERTIFICATION OF CFO (906) - TPC Group Inc. | dex322.htm |
| EX-31.2 - CERTIFICATION OF CFO (302) - TPC Group Inc. | dex312.htm |
| EX-32.1 - CERTIFICATION OF CEO (906) - TPC Group Inc. | dex321.htm |
| EX-31.1 - CERTIFICATION OF CEO (302) - TPC Group Inc. | dex311.htm |
| EX-23.1 - CONSENT OF GRANT THORNTON LLP - TPC Group Inc. | dex231.htm |
Table of Contents
Index to Financial Statements
UNITED STATES
SECURITIES AND EXCHANGE COMMISSION
Washington, D.C. 20549
Form 10-K
| x | ANNUAL REPORT PURSUANT TO SECTION 13 OR 15(d) OF THE SECURITIES EXCHANGE ACT OF 1934 |
For the Fiscal Year Ended June 30, 2010
or
| ¨ | TRANSITION REPORT PURSUANT TO SECTION 13 OR 15(d) OF THE SECURITIES EXCHANGE ACT OF 1934 |
For the Transition Period from to
Commission File No. 001-34727

TPC Group Inc.
(Exact name of registrant as specified in its charter)
| Delaware | 20-0863618 | |
| (State or other jurisdiction of incorporation or organization) |
(I.R.S. Employer Identification No.) |
5151 San Felipe, Suite 800
Houston, Texas 77056
(Address of principal executive offices, including zip code)
(713) 627-7474
(Registrant’s telephone number, including area code)
Securities registered pursuant to Section 12(b) of the Act:
| Title of each class |
Name of each exchange on which registered | |
| Common Stock, $0.01 par value | NASDAQ Stock Exchange |
Securities registered pursuant to Section 12(g) of the Act: None
Indicate by check mark if the registrant is a well-known seasoned issuer, as defined in Rule 405 of the Securities Act. Yes ¨ No x
Indicate by check mark if the registrant is not required to file reports pursuant to Section 13 or Section 15(d) of the Exchange Act. Yes ¨ No x
Indicate by check mark whether the registrant (1) has filed all reports required to be filed by Section 13 or 15(d) of the Securities Exchange Act of 1934 during the preceding 12 months (or for such shorter period that the registrant was required to file such reports), and (2) has been subject to such filing requirements for the past 90 days. Yes x No ¨
Indicate by check mark whether the registrant has submitted electronically and posted on its corporate Web site, if any, every Interactive Data File required to be submitted and posted pursuant to Rule 405 of Regulation S-T during the preceding 12 months (or for such shorter period that the registrant was required to submit and post such files). Yes ¨ No ¨
Indicate by check mark if disclosure of delinquent filers pursuant to Item 405 of Regulation S-K is not contained herein, and will not be contained, to the best of registrant’s knowledge, in definitive proxy or information statements incorporated by reference in Part III of this Form 10-K or any amendment to this Form 10-K. x
Indicate by check mark whether the registrant is a large accelerated filer, an accelerated filer, or a smaller reporting company. See definitions of “large accelerated filer,” “accelerated filer” and “smaller reporting company” in Rule 12b-2 of the Exchange Act:
| Large accelerated filer |
¨ |
Accelerated filer |
¨ | |||
| Non-accelerated filer |
¨ (Do not check if a smaller reporting company) |
Smaller reporting company |
x | |||
Indicate by check mark whether the registrant is a shell company (as defined in Rule 12b-2 of the Act). Yes ¨ No x
The aggregate market value of the registrant’s common stock held by non-affiliates of the registrant was approximately $63.8 million on December 31, 2009, based on $7.75, the last quotation on Pink OTC Markets on such date.
There were 18,255,698 shares of the registrant’s common stock outstanding as of September 10, 2010.
Table of Contents
Index to Financial Statements
DOCUMENTS INCORPORATED BY REFERENCE
Portions of the registrant’s definitive proxy statement for the 2010 Annual Meeting of Stockholders, to be filed no later than 120 days after the end of the fiscal year, are incorporated by reference into Part III of this Annual Report on Form 10-K.
Table of Contents
Index to Financial Statements
| Page | ||||
| PART I | ||||
| Item | ||||
| 1. |
1 | |||
| 1A. |
12 | |||
| 1B. |
19 | |||
| 2. |
20 | |||
| 3. |
21 | |||
| 4. |
21 | |||
| PART II | ||||
| 5. |
22 | |||
| 6. |
24 | |||
| 7. |
Management’s Discussion and Analysis of Financial Condition and Results of Operations |
26 | ||
| 7A. |
43 | |||
| 8. |
45 | |||
| 9. |
Changes in and Disagreements with Accountants on Accounting and Financial Disclosure |
81 | ||
| 9A. |
81 | |||
| 9B. |
81 | |||
| PART III | ||||
| 10. |
82 | |||
| 11. |
82 | |||
| 12. |
Security Ownership of Certain Beneficial Owners and Management and Related Stockholder Matters |
82 | ||
| 13. |
Certain Relationships and Related Transactions, and Director Independence |
82 | ||
| 14. |
82 | |||
| PART IV | ||||
| 15. |
83 | |||
Table of Contents
Index to Financial Statements
CAUTIONARY INFORMATION REGARDING FORWARD-LOOKING STATEMENTS
This Annual Report on Form 10-K and any exhibits to this Annual Report on Form 10-K may contain or incorporate by reference forward-looking statements that do not directly or exclusively relate to historical facts. You can typically identify forward-looking statements by the use of forward-looking words, such as “may,” “should,” “could,” “project,” “believe,” “anticipate,” “expect,” “estimate,” “continue,” “potential,” “plan,” “forecast” and other words of similar import. Forward-looking statements include information concerning possible or assumed future results of our operations, including the following:
| • | business strategies; |
| • | operating and growth initiatives and opportunities; |
| • | competitive position; |
| • | market outlook and trends in our industry; |
| • | expected financial condition; |
| • | future cash flows; |
| • | financing plans; |
| • | expected results of operations; |
| • | future capital and other expenditures; |
| • | availability of raw materials and inventories; |
| • | the business cyclicality of the petrochemicals industry; |
| • | plans and objectives of management; |
| • | future compliance with orders and agreements with regulatory agencies; |
| • | expected outcomes of legal, environmental or regulatory proceedings and their expected effects on our results of operations; and |
| • | any other statements regarding future growth, future cash needs, future operations, business plans and future financial results. |
These forward-looking statements represent our intentions, plans, expectations, assumptions and beliefs about future events and are subject to risks, uncertainties and other factors. Many of those factors are outside of our control and could cause actual results to differ materially from the results expressed or implied by the forward-looking statements.
In light of these risks, uncertainties and assumptions, the events described in the forward-looking statements might not occur or might occur to a different extent or at a different time than we have described. You should consider the areas of risk and uncertainty described above, as well as those discussed under “Item 1A–Risk Factors” in this Annual Report on Form 10-K. Except as may be required by applicable law, we undertake no obligation to update or revise any forward-looking statements, whether as a result of new information, future events or otherwise.
PART I
| ITEM 1. | BUSINESS |
Except as otherwise indicated or required by the context, references in this report to “we,” “our,” and “the Company,” refer to the combined business of TPC Group Inc. and its direct and indirect subsidiaries.
Overview
TPC Group Inc., formerly known as Texas Petrochemicals Inc., is a leading producer of value-added products derived from niche petrochemical raw materials such as C4 hydrocarbons. Our products are sold to producers of a wide range of performance, specialty and intermediate products, including synthetic rubber, fuels, lubricant additives, plastics and surfactants. We are a leader in North America across our major product lines, including our position as the largest producer by production capacity of finished butadiene, the second largest active merchant producer by production capacity of isobutylene and the sole merchant producer of highly reactive polyisobutylene, a major component of dispersants for the fuel and lubricant additive markets. We operate as a value-added merchant processor and marketer, linking our raw material providers with our diverse customer base of chemical consumers. We believe this market position has resulted in stable supplier and customer bases and has enhanced our growth and expansion opportunities.
1
Table of Contents
Index to Financial Statements
The primary driver of our businesses is general economic and industrial growth. Our results are impacted by the effects of economic upturns or downturns on our customers and our suppliers, as well as on our own costs to produce, sell and deliver our products. Our customers generally use our products in their own production processes; therefore, if our customers curtail production of their products, our results could be significantly affected. Our feedstock costs and product prices are susceptible to volatility in pricing and availability of crude oil, natural gas and oil-related products such as unleaded regular gasoline. Prices for these products tend to be volatile as well as cyclical, as a result of global and local economic factors, worldwide political events, weather patterns and the economics of oil and natural gas exploration and production, among other things.
We operate in two principal business segments, C4 Processing and Performance Products. In the C4 Processing segment, we process the crude C4 stream into several higher value components, namely butadiene, butene-1, raffinates and methyl tertiary-butyl ether (“MTBE”). In our Performance Products segment, we produce high purity isobutylene, and we process isobutylene to produce higher-value derivative products such as polyisobutylene and diisobutylene. We also process refinery grade propylene into nonene, tetramer and associated by-products as a part of our Performance Products segment. Prior to the third quarter of fiscal 2008, MTBE was a third operating segment, but since that time MTBE has been included in our C4 Processing segment, as we produce MTBE solely as a by-product of our C4 processing operations following the shutdown of our dehydrogenation units in fiscal 2008.
The primary products in our C4 Processing segment include:
| • | butadiene, primarily used to produce synthetic rubber that is mainly used in tires and other automotive products; |
| • | butene-1, primarily used in the manufacture of plastic resins and synthetic alcohols; |
| • | raffinates, primarily used in the manufacturing of alkylate, a component of premium unleaded gasoline; and |
| • | MTBE, primarily used as a gasoline blending stock. |
The primary products in our Performance Products segment include:
| • | high purity isobutylene (“HPIB”), primarily used in the production of synthetic rubber, lubricant additives, surfactants and coatings; |
| • | conventional polyisobutylenes (“PIB”) and highly reactive polyisobutylenes (“HR-PIB”), primarily used in the production of fuel and lubricant additives, caulks, adhesives, sealants and packaging; |
| • | diisobutylene (“DIB”), primarily used in the manufacture of surfactants, plasticizers and resins; and |
| • | nonene and tetramer, primarily used in the production of plasticizers, surfactants and lubricant additives. |
See Note O to our Consolidated Financial Statements included in this Annual Report on Form 10-K for additional information about our business segments.
We have three principal processing facilities, all of which we own, located in Houston, Texas, Port Neches, Texas and Baytown, Texas. The Houston and Port Neches facilities, which process crude C4 into butadiene and related products, are strategically located near most of the significant petrochemical consumers in Texas and Louisiana. Our Baytown facility primarily produces nonene and tetramer. All three locations provide convenient access to other Gulf Coast petrochemicals producers and are connected to several of our customers and raw materials suppliers through an extensive pipeline network. In addition, our Houston and Port Neches facilities are serviced by rail, tank truck, barge and ocean-going vessel.
Our Competitive Strengths
Our overarching competitive strength is our focus on specific market segments, unlike most of our competitors whose focus is divided among many broader market segments. Within our key focus area, C4 hydrocarbons, the number of competitors is generally much lower as compared to many other petrochemicals.
We have market-leading production capabilities in our major product lines. Through our C4 processing operations, we are the largest producer by production capacity of finished butadiene and butene-1 in North America. We are one of only two North American crude C4 processors that can separate and purify butene-1 from crude C4. In addition, we are the sole producer of chemical grade DIB in North America and the second largest merchant producer by production capacity of HPIB in North America.
Our business model is designed to mitigate risk through index-based pricing which links our feedstock and finished product prices to similar commodity price indices. The pricing of our raw material is usually linked to a commodity market
2
Table of Contents
Index to Financial Statements
index (such as indices based on the price of unleaded regular gasoline, butane, isobutane or refinery grade propylene) or to the price at which we sell the finished product. The prices at which we sell our products are also typically linked to a commodity index, and in many cases, the indices used match those in the corresponding supply agreement. Such linkage of purchases of feedstocks and sales of finished products mitigates, to varying degrees, our exposure to volatility in commodity prices.
Our differentiated technology enables us to capitalize on niche market opportunities. We hold several patents related to the production of HR-PIB and are the sole merchant producer in North America of this specialized product. Our leadership in our product lines has contributed to economies of scale and long-term relationships with many of our major customers and suppliers. We believe the performance of our patented HR-PIB product is a key reason for the increase in our PIB market share (measured by volume) from 0% in 2000 to approximately 50% in 2009 and 2010. We expect continued market share growth driven by what we believe to be superior performance that better meets customer needs.
Our large and flexible production capabilities make us an attractive business partner for our customers and suppliers. The customers for our products increasingly are motivated to reduce their number of vendors and obtain the largest product quantities possible from the vendors they engage. Our position as a large producer (if not the largest producer) by production capacity of many of our products allows us to deliver quantities that many of our competitors may not be able to match. Additionally, the flexibility of our facilities and equipment gives us the ability to be a reliable purchaser of feedstocks from our suppliers. Many of our suppliers rely on us to purchase the feedstocks they produce so that they are not left to process those streams themselves. We believe we are able to satisfy our suppliers’ needs more consistently than many of our competitors, in large part because our facilities are sufficiently adaptable that we can process widely varying qualities and quantities of crude C4 and other feedstocks. We can process a wider range of feedstocks than most of our competitors because of more extensive hardware that allows cost-effective separations. This is an important advantage since the quality of feedstocks changes with time even from the same supplier. Variability in feedstock quality is expected to continue and possibly increase over time. We believe our reputation as a reliable purchaser gives us an advantage in obtaining feedstocks in periods of tight supply.
Operating as an independent merchant processor gives us a competitive advantage. Our status as an independent merchant processor gives our business partners an option to purchase from or sell to an entity that is not a competitor to them, unlike many of the large chemical companies and integrated petroleum companies with whom we compete. Additionally, because we are independent and for the most part do not rely on internally-generated feedstocks, our production capacity is dedicated to meet the requirements of our suppliers. This gives us an advantage over producers whose crude C4 streams are generated primarily as a by-product of their own ethylene production. The amount of crude C4 produced by non-independent processors varies according to the quantity and means of production of ethylene, thus limiting the capacity such producers are able to dedicate to outside suppliers’ needs.
We add value for our customers and suppliers by our extensive logistics network. We employ a flexible, extensive logistics footprint to streamline the delivery of feedstocks to our facilities and the delivery of products to our customers, and to provide terminaling and storage services. Unlike many of our competitors, we are unique in owning two deep-sea docks with extensive supporting pipelines and storage. Additionally, our railcar logistics capability uniquely allows us to source crude C4 from sources not economic to other processors. We own approximately 264 miles of product and feedstock pipelines, which gives us the ability to directly connect many of our facilities, docks and product terminals to our suppliers and customers. For example, for our butadiene customers, we own a proprietary pipeline system connecting several facilities, allowing us to serve many of our large customers independent of the Texas Butadiene Pipeline Corridor, which is controlled by ExxonMobil and upon which other suppliers must rely for transportation. In addition, our Houston and Port Neches facilities are serviced by rail, tank truck, barge and ocean-going vessel. We also own and operate storage and terminal assets at our Baytown facility and in Lake Charles, Louisiana for several parties. We also have 20 million pounds of butadiene storage capability at our Houston facility, constituting the largest butadiene storage capacity on the Gulf Coast.
We have strong long-term relationships with large, established customers and feedstock suppliers. We sell to a large number of chemical producers and refiners, including our largest customer, The Goodyear Tire and Rubber Company, as well as several others such as The Dow Chemical Company, PMI Trading LTD, Afton Chemical Corporation, Lanxess Corporation, Invista S.àr.l., Bridgestone/Firestone Inc., Valero Energy Corporation, Motiva Enterprises LLC and SI Group Inc. We purchase our raw material feedstocks from a large number of suppliers, including The Dow Chemical Company, Nova Chemicals Corporation, ExxonMobil Corporation, Chevron Phillips Chemical Company LLC, Lyondell Chemical Company, Flint Hills Resources, LP, Formosa Plastics Corporation, Trammochem, and Total Petrochemicals USA Inc. We have strong, long-tenured relationships with most of these customers and suppliers.
We have an experienced management team. We have an experienced management team with a diverse background and extensive management expertise in the energy and petrochemicals industries, including significant commercial, marketing, operational, engineering, legal, regulatory, financial, acquisition and business development expertise.
3
Table of Contents
Index to Financial Statements
Our Business Strategy
Our strategy is to create stockholder value via superior execution and sharp focus on the specific markets where we believe we can achieve and maintain competitive advantage. Such niches are typically too narrow to be attractive to larger petrochemical producers. We believe both our C4 Processing and Performance Products segments capitalize on these market dynamics. We have a combination of large scale, leading market share in many of our products, strong infrastructure, differentiated technology in certain of our products, and a business model generally free of conflicts with our suppliers and customers. Collectively, this combination is unique in the C4 hydrocarbons industry. We believe it provides us with strong opportunities for growth.
Our execution focuses on improving our existing businesses through commercial, operational and financial excellence, pursuing product line and geographic extensions and acquiring complementary businesses or assets which enhance our existing business. Specifically, we intend to:
| • | Maintain our position as a market leader. We seek to maintain our position as one of the leading producers by production capacity of each of our products by maximizing the use of our existing processing capacity and the value of our customer and supplier relationships. We continually seek new opportunities and uses for underutilized facilities. |
| • | Grow our HR-PIB business. Demand for HR-PIB is growing at a faster rate than the overall PIB market due to economic and performance advantages that result from its use by our customers. To capitalize on this demand in the HR-PIB marketplace, we brought our second production unit online at our Houston facility in October 2008 and have been focused on moving commercial HR-PIB production volumes from that unit into the marketplace. As customer demand for this product globalizes, we intend to expand production and sales into foreign markets. |
| • | Maintain a disciplined approach to cost management and preserve financial flexibility. Because our industry is cyclical and subject to fluctuations in demand, pricing and profitability, we believe that it is important to maintain a balance sheet that preserves our ability to respond to such changes and the flexibility to consider the long-term performance of our investments. In 2009, we aggressively implemented initiatives to reduce capital and discretionary spending and reduce costs through headcount reductions and other means. We continue to maintain this disciplined approach to spending, while continuing to make baseline expenditures to preserve operational reliability and enhance our reputation as a dependable, high-quality producer. We have also taken steps to strengthen our balance sheet. In April 2010, we amended our Revolving Credit Facility to increase overall capacity from $140 million $175 million, subject to borrowing base calculations, and extended the maturity date from June 2011 to at least March 2013. As of September 10, 2010, we had no outstanding borrowings under our Revolving Credit Facility, with excess availability of $175 million. We expect that our cash flow and available borrowings will provide sufficient capital to fund our near-term growth and maintenance plans. |
| • | Pursue growth initiatives as part of our efforts to increase profitability. We continually assess opportunities for property acquisitions and corporate transactions with the potential to enhance our earnings and optimize our asset portfolio. Additionally, over the past several years we have been reinvesting cash from operations to build on and expand our product offerings into high-margin businesses closely related to our core competencies. These initiatives include the production of nonene and tetramer from our previously idle Baytown facility and the expansion of polyisobutylene operations at our facility in Houston. We intend to continue to pursue similar growth initiatives as part of our efforts to diversify our product mix and increase profitability. |
Our History
In January 2010, Texas Petrochemicals Inc., a Delaware corporation formed in March 2004, changed its name to TPC Group Inc. At the same time, its wholly owned operating subsidiary, Texas Petrochemicals LLC, a Texas limited liability company, changed its name to TPC Group LLC.
Our business is a successor to Texas Olefins Company, a company that was founded in 1968 and initially engaged in hydrocarbon trading activities. In 1984, Texas Olefins Company acquired various assets from Tenneco, Inc., including our Houston facility. Texas Olefins Company subsequently operated as Texas Petrochemicals Corporation. In 1996, during a period of strong profitability in the MTBE market, the business was purchased by management and other investors in a leveraged buyout.
The MTBE market was severely impacted in the early 2000s by regulatory changes in various states, including changes that banned the use of MTBE as a gasoline blending stock. These factors led to the conclusion that future cash flows of the
4
Table of Contents
Index to Financial Statements
business would be insufficient to meet its subordinated bond interest payments over the long-term, and that a permanent financial restructuring would be required. As a result, on July 21, 2003, the operating subsidiary filed a voluntary petition for relief under Chapter 11 of the U.S. Bankruptcy Code. Pursuant to a court-approved plan of reorganization, the operating subsidiary was acquired by Texas Petrochemicals Inc. (now known as TPC Group Inc.), a holding company owned by a new group of stockholders, including previous bondholders and unsecured creditors. As a result of the plan of reorganization, the operating subsidiary emerged from its Chapter 11 proceedings on May 6, 2004.
Market Conditions and Recent Initiatives
The global recession that began in early fiscal 2009 continued to develop through the remainder of the fiscal year, resulting in a significant decline in the selling prices for our products. In response to these developments, in December 2008 we temporarily idled various production units at both our Houston and Port Neches facilities in order to reduce operating costs and match production to the reduced needs of our customers and suppliers. We also released a portion of our contractor workforce to further reduce costs. In the third quarter of fiscal 2009, demand for some products began to improve relative to the previous months, and we restarted all of the production facilities that we idled in December 2008. However, our butadiene production continued to be negatively impacted by limited supply of crude C4, the raw material input for our C4 Processing extraction process.
We receive most of our crude C4 from steam crackers, which are designed to process naphtha and natural gas liquids as feedstocks for ethylene production. Crude C4 is a byproduct of the ethylene production process, and the volume of crude C4 produced by the process is driven by both the volume of ethylene produced and the composition of the steam cracker feedstock. Some major ethylene producers have the flexibility to vary from light feedstocks, such as natural gas liquids (NGLs), to heavier feedstocks, such as naphtha, or vice versa depending on the economics of the feedstock. When ethylene producers process heavier feedstock, greater volumes of crude C4 are produced. However, when light feedstocks are inexpensive relative to heavy feedstocks, the producers may choose to process those light feedstocks instead, a process referred to as “light cracking,” which results in lower volumes of crude C4 production. Throughout fiscal 2009 and 2010, NGL prices have remained attractive relative to naphtha. Consequently, light cracking has been prevalent and crude C4 supply has been reduced over the same period, which negatively impacted our butadiene production and sales volumes. Crude C4 availability has also been affected by lower operating rates of ethylene crackers.
In April 2009, in order to preserve liquidity in response to the ongoing global economic crisis and to align our expenditures with our decreased sales volumes, we undertook initiatives to reduce our capital spending, general and administrative expenses and operating expenses. These initiatives included a reduction of our active C4 processing and butadiene production capacity. We shut down one of the two trains processing crude C4 at our Port Neches facility and temporarily idled some capacity at our Houston facility, also reducing associated headcount. From time to time during fiscal 2010, we temporarily reactivated the idled production capacity at our Houston facility in response to increased crude C4 supply as well as decreased production rates of the non-idled unit. The idled train at Port Neches did not operate at any time during fiscal 2010, and we do not expect to again operate both trains at Port Neches until crude C4 supply conditions improve. If we are able to secure significant incremental feedstock commitments, we will consider operating both trains at Port Neches, but doing so will require a significant amount of time and capital to hire personnel and bring the idle train to operational readiness. Please see Item 2 – “Properties” below for more information about the total and active production capacities at our facilities.
In sharp contrast to fiscal 2009, fiscal 2010 was characterized by continuously improving market conditions as well as increasing petroleum prices and related commodity market indices. Since a substantial portion of our raw material costs and product selling prices are linked to these commodity indices (such as indices based on the price of unleaded regular gasoline, butane, isobutane or refinery grade propylene), during fiscal 2010 we experienced upward trends in both our raw material costs and our selling prices. Although both raw material costs and selling prices have increased during fiscal 2010, the revenue impact of higher selling prices exceeded the impact on cost of sales of higher raw material costs. Supply shortages for some of our products during fiscal 2010 also contributed to margin improvement.
Supplier Purchase Agreements
We purchase the majority of the feedstock for our products under long-term purchase contracts. At times, we will also purchase feedstock on a spot basis, particularly crude C4 which can be imported from Europe and the Middle East region. Spot purchases may allow us to increase production to meet demand in excess of available domestic supply; for example, in fiscal 2010, approximately 11% of our crude C4 feedstocks were purchased on a spot basis.
We purchase feedstock from a number of large chemical producers, including The Dow Chemical Company, Nova Chemicals Corporation, ExxonMobil Corporation, Chevron Phillips Chemical Company LLC, Lyondell Chemical Company, Flint Hills Resources, LP, Formosa Plastics Corporation, Trammochem, and Total Petrochemicals USA Inc. We have strong, long-tenured relationships with most of our suppliers. In fiscal 2010 and 2009, our top five suppliers accounted for an aggregate of 35.7% and 34.6% of our total vendor purchases, respectively.
5
Table of Contents
Index to Financial Statements
Our supply agreements typically specify a defined percentage of the supplier’s feedstock output or, in some cases, a defined volume of feedstock, that we will purchase. The pricing under the contracts is usually tied to a commodity market index (such as indices based on the price of unleaded regular gasoline, butane, isobutane or refinery grade propylene) or to the price at which we sell the finished product. As discussed further in “—Sales Contracts” below, the prices at which we sell our products are also typically tied to a commodity index, and in many cases the indices used match those in the corresponding supply agreement. For example, the butene-1 component of the crude C4 feedstock we purchase is priced based on a market index for unleaded regular gasoline; our butene-1 sales prices are likewise based on a market index for unleaded regular gasoline. Matching the indices used in our supply and sales contracts mitigates our exposure to volatility in commodity prices and the resulting fluctuations in our profit margins, to varying degrees. The mitigating effects of the index-based pricing are lessened if we do not purchase the feedstock and sell the finished product in the same period, or if the index used for purchasing the raw materials is tied to a different period than the index in the sales contract. Contract turnover and changes in feedstock and product mix also can impact our margins.
The raw material input for our C4 Processing extraction process is a mixture of four-carbon compounds commonly referred to as crude C4. We receive most of our crude C4 from steam crackers, which are designed to process naphtha and natural gas liquids as feedstocks for ethylene production. Crude C4 is a byproduct of the ethylene production process. Processing crude C4 into chemicals is a capital intensive process. Generally, the volume of crude C4 produced during the ethylene production process is small compared to the ethylene output. Therefore, many ethylene producers prefer to sell their crude C4 streams rather than process those streams themselves. Companies such as ours that aggregate and process large quantities of crude C4 and sell the finished products to consumers provide the ethylene industry with what can be a more economical alternative than providing such functions on an integrated basis.
As discussed in “—Market Conditions and Recent Initiatives” above, the volume of crude C4 produced by the ethylene producers is driven by both the volume of ethylene produced and the composition of the steam cracker feedstock. When light feedstocks, such as natural gas liquids, are inexpensive relative to heavier feedstocks such as naphtha, ethylene crackers conduct primarily light cracking, resulting in lower volumes of crude C4 available in the market. This situation existed throughout fiscal 2009 and 2010 and occasionally results in our inability to meet 100% of our contractual butadiene and butene-1 sales commitments. When this occurs, we typically invoke force majeure clauses that exist in almost all of our butadiene and butene-1 sales contracts, allowing us to reduce, or “allocate,” the amount of product we deliver. From time to time since the latter part of fiscal 2009 through fiscal 2010, we were forced to operate, and may again be forced to operate in the future, on a product allocation basis as a result of limited crude C4 feedstock supply.
Sales Contracts
We enter into two general types of sales arrangements: sales contracts and, occasionally, toll manufacturing agreements. Toll manufacturing means that we process the raw material supplied to us but owned by the toll customer and return the finished product to the toll customer for a fee. A majority of our sales contracts have initial terms of two to three years and are, in practice, generally ongoing contracts that can be terminated with one-year notice from either party. Our sales contracts typically require customers to purchase minimum volumes expressed either in absolute terms or as a percentage of their product needs. We also sell certain products on a spot basis.
We sell to a large number of chemical producers and refiners, including The Goodyear Tire and Rubber Company, The Dow Chemical Company, PMI Trading LTD, Afton Chemical Corporation, Lanxess Corporation, Invista S.àr.l., Bridgestone/Firestone Inc., Valero Energy Corporation, Motiva Enterprises LLC and SI Group Inc. We have strong, long-tenured relationships with most of our customers. In fiscal 2010 and 2009, our top five customers accounted for an aggregate of 44.6% and 45.6%, respectively, of our total sales. In fiscal 2010, Goodyear Tire and Rubber Company accounted for 10% of our total revenues.
The pricing in our sales contracts fluctuates over time and typically is tied to a commodity index, often the same index used in the corresponding supply agreement. Pricing in some contracts includes an energy adjustment and/or separate distribution, storage, and aggregation components.
Competition
The petrochemicals businesses in which we operate are highly competitive. Many of our competitors are larger and have greater financial resources than we do. Among our competitors are some of the world’s largest chemical companies and major integrated petroleum companies, all of whom generally have their own raw materials resources. In addition, a significant portion of our business is based on widely available technology (with the exception of our HR-PIB process, for which we hold
6
Table of Contents
Index to Financial Statements
exclusive patents). Accordingly, barriers to entry, apart from capital availability, may be low in the commodity product section of our business, and the entrance of new competitors may reduce our ability to capture profit margins when there is overcapacity in the industry. Also, some petroleum-rich countries have recently become more significant participants in the commodity petrochemicals industry and may continue to expand their role in the industry in the future. Any of these developments may have a negative impact on our financial condition, results of operations and cash flows. Price, customer service, ability to procure feedstocks, technology, reliability, product quality, product deliverability and product performance are the primary factors that drive competition.
Our primary competitors in North America are as follows:
| • | In the C4 market, including butene-1 and butadiene, we compete with LyondellBasell Industries, Shell Chemicals, LP and ExxonMobil Corporation. |
| • | For isobutylene, including HPIB, we compete with LyondellBasell Industries. |
| • | Our HR-PIB competes with conventional PIB produced by Ineos Group Holdings plc. |
| • | For nonene and tetramer, we compete with ExxonMobil Corporation, Shell Chemicals, LP and Sunoco, Inc. |
Seasonality
The pricing under our supply contracts and sales contracts is usually tied to a commodity price index, such as indices based on the price of unleaded regular gasoline, butane, isobutane or refinery grade propylene, or to the price at which we sell the finished product. The price for unleaded regular gasoline, typically used in pricing for butene-1, MTBE and raffinates, varies seasonally as a result of increased demand during the spring and summer months of the year and decreased demand during the fall and winter months of the year. In addition, we typically have greater demand for our raffinates and MTBE products during the spring and summer months. As a result, we generally have increased volumes and margins for these products during the spring and summer and decreased volumes and margins during the fall and winter.
MTBE
Through our Houston processing facility, we have historically been one of the leading merchant producers by production capacity of MTBE in North America. Before the acquisition of our Port Neches, Texas facility from Huntsman Petrochemical Corporation and Huntsman Fuels, LP (collectively, “Huntsman”) in July 2006, the Port Neches facility had also been a significant merchant producer of MTBE. MTBE is a gasoline blending stock which reduces carbon monoxide and volatile organic compound emissions and enhances the octane content of unleaded gasoline. MTBE came into high demand in the 1990s to meet the oxygenate mandate imposed on domestic unleaded gasoline requirements under the Clean Air Act of 1990. In August 2005, MTBE was removed from the oxygenate mandate for unleaded gasoline as a part of the Energy Policy Act of 2005. As a result, most U.S. domestic refiners have discontinued their use of MTBE in unleaded gasoline in the United States.
We no longer sell MTBE in the United States market, focusing instead on opportunistic sales to export markets. We no longer produce MTBE at our Port Neches facility, and at our Houston facility we produce MTBE only as a by-product of our C4 processing operations, rather than from dedicated dehydrogenation units.
From time to time, legal actions have been initiated against us by local government authorities for alleged property damage and/or costs of remediation and replacement of water supplies due to the presence of MTBE, generally as a result of unleaded gasoline leakage from underground storage tanks. For a description of the legal actions against or affecting us arising from MTBE, please see Item 3 – “Legal Proceedings”.
Environmental and Safety Matters
We are subject to extensive federal, state, local and foreign environmental laws, regulations, rules and ordinances. These include, for example:
| • | the federal Resource Conservation and Recovery Act (“RCRA”) and comparable state laws that impose requirements for the generation, handling, transportation, treatment, storage, disposal and cleanup of waste from our facilities; |
| • | the federal Comprehensive Environmental Response, Compensation, and Liability Act (“CERCLA”) also known as “Superfund,” and comparable state laws that regulate the cleanup of hazardous substances that may have been released at properties currently or previously owned or operated by us or locations to which we have sent waste for disposal; |
| • | the federal Clean Water Act (“CWA”) and analogous state laws and regulations that impose detailed permit requirements and strict controls on discharges of waste water from our facilities; |
7
Table of Contents
Index to Financial Statements
| • | the federal Clean Air Act (“CAA”) and comparable state laws and regulations that impose obligations related to air emissions; and |
| • | federal and state laws and regulations currently under development to address greenhouse gas (“GHG”) emissions. |
In the ordinary course of business, we undertake frequent environmental inspections and monitoring and are subject to occasional investigations by governmental enforcement authorities. In addition, our production facilities require a number of environmental permits and authorizations that are subject to renewal, modification and, in certain circumstances, revocation. Actual or alleged violations of environmental laws or permit requirements or the discovery of releases of hazardous substances at or from our facilities could result in restrictions or prohibitions on plant operations, significant remedial expenditures, substantial civil or criminal sanctions, as well as, under some environmental laws, the assessment of strict and/or joint and several liabilities. Moreover, changes in environmental regulations could inhibit or interrupt our operations, or require us to modify our facilities or operations. Accordingly, environmental or regulatory matters may cause us to incur significant unanticipated losses, costs or liabilities.
We are committed to establishing and maintaining compliance with applicable environmental, health, safety (including process safety) and security (“EHS&S”) legal requirements, and we have developed policies and management systems intended to identify the various EHS&S legal requirements applicable to our operations and facilities, enhance and assure compliance with applicable requirements, ensure the safety of our employees, contractors, community neighbors and customers, and minimize the generation of wastes, the emission of air contaminants and the discharge of pollutants. These EHS&S management systems also serve to foster efficiency and improvement and to reduce operating risks.
The following is a summary of some of the existing laws, rules and regulations to which our business operations are subject.
Waste Management. The federal RCRA and comparable state statutes, laws and regulations regulate the generation, handling, transportation, treatment, storage, disposal and cleanup of hazardous and non-hazardous solid wastes. In the course of our operations, we generate industrial wastes that are regulated as hazardous wastes.
Comprehensive Environmental Response, Compensation, and Liability Act. The federal CERCLA and comparable state statutes, laws and regulations impose joint and several liability, without regard to fault or legality of conduct, on classes of persons who are considered to be responsible for the release of a hazardous substance into the environment. These persons include the current and past owner or operator of the site where the release occurred, and anyone who disposed or arranged for the disposal of a hazardous substance released at the site. Under CERCLA and comparable statutes, such persons may be subject to joint and several liability for the costs of cleaning up the hazardous substances that have been released into the environment, for damages to natural resources, and for the costs of certain environmental studies. In addition, it is not uncommon for neighboring landowners and other third parties to file claims for personal injury and property damage allegedly caused by the hazardous substances released into the environment.
Although we believe that we have utilized operating and waste disposal practices that were standard in the industry at the time, hazardous substances, wastes or hydrocarbons may have been released on or under the properties owned or operated by us, or on or under other locations, including off-site locations, where such substances have been taken for disposal. These properties and the substances disposed or released on them may be subject to CERCLA, RCRA, and analogous state laws. Under such laws, we could be required to remove previously disposed substances and wastes, or remediate contaminated property to prevent future contamination.
To the extent that liabilities arise from operations or events relating to our Port Neches facility that occurred prior to our ownership of the facility, we will generally be entitled to be indemnified by Huntsman for eight years after the June 2006 closing, subject to the terms and limitations of the indemnity provisions contained in the Purchase and Sale Agreement with Huntsman. We can provide no assurance, however, that all of such matters will be covered by the indemnity, that the indemnifying party will honor its obligations, or that the existing indemnities will be sufficient to cover the liabilities for such matters.
Water Discharges. The federal CWA and comparable state statutes, laws, and regulations impose restrictions and strict controls with respect to the discharge of pollutants in waste water and storm water, including spills and leaks of oil and other substances, into regulated waters. The discharge of pollutants into regulated waters is prohibited, except in accordance with the terms of a permit issued by the United States Environmental Protection Agency (“EPA”) or an analogous state agency. Spill prevention, control and countermeasure requirements may require appropriate containment berms and similar structures to help prevent the contamination of regulated waters in the event of a petroleum hydrocarbon tank spill, rupture or leak. Regulatory agencies can also impose administrative, civil and criminal penalties for non-compliance with discharge permits or other requirements of the Clean Water Act and analogous state laws and regulations.
8
Table of Contents
Index to Financial Statements
Air Emissions. The federal CAA and comparable state statutes, laws and regulations regulate emissions of various air pollutants or contaminants through air emissions permitting programs and the imposition of other requirements. Such laws and regulations may require a facility to obtain pre-approval for the construction or modification of projects or facilities expected to emit air contaminants or result in the increase of existing emissions of air contaminants, and to obtain and strictly comply with air permits containing various emissions limitations and operational requirements, including the utilization of specific emission control technologies to limit emissions of particular pollutants. In addition, the EPA and state regulatory agencies have developed, and continue to develop, stringent regulations governing emissions of air contaminants at specified sources. Regulatory agencies can also impose administrative, civil and criminal penalties for non-compliance with air permits or other legal requirements regarding air emissions. Depending on the state-specific statutory authority, individual states may be able to impose air emissions limitations that are more stringent than the federal standards imposed by the EPA.
Permits and related compliance obligations under the CAA, as well as changes to state implementation plans for controlling air emissions in regional non-attainment areas, including the Houston-Galveston-Brazoria ozone non-attainment area, may require our operations to incur future capital expenditures in connection with the addition or modification of existing air emission control equipment and strategies. For example, as part of our efforts to comply with rules changes related to the emissions of nitrogen oxides (“NOx”) from our facilities, we installed two new, low-NOx boilers at each of our Houston and Port Neches facilities in fiscal 2006 through 2008, for a total capital investment of approximately $40 million. Failure to comply with these emission control requirements could subject us to monetary penalties, injunctions, conditions or restrictions on operations and enforcement actions. Our facilities may also be required to incur certain capital expenditures in the future for air pollution control equipment in connection with obtaining and maintaining operating permits and approvals for air emissions.
Legislative and regulatory measures to address concerns that emissions of certain gases, commonly referred to as GHGs, including carbon dioxide, may be contributing to warming of the Earth’s atmosphere are in various phases of discussions or implementation at the international, national, regional and state levels. The petrochemical industry is a direct source of certain GHG emissions, namely carbon dioxide, and future restrictions on such emissions could impact our future operations. In the United States, federal legislation imposing restrictions on GHG is under consideration. In addition, EPA has promulgated a series of rulemakings and other actions that EPA states will result in the regulation of GHGs as pollutants under the CAA. In April 2010, EPA promulgated final motor vehicle GHG emission standards, which take effect in model year 2012. According to EPA, the motor vehicle GHG emission standards will trigger construction and operating permitting requirements for stationary sources of GHG emissions beginning January 2, 2011. In May 2010, EPA finalized the Prevention of Significant Deterioration and Title V GHG Tailoring Rule, which phases in permitting requirements for stationary sources of GHG emissions, beginning January 2, 2011 through July 30, 2013. These EPA rulemakings could affect our operations and ability to obtain air permits for new or modified facilities. Furthermore, in 2010, EPA regulations became effective that require monitoring and reporting of GHG emissions on an annual basis, including extensive GHG monitoring and reporting requirements. Although this new rule does not control GHG emission levels from any facilities, it will cause us to incur monitoring and reporting costs. Moreover, lawsuits have been filed seeking to require individual companies to reduce GHG emissions from their operations. These and other lawsuits relating to GHG emissions may result in decisions by state and federal courts and agencies that could impact our operations and ability to obtain certifications and permits to construct future projects.
Passage of climate change legislation or other federal or state legislative or regulatory initiatives that regulate or restrict GHG emissions in areas in which we conduct business could adversely affect the demand for our products, and depending on the particular program adopted, could increase the costs of our operations, including costs to operate and maintain our facilities, to install new emission controls on our facilities, to acquire allowances to authorize our GHG emissions, to pay any taxes related to our GHG emissions and/or to administer and manage a GHG emissions program. At this time, it is not possible to accurately estimate how laws or regulations addressing GHG emissions would impact our business, but we do not believe that the impact on us will be any more burdensome to us than to any other similarly situated companies.
In addition to potential impacts on our business resulting from climate-change legislation or regulations, our business also could be negatively affected by climate-change related physical changes or changes in weather patterns. A loss of coastline in the vicinity of our facilities, which are located near the Gulf of Mexico, or an increase in severe weather patterns, could result in damages to or loss of our physical assets and/or a disruption of our supply and distribution channels. Changes of this nature could have a material adverse impact on our business. In addition to potential direct impacts on us, climate change legislation or regulation and climate change related physical changes could affect entities that provide goods and services to us and indirectly have an adverse effect on our business as result of increases in the costs or availability of such goods or services. At this time, it is not possible to accurately project the effects of any such indirect impacts.
9
Table of Contents
Index to Financial Statements
In addition to the requirements imposed upon us by law, we also enter into other agreements from time to time with state and local environmental agencies either to avoid the risks of potential regulatory action against us or to implement improvements that exceed current legal requirements. To that end, we have entered into the following agreements that will require us to reduce our emissions of butadiene and other volatile organic compounds at our Houston facility as described below:
| • | In June 2005, we executed a Voluntary Emissions Reduction Agreement (“VERA”) with the Texas Commission on Environmental Quality (“TCEQ”), in which we agreed to reduce emissions of butadiene from three main sources at our Houston facility by fifty percent by the end of December 2008. We were in substantial compliance with the reduced emissions threshold by the agreed deadline, and are in on-going discussions on continued emission reductions. In addition to the emissions reductions, we committed to a series of operational initiatives, including the installation of a state-of-the-art fence line monitoring system to detect emissions at our Houston facility. Similarly, in December 2005, we entered into a Settlement Agreement with the City of Houston (“COH”), in which we agreed to many of the same emissions reductions and operational commitments contained in the VERA in exchange for a global release by COH of potential claims that could be asserted against us related to past emissions events. |
| • | In January 2009, we signed an Agreed Corrective Action Order (“ACAO”) with TCEQ related to our Houston facility. The ACAO was approved by the TCEQ Commissioners in April 2009 following a public agenda hearing. The ACAO obligates us to undertake a five-year, $20 million incremental spending program on projects designed to enhance environmental performance that would not normally have been done as part of routine maintenance at our Houston facility. We expect to implement the required measures and incur the incremental spending through a combination of (a) increases in our annual maintenance and capital expenditures throughout the five-year period and (b) additional expenditures in connection with our regularly scheduled turnarounds (typically occurring every three to four years). We expect to fund the incremental expenditures from our operations and/or from borrowings under our Revolving Credit Facility and do not expect the expenditures to have a material impact on our operations or liquidity. In the ACAO, we also commit to reduce emissions of volatile organic compounds from discrete emissions events at our Houston facility on a rolling twelve-month basis by more than thirty-five percent of annual pre-ACAO levels. We are currently in compliance with all requirements in the ACAO. |
Chemical Product Safety Regulation. The products we make are subject to laws and regulations governing chemical product safety, including the federal Toxic Substances Control Act (“TSCA”) and chemical product safety laws in jurisdictions outside the United States where our products are distributed. The goal of TSCA is to prevent unreasonable risks of injury to health or the environment associated with the manufacture, processing, distribution in commerce, use or disposal of chemical substances. Under TSCA, the EPA has established reporting, record-keeping, testing and control-related requirements for new and existing chemicals with which we must comply. In December 2006, the European Union adopted a new regulatory framework concerning the Registration, Evaluation and Authorization of Chemicals (known as REACH), which became effective on June 1, 2007. One of its main objectives is the protection of human health and the environment. REACH requires manufacturers and importers to gather information on the properties of their substances that meet certain volume or toxicological criteria and register the information in a central database to be maintained by a Chemical Agency in Finland. REACH also contains a mechanism for the progressive substitution of the most dangerous chemicals when suitable alternatives have been identified. We met the deadline of December 1, 2008 for the pre-registration of those chemicals manufactured in, or imported into, the European Economic Area in quantities of one metric ton or more that were not otherwise exempted. Complete registrations containing extensive data on the characteristics of the chemicals will be required in three phases, depending on production usage or tonnage imported per year, and the toxicological criteria of the chemicals. The first registrations are required in 2010; subsequent registrations are due in 2013 and 2018. The toxicological criteria considered for registration determinations are carcinogenicity, mutagenicity, reproductive toxicity (category 1 and 2), and aquatic toxicity. By June 1, 2013, the European Commission will review whether substances with endocrine disruptive properties should be authorized if safer alternatives exist. By June 1, 2019, the European Commission will determine whether to extend the duty to warn from substances of very high concern to those that could be dangerous or unpleasant. We do not expect that the costs to comply with current chemical product safety requirements or REACH will be material to our operations or financial position. It is possible that other regions in which we operate could follow the European Union approach and adopt more stringent chemical product safety requirements.
Health and Safety Regulation. We are subject to the requirements of the federal Occupational Safety and Health Act and comparable state statutes, laws and regulations. These laws and the implementing regulations strictly govern the protection of the health and safety of employees. The Occupational Safety and Health Administration’s (“OSHA”) hazard communication standard, the EPA’s community right-to-know regulations under the Title III of CERCLA and similar state laws require that we organize and/or disclose information about hazardous materials used or produced in our operations.
10
Table of Contents
Index to Financial Statements
Our operations are also subject to standards designed to ensure the safety of our processes, including OSHA’s Process Safety Management standard. The Process Safety Management standard imposes requirements on regulated entities relating to the management of hazards associated with highly hazardous chemicals. Such requirements include conducting process hazard analyses for processes involving highly hazardous chemicals, developing detailed written operating procedures, including procedures for managing change, and evaluating the mechanical integrity of critical equipment. As a result of a process safety audit of our Houston plant conducted by OSHA’s local office under its process safety Regional Emphasis Program, we entered into a compliance agreement on October 6, 2007 with OSHA, which agreement requires us to implement certain corrective actions on a three-year timetable through June 2010. We met all of the abatement and corrective action requirements in compliance with the deadlines in the compliance agreement
Security Regulation. We are subject to the requirements of the United States Department of Homeland Security’s Chemical Facility Anti-Terrorism Standard at our Baytown facility and the Marine Transportation Security Act at our Houston, Port Neches, and Lake Charles facilities. These requirements establish minimum standards for security at chemical facilities and marine-based chemical facilities, respectively. We are currently in the process of scope definition and engineering design of facility modifications for compliance with these requirements. Under the Marine Transportation Security Act, we have been awarded partial grants to assist with compliance at the Port Neches and Houston facilities.
Employees
As of September 10, 2010, we had 477 full-time employees. In addition, we contract with a third party to provide approximately 280 contract employees to perform maintenance activities and operate supply chain facilities on and around our Houston and Port Neches facilities. Approximately 102 of the employees at our Port Neches facility are members of six labor unions: United Steelworkers Local 228, IBEW Local 2286, Boilermakers Local 587, Carpenters Local 502, Technical Control Union and Pipefitters Local 195. Our current agreements with employees represented by the unions run through February 2012. The labor agreements all include benefits for the employees and provisions for us such as a “no-strike” clause.
Research and Development Activities
We conduct our principal research and development activities at our plant facilities. Our research and development spending is primarily dedicated to developing innovative processes, especially for the higher margin, differentiated products within our Performance Products segment. Expenditures for our research and development activities were $1.4 million, $1.2 million and $1.7 million in fiscal, 2010, 2009 and 2008, respectively.
Patents and Licenses
We presently own, control or hold rights to 20 U.S. patents and 22 foreign patents, and we seek patent protection for our proprietary processes where feasible to do so. We have several patented processes and applications, such as our patents related to HR-PIB and the catalyst mechanism for the polymerization of PIB and DIB, that give certain products differentiated features. Our patents related to the HR-PIB process generally expire after 2020. We have acquired technology licenses used in connection with the manufacturing of several of our products. Generally, these licenses are fully paid and perpetual with respect to our existing production activities. With technology being a key competitive factor in the markets served by our Performance Products segment and a significant driver to producing the best quality products, these patented processes and licenses enhance our product offerings to our customers.
Available Information
Our website is www.tpcgrp.com. Information contained on or accessible from our website is not incorporated by reference into this Annual Report on Form 10-K and should not be considered a part of this report or any other filing that we make with the SEC. We make available on this website free of charge, our Annual Reports on Form 10-K, quarterly reports on Form 10-Q, current reports on Form 8-K and amendments to those reports as soon as reasonably practicable after we electronically file those materials with, or furnish those materials to, the SEC. You may also find information related to our corporate governance, board committees and company code of business conduct and ethics on our website. The SEC also maintains a website, www.sec.gov, that contains reports, proxy statements and other information regarding SEC registrants, including us.
We intend to satisfy the requirement under Item 5.05 of Form 8-K to disclose any amendments to our Code of Business Conduct and Ethics and any waiver of any provision of our Code of Business Conduct and Ethics by posting such information in the Corporate Governance section of our website at www.tpcgrp.com.
11
Table of Contents
Index to Financial Statements
| ITEM 1A. | RISK FACTORS |
Cyclicality in the petrochemicals industry may result in reduced volumes or operating margins.
The petrochemicals industry is cyclical and has historically experienced periodic downturns. Profitability is highly sensitive to supply and demand cycles and product prices. The cycles are generally characterized by periods of strong demand, leading to high operating rates and margins, followed by periods of oversupply relative to demand, primarily resulting from significant capacity additions or decreases in demand, leading to reduced operating rates and lower margins. Any significant downturn in the end markets for our products or in general economic conditions could result in a material reduction in demand and margins for our products and could harm our business. We are unable to predict with certainty supply and demand balances, market conditions and other factors that will affect industry operating margins in the future. In addition, because we compete in limited segments of the petrochemicals industry and have less diversified operations than most of our competitors, a downturn in one or more of those specific segments may affect us more severely than our competitors who compete more broadly in the industry as a whole.
We may reduce production at or idle a facility for an extended period of time or discontinue a product line because of an oversupply of a particular product and/or a lack of demand for that particular product, or high feedstock prices that make production uneconomical. In fiscal year 2009, we idled or shut down certain processing capability at our Houston and Port Neches facilities for reasons described above. Temporary idling or shutdowns sometimes last for several quarters or, in certain cases, longer, and cause us to incur costs, including the expenses of maintaining and restarting these facilities. Factors such as increases in feedstock costs or lower demand in the future may cause us to further reduce capacity, idle facilities or discontinue product lines.
Our efforts to obtain suitable quantities or qualities of raw material feedstock may not be successful, in which case our financial condition, results of operations and cash flows may be adversely affected.
We are subject to risks associated with fluctuations in feedstock supply in both our C4 Processing and our Performance Products businesses. Most of our contracts with our crude C4 suppliers obligate us to purchase a percentage of the output from a given facility, as opposed to a fixed volume. The contracts contain volume estimates, but the actual amount purchased varies on what is actually produced by the supplier. Even for supply contracts that specify a fixed volume of feedstocks, as is the case for some agreements in our Performance Products segment, the suppliers are not always able to meet the fixed volume.
The amounts our suppliers can produce are not tied to the amounts our customers need. If customer demand drops without a corresponding drop in supplier production, inventories may dramatically increase and result in significantly increased exposure to commodity price volatility. Similarly, if supplier production decreases without a corresponding drop in customer demand, inventories may dramatically decrease, forcing us to allocate our production and putting us at risk of default in our customer contracts. Moreover, to the extent that we are unable to obtain additional feedstock from current suppliers or other sources, our ability to grow our business could be constrained.
Even if we can obtain raw material feedstock at cost effective prices, the quantity and type of such feedstock may not be sufficient to meet our production needs. Composition of the raw material feedstock varies greatly by source. In particular, crude C4 can be created by a variety of means, each resulting in a different mixture of the sub-component compounds vital to our production methods. A disproportionate amount of one sub-component over another in raw material feedstock can directly affect the types and quantities of products we can produce from our operations. While we contractually obligate our suppliers to certain minimum amounts of four-carbon compounds in the raw material feedstocks, there is typically an allowed margin of error. Furthermore, some contracts do not specify a minimum amount of one sub-component over another due to the variation in crude C4 production by our suppliers. This creates uncertainty as to whether we will have enough of a particular sub-component to meet our production needs. Finally, there is no guarantee that new sources of raw material feedstocks will have the same sub-component makeup as existing sources.
The volume of crude C4 produced by the ethylene production process is driven by both the volume of ethylene produced and the composition of the steam cracker feedstock. When light feedstocks, such as natural gas liquids, are inexpensive relative to heavier feedstocks such as naphtha, ethylene crackers conduct primarily light cracking, resulting in lower volumes of crude C4 available in the market. This situation existed throughout fiscal 2009 and 2010 and occasionally results in our inability to meet 100% of our contractual butadiene and butene-1 sales commitments. When this occurs, we typically invoke force majeure clauses that exist in almost all of our butadiene and butene-1 sales contracts, allowing us to reduce, or “allocate,” the amount of product we deliver. From time to time since the latter part of fiscal 2009 through fiscal 2010, we were forced to operate, and may again be forced to operate in the future, on a product allocation basis as a result of limited crude C4 feedstock supply. Moreover, due to continued light cracking and lower operating rates of ethylene crackers, in April 2009 we undertook cost reductions initiatives that included a reduction of our active C4 processing and butadiene production capacity. We shut down one of the two trains processing crude C4 at our Port Neches facility and temporarily idled some capacity at our Houston facility, also reducing associated headcount. We have periodically reactivated the temporarily idled production capacity at our Houston facility, but we do not expect to operate the idled trains at Port Neches again until feedstock supply conditions improve.
12
Table of Contents
Index to Financial Statements
An inability to produce sufficient quantity of our products, or a decline in production of our products due to a change in sub-component composition of our crude C4 feedstocks, could result in a failure to meet our obligations to our customers, and in turn could adversely impact our financial condition, results of operations, and cash flows.
We may not have access to capital in the future due to changes in general economic conditions.
We may need new or additional financing in the future to conduct our operations, expand our business, make acquisitions or refinance existing indebtedness. As of September 10, 2010, we had excess availability under our Revolving Credit Facility of $175 million. Because our Revolving Credit Facility is asset-based, the availability under the facility will decrease if the value of our accounts receivable, inventories and other assets decrease. Any sustained weakness in general economic conditions and/or financial markets in the United States or globally could adversely affect our ability to raise capital on favorable terms or at all.
Longer term volatility and continued disruptions in the capital and credit markets as a result of uncertainty, changing or increased regulation of financial institutions, reduced alternatives or failure of significant financial institutions could adversely affect our access to the liquidity needed for our businesses in the longer term. Such disruptions could require us to take measures to conserve cash until the markets stabilize or until alternative credit arrangements or other funding for our business needs can be arranged. The recent disruptions in the capital and credit markets also have resulted in higher interest rates on debt securities and increased costs under credit facilities. Continuation of these disruptions would increase our interest expense and capital costs and could adversely affect our results of operations and financial position, including our ability to grow our business through acquisitions.
Finally, in periods of low demand or decreased feedstock supply, the negative effect on our financial condition may cause the feedstock suppliers with whom we do business to require shorter payment terms or require letters of credit to secure payment. Complying with shorter payment terms or providing letters of credit would reduce our cash and/or the availability under our Revolving Credit Facility. Either of these outcomes would impact our liquidity, and could cause us to decrease our feedstock purchases or other expenditures, or otherwise negatively affect our financial condition and results of operations.
Volatility in the petrochemicals industry may result in reduced operating margins or operating losses.
Prices for our feedstocks and our finished products are related to the prices in the energy market as a whole, and, as such, can be volatile. Volatile petrochemicals and unleaded gasoline markets could adversely affect our results of operations in several ways:
| • | We may purchase our feedstocks weeks before processing and selling the finished products. Sales price declines for our finished products during the period between purchasing feedstocks and selling the products from those feedstocks could have a significant adverse effect on our financial results to the extent that we have month-end inventory. |
| • | Some of our contracts are priced based on commodity indices not for the period in which the sale occurs but for either a prior or subsequent time period. As a result, fluctuations in the value of the commodity during the period in which the sale occurred will not be reflected in the actual price paid by the customer for such product, which could erode our profit margins or result in losses. |
| • | Many of our margins are structured as a percentage of an underlying or related commodity index. As the price of these commodities decrease, the dollar value of our margins decrease, even though our margins as a percentage of revenues may remain the same. |
Many of our supply contracts and sales contracts use matching commodity indices for determining pricing, which mitigates fluctuations in our material margin percentage (which we define as the percentage difference between total revenues and raw material costs) to varying degrees. Nevertheless, our material margin percentage, while relatively stable over time, is not perfectly constant. For example, in fiscal 2010 our overall average sales prices were 15% higher than fiscal 2009, while our overall average raw material costs were up 18%. The fact that average sales prices and raw material costs did not change in absolute lockstep indicates a slight change in our material margin percentage. Changes in the material margin percentage occur, despite the “index-based pricing” in our supply contracts and sales contracts, in part for the reasons explained above—because the effect of using matching indices is lessened if we do not purchase the feedstock and sell the finished product in the same period, or if the index used for purchasing the raw materials is tied to a different period than the index in the sales contract. Contract turnover, changes in feedstock and product mix and other factors also can impact our material margin percentage.
13
Table of Contents
Index to Financial Statements
Our industry is highly competitive and, if we are unable to compete successfully, our financial condition, results of operations and cash flows will be adversely affected.
The petrochemicals industry is, generally, highly competitive. Due to the commodity nature of many of our products, competition in our industry is based primarily on price and to a lesser extent on customer service, technology, reliability, product quality, product deliverability and product performance. As a result, we generally are not able to protect our market position for these products by product differentiation. Moreover, if our production costs are higher than our competitors, we may have difficulty recovering those higher costs from our customers due to the commodity nature of our products.
Many of our competitors are larger and have greater financial resources than we do. Among our competitors are some of the world’s largest chemical companies and major integrated petroleum companies that have their own raw materials resources. In addition, a significant portion of our business is based on widely available technology. Accordingly, barriers to entry, apart from capital availability, may be low in the commodity product section of our business, and the entrance of new competitors may reduce our ability to maintain profit margins in circumstances where capacity utilization in the industry is diminishing. Also, some petroleum-rich countries have recently become more significant participants in the petrochemicals industry and may expand their petrochemicals operations significantly in the future. Any significant increases in competition from existing or new industry participants could have a material adverse impact on our financial condition, results of operations and cash flows.
The loss of a large customer, or failure to retain contracts with an existing customer, could significantly reduce our profitability and cash flows.
A small number of our customers account for a significant percentage of our total sales. In fiscal 2010 and 2009, our top five customers accounted for an aggregate of 44.6% and 45.6%, respectively, of our total sales. We could lose a large customer for a variety of reasons, including as a result of a merger, consolidation or bankruptcy. In addition, customers are increasingly pursuing arrangements with suppliers that can meet a larger portion of their needs on a more global basis. The loss of one or more of our large customers could have a material adverse impact on our financial condition, results of operations and cash flows. The only customer which accounted for 10% or greater of our sales during fiscal 2010 was The Goodyear Tire and Rubber Company.
The loss of a large supplier, or failure to retain contracts with an existing supplier, could significantly reduce our profitability and cash flows.
A small number of suppliers for our feedstocks account for a significant percentage of our feedstock purchases. Our top five suppliers accounted for an aggregate of 35.7% and 34.6% of our total vendor purchases for fiscal 2010 and 2009, respectively. We could lose a large supplier for a variety of reasons, including as a result of a merger or consolidation. In addition, suppliers in our industry are increasingly pursuing arrangements with customers that can off take a larger portion of their production streams on a more global basis. The loss of one or more of our large suppliers could have a material adverse impact on our financial condition, results of operations and cash flows.
Our organizational documents and investment agreement give certain of our large stockholders the ability to prevent us from taking certain actions that our Board of Directors or a majority of our stockholders determine are in our best interests.
In connection with our emergence from Chapter 11 bankruptcy in 2004, we adopted organizational documents and entered into an investment agreement that granted certain consent rights to two of our large stockholders, Castlerigg Master Investments, Ltd. (“Castlerigg”) and RCG Carpathia Master Fund, Ltd. (“RCG”). As a result, for so long as these stockholders collectively hold at least 10% of our outstanding stock, we may not, among other things, increase the number of shares of stock we are authorized to issue, issue preferred stock, adopt provisions in our organizational documents that could make an acquisition of our company more onerous or costly, or change other specified provisions in our organizational documents, in each case without each of Castlerigg’s and RCG’s consent. As of September 16, 2010, Castlerigg beneficially owned approximately 14.4% of our outstanding stock and, as of April 8, 2010, an affiliate of RCG beneficially owned approximately 8.1% of our outstanding stock.
Our organizational documents and the investment agreement allow Castlerigg and RCG to exercise their consent rights in their sole discretion and in their self interest. If either of these stockholders were to elect to withhold their consent with respect to a potential transaction or other initiative, we might be prevented from effecting that transaction or initiative even if our Board of Directors or a majority of our stockholders determine that doing so would benefit us or our stockholders.
14
Table of Contents
Index to Financial Statements
For example, we will be required to obtain the consent of Castlerigg and RCG to increase our authorized common stock or to authorize the issuance of preferred stock. Currently our certificate of incorporation authorizes the issuance of up to 25 million shares of common stock, of which approximately 20.4 million have been issued or are reserved for issuance, or are subject to outstanding stock awards. Accordingly, our ability to issue equity currently is limited to approximately 4.6 million authorized shares of common stock, and no shares of preferred stock. If Castlerigg and RCG withheld their consent to increase our authorized stock, our liquidity and access to capital, and/or our ability to consummate strategic transactions, could be adversely affected.
We have significant debt, which could adversely affect our ability to operate our business.
We have a significant amount of outstanding indebtedness. As of September 10, 2010, we had total bank debt of approximately $269.5 million. We are a borrower under two loan facilities: a Term Loan with an outstanding principal balance of $269.5 million as of September 10, 2010, and an asset-based Revolving Credit Facility with no outstanding borrowings as of September 10, 2010.
The extent to which we are leveraged could:
| • | limit our ability to obtain additional financing in the future for working capital, capital expenditures and acquisitions; |
| • | limit our ability to refinance our indebtedness on terms acceptable to us or at all; |
| • | require us to dedicate a significant portion of our cash flow from operations to paying the principal of and interest on our indebtedness, thereby reducing funds available for other corporate purposes; and |
| • | make us more vulnerable to economic downturns and limit our ability to withstand competitive pressures. |
The Revolving Credit Facility and the Term Loan include covenants that restrict, subject to specified exceptions, our and our subsidiaries’ ability to create or permit liens on our assets, incur additional indebtedness or issue redeemable equity securities, guarantee indebtedness, merge or consolidate with a third party, sell or otherwise dispose of assets, pay dividends or effect stock buy-backs, issue or sell stock of any of our subsidiaries, make loans, investments and acquisitions, enter into transactions with our affiliates, change the lines of business in which we are engaged, change our fiscal year, make voluntary prepayments or redemptions of subordinated indebtedness, enter into agreements that limit our subsidiaries’ ability to pay distributions to us or enter into other transactions with us, maintain cash balances in excess of $15 million without using such excess cash to prepay loans under the Revolving Credit Facility, and enter into receivables financings or securitization programs. These restrictions may limit our ability to respond to market conditions, provide for capital investment needs or take advantage of business opportunities.
Global economic conditions may have impacts on our business and financial condition that we currently cannot predict.
Conditions in the global economy and global capital markets may adversely affect our results of operations, financial condition, and cash flows. Our business and operating results have been and will continue to be affected by the global recession, including the credit market crisis, declining consumer and business confidence, fluctuating commodity prices and other challenges currently affecting the global economy. Our customers may experience deterioration of their businesses, cash flow shortages, and difficulty obtaining financing. As a result, existing or potential customers may delay or cancel plans to purchase products and may not be able to fulfill their obligations in a timely fashion. A significant adverse change in a customer relationship or in a customer’s financial position could cause us to limit or discontinue business with that customer, require us to assume more credit risk relating to that customer’s receivables or limit our ability to collect accounts receivable from that customer, all of which could have a material adverse effect on our business, results of operations, financial condition and liquidity. Further, suppliers may be experiencing similar conditions, which could impact their ability to fulfill their obligations to us or to deliver the quantity of feedstocks we expect. If the global recession continues for significant future periods or deteriorates significantly, our results of operations, financial condition and cash flows could be materially adversely affected.
Our C4 Processing business is subject to seasonality.
The pricing under our supply contracts and sales contracts is usually tied to a commodity price index, such as indices based on the price of unleaded regular gasoline, butane, isobutane or refinery grade propylene, or to the price at which we sell the finished product. The price for unleaded regular gasoline, typically used in pricing for butene-1, MTBE and raffinates, varies seasonally as a result of increased demand during the spring and summer months of the year and decreased demand during the fall and winter months of the year. In addition, we typically have greater demand for our raffinates and MTBE products during the spring and summer months. As a result, we generally have increased volumes and margins for these products during the spring and summer and decreased volumes and margins during the fall and winter.
15
Table of Contents
Index to Financial Statements
Our operations and assets are subject to extensive environmental, health and safety laws and regulations.
We are subject to extensive federal, state and local laws, regulations, rules and ordinances relating to pollution and protection of the environment, including those relating to the generation, handling, transportation, treatment, storage, disposal and cleanup of hazardous substances and wastes, the discharges of waste water, and the emission of air pollutants or contaminants. In the ordinary course of business, we undertake frequent environmental inspections and monitoring and are subject to occasional investigations by governmental enforcement authorities. Our production facilities require a number of environmental permits and authorizations that are subject to renewal, modification and, in certain circumstances, revocation. Actual or alleged violations of environmental laws or permit requirements or the discovery of releases of hazardous substances at or from our facilities could result in restrictions or prohibitions on plant operations and product distribution/sales, significant remedial expenditures, substantial civil or criminal sanctions, as well as, under some environmental laws, the assessment of strict liability and/or joint and several liability.
In addition, we cannot accurately predict future developments, such as increasingly strict environmental laws or regulations, and inspection and enforcement policies, as well as resulting higher compliance costs, which might affect the handling, manufacture, or use of our products or the handling, use, emission, disposal and/or cleanup of other materials or hazardous and non-hazardous waste, and we cannot predict with certainty the extent of our future liabilities and costs under environmental, health and safety laws and regulations. Those liabilities and costs may be material.
The operation of any chemical manufacturing plant entails risk of adverse environmental events, including exposure to chemical products and byproducts from operations, and we can provide no assurance that material costs or liabilities will not be incurred to rectify any such damage. Our operations are inherently subject to accidental spills, discharges or other releases of hazardous substances that may make us liable to governmental entities or private parties. This may involve contamination associated with our current and former facilities, facilities to which we sent wastes or by-products for treatment or disposal and other contamination. Accidental discharges may occur in the future, future action may be taken in connection with past discharges, governmental agencies may assess damages or penalties against us in connection with any past or future contamination, or third parties may assert claims against us for damages allegedly arising out of any past or future contamination. In addition, we may be liable for existing contamination related to certain of our facilities for which, in some cases, we believe third parties are liable in the event such third parties fail to perform their obligations.
For more detailed information relating to the environment and safety regulations to which our operations are subject, please read “Environmental and Safety Matters” under Item 1.
Regulation of GHG emissions may have impacts on our business and financial condition that we currently cannot predict.
Passage of climate change legislation or other federal or state legislative or regulatory initiatives that regulate or restrict GHG emissions in areas in which we conduct business could adversely affect the demand for our products, and depending on the particular program adopted, could increase the costs of our operations, including costs to operate and maintain our facilities, install new emission controls on our facilities, acquire allowances to authorize our GHG emissions, pay any taxes related to our GHG emissions and/or administer and manage a GHG emissions program. These costs may be material and could have a material adverse effect on our business and results of operations.
We are subject to claims associated with our production of MTBE.
Through our Houston, Texas processing facility, we have been one of the leading producers by production capacity of MTBE in North America. Our Port Neches, Texas facility was, prior to its acquisition by us, also a significant producer of MTBE. MTBE is a gasoline blending stock which reduces carbon monoxide and volatile organic compound emissions and enhances the octane content of unleaded gasoline. MTBE came into high demand in the 1990s to meet the oxygenate mandate imposed on domestic unleaded gasoline requirements under the Clean Air Act of 1990. As a result of the enactment of the energy bill in August 2005, the oxygenate mandate has been eliminated from the regulatory framework for unleaded gasoline. As a result, most U.S. domestic refiners have discontinued their use of MTBE in unleaded gasoline in the United States. We no longer sell MTBE in the United States market, focusing instead on opportunistic sales in export markets. We no longer produce MTBE at our Port Neches facility, and at our Houston facility we produce MTBE only as a by-product of our C4 processing operations, rather than from dedicated dehydrogenation units.
From time to time, legal actions may be initiated against us for alleged property damage and/or costs of remediation and replacement of water supplies due to the potential presence of MTBE, generally as a result of unleaded gasoline leakage from underground storage tanks. Please see Item 3 - “Legal Proceedings” for a description of legal proceedings against or affecting
16
Table of Contents
Index to Financial Statements
us arising from MTBE. There can be no assurance, as to when these lawsuits and related issues may arise or be resolved or the degree of any adverse affect these matters may have on our financial condition and results of operations. A substantial settlement payment or judgment could result in a significant decrease in our working capital and liquidity and recognition of a loss in our consolidated statement of operations.
New regulations concerning the production, transportation, use and disposal of hazardous chemicals and the security of chemical manufacturing facilities could result in higher operating costs.
Some of the raw materials we use and products we generate can be considered hazardous materials or substances. For example, butadiene has been identified as a carcinogen in laboratory animals at high doses and is being studied for its potential adverse health effects on humans. Effective February 1997, the Occupational Safety and Health Administration substantially lowered the permissible employee exposure limit for butadiene. Future studies on the health effects of butadiene may result in additional regulations that further restrict the use of, and exposure to, butadiene. Additional regulation of butadiene or other products or materials used in or generated by our operations could require us to change our operations, and these changes could have a material adverse effect on our financial condition, results of operations and cash flows.
In addition, targets such as chemical manufacturing facilities may be at greater risk of terrorist attacks than other targets in the United States. The chemical industry responded to the issues surrounding the terrorist attacks of September 11, 2001 through initiatives relating to the security of chemicals industry facilities and the transportation of hazardous chemicals in the United States. In addition, local, state and federal governmental authorities have instituted various regulatory processes that could lead to new regulations impacting the security of chemical plant locations and the transportation of hazardous chemicals. Any substantial increase in costs attributable to complying with such new regulations could have a material adverse effect on our financial condition, results of operations and cash flows.
Our operations depend on a limited number of key facilities, and the loss or shutdown of operations at one or more of these facilities would have a material adverse impact on our financial condition, results of operations and cash flows.
We have three significant processing facilities, which are located in Houston, Texas, Port Neches, Texas and Baytown, Texas. The loss or shutdown of operations over an extended period of time at one or more of these facilities would have a material adverse effect on our financial condition, results of operations and cash flows. Our operations, and those of our customers and suppliers, are subject to the usual hazards associated with chemical manufacturing and the related storage and transportation of feedstocks, products and wastes, including explosions, fires, inclement weather, natural disasters (including hurricanes and flooding), mechanical failure, pipeline leaks and ruptures, unscheduled downtime, transportation interruptions, chemical spills, discharges or releases of toxic or hazardous substances or gases and other environmental risks. These hazards can cause personal injury and loss of life, severe damage to or destruction of property and equipment and environmental damage, and may result in suspension of operations and the imposition of civil or criminal penalties. We maintain property, business interruption and casualty insurance at levels which we believe are in accordance with customary industry practice, but there can be no assurance that we will not incur losses beyond the limits or outside the coverage of our insurance policies.
Further, as a part of normal recurring operations, certain of our processing units may be completely shut down from time to time, for a period typically lasting two to four weeks, to replace catalysts and perform major maintenance work required to sustain long-term production. These shutdowns are commonly referred to as “turnarounds.” While actual timing is subject to a number of variables, turnarounds typically occur every three to four years.
We may be liable for damages based on product liability claims brought against our customers.
Many of our products provide critical performance attributes to our customers’ products that are in turn sold to consumers. These consumers could potentially bring product liability suits in which we could be named as a defendant or which could cause our customers to seek contribution from us. A successful product liability claim or series of claims against us in excess of our applicable insurance coverage could have a material adverse effect on our financial condition, results of operations and cash flows.
Portions of our businesses depend on our intellectual property. If we are not able to protect our intellectual property rights, these businesses could be materially adversely affected.
We presently own, control or hold rights to 20 U.S. patents and 22 foreign patents, and we seek patent protection for our proprietary processes where feasible to do so. We have several patented processes and applications, such as our patents related to HR-PIB and the catalyst mechanism for the polymerization of PIB and DIB, that give certain products differentiated features. With technology being a key competitive factor in the markets served by our Performance Products segment and a significant driver to producing the best quality products, these patented processes and licenses enhance our product offerings to our customers.
17
Table of Contents
Index to Financial Statements
We may be unable to prevent third parties from using our intellectual property without authorization. Proceedings to protect these rights could be costly and we may not prevail. While a presumption of validity exits with respect to patents issued to us, our patents may be challenged, invalidated, circumvented or rendered unenforceable. Furthermore, as patents expire, the products and processes described and claimed under those patents become generally available for use by competitors. In addition, patent rights may not prevent our competitors from developing, using or selling products that are similar or functionally equivalent to our products and processes. Any of these occurrences could materially impact our business, particularly with respect to our HR-PIB product and our Performance Products segment generally.
Failure to adequately protect critical data and technology systems could materially affect our operations.
Information technology system failures, network disruptions and breaches of data security could disrupt our operations by causing delays or cancellation of customer orders, impeding the manufacture or shipment of products, processing transactions and reporting financial results, resulting in the unintentional disclosure of customer or our information, or damage to our reputation. While management has taken steps to address these concerns by implementing network security and internal control measures, there can be no assurance that a system failure or data security breach will not have a material adverse effect on our financial condition and operating results.
Our acquisition strategy may be unsuccessful if we incorrectly predict operating results, are unable to identify and complete future acquisitions, fail to successfully integrate acquired assets or businesses we acquire, or are unable to obtain financing for acquisitions on acceptable terms.
We believe that attractive acquisition opportunities may arise from time to time, and any such acquisition could be significant. At any given time, discussions with one or more potential sellers may be at different stages. However, any such discussions may not result in the consummation of an acquisition transaction, and we may be unable to obtain financing for acquisitions on acceptable terms or at all. We may not be able to identify or complete any acquisitions. In addition, we cannot predict the effect, if any, that any announcement or consummation of an acquisition would have on the trading price of our common stock.
Any future acquisition could present a number of risks, including:
| • | the risk of incorrect assumptions regarding the future results of acquired operations or assets or expected cost reductions or other synergies expected to be realized as a result of acquiring operations or assets; |
| • | the risk of failing to integrate the operations or management of any acquired operations or assets successfully and timely; and |
| • | the risk of diversion of management’s attention from existing operations or other priorities. |
If we are unsuccessful in completing acquisitions of other operations or assets, our financial condition could be adversely affected and we may be unable to implement an important component of our business strategy successfully. In addition, if we are unsuccessful in integrating our acquisitions in a timely and cost-effective manner, our financial condition, results of operations and cash flows could be adversely affected.
Our business may be adversely affected by the loss of senior management personnel.
The success of our business is largely dependent on our senior management, as well as our ability to attract and retain other qualified personnel. We can provide no assurance that we will be able to attract and retain the personnel necessary for the continued development of our businesses. The loss of the services of key personnel or the failure to attract additional personnel as required could have a material adverse effect on our financial condition, results of operations and cash flows. We do not maintain “key person” life insurance on any of our key employees.
Our efforts to maintain an effective system of internal controls may not be successful, in which case we may not be able to report our financial results accurately or prevent fraud, which could have an adverse effect on our business.
We currently prepare our financial statements in accordance with the requirements of generally accepted accounting principles in the United States (“GAAP”), but our internal accounting controls may not currently meet all standards applicable to companies with publicly traded securities. Effective internal controls are necessary for us to provide reliable financial reports, to limit the risk of fraud and to operate successfully as a reporting company. Our efforts to develop and maintain effective internal controls may not be successful, and we may be unable to maintain adequate controls over our financial processes and reporting in the future, including controls that would comply with the requirements under Section 404 of the Sarbanes-Oxley Act of 2002. Any failure to develop or maintain effective internal controls, or difficulties encountered in their
18
Table of Contents
Index to Financial Statements
implementation or other effective improvement of our existing internal controls, could harm our operating results or cause us to fail to meet our reporting obligations. Ineffective internal controls also potentially subject us to regulatory scrutiny and a loss of investor confidence in our reported financial information, which could have an adverse effect on our business and our ability to access the capital markets, and could lead to a decline in the price of our securities.
If we are unable to complete capital projects at their expected costs and in a timely manner, or if the market conditions assumed in our project economics deteriorate, our business, financial condition, results of operations and cash flows could be adversely affected.
Delays or cost increases related to capital spending programs involving engineering, procurement and construction of facilities (including improvements and repairs to our existing facilities) could adversely affect our ability to achieve forecasted internal rates of return and operating results. Delays in making required changes or upgrades to our facilities could subject us to fines or penalties as well as affect our ability to supply certain products we make. Such delays or cost increases may arise as a result of unpredictable factors, many of which are beyond our control, including:
| • | denial or delay in issuing requisite regulatory approvals and/or permits; |
| • | unplanned increases in the cost of construction materials or labor; |
| • | disruptions in transportation of components or construction materials; |
| • | adverse weather conditions, natural disasters or other events (such as equipment malfunctions, explosions, fires or spills) affecting our facilities, or those of vendors and suppliers; |
| • | shortages of sufficiently skilled labor, or labor disagreements resulting in unplanned work stoppages; |
| • | market-related increases in a project’s debt or equity financing costs; and |
| • | nonperformance by, or disputes with, vendors, suppliers, contractors or subcontractors. |
Any one or more of these factors could have a significant impact on our ongoing capital projects. If we were unable to make up the delays associated with such factors or to recover the related costs, or if market conditions change, it could materially and adversely affect our business, financial condition, results of operations and cash flows.
A portion of our workforce is unionized, and we may face labor disruptions that could materially and adversely affect our operations.
Some of the employees at our Port Neches facility are covered by collective bargaining agreements that expire in February 2012. To the extent that we experience work stoppages in the future as a result of labor disagreements, a prolonged labor disturbance at one or more of our facilities could have a material adverse effect on our operations.
The market price and trading volume of our common stock may be volatile.
Our common stock is listed on The NASDAQ Capital Market under the symbol “TPCG”, but the trading market for our stock is limited. There can be no assurance that a more active trading market will develop or be sustained for our common stock, nor can we predict the prices at which our common stock will trade in the future. The market price of our common stock could fluctuate significantly due to a number of factors, many of which are beyond our control, including:
| • | fluctuations in our quarterly or annual earnings or those of other companies in our industry; |
| • | failures of our operating results to meet the expectations of our stockholders; |
| • | announcements by us or our customers, suppliers or competitors; |
| • | changes in laws or regulations which adversely affect our industry or us; |
| • | changes in accounting standards, policies, guidance, interpretations or principles; |
| • | general economic, industry and stock market conditions; |
| • | future sales of our common stock; and |
| • | the other factors described in these “Risk Factors” and other parts of this report. |
| ITEM 1B. | UNRESOLVED STAFF COMMENTS |
None.
19
Table of Contents
Index to Financial Statements
| ITEM 2. | PROPERTIES |
Our Principal Facilities
Overview. We have three principal processing facilities. Our Houston, Texas facility is used in both our C4 Processing segment and our Performance Products segment. Our Port Neches, Texas facility is used in our C4 Processing segment, and the Baytown, Texas facility is used in our Performance Products segment. We have active aggregate butadiene extraction capacity of 1.7 billion pounds per year and total aggregate butadiene extraction capacity of 2.1 billion pounds per year at our Houston and Port Neches facilities. These two facilities were built in tandem by the U.S. Government in the 1940s and have complementary processes and logistics with a similar layout and design. The two facilities are located at each end of the 90-mile Texas Butadiene Pipeline Corridor, giving us the unique position of servicing customers from either end of the pipeline. Our facilities provide convenient access to other Gulf Coast petrochemicals producers and are connected to facilities of several of our customers and raw material suppliers through an extensive pipeline network. In addition, our Houston and Port Neches facilities are serviced by rail, tank truck, barge and ocean-going vessel networks. Our Houston and Port Neches facilities have a high amount of operational flexibility in the quality grade of crude C4 feedstocks that can be processed. Our Baytown facility produces nonene, tetramer and associated by-products. We consider each of our processing facilities to be sufficient for its intended use.
Our Houston Facility. Our Houston facility is located approximately one mile from the Houston Ship Channel and has total capacity to process 2.4 billion pounds per year of crude C4. From the crude C4, the plant has the following annual production capacities, all of which are active: 1.2 billion pounds of butadiene, 300 million pounds of butene-1, 740 million pounds of raffinate, 146 million pounds of HPIB, 84 million pounds of DIB and 240 million pounds of PIB. It can also process 700 million pounds of purchased isobutylene annually, and has total MTBE production capacity of 2.7 billion pounds, of which 475 million pounds is active. Reactivation of the non-active MTBE production capacity at our Houston facility would require a significant capital investment. This facility allows us to realize substantial benefits by separating and upgrading the various components in the crude C4 and isobutylene streams we purchase. This facility was designed and constructed with spare and parallel equipment to enable us to shut down individual units for repair or maintenance without having to shut down the entire facility, thereby maximizing throughput. In addition, the facility has the physical space to allow for new plants to upgrade existing products or to accept new crude C4 and isobutylene feedstocks.
The location of the facility provides access to other Gulf Coast petrochemicals producers and directly connects us to facilities of several of our customers and raw material suppliers through an extensive pipeline network in the immediate area. Our Houston facility is also serviced by rail, tank truck, barge and ocean-going vessels. Our Houston facility also has access via pipeline to salt-dome storage facilities located at Mont Belvieu and Pierce Junction, Texas. The plant is situated on a 257-acre tract, with approximately 230 acres wholly owned by us, and the remaining 27 acres owned 75% by us and 25% by a third party.
The Houston facility was originally constructed in 1942 by the U.S. Government with start-up in 1944 by Sinclair Oil. The facility was acquired by Tenneco and FMC Corp. in 1954. In 1984, the Houston facility was acquired by Texas Petrochemicals Corporation, now TPC Group LLC, successor to Texas Olefins Company.
Our Port Neches Facility. Our Port Neches facility is located on a 154-acre site in Jefferson County, Texas and has total capacity to process 1.8 billion pounds and active capacity to process 970 million pounds per year of crude C4. From the crude C4, the plant has total production capacity of 900 million pounds and active capacity of 485 million pounds per year of butadiene, total production capacity of 900 million pounds and active production capacity of 485 million pounds per year of raffinate and total production capacity of 1.1 billion pounds per year of MTBE, none of which is active. Reactivation of the non-active MTBE production capacity at our Port Neches facility would require a significant capital investment. The facility has direct pipeline access to many butadiene customers, suppliers and refineries, and also has access to additional suppliers and customers via barge, ship, rail and truck. Similar to our Houston facility, the Port Neches facility was designed and constructed with spare and parallel equipment to enable us to shut down individual units for repair or maintenance without having to shut down the entire facility. The Port Neches facility has also benefited from historical capital investments to improve energy consumption rates that allow the facility to operate with significantly lower energy costs while processing high feedstock volumes.
The Port Neches facility was originally constructed in 1942 by the U.S. Government with initial processing beginning in 1944 for Texaco, Gulf, U.S. Rubber and B.F. Goodrich. The facility was acquired by Huntsman Corporation in its 1994 acquisition of Texaco’s chemical business and subsequently acquired by us in June 2006.
Our Baytown Facility. Our Baytown facility is located on an approximately 133 acre site in Harris County, Texas. This facility, which was previously idle, began producing nonene and tetramer in August 2007. The facility also operates as a petrochemicals products terminal providing storage and logistics services for nearby chemical companies, and has a total and active capacity to produce 135 million pounds of propylene derivatives.
20
Table of Contents
Index to Financial Statements
Pressurized Barge Joint Venture
We have a 50% interest in a joint venture with Kirby Inland Marine, Inc. The joint venture owns and operates four pressurized barges, which have very specialized cargo units for transporting chemicals. This joint venture was originally formed in the 1980s. Under the joint venture, each party owns half of the assets and we pay Kirby Inland an operating fee for transporting our products. If we are not using the barges at full capacity, we can make them available to third parties on negotiated terms.
Our Other Facilities
We own approximately 264 miles of product and feedstock pipelines, which give us the ability to directly connect some of our facilities, docks, product terminals, feedstock suppliers and customers. For our butadiene customers, we own and operate a proprietary butadiene pipeline system that connects to many of the large butadiene consumers on the Texas Gulf Coast. This pipeline network allows us to serve many of our butadiene customers independent of the Texas Butadiene Pipeline Corridor, which is controlled by ExxonMobil and upon which other suppliers must rely for transportation.
We also own and operate storage and terminal assets in Baytown, Texas and Lake Charles, Louisiana for several parties. Additionally, we have 20 million pounds of butadiene storage capability at our Houston facility, constituting the largest butadiene storage capacity on the Gulf Coast.
For receipt of crude C4 at our Houston and Port Neches facilities, we either own pipelines to or have direct pipeline connections with several ethylene producers. Further, we lease 20 million pounds of pressurized storage for crude C4 on the Houston Ship Channel, to and from which we have direct pipeline connections with our Houston facility. We handle and store a portion of Shell’s crude C4 for its Deer Park butadiene processing facility through this terminal for a fee. In addition, we have pipeline connections to certain co-producers of butadiene for receipt of crude C4 from those processing facilities anytime they have operating problems.
We serve our raffinates customers through an extensive network of company-owned and third party-owned pipelines. We also lease salt-dome storage capacity for raffinates at Pierce Junction, Texas, and the majority of these refiners are connected to this storage site. This storage system ties our raffinates customers to a ready supply of the product, delivered by pipeline, on very short notice.
We also own proprietary pipelines for shipment of butene-1 to the Dow - Texas City plant and isobutylene to the Lubrizol-Deer Park plant. We lease storage capacity and have terminaling capabilities for polyisobutylenes in Hammond, Indiana for servicing northern U.S. customers and additional leased terminal capacity in the Houston area. We own and operate a co-generation facility at our Houston facility, which produces 35 megawatts of natural gas generated electricity. This electricity is utilized primarily by our Houston facility, with the remainder (normally between 5 and 10 megawatts) sold to the Electric Reliability Council of Texas grid at market prices.
Our executive offices are located in Houston, Texas.
| ITEM 3. | LEGAL PROCEEDINGS |
Please read Note K to our consolidated financial statements, which are included in this Annual Report on Form 10-K, for a description of material legal proceedings.
| ITEM 4. | RESERVED |
21
Table of Contents
Index to Financial Statements
PART II
| ITEM 5. | MARKET FOR REGISTRANT’S COMMON EQUITY, RELATED STOCKHOLDER MATTERS AND ISSUER PURCHASES OF EQUITY SECURITIES |
On May 4, 2010, the Company’s common stock became listed and began trading on The NASDAQ Capital Market under the symbol “TPCG”. Prior to May 4, 2010, our shares were quoted on the Pink OTC Markets under the symbol “TXPI”. At September 10, 2010, there were approximately 92 holders of record of our common stock.
The following table sets forth the high and low sales prices, or bid information of our common stock for each full quarterly period within the two most recent fiscal years as reported by The NASDAQ Capital Market with respect to periods from and after May 4, 2010, and by Pink OTC Markets with respect to prior periods (quotations on Pink OTC Markets reflect inter-dealer prices, without retail markup, markdown or commission and may not necessarily represent actual transactions):
| High | Low | |||||
| Fiscal year 2010 | ||||||
| First quarter |
$ | 6.60 | $ | 3.50 | ||
| Second quarter |
8.75 | 5.25 | ||||
| Third quarter |
12.00 | 7.50 | ||||
| Fourth quarter |
18.43 | 12.00 | ||||
| Fiscal year 2009 | ||||||
| First quarter |
22.00 | 12.00 | ||||
| Second quarter |
18.00 | 4.00 | ||||
| Third quarter |
5.50 | 2.00 | ||||
| Fourth quarter |
4.00 | 2.41 | ||||
Dividends
We did not declare or pay any cash dividends in either of the two most recent fiscal years. Because the Company is a holding company that conducts substantially all of its operations through subsidiaries, our ability to pay cash dividends on our common stock is also dependent upon the ability of our subsidiaries to pay cash dividends or to otherwise distribute or advance funds to us. See Note F to our consolidated financial statements included in Item 8 herein for a description of our indebtedness and the impact of dividend restrictions in our credit facilities. Any future regular or special dividends will be at the discretion of our board of directors after taking into account various factors, including our financial condition and performance, our cash needs and expansion plans, income tax consequences, Delaware and other applicable laws, the restrictions imposed by our credit facilities, and such other factors as the board of directors deems relevant.
Performance Graph
The following performance graph and related information shall not be deemed “soliciting material” or to be “filed” with the SEC, nor shall such information be incorporated by reference into any future filing under the Securities Act of 1933 or Securities Exchange Act of 1934, each as amended, except to the extent that the Company specifically incorporates it by reference into such filing.
The following graph compares the cumulative five-year total return to stockholders on TPC Group Inc.’s common stock relative to the cumulative total returns of the Russell MicroCap index and two custom peer-groups comprised of nine companies each. The 2010 peer group includes Georgia Gulf Corporation (GGC), Huntsman Corporation (HUN), Innophos Holdings Inc. (IPHS), Kraton Performance Polymers Inc. (KRA), NewMarket Corporation (NEU), Olin Corporation (OLN), Omnova Solutions Inc. (OMN), PolyOne Corporation (POL), and Westlake Chemical Corporation (WLK). The 2009 peer
22
Table of Contents
Index to Financial Statements
group included Ashland, Inc. (ASH), Celanese Corporation (CE), The Dow Chemical Company (DOW), E.I. DuPont de Nemours & Co. (DD), Eastman Chemical Company (EMN), Huntsman Corporation (HUN), Lubrizol Corporation (LZ), NewMarket Corporation (NEU), and Westlake Chemical Corporation (WLK). The changes in the peer groups were based on our decision to focus the comparison on companies that are more similar to us in market capitalization and lines of business, as well as to remove those companies whose equity performance may be affected by factors that do not affect our equity performance.
The graph below assumes an investment of $100 (with reinvestment of all dividends) in our common stock, each of the peer groups and the Russell MicroCap index on June 30, 2005, and tracks their relative performance through June 30, 2010. The graph also assumes that the returns of each company in the peer groups are weighted based on the market capitalization of such company at the beginning of the measurement period.
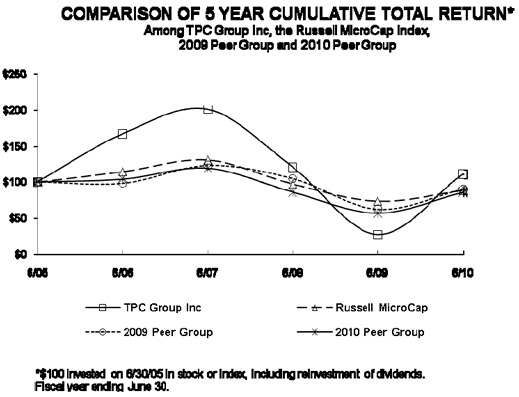
| June 30 | ||||||||||||
| 2005 | 2006 | 2007 | 2008 | 2009 | 2010 | |||||||
| TPC Group Inc |
100.00 | 166.67 | 200.33 | 120.00 | 26.33 | 110.67 | ||||||
| Russell MicroCap Index |
100.00 | 114.28 | 130.52 | 97.28 | 73.48 | 88.51 | ||||||
| 2009 Peer Group |
100.00 | 98.03 | 122.66 | 104.63 | 62.19 | 89.82 | ||||||
| 2010 Peer Group |
100.00 | 103.85 | 119.06 | 85.88 | 56.82 | 85.45 | ||||||
Issuer Purchases of Equity Securities
In September 2008, our board of directors authorized the repurchase of up to $25 million of our common stock in open market transactions, including block purchases, or in privately negotiated transactions. We did not acquire any shares of our common stock during fiscal 2010 under the repurchase program, which we deem to have expired in September 2009.
23
Table of Contents
Index to Financial Statements
The following table sets forth certain information with respect to repurchases by us of shares of our common stock during the fourth quarter of fiscal 2010:
| Period |
Total Number of Shares Purchased (1) |
Average Price Paid Per Share |
Total Number of Shares Purchased as Part of Publicly Announced Plans or Programs |
Maximum Number (or Approximate Dollar Value) of Shares that may yet be purchased under the Plans or Programs | |||||
| April 2010 |
0 | — | — | N/A | |||||
| May 2010 |
412,427 | $ | 16.98 | — | N/A | ||||
| June 2010 |
34,073 | 16.98 | — | N/A | |||||
| Fourth Quarter 2010 |
446,500 | $ | 16.98 | — | N/A | ||||
| (1) | All of the shares were surrendered by employees in exchange for the payment of the exercise price and associated tax withholding obligations upon the exercise of outstanding stock options, pursuant to a net exercise settlement procedure. The acquisition of the surrendered shares was not part of a publicly announced program to repurchases shares of our common stock, nor were they considered as or accounted for as treasury shares. |
| ITEM 6. | SELECTED FINANCIAL AND OPERATIONAL DATA |
The following table provides selected historical consolidated financial data derived from our audited consolidated financial statements as of and for the periods shown (in thousands except per share data). The selected financial data provided below should be read in conjunction with “Management’s Discussion and Analysis of Financial Condition and Results of Operations” and our Consolidated Financial Statements and related notes provided in Item 7 and Item 8, respectively, of this Annual Report on Form 10-K.
24
Table of Contents
Index to Financial Statements
| Year Ended June 30, | ||||||||||||||||||||
| 2010 | 2009 | 2008 | 2007 | 2006 | ||||||||||||||||
| Statements of Operations Data: |
||||||||||||||||||||
| Revenue |
$ | 1,688,484 | $ | 1,376,874 | $ | 2,016,198 | $ | 1,781,520 | $ | 1,237,745 | ||||||||||
| Cost of sales |
1,444,156 | 1,194,173 | 1,752,191 | 1,540,097 | 1,037,495 | |||||||||||||||
| 244,328 | 182,701 | 264,007 | 241,423 | 200,250 | ||||||||||||||||
| Operating expenses |
133,181 | 132,268 | 131,191 | 124,368 | 69,335 | |||||||||||||||
| General and administrative expenses |
29,840 | 32,769 | 36,667 | 29,326 | 29,048 | |||||||||||||||
| Depreciation and amortization |
39,769 | 41,899 | 35,944 | 29,111 | 14,245 | |||||||||||||||
| Asset impairment |
— | 5,987 | — | — | — | |||||||||||||||
| Loss on sale of assets |
— | — | 1,092 | — | — | |||||||||||||||
| Business interruption insurance recoveries |
(17,051 | ) | (10,000 | ) | — | — | — | |||||||||||||
| Reorganization expenses |
— | — | — | — | 1,894 | |||||||||||||||
| Unauthorized freight payments |
— | (4,694 | ) | 499 | 6,812 | 2,543 | ||||||||||||||
| Income (loss) from operations |
58,589 | (15,528 | ) | 58,614 | 51,806 | 83,185 | ||||||||||||||
| Interest expense, net |
15,007 | 16,816 | 18,868 | 16,995 | 2,327 | |||||||||||||||
| Debt conversion cost |
— | — | — | — | 20,920 | |||||||||||||||
| Unrealized loss (gain) on derivatives |
(3,464 | ) | 3,710 | (99 | ) | (146 | ) | — | ||||||||||||
| Other (income) expense, net |
(2,287 | ) | (1,623 | ) | (1,394 | ) | 37 | (1,183 | ) | |||||||||||
| Income (loss) before income taxes |
49,333 | (34,431 | ) | 41,239 | 34,920 | 61,121 | ||||||||||||||
| Income tax expense (benefit) |
18,792 | (11,653 | ) | 14,615 | 13,690 | 21,037 | ||||||||||||||
| Net income (loss) |
$ | 30,541 | $ | (22,778 | ) | $ | 26,624 | $ | 21,230 | $ | 40,084 | |||||||||
| Earnings per share: |
||||||||||||||||||||
| Basic |
$ | 1.70 | $ | (1.29 | ) | $ | 1.51 | $ | 1.23 | $ | 2.98 | |||||||||
| Fully diluted |
$ | 1.70 | $ | (1.29 | ) | $ | 1.47 | $ | 1.20 | $ | 2.43 | |||||||||
| Cash dividends declared per share |
$ | — | $ | — | $ | — | $ | — | $ | — | ||||||||||
| Weighted average shares outstanding: |
||||||||||||||||||||
| Basic |
17,928 | 17,714 | 17,588 | 17,303 | 13,470 | |||||||||||||||
| Fully diluted |
17,930 | 17,714 | 18,073 | 17,761 | 17,072 | |||||||||||||||
| Statements of Cash Flows Data: |
||||||||||||||||||||
| From operating activities |
$ | 126,818 | $ | 50,197 | $ | 57,826 | $ | 93,589 | $ | 52,336 | ||||||||||
| For investing activities |
||||||||||||||||||||
| Capital expenditures |
(14,400 | ) | (16,128 | ) | (87,783 | ) | (100,425 | ) | (46,206 | ) | ||||||||||
| Purchase of business assets |
— | — | (70,000 | ) | — | (208,791 | ) | |||||||||||||
| From (for) financing activities |
||||||||||||||||||||
| Proceeds - term loans |
— | — | 70,000 | — | 210,000 | |||||||||||||||
| Repayments - term loans |
(3,100 | ) | (2,744 | ) | (2,595 | ) | (2,092 | ) | — | |||||||||||
| Net proceeds from (payments on) - revolving credit facility |
— | (21,800 | ) | 21,800 | — | — | ||||||||||||||
| Debt issuance costs |
(4,621 | ) | — | — | — | — | ||||||||||||||
| Repurchase of common stock |
— | (3,019 | ) | (300 | ) | — | — | |||||||||||||
| June 30, | ||||||||||||||||||||
| 2010 | 2009 | 2008 | 2007 | 2006 | ||||||||||||||||
| Balance Sheets Data: |
||||||||||||||||||||
| Cash and cash equivalents |
$ | 114,642 | $ | 6,588 | $ | 615 | $ | 9,534 | $ | 20,338 | ||||||||||
| Accounts receivable - trade |
116,407 | 98,515 | 200,449 | 161,604 | 176,734 | |||||||||||||||
| Inventories |
94,607 | 36,884 | 102,462 | 83,959 | 72,534 | |||||||||||||||
| Property, plant and equipment, net |
491,082 | 516,377 | 545,972 | 494,030 | 420,102 | |||||||||||||||
| Total assets |
871,451 | 709,843 | 905,261 | 791,073 | 734,845 | |||||||||||||||
| Current liabilities |
196,748 | 108,687 | 249,852 | 274,239 | 256,301 | |||||||||||||||
| Long-term debt |
250,421 | 269,855 | 294,370 | 205,837 | 207,908 | |||||||||||||||
| Deferred income taxes |
111,432 | 52,090 | 61,576 | 45,213 | 33,289 | |||||||||||||||
| Total liabilities |
558,601 | 430,632 | 605,798 | 525,289 | 497,498 | |||||||||||||||
25
Table of Contents
Index to Financial Statements
| ITEM 7. | MANAGEMENT’S DISCUSSION AND ANALYSIS OF FINANCIAL CONDITION AND RESULTS OF OPERATIONS |
The following discussion and analysis of our financial condition and results of operations should be read in conjunction with our consolidated financial statements and accompanying notes included in Item 8 of this Annual Report on Form 10-K.
Overview
We manage our business and conduct our activities in two operating segments, our C4 Processing segment and our Performance Products segment. These two operating segments are our primary reporting segments. In the C4 Processing segment, we process the crude C4 stream into several higher value components, namely butadiene, butene-1, raffinates and MTBE. In our Performance Products segment, we produce high purity isobutylene and we process isobutylene to produce higher value derivative products, such as polyisobutylene and diisobutylene. We also process refinery grade propylene into nonene, tetramer and associated by-products as a part of our Performance Products segment. We produce steam and electricity for our own use at our Houston facility, and we sell a portion of our steam production as well as excess electricity, which are reported as part of our C4 Processing segment.
The primary driver of our businesses is general economic and industrial growth. Our results are impacted by the effects of economic upturns or downturns on our customers and our suppliers, as well as on our own costs to produce, sell and deliver our products. Our customers generally use our products in their own production processes; therefore, if our customers curtail production of their products, our results could significantly be affected. In particular, our feedstock costs and product prices are susceptible to volatility in pricing and availability of crude oil, natural gas and oil-related products such as unleaded regular gasoline. Prices for these products tend to be volatile as well as cyclical, as a result of global and local economic factors, worldwide political events, weather patterns and the economics of oil and natural gas exploration and production, among other things.
Material Industry Trends
The global recession that began in early fiscal 2009 continued to develop through the remainder of the fiscal year, resulting in a significant decline in the selling prices for our products. In response to these developments, in December 2008 we temporarily idled various production units at both our Houston and Port Neches facilities in order to reduce operating costs and match production to the reduced needs of our customers and suppliers. We also released a portion of our contractor workforce to further reduce costs. In the third quarter of fiscal 2009, demand for some products began to improve relative to the previous months, and we restarted all of the production facilities that we idled in December 2008. However, our butadiene production continued to be negatively impacted by limited supply of crude C4, the raw material input for our C4 Processing extraction process.
We receive most of our crude C4 from steam crackers, which are designed to process naphtha and natural gas liquids as feedstocks for ethylene production. Crude C4 is a byproduct of the ethylene production process, and the volume of crude C4 produced by the process is driven by both the volume of ethylene produced and the composition of the steam cracker feedstock. Some major ethylene producers have the flexibility to vary from light feedstocks, such as natural gas liquids (NGLs), to heavier feedstocks, such as naphtha, or vice versa depending on the economics of the feedstock. When ethylene producers process heavier feedstock, greater volumes of crude C4 are produced. However, when light feedstocks are inexpensive relative to heavy feedstocks, the producers may choose to process those light feedstocks instead, a process referred to as “light cracking,” which results in lower volumes of crude C4 production. Throughout fiscal 2009 and 2010, NGL prices have remained attractive relative to naphtha. Consequently, light cracking has been prevalent and crude C4 supply has been reduced over the same period, which negatively impacted our butadiene production and sales volumes. Crude C4 availability has also been affected by lower operating rates of ethylene crackers.
In April 2009, in order to preserve liquidity in response to the ongoing global economic crisis and to align our expenditures with our decreased sales volumes, we undertook initiatives to reduce our capital spending, general and administrative expenses and operating expenses. These initiatives included a reduction of our active C4 processing and butadiene production capacity. We shut down one of the two trains processing crude C4 at our Port Neches facility and temporarily idled some capacity at our Houston facility, also reducing associated headcount. From time to time during fiscal 2010, we temporarily reactivated the idled production capacity at our Houston facility in response to increased crude C4 supply as well as decreased production rates of the non-idled unit. The idled train at Port Neches did not operate at any time during fiscal 2010 and we do not expect to again operate both trains at Port Neches until crude C4 supply conditions improve. If we are able to secure significant incremental feedstock commitments, we will consider operating both trains at Port Neches, but
26
Table of Contents
Index to Financial Statements
doing so will likely require a significant amount of time and capital to hire personnel and bring the idled train to operational readiness. Please see Item 2 – “Properties” above for more information about the total and active production capacities at our facilities.
In sharp contrast to fiscal 2009, fiscal 2010 was characterized by continuously improving market conditions as well as increasing petroleum prices and related commodity market indices. Since a substantial portion of our raw material costs and product selling prices are linked to these commodity indices (such as indices based on the price of unleaded regular gasoline, butane, isobutane or refinery grade propylene), during fiscal 2010 we experienced upward trends in both our raw material costs and our selling prices. Although both raw material costs and selling prices have increased during fiscal 2010, the revenue impact of higher selling prices exceeded the impact on cost of sales of higher raw material costs. Supply shortages for some of our products during fiscal 2010 also contributed to margin improvement.
Recent Developments
On July 15, 2010, our board of directors approved a change in our fiscal year end from June 30 to December 31, with the change to the calendar year reporting cycle beginning January 1, 2011. In addition to this Annual Report on Form 10-K, we expect to file a subsequent report on Form 10-K covering the six-month transition period ending December 31, 2010.
On May 4, 2010, our shares began trading on The NASDAQ Capital Market under the symbol “TPCG”.
On April 29, 2010, we amended and extended our Revolving Credit Facility. The amended facility increases overall capacity from $140 million to $175 million, subject to borrowing base calculations, and extends the maturity date from June 2011 to at least March 2013. In addition, the amended credit agreement includes an accordion feature that could facilitate access to additional capacity if necessary for continued growth.
In February 2010, we received a $39.8 million refund of federal income taxes paid for fiscal 2004 through fiscal 2006. The Worker, Homeownership, and Business Assistance Act of 2009, signed into law on November 6, 2009, extended the net operating loss carry-back period from two to three, four or five years. As a result of this change in the law, we were able to carry back $124.3 million of our $132.6 million net operating loss to offset taxable income in fiscal 2004, 2005 and 2006. In February 2010, we received a refund of income taxes paid in those years of $39.8 million. The remaining portion of the fiscal 2009 net operating loss of $8.3 million will be used to offset taxable income on the fiscal 2010 tax return.
In January 2010, we changed our name from Texas Petrochemicals Inc. to TPC Group Inc. Simultaneously, the name of our wholly owned subsidiary was changed from Texas Petrochemicals LLC to TPC Group LLC.
In November 2009, we received the second and final installment of our claim under our business interruption insurance policy related to damages incurred from Hurricane Ike in September 2008. On or about September 11, 2008, in anticipation of Hurricane Ike, we shut down all three of our major operating facilities. Our facilities sustained relatively minor damage but remained shut down for approximately one week. However, many of our customers and suppliers suffered greater damage than we suffered and were in some cases significantly slower to recommence operations, resulting in significantly curtailed sales volume. As a result of losses we incurred, we made a claim against our business interruption insurance policy. Our total claim settlement of $47.0 million consisted of a $19.5 million deductible, a $10.0 million payment received in fourth quarter of fiscal 2009 and a second and final payment of $17.1 million (net of recovery expenses of $0.4 million) received in the second quarter of fiscal 2010.
In order to preserve liquidity in response to the ongoing global economic crisis and to align our expenditures with our decreased sales volumes, in the fourth quarter of fiscal 2009 we undertook initiatives to reduce our operating and general and administrative expenses and our capital spending. These initiatives included a reduction of our active C4 processing and butadiene production capacity as well as headcount reductions at our corporate headquarters and at our operating facilities. We reduced our capital spending to baseline levels, given that our major capital investment program was substantially complete. Actions taken to reduce our active crude C4 and butadiene production capacity included shutting down one of the two trains processing crude C4 at our Port Neches facility and temporarily idling some capacity at our Houston facility. From time to time we reactivated the idled production capacity at our Houston facility, but we do not expect to operate the idled train at Port Neches again until feedstock supply conditions improve.
Results of Operations
The following table provides selected financial data (amounts in thousands) for our reportable business segments for the three most recent fiscal years. Please refer to this information, as well as the selected financial data provided in Item 6 and our Consolidated Financial Statements and related notes provided in Item 8 of this Annual Report on Form 10-K when reading our
27
Table of Contents
Index to Financial Statements
discussion and analysis of results of operations below. Revenues, cost of sales and operating expenses in the table below are derived from our audited Consolidated Statements of Operations for the respective periods. Sales volumes and Adjusted EBITDA constitute unaudited information. Adjusted EBITDA is a non-GAAP financial measure. A non-GAAP financial measure is a numerical measure of historical or future financial performance, financial position or cash flows that excludes amounts, or is subject to adjustments that have the effect of excluding amounts, that are included in the most directly comparable measure calculated and presented in accordance with GAAP in the statements of operations, balance sheets, or statements of cash flows (or equivalent statements); or includes amounts, or is subject to adjustments that have the effect of including amounts, that are excluded from the most directly comparable measure so calculated and presented. In this regard GAAP refers to generally accepted accounting principles in the United States.
Adjusted EBITDA is presented and discussed in this Management’s Discussion and Analysis of Financial Condition and Results of Operations because management believes it enhances understanding by investors and lenders of the Company’s financial performance. Since Adjusted EBITDA is not a measure computed in accordance with GAAP, it does not represent cash flow from operations, nor is it intended to be presented herein as a substitute to operating income or net income as indicators of the Company’s operating performance. Adjusted EBITDA is the primary performance measurement used by our senior management and our Board of Directors to evaluate operating results of, and to allocate capital resources between, our business segments. We calculate Adjusted EBITDA in accordance with our credit facilities, meaning earnings before interest, taxes, depreciation and amortization (EBITDA), then adjusted to add back certain additional items. Such additional items include certain non-cash items defined by the credit facilities and reflected in the Reconciliation of Adjusted EBITDA to Net Income (Loss) below. Our calculation of Adjusted EBITDA may be different from calculations used by other companies; therefore, it may not be comparable to other companies.
| Year Ended June 30, | ||||||||||||
| 2010 | 2009 | 2008 | ||||||||||
| Sales volumes (lbs) (1): |
||||||||||||
| C4 Processing |
2,441,304 | 2,270,670 | 2,802,257 | |||||||||
| Performance Products |
601,590 | 576,550 | 732,439 | |||||||||
| MTBE (2) |
— | — | 172,596 | |||||||||
| 3,042,894 | 2,847,220 | 3,707,292 | ||||||||||
| Revenues: |
||||||||||||
| C4 Processing |
$ | 1,328,687 | $ | 1,061,939 | $ | 1,483,736 | ||||||
| Performance Products |
359,797 | 314,935 | 466,352 | |||||||||
| MTBE (2) |
— | — | 66,110 | |||||||||
| $ | 1,688,484 | $ | 1,376,874 | $ | 2,016,198 | |||||||
| Cost of sales (3): |
||||||||||||
| C4 Processing |
$ | 1,157,899 | $ | 940,798 | $ | 1,306,666 | ||||||
| Performance Products |
286,257 | 253,375 | 386,340 | |||||||||
| MTBE (2) |
— | — | 59,185 | |||||||||
| $ | 1,444,156 | $ | 1,194,173 | $ | 1,752,191 | |||||||
| Operating expenses (3): |
||||||||||||
| C4 Processing |
$ | 96,614 | $ | 98,442 | $ | 93,947 | ||||||
| Performance Products |
36,567 | 33,826 | 36,527 | |||||||||
| MTBE (2) |
— | — | 717 | |||||||||
| $ | 133,181 | $ | 132,268 | $ | 131,191 | |||||||
| Adjusted EBITDA (5): |
||||||||||||
| C4 Processing (4) |
$ | 91,225 | $ | 37,391 | $ | 82,624 | ||||||
| Performance Products |
36,974 | 27,736 | 43,485 | |||||||||
| MTBE (2) |
— | — | 6,207 | |||||||||
| Corporate |
(26,368 | ) | (24,835 | ) | (28,778 | ) | ||||||
| $ | 101,831 | $ | 40,292 | $ | 103,538 | |||||||
| (1) | Sales volumes represent product sales volumes only and do not include volumes of products delivered under tolling or similar arrangements, in which we do not purchase the raw materials, but process raw materials for another party for a specified fee. |
28
Table of Contents
Index to Financial Statements
| (2) | As reported in the above table, the “MTBE” segment represents MTBE produced by our Houston dehydrogenation units. In conjunction with the start-up of our isobutylene processing unit in the first quarter of fiscal 2008, the dehydrogenation units were idled, and all MTBE produced from those units was sold by the end of the second quarter of fiscal 2008. Beginning with third quarter of fiscal 2008, MTBE production as a byproduct of the crude C4 isobutylene process was insignificant, and related revenues and operating results were included in the C4 Processing segment. |
| (3) | Does not include depreciation and amortization expense. |
| (4) | C4 Processing segment Adjusted EBITDA for fiscal 2010 reflected the second and final installment of our business interruption insurance claim of $17.1 million (net of expenses), and fiscal 2009 Adjusted EBITDA reflected the first installment of the insurance claim of $10.0 million, as well as the unauthorized freight payment recovery of $4.7 million. |
| (5) | See above for a discussion of Adjusted EBITDA and below for reconciliations of Adjusted EBITDA to Net Income (Loss) for the years presented. Net Income (Loss) is the most direct comparative GAAP measure reported in the Consolidated Statements of Operations. |
The table below provides a reconciliation of Adjusted EBITDA to Net Income (Loss) (in thousands) for the three most recent fiscal years. Net Income (Loss) is the most direct comparative GAAP measure reported in the Consolidated Statements of Operations.
| Year Ended June 30, | ||||||||||||
| 2010 | 2009 | 2008 | ||||||||||
| Net income (loss) |
$ | 30,541 | $ | (22,778 | ) | $ | 26,624 | |||||
| Income tax expense (benefit) |
18,792 | (11,653 | ) | 14,615 | ||||||||
| Interest expense, net |
15,007 | 16,816 | 18,868 | |||||||||
| Depreciation and amortization |
39,769 | 41,899 | 35,944 | |||||||||
| EBITDA |
104,109 | 24,284 | 96,051 | |||||||||
| Impairment of assets |
— | 5,987 | — | |||||||||
| Loss on sale of assets |
— | — | 1,092 | |||||||||
| Non-cash stock-based compensation |
1,186 | 6,311 | 6,494 | |||||||||
| Unrealized (gain) loss on derivatives |
(3,464 | ) | 3,710 | (99 | ) | |||||||
| Adjusted EBITDA |
$ | 101,831 | $ | 40,292 | $ | 103,538 | ||||||
Fiscal year ended June 30, 2010 versus fiscal year ended June 30, 2009
Revenues
Total revenues for fiscal 2010 were $1,688.5 million, an increase of $311.6 million, or 23%, compared to total revenues of $1,376.9 million for fiscal 2009. The overall increase in revenues reflected the positive impact of a 7% increase in overall sales volume as well as better average selling prices, primarily for C4 Processing segment product lines, which in the aggregate were 15% higher. The positive impacts of the higher sales volumes and higher average selling prices were $134 million and $178 million, respectively. Sales volumes in fiscal 2009 were curtailed in the first two months of the year by limited crude C4 availability and subsequently by the aftermath of Hurricane Ike and weakened demand related to the global economic recession. Sales volumes in fiscal 2010 reflected an upward trend in overall demand for our products that has followed the improvement in general economic and market conditions when compared to the previous year. Average selling prices in fiscal 2009 were positively affected by strong demand and high petrochemical and fuel-related prices during the first two months of the fiscal year, and then were negatively affected over the remainder of the fiscal year as a result of the global economic recession. Selling prices for fiscal 2010 have steadily increased over the course of the fiscal year, which reflected strengthening economic conditions that have driven petroleum prices and related commodity market indices upward. Fiscal 2010 average selling prices benefited also from tight market conditions for our products.
Fiscal 2010 revenues for the C4 Processing segment were higher by $266.8 million, or 25%, compared to the previous year. The overall increase reflected the combined effect of 8% higher sales volumes, which increased revenues by $103 million, and 17% higher average selling prices, which increased revenues by $164 million.
29
Table of Contents
Index to Financial Statements
Fiscal 2010 revenues for the Performance Products segment were $44.9 million, or 14%, higher than fiscal 2009, which reflected a 4% improvement in sales volume and a 10% improvement in average selling prices. The moderately higher sales volumes reflected the loss of sales volume related to a contract that ended as of December 31, 2008, which was more than offset by higher sales volumes in fiscal 2010 for all other product lines in this segment. The contract that ended on December 31, 2008 contributed 23% of total sales volumes and 20% of total revenues for the segment during fiscal 2009. The higher overall sales volume contributed $31 million of the increase in revenues, while the higher average selling prices contributed $14 million.
Cost of sales
Total cost of sales was $1,444.2 million in fiscal 2010 compared to $1,194.2 million in fiscal 2009. The overall $250.0 million, or 21%, increase in cost of sales was driven by the 7% higher sales volume and higher average raw material costs, partially offset by the positive impact of lower natural gas energy costs. Overall fiscal 2010 per unit raw material costs were 18% higher and overall per unit energy costs were 30% lower in comparison with fiscal 2009. Total cost of sales represented 86% and 87% of total revenues in fiscal 2010 and 2009, respectively.
Fiscal 2010 cost of sales for the C4 Processing segment was higher by $217.1 million, or 23%, versus fiscal 2009, reflecting the impact of 8% higher sales volumes and 21% higher per unit raw material costs, partially offset by the lower natural gas energy costs. C4 Processing segment cost of sales as a percentage of segment revenues was 87% and 89% for fiscal 2010 and 2009, respectively.
Fiscal 2010 Performance Products segment cost of sales increased from fiscal 2009 by $32.9 million, or 13%. The increase primarily reflected the 4% increase in sales volume and 8% higher average per unit raw material costs. The impact on sales volume of the sales contract that ended as of December 31, 2008 (see discussion of Performance Products revenues above) was offset by significantly higher sales volumes in fiscal 2010 for all other products. The contract that expired on December 31, 2008 contributed 23% of total segment sales volumes and 21% of total segment cost of sales in fiscal 2009. Performance Products segment cost of sales as a percentage of segment revenues was 80% for both the current and prior fiscal years.
Many of our supply contracts and sales contracts use matching commodity indices for determining pricing, which mitigates fluctuations in our material margin percentage (which we define as the percentage difference between total revenues and raw material costs) to varying degrees. Nevertheless, our material margin percentage, while relatively stable over time, is not perfectly constant. In fiscal 2010, our overall average sales prices were 15% higher than fiscal 2009, while our overall average raw material costs were up 18%. The fact that average sales prices and raw material costs did not change in absolute lockstep indicates a slight change in our material margin percentage. Changes in the material margin percentage occur, despite the index-based pricing in our supply contracts and sales contracts, in part because the effect of using matching indices is lessened if we do not purchase the feedstock and sell the finished product in the same period, or if the index used for purchasing the raw materials is tied to a different period than the index in the sales contract. Please see “Supplier Purchase Agreements” in Item 1 of this Annual Report on Form 10-K. Contract turnover, changes in feedstock and product mix and other factors also can impact our material margin percentage.
Operating expenses
Operating expenses incurred during fiscal 2010 were $133.2 million compared to $132.3 million in fiscal 2009. The primary components of the $0.9 million increase were higher maintenance costs of $1.5 million, higher contract services and professional fees of $1.2 million, higher personnel costs of $0.9 million, higher storage and handling costs of $0.6 million and higher selling overhead expenses of $0.6 million, partially offset by the absence in fiscal 2010 of hurricane damage repair expense incurred in the prior fiscal year of $3.8 million.
General and administrative expenses
General and administrative expenses in fiscal 2010 were $29.8 million compared to $32.8 million in the previous fiscal year. The decrease of $3.0 million reflected lower expense of $7.5 million related to our stock-based compensation plan, partially offset by higher compensation and benefit costs of $4.4 million, including severance costs of $0.7 million. Stock-based compensation decreased by $6.0 million due to the majority of option and restricted stock grants becoming fully vested in fiscal 2009. The reduction also reflected the absence in fiscal 2010 of $1.6 million incurred by us in fiscal 2009 to pay the individual tax liability of our previous directors and certain of our management-level employees related to the vesting of their restricted stock. The amount we paid was based on their individual tax liability related to the value of the stock that vested on July 1, 2008. No such option was available to our directors and management employees regarding the restricted stock that vested on July 1, 2009.
30
Table of Contents
Index to Financial Statements
Depreciation and amortization expense
Depreciation and amortization expense in fiscal 2010 was $39.8 million compared to $41.9 million in fiscal 2009. The decline in depreciation expense reflected the return to baseline capital spending subsequent to completion of our major capital investment initiatives in the first quarter of fiscal 2009.
Asset Impairment
In the fourth quarter of fiscal 2009 we recorded an asset impairment charge to write down the carrying value of our dehydrogenation assets. In conjunction with completion of a capital project in October 2007, which allowed us to externally source isobutylene feedstock at our Houston facility, we idled our dehydrogenation units that were previously used to produce isobutylene. The carrying value of the dehydrogenation units was not previously considered to be impaired because there were a number of realistic and probable alternative uses for these assets by which the carrying value would have been recovered. However, in the fourth quarter of fiscal 2009, we determined that the likelihood of investing additional capital in the foreseeable future necessary to recover the carrying value of these specific assets had been substantially reduced. Based on this determination and the fact that the assets had been idled for almost two years, we concluded that recovery of the carrying cost was not likely and recorded a charge of $6.0 million to recognize the impairment of these assets. No asset impairment was recognized in fiscal 2010.
Unauthorized freight payment recoveries
In July 2007, we discovered that a former employee, with the assistance of a non-employee conspirator, had directed unauthorized payments from our accounts to a fictitious vendor in various amounts in years prior to fiscal 2009. In August 2008, the former employee and his non-employee conspirator were convicted of certain crimes related to the unauthorized freight payments. As part of their convictions, the former employee and his non-employee conspirator were required to forfeit assets to the Office of the U.S. Attorney for restitution. These assets were liquidated by the U.S. government, and in April 2009, we received $4.7 million as restitution of losses represented by the unauthorized freight payments.
Business interruption insurance recoveries
In the second quarter of fiscal 2010 we received $17.1 million (net of recovery expenses of $0.4 million) as the second and final installment of our business interruption insurance recovery related to Hurricane Ike. Our total settlement of $47.0 million consisted of a $19.5 million deductible, a $10.0 million payment received in the fourth quarter of fiscal 2009 and the final payment of $17.5 million, before expenses, received in the second quarter of fiscal 2010. The insurance recovery is reflected in operating results for the C4 Processing segment.
Interest expense
Interest expense incurred in fiscal 2010 was $15.1 million, compared to $16.8 million in the previous year. The decline in interest expense reflected lower average interest rates on a lower average amount outstanding on our Revolving Credit Facility of $26.2 million, partially offset by the absence of capitalized interest in the current fiscal year, which was $0.9 million in fiscal 2009.
Unrealized gain/loss on derivatives
The unrealized net gain on derivatives in fiscal 2010 was $3.5 million, compared to a net loss of $3.7 million in the previous fiscal year. Both the gain in fiscal 2010 and the loss in fiscal 2009 were associated with the interest rate swap related to our Term Loan. The interest rate swap expired on June 30, 2010.
Other, net
Other, net in both fiscal 2010 and fiscal 2009 consisted primarily of income from our investment in Hollywood/Texas Petrochemicals LP, which is accounted for under the equity method. We and Kirby Inland Marine, Inc. formed this joint venture to operate four barges capable of transporting chemicals.
Income tax expense
Our effective income tax rate for fiscal 2010 was 38.1%, compared to 33.8% for fiscal 2009. The effective rates for both years reflected federal statutory tax at 35% and Texas and Delaware franchise taxes; however, the current year provision
31
Table of Contents
Index to Financial Statements
included the impact of a Domestic Production Deduction of $1.0 million originally taken on the fiscal 2006 tax return that was permanently lost as a result of the carry back of our fiscal 2009 net operating loss, which eliminated fiscal 2006 taxable income. In December 2009, as a result of the Worker, Homeownership, and Business Assistance Act of 2009 that was signed into law on November 6, 2009, we applied for a refund of income taxes paid for fiscal years 2004, 2005 and 2006. Of the total amount of the fiscal 2009 net operating loss of $132.6 million, we applied to carry back $124.3 million, which resulted in a refund of $39.8 million received in February 2010. The remaining $8.3 million of the fiscal 2009 net operating loss will be used to offset fiscal 2010 taxable income.
Net income
Net income in fiscal 2010 was $30.5 million, compared to a net loss of $22.8 million in fiscal 2009. The primary components of the $53.3 million increase were the positive impacts of higher total revenues of $311.6 million, lower depreciation expense of $2.1 million, the $6.0 million asset impairment in the prior fiscal year, the higher business interruption insurance recovery of $7.1 million and the unrealized net gain of $7.2 million on the interest rate swap, partially offset by higher cost of sales of $250.0 million, the unauthorized freight payment recovery of $4.7 million in the prior fiscal year, and the higher tax provision of $30.4 million.
Adjusted EBITDA
Total Adjusted EBITDA in fiscal 2010 was $101.8 million compared to $40.3 million in fiscal 2009, an increase of 153%. Substantial improvements in both operating segments reflected the favorable economic and market conditions in fiscal 2010 compared to fiscal 2009.
C4 Processing Adjusted EBITDA improved from $37.4 million in fiscal 2009 to $91.2 million in fiscal 2010, an increase of $53.8 million, or 144%. The primary components of the increase were substantially improved margin between sales and cost of sales of $49.6 million and the incremental amount of the second business interruption insurance installment of $7.1 million, partially offset by the unauthorized freight recovery in fiscal 2009 of $4.7 million.
Adjusted EBITDA for the Performance Products segment was $37.0 million in fiscal 2010 compared to $27.7 million in fiscal 2009. The increase of $9.2 million, or 33%, primarily reflected improved margin between sales and cost of sales of $12.0 million, partially offset by higher operating expenses of $2.7 million.
Corporate and other expenses in fiscal 2010 were higher by $1.5 million compared to the prior year. Corporate and other expenses consist of general and administrative expenses, excluding non-cash stock compensation, which is excluded from Adjusted EBITDA, and other, net discussed above.
Fiscal year ended June 30, 2009 versus fiscal year ended June 30, 2008
Revenues
Total fiscal 2009 revenues were $1,376.9 million compared to fiscal 2008 revenues of $2,016.2 million. The primary components of the $639.3 million, or 32%, decline were lower revenues of $421.8 million for the C4 Processing segment and lower revenues of $151.4 million for the Performance Products segment. Also contributing to the lower fiscal 2009 revenues was the absence of MTBE produced by our dehydrogenation units, for which revenues were $66.1 million in fiscal 2008. The overall decrease in revenues reflected the impact of both lower sales volumes and lower average selling prices across all of our product lines. Total fiscal 2009 sales volumes were down 23% from the previous fiscal year, largely attributable to the impact of Hurricane Ike in September 2008. Hurricane Ike had a significant negative impact on sales volumes from mid-September 2008 through the second quarter of fiscal 2009 as our ability to ship product was curtailed and several of our customers could not take product because they were forced to shut down for extended periods of time. The global economic crisis eroded demand and selling prices for our products over the last three quarters of the fiscal year. The decline in average selling prices reflected weakened demand and lower petrochemical and fuel-related prices in fiscal 2009 compared to fiscal 2008.
The decrease in C4 Processing segment revenues of $421.8 million, or 28%, reflected both lower sales volumes and lower average selling prices. Sales volumes, which were down 19%, and average selling prices, which were down 12%, negatively impacted revenues by $284 million and $138 million, respectively. Significant drivers behind the overall decrease in C4 Processing volumes were the September 2008 hurricanes and the global economic downturn. Although our production facilities were able to recover quickly from the hurricanes, our ability to receive raw materials and ship finished products was significantly hampered as both suppliers and customers remained shut down for extended periods of time. The global economic downturn substantially eroded customer demand for our C4 Processing products. The lower average selling prices
32
Table of Contents
Index to Financial Statements
in fiscal 2009 reflected the impact of weak demand as well as relatively high fiscal 2008 selling prices for butadiene and butene-1, which were supported by supply shortages, and for fuel related products, which were supported by high unleaded regular gasoline prices.
As with the C4 Processing segment, the $151.4 million, or 32%, decrease in Performance Products segment revenues resulted from both lower sales volumes and lower average selling prices. Sales volumes, which were down 21%, had a negative impact on revenues of $97 million, and average selling prices, which were down 14%, had a negative impact of $54 million. The deterioration in both volume and pricing reflect the weakened demand attributable to the economic downturn.
Cost of sales
Total cost of sales in fiscal 2009 was $1,194.2 million, compared to $1,752.2 million in fiscal 2008. The overall $558.0 million, or 32%, decrease reflected the combination of lower sales volumes and lower average costs for the C4 Processing and Performance Products segments, as well as the absence of costs associated with MTBE produced by our dehydrogenation units, for which cost of sales were $59.2 million in fiscal 2008. Cost of sales for the C4 Processing and Performance Products segments were down $365.9 million and $133.0 million, respectively. Overall average raw material costs were down on a basis substantially consistent with the decline in overall average selling prices (13% and 11%, respectively). As a result of the significant and rapid declines in selling prices during the respective periods, we recorded first and second quarter lower-of-cost-or-market adjustments of $9.4 million and $11.6 million, respectively, which are reflected in cost of sales for fiscal year 2009. Over the course of the second half of fiscal 2009 average selling prices stabilized, which contributed to more stable raw material costs and margins. Total cost of sales, excluding MTBE produced from dedicated dehydrogenation units in the prior year, was 87% of total revenues for both fiscal 2009 and 2008.
The decrease in cost of sales for the C4 Processing segment of $365.9 million, or 28%, reflected the impact of 19% lower sales volume as well as lower average raw material costs. The lower average raw material costs substantially mirrored the lower average selling prices discussed above (13% and 12%, respectively). C4 Processing segment cost of sales, as a percentage of total segment revenues, was 89% in fiscal 2009 and 88% in fiscal 2008.
The decrease in the Performance Products segment cost of sales of $133.0 million, or 34%, was likewise due to the combined impact of lower sales volume, which was down 21%, and lower average raw material costs. As discussed above for the C4 Processing segment, the lower average raw material costs generally corresponded to the lower average selling prices (17% and 14%, respectively). Performance Products segment cost of sales was 80% and 83% of total revenues in fiscal 2009 and fiscal 2008, respectively.
Many of our supply contracts and sales contracts use matching commodity indices for determining pricing, which mitigates fluctuations in our material margin percentage (which we define as the percentage difference between total revenues and raw material costs) to varying degrees. Nevertheless, our material margin percentage, while relatively stable over time, is not perfectly constant. In fiscal 2009, our overall average sales prices were 11% lower than fiscal 2008, while our overall average raw material costs were down 13%. The fact that average sales prices and raw material costs did not change in absolute lockstep indicates a slight change in our material margin percentage. Changes in the material margin percentage occur, despite the index-based pricing in our supply contracts and sales contracts, in part because the effect of using matching indices is lessened if we do not purchase the feedstock and sell the finished product in the same period, or if the index used for purchasing the raw materials is tied to a different period than the index in the sales contract. Please see “Supplier Purchase Agreements” in Item 1 of this Annual Report on Form 10-K. Contract turnover, changes in feedstock and product mix and other factors also can impact our material margin percentage.
Operating expenses
Total operating expenses incurred in fiscal 2009 were $132.3 million, which was slightly higher than the $131.2 million incurred in fiscal 2008. The overall $1.1 million increase in operating expenses consisted of higher expenses at our Houston and Baytown facilities of $1.9 million and $0.5 million, respectively, and higher sales overhead expenses of $0.6 million, partially offset by lower expenses at our Port Neches facility of $1.9 million The increase in Houston plant operating expenses reflected hurricane repair costs of $2.6 million, higher transportation and storage costs of $1.2 million and higher property taxes and insurance of $1.1 million, partially offset by lower maintenance and environmental expenses of $2.4 million and cost reductions in various other areas. The primary components of the decrease in Port Neches plant operating expenses were lower maintenance and environmental costs of $1.7 million and lower transportation and storage costs of $1.4 million, partially offset by hurricane repair costs of $1.7 million. The higher Baytown plant operating expenses reflected higher personnel and maintenance expenses. Our fiscal 2009 operating expenses, excluding $4.3 million for hurricane repairs, reflect the positive impact of actions taken by management during the year to control spending and align our level of operations with demand for our products in response to the challenging economic environment.
33
Table of Contents
Index to Financial Statements
General and administrative expenses
General and administrative expenses decreased $3.9 million from $36.7 million in fiscal 2008 to $32.8 million in fiscal 2009. The primary components of the decrease were $3.2 million of lower expense related to our stock-based compensation plan, the absence of certain legal and consulting costs incurred in the prior year of $2.3 million, lower recruiting fees of $0.7 million and lower Sarbanes-Oxley compliance costs of $0.4 million, partially offset by higher outside legal fees of $2.5 million and legal and professional fees of $0.9 million related primarily to our SEC registration process. The lower expense associated with our stock-based compensation plan relates to lower costs incurred by us to pay the individual tax liability of our previous directors and certain of our management-level employees related to the vesting of their restricted stock. The amount we paid was based on their individual tax liability related to the value of the stock that vested on July 1, 2008, which was substantially lower than the value on July 1, 2007.
Depreciation and amortization expense
Depreciation and amortization expense was $41.9 million in fiscal 2009 and $35.9 million in fiscal 2008. The higher fiscal 2009 expense reflected incremental depreciation of our Baytown plant and isobutylene processing unit, which began operations during the first half of fiscal 2008, and our polyisobutylene plant that started up at the end of the first quarter of fiscal 2009.
Asset Impairment
In the fourth quarter of fiscal 2009 we recorded an asset impairment charge to write down the carrying value of our dehydrogenation assets. In conjunction with completion of a capital project in October 2007, which allowed us to externally source isobutylene feedstock at our Houston facility, we idled our dehydrogenation units that were previously used to produce isobutylene. The carrying value of the dehydrogenation units was not previously considered to be impaired because there were a number of realistic and probable alternative uses for these assets by which the carrying value would have been recovered. However, in the fourth quarter of fiscal 2009, we determined that the likelihood of investing additional capital in the foreseeable future necessary to recover the carrying value of these specific assets had been substantially reduced. Based on this determination and the fact that the assets had been idled for almost two years, we concluded that recovery of the carrying cost was not likely and recorded a charge of $6.0 million to recognize the impairment of these assets.
Loss on sale of assets
The $1.1 million loss on sale of assets in fiscal 2008 consists of a loss realized upon the sale of catalyst material from the dehydrogenation units at our Houston facility. The gross proceeds from the sale were $1.5 million and are reflected as cash from investing activities in the consolidated statements of cash flows.
Business interruption insurance recoveries
In the fourth quarter of fiscal 2009, we received a partial recovery of $10.0 million on our business interruption insurance claim related to Hurricane Ike in September 2008 (shown as a separate line item on the fiscal 2009 Consolidated Statement of Operations). We received an additional $17.1 million (net of recovery expenses of $0.4 million) in the second quarter of fiscal 2010 as a final settlement of the claim.
Unauthorized freight (recoveries) payments
In July 2007, we discovered that a former employee, with the assistance of a non-employee conspirator, had directed unauthorized payments from our accounts to a fictitious vendor in various amounts in fiscal 2008 and prior years, including $0.5 million in fiscal 2008, respectively. In August 2008, the former employee and his non-employee conspirator were convicted of certain crimes related to the unauthorized freight payments. As part of their convictions, the former employee and his non-employee conspirator were required to forfeit assets to the Office of the U.S. Attorney for restitution. These assets were liquidated by the U.S. government and in April 2009 we received $4.7 million as restitution of losses represented by the unauthorized freight payments.
Interest expense
Interest expense in fiscal 2009 was $16.8 million, a decrease of $2.2 million compared to $19.0 million in the previous fiscal year. The lower fiscal 2009 expense reflected the impact of lower interest rates, partially offset by higher average monthly borrowings on the Revolving Credit Facility of $7.5 million and lower capitalized interest in fiscal 2009 of $1.5 million.
34
Table of Contents
Index to Financial Statements
Unrealized loss (gain) on derivatives
Unrealized loss on derivatives was $3.7 million in fiscal 2009 compared to an unrealized gain in fiscal 2008 of $0.1 million. The unrealized gain in fiscal 2008 reflected the change in fair value of an interest rate cap entered into in October 2006 to provide protection on $120.0 million of our long-term debt over a three year period ending October 31, 2009 if LIBOR exceeded 6.0%. The unrealized loss in fiscal 2009 reflected the change in fair value of the interest rate cap and an interest rate swap entered into on June 30, 2008, which expired on June 30, 2010.
Other, net
Other, net in both fiscal 2009 and fiscal 2008 consisted primarily of income from our investment in Hollywood/Texas Petrochemicals LP, which is accounted for under the equity method. We and Kirby Inland Marine, Inc. formed this joint venture to operate four barges capable of transporting chemicals.
Income tax expense
Our effective income tax rate for fiscal 2009 was 33.8%, compared to 35.4% for fiscal 2008. The effective rate for fiscal 2009 reflects federal tax provision at 35% offset by state of Texas and Delaware franchise taxes. The effective rate for fiscal 2008 reflects federal tax provision at 35% and state of Texas and Delaware franchise taxes.
Net income
Fiscal 2009 net loss was $22.8 million, compared to net income of $26.6 million for fiscal 2008. The primary components of the $49.4 million decrease were the negative impact of lower revenues of $639.3 million, higher depreciation and amortization of $6.0 million and the impairment charge of $6.0 million, partially offset by lower cost of sales of $558.0 million, the business interruption insurance recovery of $10.0 million, the unauthorized freight recovery of $4.7 million, lower general and administrative expenses of $3.9 million and lower income tax expense of $26.3 million.
Adjusted EBITDA
Total Adjusted EBITDA in fiscal 2009 was down $63.2 million, or 61%, to $40.3 million versus $103.5 million in fiscal 2008. The overall decline reflected significant declines in both the C4 Processing and Performance Products segments as well as the absence of MTBE produced by our dehydrogenation units, which generated Adjusted EBITDA of $6.2 million in fiscal 2008. The substantial declines for both operating segments reflected the combined negative impact on fiscal 2009 of Hurricane Ike and the global economic crisis discussed above. The declines for the two operating segments were partially offset by lower Corporate and other expenses.
C4 Processing Adjusted EBITDA declined from $82.6 million in fiscal 2008 to $37.4 million in fiscal 2009, a decrease of $45.2 million, or 55%. The primary drivers of the decline were substantially lower margin between sales and cost of sales of $55.9 million and higher operating expenses of $4.5 million, which were partially offset by the first installment of our business interruption insurance claim of $10.0 million and the recovery of unauthorized freight payments of $4.7 million.
Adjusted EBITDA for the Performance Products segment was $27.7 million in fiscal 2009, compared to $43.5 million in fiscal 2008. The decrease of $15.7 million, or 36%, primarily reflected lower margin between sales and cost of sales of $18.5 million, partially offset by lower operating expenses of $2.7 million.
Corporate and other expenses in fiscal 2009 were down $3.9 million compared to fiscal 2008. Corporate and other expenses consist of general and administrative expenses, excluding non-cash stock compensation, which is excluded from Adjusted EBITDA, and other, net discussed above.
Liquidity and Capital Resources
Our financing agreements consist principally of a term loan facility in the original principal amount of $280 million (the “Term Loan”), a $175 million revolving credit facility (the “Revolving Credit Facility”) and insurance premium financing.
35
Table of Contents
Index to Financial Statements
Sources and uses of cash
Our primary source of liquidity is cash flow generated from our operating activities and borrowing capacity under our Revolving Credit Facility. Our primary liquidity requirements are working capital, capital expenditures, contractual obligations and debt service. We expect to have adequate liquidity to fund our liquidity requirements over the foreseeable future from cash flows generated from operating activities and available borrowing capacity under our Revolving Credit Facility. This expectation is based, however, on estimates and assumptions regarding, among other things, our sales volumes, our feedstock purchase volumes, market prices for petrochemicals, capital and credit market conditions, and general industry and economic conditions. If one or more of these factors materially differs from our estimates, we may need to obtain additional financing to conduct our operations, which may not be available on acceptable terms or at all.
In November 2009, we received $17.1 million (net of recovery expenses of $0.4 million) as the second and final installment of our claim under our business interruption insurance policy related to damages incurred from Hurricane Ike in September 2008 (see further discussion under Recent Developments above).
In February 2010, we received a $39.8 million refund of federal income taxes paid for fiscal 2004 through fiscal 2006 through the carry-back of a substantial portion of our fiscal 2009 net operating loss (see further discussion under Recent Developments above).
At June 30, 2010, we had total debt of $269.5 million, availability under our Revolving Credit Facility of $125.0 million, and cash reserves of $114.6 million. Debt outstanding consisted entirely of the amount due under our Term Loan, including current maturities of $19.0 million. As of June 30, 2010, we were in compliance with all the covenants set forth in the Term Loan and the Revolving Credit Facility.
The Term Loan requires annual prepayments equal to a specified percentage, which varies depending upon our calculated Leverage Ratio, of excess cash flow. For excess cash flow generated in fiscal 2010, we will make a $16.4 million principal payment on the Term Loan in October 2010. For fiscal 2009, we made a payment of $0.4 million in October 2009. No such prepayment was required for fiscal 2008. The excess cash flow payments to be made in October 2010 and made in October 2009 were included in current maturities at June 30, 2010 and 2009, respectively.
Our Revolving Credit Facility matures on the earlier of April 29, 2014, or if more than $25 million remains outstanding under the Term Loan, March 29, 2013. Availability under the Revolving Credit Facility is limited to the borrowing base, comprised of 85% of eligible accounts receivable and 65% of eligible inventory, as redetermined monthly. Up to $30 million of the facility may be used for the issuance of letters of credit. The Revolving Credit Facility also includes an accordion feature under which the lenders may agree, upon our request, to increase their commitments to an aggregate amount not to exceed $200 million.
Amounts borrowed under the Revolving Credit Facility bear interest, at our option, at a rate equal to either (a) the Eurodollar Rate (as defined in the credit agreement) plus 3.00% to 3.75%, or (b) the base rate (as described below) plus 2.00% to 2.75%, in each case depending on the ratio of our consolidated debt to consolidated EBITDA (as defined in the credit agreement), with a lower leverage ratio resulting in lower rates. The base rate equals the highest of (i) the administrative agent’s prime lending rate, (ii) the Federal Funds Rate plus 1/2 of 1%, or (iii) the one-month Eurodollar Rate (as defined in the credit agreement) plus 1%.
A commitment fee is payable on the unused portion of the Revolving Credit Facility in an amount equal to 0.50% per annum if average availability is less than 50% of the total commitments, or 0.75% per annum if average availability is 50% or more of the total commitments, in each case based on average availability during the previous fiscal quarter.
The Revolving Credit Facility is secured with a first priority lien on cash, accounts receivable, inventory and certain intangibles, and through cross-collateralization with the Term Loan, a second priority lien on all other assets, including fixed assets. The Revolving Credit Facility is guaranteed by all of our material domestic subsidiaries and provides for customary events of default.
The Revolving Credit Facility includes covenants that restrict, subject to specified exceptions, our ability to:
| • | create or permit liens on our assets; |
| • | incur additional indebtedness or issue redeemable equity securities; |
| • | guarantee indebtedness; |
| • | merge or consolidate with a third party; |
36
Table of Contents
Index to Financial Statements
| • | sell or otherwise dispose of assets; |
| • | pay dividends or effect stock buy-backs; |
| • | issue or sell stock of subsidiaries; |
| • | make loans, investments and acquisitions; |
| • | enter into transactions with affiliates; |
| • | change the lines of business in which we are engaged; |
| • | change our fiscal year; |
| • | make voluntary prepayments or redemptions of subordinated indebtedness; |
| • | enter into agreements that limit our subsidiaries’ ability to pay distributions to or enter into transactions with us; |
| • | maintain cash balances in excess of $15 million without using such excess cash to prepay loans under the Revolving Credit Facility; and |
| • | enter into receivables financings or securitization programs. |
Although the Revolving Credit Facility restricts acquisitions, investments and the payment of dividends, respectively, acquisitions, investments and dividends are permitted, subject to restrictions under the existing Term Loan agreement, if (a) pro forma current and average 90-day historical availability each exceed the greater of $50 million or 50% of the total commitments, or (b) pro forma projected, current and average 90-day historical availability each exceed the greater of $25 million or 25% of the total commitments and we meet a minimum consolidated fixed charge coverage ratio. Finally, the Revolving Credit Agreement includes a covenant requiring a minimum consolidated fixed charge coverage ratio should availability be less than the greater of $15 million or 15% of the total commitments.
In 2010, as in previous years, we financed our property and casualty insurance premiums through Flatiron Capital Corporation. The premiums were typically financed in July of each year for that particular fiscal year and the debt is amortized over 10-month periods; consequently, there was no liability on the balance sheet at June 30, 2010 and 2009. The amounts financed for fiscal 2010 and 2009 were $7.7 million and $5.9 million, respectively.
The following table summarizes our changes in cash and cash equivalents for the three most recent fiscal years (in thousands):
| Year Ended June 30, | ||||||||||||
| 2010 | 2009 | 2008 | ||||||||||
| Statement of cash flow data: |
||||||||||||
| Cash flows provided by (used in): |
||||||||||||
| Operating activities |
$ | 126,818 | $ | 50,197 | $ | 57,826 | ||||||
| Investing activities |
(14,400 | ) | (16,128 | ) | (156,313 | ) | ||||||
| Financing activities |
(4,364 | ) | (28,096 | ) | 89,568 | |||||||
| Increase (decrease) in cash and cash equivalents |
$ | 108,054 | $ | 5,973 | $ | (8,919 | ) | |||||
Operating activities
In fiscal 2010, we generated positive net cash flows from operations of $126.8 million. The primary components of our operating cash flows were net income of $30.5 million (which included the net business interruption insurance recovery of $17.1 million) plus depreciation and other net non-cash expenses of $62.4 million and the federal income tax refund of $39.8 million, partially offset by plant turnaround costs of $5.3 million, which are deferred and amortized. Although the steady increase in cost of our raw materials and selling prices for our products required significantly higher net investment in working capital in fiscal 2010 compared to fiscal 2009, the net investment in accounts receivable, inventory and payables at June 30, 2010 was essentially equivalent to the net investment at June 30, 2009 as a result of timing of collections at the end of fiscal 2010 (see discussion of accounts receivable below). The federal tax refund represented the recovery of prior year taxes paid as a result of the carry-back of the fiscal 2009 net operating loss (see further discussion under Recent Developments above). The deferred turnaround costs related primarily to a major turnaround project completed at the Houston facility in the third quarter of fiscal 2010. Interest paid in fiscal 2010 was $17.3 million, and net federal and state tax refunds were $38.1 million.
37
Table of Contents
Index to Financial Statements
Accounts receivable were $116.4 million at June 30, 2010, compared to $98.5 million at June 30, 2009. Days of sales outstanding at June 30, 2010 were 19 days, compared to 29 days at June 30, 2009, and our average over the 2010 fiscal year of approximately 30 days, as a result collection efforts toward the end of the fiscal year.
Our inventory at June 30, 2010 of $94.6 million was $57.7 million higher than the $36.9 million at June 30, 2009. The increase in inventory value reflected the combined effect of significantly higher physical inventory volumes and higher overall average cost per pound. Overall pounds in inventory and overall average cost per pound at June 30, 2010 were up approximately 55% and 66%, respectively, compared to June 30, 2009. The impacts of the higher volume and higher average cost were $20 million and $38 million, respectively.
Fiscal 2009 operating activities provided $50.2 million of positive net cash flows. The primary components of net cash flows from operations were a net loss of $22.8 million plus $58.7 million in depreciation and other net non-cash expenses, cash generated from reduced investment in working capital of $21.9 million, and cash outflows of $6.6 million for deferred turnaround costs. The reduced investment in working capital reflected a substantial reduction in the level of business activity at June 30, 2009 compared to June 30, 2008, as well as the impact on customer receivables and inventory carrying value of significantly lower selling prices and raw material costs, respectively. Deferred turnaround costs consisted primarily of two major turnaround projects completed at the Houston facility in the first and third quarters of fiscal 2009. Interest paid in fiscal 2009 was $16.7 million, and net federal and state tax refunds were $5.2 million. As a result of a fiscal 2008 net operating loss of $11.2 million, in fiscal 2009 we received a refund of fiscal 2008 estimated payments of $2.2 million and a refund of taxes paid in fiscal 2006 of $3.9 million through carry-back of the fiscal 2008 net operating loss.
Fiscal 2008 operating activities provided $57.8 million of positive net cash flows. The net cash flows primarily reflected positive cash flows from net income of $26.6 million, plus depreciation and other net non-cash expenses of $58.3 million, and negative cash flows of $15.3 million from increased investment in working capital and $10.6 million from deferred turnaround costs during the year. The increased investment in working capital reflected higher raw material costs and incremental raw materials and finished products inventories for our new Baytown plant, which started up in the first quarter of fiscal 2008. Interest paid in fiscal 2008 was $19.3 million, and net federal and state tax payments were $4.5 million. The net tax payments of $4.5 million reflected fiscal 2008 estimated federal payments and state payments of $5.6 million, partially offset by a refund of fiscal 2006 tax payments of $1.1 million from carry-back of a fiscal 2007 net operating loss of $3.2 million.
Investing activities
During fiscal 2010 and 2009, we invested $14.4 million and $16.1 million, respectively, in the form of capital expenditures. The low level of capital expenditures in both years reflected completion of our major capital investment initiatives in the first quarter of fiscal 2009 and the return to our baseline capital requirements within our disciplined approach to spending.
Fiscal 2008 investing activities consisted of outflows for capital expenditures of $87.8 million and business acquisition costs of $70.0 million, and inflows of $1.5 million from the sale of an asset. The most significant components of our capital expenditures were for the Baytown plant, the isobutylene processing unit and the polyisobutylene plant. The $70.0 million business acquisition outflow was the final payment to Huntsman for the Port Neches acquisition which had been held back to be paid upon successful start up of the light olefins unit in Port Arthur. The proceeds on sale of asset were from the sale of catalyst material related to the idled dehydrogenation units at our Houston facility.
Financing activities
During fiscal 2010, we had net outflows from financing activities of $4.4 million, consisting primarily of principal repayments on our Term Loan of $3.1 million and debt issuance costs of $4.6 million, partially offset by cash receipts from exercises of stock options of $3.0 million.
Fiscal 2009 net cash flows used for financing activities were $28.1 million. The primary components of the net outflow were net repayments on our Revolving Credit Facility of $21.8 million, repayments of Term Loan principal of $2.7 million and repurchases of shares for $3.0 million.
Fiscal 2008 net cash flows provided by financing activities were $89.6 million. The primary inflows were the Term Loan financing of the $70.0 million payment made to Huntsman in November 2007 and $21.8 million of net borrowings on our Revolving Credit Facility, while the primary outflows were repayment of Term Loan principal of $2.6 million and repurchases of shares for $0.3 million.
38
Table of Contents
Index to Financial Statements
Interest rate cap and interest rate swap
In accordance with the requirement of our Term Loan, we entered into an interest rate cap agreement in October 2006. The interest rate cap provided protection on $120.0 million of our long-term debt, if LIBOR exceeded 6.0%, over a three-year period which ended on October 31, 2009.
In June 2008, we entered into a two-year interest rate swap, whereby we effectively fixed the interest rate on $135.0 million of our Term Loan debt at 3.406% plus a spread of 2.5% (total fixed rate of 5.906%). The interest rate swap expired on June 30, 2010.
Contractual Obligations
The following table presents our contractual cash obligations at June 30, 2010 (in thousands):
| Payments Due By Fiscal Year | ||||||||||||||||||
| Total | Transition 2010 |
2011 | 2012 - 2013 | 2014 - 2015 | After 2015 | |||||||||||||
| Long-term debt |
$ | 269,470 | $ | 17,412 | $ | 2,511 | $ | 249,547 | $ | — | $ | — | ||||||
| Interest on long-term debt [1] |
22,030 | 3,955 | 7,312 | 10,763 | — | — | ||||||||||||
| Operating leases |
35,578 | 8,998 | 14,047 | 11,170 | 866 | 497 | ||||||||||||
| $ | 327,078 | $ | 30,365 | $ | 23,870 | $ | 271,480 | $ | 866 | $ | 497 | |||||||
| [1] | Interest payments on long-term debt reflect variable rates in effect at June 30, 2010. |
The above table does not include our long-term crude C4 feedstock purchase contracts, as those commitments generally cannot be estimated on a forward-looking basis because: (1) the amount we are obligated to purchase under these contracts is a percentage of volume of crude C4 produced by a particular supplier, which varies depending on the production methods utilized and the aggregate volume produced by the supplier; and (2) the price for this variable volume is based on certain commodity price indices which vary over time. Please see “Our efforts to obtain suitable quantities or qualities of raw material feedstock may not be successful, in which case our financial condition, results of operations and cash flows plans may be adversely affected” and “Volatility in the petrochemicals industry may result in reduced operating margins or operating losses” under Item 1A-Risk Factors above for more information on the variable nature of feedstock volumes and pricing. Our commitments under our long-term crude C4 feedstock purchase contracts are not subject to a specified maximum volume or cap, though as a practical matter the commitments are limited by the production capacity of the supplier. During fiscal year 2010, we obtained 89% of our crude C4 feedstocks under these long-term feedstock purchase contracts (excluding spot purchases and contracts with terms of less than one year), for aggregate expenditures of $891.5 million.
Off-Balance-Sheet Arrangements
We do not currently utilize any off-balance-sheet arrangements to enhance our liquidity and capital resource positions, or for any other purpose.
Critical Accounting Policies and Estimates
In preparing our financial statements in conformity with accounting principles generally accepted in the United States of America, we make certain estimates and assumptions about future events that could significantly affect the amounts of reported assets, liabilities, revenues and expenses, as well as the disclosure of contingent assets and liabilities in the financial statements and accompanying notes. Some of our accounting policies require the application of significant judgment by management to select the appropriate assumptions to determine these estimates. By their nature, these judgments are subject to an inherent degree of uncertainty; therefore, actual results may differ significantly from estimated results. We base our judgments on our historical experience, knowledge of the business and industry, advice from experts and consultants, business forecasts and other available information, as appropriate. Our significant accounting policies are more fully described in Note C to our Consolidated Financial Statements in Item 8 of this Annual Report on Form 10-K.
39
Table of Contents
Index to Financial Statements
Our most critical accounting policies, which reflect significant management estimates and judgment to determine amounts reported in our Consolidated Financial Statements, are as follows:
Inventory cost
Our inventories consist of raw materials and finished products and are valued at the lower of average cost or market. Costs include raw materials, labor and applicable manufacturing overhead. Our inventory levels can vary significantly depending on availability of raw materials, especially crude C4, plant operations, customer demand and seasonality. In addition to potential fluctuations in the amounts of physical inventories we carry, we can be exposed to potential devaluations in net realizable value of our inventories, especially our fuel-related products, during periods of rapidly declining unleaded regular gasoline prices and demand for fuel-additive products. A significant amount of judgment is required to determine the appropriate normal range of plant production activity and plant operating expenses regarding plant overhead cost absorption and to determine the appropriate market valuation of inventories to assess recoverability of the carrying cost of our inventory. Use of different estimates and assumptions to determine the appropriate amounts of overhead absorption and market value for inventory valuation purposes, when such market is below cost, could have a significant impact on our financial condition and results of operations from period to period.
The average cost of our inventory at the end of any period reflects the carrying cost of raw materials and finished goods inventory on hand at the beginning of the period and the actual cost of raw material purchases and finished goods production during the period. The actual costs of most of our raw materials are based on contractual arrangements which, in various ways, link the purchase costs to a commodity price index. Downward movement in commodity price indices between the times raw materials are purchased and the related finished products are sold can result in reductions in realizable value of the inventory prior to being sold. Such reductions in realizable value can occur despite the index-based pricing in our contracts, because the effect of using matching indices is lessened when we do not purchase the feedstock and sell the finished product in the same period. If it is determined at the balance sheet date that the carrying value of the inventory will not be recovered based on management’s best estimates and assumptions regarding inventory turnover rates and future selling prices, the carrying value of the inventory is written down to net realizable value through lower-of-cost-or-market adjustments.
Based on our assessment of recoverability of the carrying cost of inventory at each balance sheet date, at the end of both the first and second quarters of fiscal 2009 and the end of first quarter of fiscal 2010 we concluded that the carrying value of certain of our product line inventories would not likely be recovered. Consequently, we recorded lower-of-cost-or-market adjustments at September 30, 2008, December 31, 2008 and September 30, 2009 to reflect losses in net realizable value of such inventory in the amounts of $9.4 million, $11.6 million and $1.2 million, respectively. The assumptions used to determine the amounts of the lower-of-cost-or-market adjustments recorded considered relevant factors, including projected movement in commodity price indices, projected selling prices, customer demand and seasonality. The lower-of-cost-or-market adjustment at September 30, 2008 consisted primarily of losses in value of our fuel-related products; the adjustment at December 31, 2008 consisted primarily of losses in value of butadiene; and the adjustment at September 30, 2009 consisted of losses in value of fuel-related products. A 10% increase or decrease in selling prices for raffinates and MTBE (fuel-related products) at September 30, 2008 would have reduced or increased the lower-of-cost-or-market adjustment by $3.0 million. A 10% increase or decrease in selling prices for butadiene and MTBE at December 31, 2008 would have reduced or increased the lower-of-cost-or-market adjustment by $1.4 million. At September 30, 2009, a 10% increase in selling prices for fuel related products would have eliminated the lower-or-cost-or-market adjustment and a 10% decrease would have increased the lower-of-cost-or-market adjustment by $1.7 million. At June 30, 2010, we concluded that the carrying cost of our inventory was fully recoverable and no lower-of-cost-or-market adjustment was considered necessary.
Property, plant and equipment
Property, plant and equipment are reported at historical costs, less accumulated depreciation. Depreciation is computed using the straight-line method over the estimated useful lives of the assets. Maintenance and repairs and minor renewals are charged to expense as incurred while major improvements, renewals and betterments are capitalized. Interest is capitalized on long-term construction projects using our internal cost of debt rate. A significant amount of judgment is required in various circumstances to determine the appropriate recognition of costs as capital expenditures or expenses, estimated useful lives of property, plant and equipment, and when and by how much carrying amounts may be impaired (see Impairment below). Use of different estimates and assumptions to determine capital versus expense treatment of costs, useful lives of assets and impairment of long-lived assets could have a significant impact on our financial condition and results of operations from period to period.
40
Table of Contents
Index to Financial Statements
Intangible Assets
Our intangible assets include patents and technology licenses. Patents are amortized using the straight-line method over useful lives. Our technology licenses have no legal, regulatory, contractual, competitive, economic, or other factors that would limit their useful lives. Consequently, we have determined their useful lives to be indefinite. The technology licenses, which have an aggregate book value of $5.5 million as of June 30, 2010, are assessed annually during the fourth quarter of each fiscal year for impairment (see Impairment below).
Impairment
We follow Statement of Financial Accounting Standards Board’s Accounting Standards Codification (“FASB ASC”, “Codification”) 350, Intangibles—Goodwill and Other, regarding impairment of our indefinite life intangible assets (licensing agreements) and FASB ASC 360-10-35, Plant, Property and Equipment – Overall – Impairment or Disposal of Long-Lived Assets, regarding impairment of our other long-lived assets (property, plant and equipment and patents). An impairment loss is recognized only if the carrying value of a long-lived asset or asset group is not recoverable and is measured as the excess of its carrying value over its fair value. The carrying amount of a long-lived asset or asset group is considered not recoverable if it exceeds the sum of the undiscounted cash flows expected to result from the use of the long-lived asset or asset group. Because our technology licenses are fundamental to and inseparable from their respective long-lived manufacturing assets, we assess impairment of the technology licenses together with the respective long-lived assets based on the undiscounted future cash flows related to the respective manufacturing processes.
Our policy is to assess both our indefinite life intangible assets and our long-lived assets for impairment annually in the fourth quarter of each year or more frequently if events or changes in circumstances indicate that the carrying amount of these assets may not be recoverable. During fiscal 2009, we considered the impact of the downturn in the economy and the decrease in demand and pricing for our products as a temporary condition that did not have a significant negative impact on our estimated long-term cash flows. Consequently, we did not perform impairment testing on our long-lived assets prior to the fourth quarter of fiscal 2009. Although our fiscal 2009 impairment test did not indicate any impairment of our indefinite life intangible assets or long-lived asset groups, based on circumstances specific to an idled manufacturing unit, in the fourth quarter of fiscal 2009 we recognized an impairment with respect to that unit in the amount of $6.0 million. Our impairment test completed in the fourth quarter of fiscal 2010 did not indicate any impairment of our indefinite life intangible assets or long-lived asset groups.
Plant turnaround costs
We use the deferral method to account for costs of major scheduled plant turnarounds. Plant turnarounds are the scheduled and required partial or complete shutdowns of chemical processing units for significant overhaul and refurbishment, for periods typically lasting from two to four weeks. Under the deferral method, we defer the cost of a turnaround project and amortize the cost as part of our operating expenses over the period between the completion of the turnaround and the next scheduled turnaround, which typically occurs from 18 months to four years after the most recently completed turnaround. If the next scheduled turnaround occurs sooner than originally anticipated, any remaining deferred cost from the previous turnaround is charged to expense at that time. If the next scheduled turnaround occurs later than originally anticipated, the amortization period for the previous turnaround cost is not extended. The deferral method of accounting for turnaround costs requires judgment as to the specific costs to be included in a major turnaround project and requires estimates and assumptions regarding the period of time over which the costs will be amortized. Use of different estimates and assumptions could have a significant impact on our financial condition and results of operations from period to period.
Income tax assets and liabilities
We account for income taxes in accordance with FASB ASC 740, Income Taxes. Determination of tax related assets and liabilities to be recorded and the appropriate recognition of tax positions taken on tax returns requires a significant amount of judgment. Regarding realization of our deferred tax assets and the need for a valuation allowance against deferred tax assets at each balance sheet date, we consider both positive and negative evidence of sufficient taxable income within the carry-back and/or carry-forward periods as provided under applicable tax law. Based on our significant net deferred tax liability position and future reversals of such existing taxable temporary differences, as well as our historical operating results, we have concluded that no valuation allowance should be recorded. Regarding assessment of taxable income exclusive of reversing temporary differences and carry-forwards, we consider both our recent historical operating results, as well as our expectations of future operating results; however, historical results are given more weight than our expectations of future profitability, which is inherently uncertain.
41
Table of Contents
Index to Financial Statements
Revenue recognition
We recognize revenue from sales of products in the period when title and risk of loss transfer to the customer. Under certain contractual arrangements with a small number of customers, primarily related to butadiene, we invoice the customer prior to when title and risk of loss transfer to the customer. When these invoices are issued to the customer, typically at month-end, we record a customer receivable with an offsetting credit to deferred revenue. The customer will settle the liability based on credit terms independent of when the product actually ships. Deferred revenue is subsequently recognized as revenue at the time title and risk of loss transfer to the customer. The time lag between invoicing and shipping product for these deferred revenue transactions depends on when the customer has nominated delivery, which is normally the following month and seldom extends beyond two months. Product to be delivered under these deferred revenue arrangements remains in inventory until title and risk of loss transfer to the customer. The balance of deferred revenue can fluctuate significantly from period to period depending on the volume and pricing of the inventory and the timing of the customer’s needs.
Derivatives and Hedging
We account for derivative instruments in accordance with FASB ASC 815, Derivatives and Hedging (“FASB ASC 815”). Such instruments are measured at fair value and recognized as assets or liabilities in the Consolidated Balance Sheets. Accounting for changes in the fair value of a derivative depends on the intended use of the derivative and the resulting designation established at the inception of the derivative. For derivatives that are designated as fair value hedges, changes in fair value are recognized currently though earnings with an offsetting, partial mark-to-fair-value of the hedged item. For derivatives designated as cash flow hedges and meeting the effectiveness guidelines of FASB ASC 815, changes in fair value, to the extent effective, are recognized as other comprehensive income or loss until the hedged item is recognized in earnings. Hedge effectiveness is measured at least quarterly based on the relative changes in fair value between the derivative contract and the hedged item over time, or in the case of options, based on the change in intrinsic value. Any change in fair value of a derivative resulting from ineffectiveness or an excluded component of the gain or loss, such as time value for option contracts, is recognized immediately in earnings. For any derivative instrument not designated as a hedge at inception, changes in fair value of the instrument are recognized in earnings in the period in which the change occurs.
Contingent Liabilities
We record reserves for contingent liabilities when information available indicates that a loss is probable and the amount of the loss is reasonably estimable. Management’s judgment may prove materially inaccurate, and such judgment may be subject to the uncertainty of dispute resolution or litigation. Contractual arrangements with our customers and suppliers are typically complicated and can include, for example, complex index-based pricing formulas that determine the price for our feedstocks or finished products. Due to the complicated nature of our contractual arrangements, we can, from time to time, be involved in disputes with our customers and suppliers regarding the interpretation of these contracts, including the index-based pricing formulas. These disputes occur in the normal course of our business, seldom result in actual formal litigation and are typically resolved in the context of the broader commercial relationship that we have with the customer or supplier. Regarding any such disputes, we record reserves for contingent liabilities when information available indicates that a loss is probable and the amount of the loss is reasonably estimable.
Recently Adopted Accounting Pronouncements
In February 2010, the Financial Accounting Standards Board (“FASB”) issued Accounting Standards Update (ASU) No. 2010-09, Subsequent Events (Topic 855); Amendments to Certain Recognition and Disclosure Requirements, effective upon issuance, which removed the requirement for an SEC filer to disclose the date through which subsequent events have been evaluated in both issued and revised financial statements.
In June 2009, the FASB issued the Accounting Standards Codification (“FASB ASC”) as the sole source of authoritative U.S. generally accepted accounting principles (GAAP) recognized by the FASB to be applied by nongovernmental entities in the preparation of financial statements, effective for interim and annual periods ending after September 15, 2009. FASB ASC does not change GAAP, but changes the way accounting principles are referenced in financial statements and notes to financial statements. As required, we adopted FASB ASC in the first quarter of fiscal 2010 and, other than accounting principle resource referencing, FASB ASC had no impact on our financial statements at June 30, 2010.
In December 2007, the FASB issued changes in accounting requirements for business combinations that are contained in FASB ASC 805, Business Combinations (“FASB ASC 805”). The requirements retain the purchase method of accounting for acquisitions, but require a number of changes, including changes in the way assets and liabilities are recognized in purchase accounting. It also changes the recognition of assets acquired and liabilities assumed arising from contingencies, requires the capitalization of in-process research and development at fair value, and requires the expensing of acquisition-related costs as
42
Table of Contents
Index to Financial Statements
incurred. The above provisions for changes in accounting requirements prescribed by FASB ASC 805, effective for the Company beginning July 1, 2009, were adopted in the first quarter of fiscal 2010 with no impact on our financial statements as of and for the periods ended June 30, 2010.
FASB ASC 820, Fair Value Measurements and Disclosures (“FASB ASC 820”) includes guidance which establishes a standard definition of fair value, and a framework under generally accepted accounting principles to measure fair value and expands disclosure requirements for fair value measurements. On July 1, 2008, we adopted the provisions of FASB ASC 820 for assets and liabilities measured or disclosed at fair value on a recurring basis. The provisions of FASB ASC 820 were adopted for nonfinancial assets and liabilities measured on a non-recurring basis on July 1, 2009 and had no impact on our financial statements as of and for the periods ended June 30, 2010, as we currently have no nonfinancial assets and liabilities measured on a non-recurring basis at fair value.
In June 2008, the FASB issued revisions to FASB ASC 260, Earnings Per Share (“FASB ASC 260”) which prescribe guidelines on determining whether instruments granted in share-based payment transactions are participating securities prior to vesting and, therefore, need to be included in the earnings allocation in computing earnings per share. Further, the revisions clarify that unvested share-based payment awards that contain non-forfeitable rights to dividends or dividend equivalents (whether paid or unpaid) are participating securities and shall be included in the computation of earnings per share pursuant to the two class method. As required, we adopted these revisions to FASB ASC 260 effective July 1, 2009.
| ITEM 7A. | QUANTITATIVE AND QUALITATIVE DISCLOSURES ABOUT MARKET RISK |
Term Loan and Revolving Credit Facility
Borrowings under each of our Term Loan and Revolving Credit Facility are subject to floating interest rates. These floating interest rates subject us to the risk of increased interest costs associated with any upward movements in interest rates. Under both our Term Loan and our Revolving Credit Facility, our interest rate is a prime lending rate plus a spread or a LIBOR-based rate plus a spread, whichever we select. At September 10, 2010, our total Term Loan and Revolving Credit Facility debt outstanding was $269.5 million and $0.0 million, respectively. At June 30, 2010, our total Term Loan and our Revolving Credit Facility debt outstanding was $269.5 million and $0.0 million, respectively
As required by our Term Loan, we entered into an interest rate cap agreement in October 2006. The interest rate cap provided protection on $120.0 million of our long term debt, if LIBOR exceeded 6.0%, over a three-year period, which ended October 31, 2009.
In June 2008, we entered into a two-year interest rate swap, whereby we effectively fixed the interest rate on $135.0 million of our Term Loan debt at 3.406% plus a spread of 2.5% (total fixed rate of 5.906%). The interest rate swap expired on June 30, 2010.
Commodity Swaps
During the first quarter of fiscal 2010, we entered into a series of commodity swaps to mitigate risk on our fuel-related products inventory. All of the commodity swaps matured by December 31, 2009, and the resulting aggregate net realized losses of $0.7 million are reflected in cost of sales in fiscal 2010. During the second quarter of fiscal 2009, we entered into a series of commodity swaps also to mitigate risk of loss on our fuel-related products inventory. The swaps matured at various dates through December 2008, resulting in aggregate net realized gains of $3.6 million, reflected in cost of sales, in fiscal 2009.
Interest Rate Risk
We are impacted by changes in the floating interest rates under our Term Loan and Revolving Credit Facility. Our interest rate under both facilities is a prime lending rate plus a spread or a LIBOR-based rate plus a spread, whichever we select. Although subsequent to June 30, 2010 we are not party to any financial instruments, prior to that time we elected to manage our exposure to interest rate movements by utilizing financial derivative instruments. In June 2008, we entered into a two-year, $135 million interest rate swap whereby we fixed the interest rate at 3.406% plus a 2.5% spread (total 5.906%) on that portion of the Term Loan outstanding debt. The interest rate swap expired on June 30, 2010. Additionally, under our Term Loan we were required to purchase interest rate protection on at least $120.0 million of the Term Loan for not less than three years. To satisfy this requirement, on October 18, 2006, we entered into an interest rate cap agreement for a one-time expense of approximately $0.3 million. The interest rate cap provided protection on $120.0 million of our long term debt, if LIBOR exceeded 6.0%, over a three-year period, which ended October 31, 2009.
43
Table of Contents
Index to Financial Statements
At June 30, 2010, we had $269.5 million of variable rate debt. A 1% increase in the average interest rate would increase future interest expense by $2.7 million per year.
Purchase and Sales Contract Risk
None of our contractual arrangements insulates us completely from the impact of volatility in commodity prices. This volatility generally benefits us as prices for our products rise and negatively impacts us as prices fall. Some products, such as raffinates, have seasonal variations in their sales that can result in slow inventory turnover during identifiable periods. Our strategy is to keep inventory at minimum levels required to service our customers whenever possible.
The economic crisis that developed throughout fiscal 2009 resulted in a significant decline in the prices for fuel-related products, including goods made by our customers using the products we manufacture and sell. The rapid decrease of such prices lowered the value of our product inventories below cost. As a result, we recorded lower-of-cost-or-market adjustments on our inventory in the aggregate amount of $21.0 million for the quarters ended September 30 and December 31, 2008 and $1.2 million for the quarter ended September 30, 2009. As a result of the increase in our average selling prices over the course of fiscal 2010, we did not record any lower-of-cost-or-market adjustments subsequent to September 30, 2009. However, it is possible that we could record similar adjustments in future periods, especially during times of declining prices.
44
Table of Contents
Index to Financial Statements
| ITEM 8. | FINANCIAL STATEMENTS AND SUPPLEMENTARY DATA |
Index to Consolidated Financial Statements
| Page | ||
| 46 | ||
| 47 | ||
| 48 | ||
| 49 | ||
| 50 | ||
| 51 | ||
45
Table of Contents
Index to Financial Statements
REPORT OF INDEPENDENT REGISTERED PUBLIC ACCOUNTING FIRM
Board of Directors and Shareholders
TPC Group Inc. and Subsidiaries:
We have audited the accompanying consolidated balance sheets of TPC Group Inc. and Subsidiaries (the “Company”) as of June 30, 2010 and 2009, and the related consolidated statements of operations, stockholders’ equity and cash flows for each of the three years in the period ended June 30, 2010. These consolidated financial statements are the responsibility of the Company’s management. Our responsibility is to express an opinion on these financial statements based on our audits.
We conducted our audits in accordance with the standards of the Public Company Accounting Oversight Board (United States). Those standards require that we plan and perform the audit to obtain reasonable assurance about whether the financial statements are free of material misstatement. The Company is not required to have, nor were we engaged to perform, an audit of its internal control over financial reporting. Our audit included consideration of internal control over financial reporting as a basis for designing audit procedures that are appropriate in the circumstances, but not for the purpose of expressing an opinion on the effectiveness of the Company’s internal control over financial reporting. Accordingly, we express no such opinion. An audit also includes examining, on a test basis, evidence supporting the amounts and disclosures in the financial statements, assessing the accounting principles used and significant estimates made by management, as well as evaluating the overall financial statement presentation. We believe that our audits provide a reasonable basis for our opinion.
In our opinion, the consolidated financial statements referred to above present fairly, in all material respects, the financial position of TPC Group Inc. and Subsidiaries as of June 30, 2010 and 2009 and the results of their operations and their cash flows for each of the three years in the period ended June 30, 2010 in conformity with accounting principles generally accepted in the United States of America.
| /s/ Grant Thornton LLP |
| Houston, Texas |
| September 17, 2010 |
46
Table of Contents
Index to Financial Statements
CONSOLIDATED BALANCE SHEETS
(In thousands, except share and per share amounts)
| June 30, | ||||||||
| 2010 | 2009 | |||||||
| ASSETS | ||||||||
| Current assets: |
||||||||
| Cash and cash equivalents |
$ | 114,642 | $ | 6,588 | ||||
| Accounts receivable |
116,407 | 98,515 | ||||||
| Inventories |
94,607 | 36,884 | ||||||
| Other current assets |
21,303 | 20,264 | ||||||
| Total current assets |
346,959 | 162,251 | ||||||
| Property, plant and equipment, net |
491,082 | 516,377 | ||||||
| Investment in limited partnership |
2,661 | 2,782 | ||||||
| Intangible assets, net |
5,974 | 6,018 | ||||||
| Other assets, net |
24,775 | 22,415 | ||||||
| Total assets |
$ | 871,451 | $ | 709,843 | ||||
| LIABILITIES AND STOCKHOLDERS’ EQUITY | ||||||||
| Current liabilities: |
||||||||
| Accounts payable |
$ | 156,348 | $ | 86,731 | ||||
| Accrued liabilities |
21,351 | 19,241 | ||||||
| Current portion of long-term debt |
19,049 | 2,715 | ||||||
| Total current liabilities |
196,748 | 108,687 | ||||||
| Long-term debt |
250,421 | 269,855 | ||||||
| Deferred income taxes |
111,432 | 52,090 | ||||||
| Total liabilities |
558,601 | 430,632 | ||||||
| Commitments and contingencies |
||||||||
| Stockholders’ equity: |
||||||||
| Common stock, $0.01 par value, 25,000,000 authorized and 18,433,043 and 17,863,030 shares issued and 18,255,698 and 17,685,685 shares outstanding at June 30, 2010 and 2009, respectively |
184 | 179 | ||||||
| Additional paid-in capital |
196,289 | 193,102 | ||||||
| Accumulated earnings |
120,401 | 89,860 | ||||||
| Accumulated other comprehensive income |
(705 | ) | (611 | ) | ||||
| Treasury stock at cost, 177,345 shares |
(3,319 | ) | (3,319 | ) | ||||
| Stockholders’ equity |
312,850 | 279,211 | ||||||
| Total liabilities and stockholders’ equity |
$ | 871,451 | $ | 709,843 | ||||
The accompanying notes are an integral part of these consolidated financial statements.
47
Table of Contents
Index to Financial Statements
CONSOLIDATED STATEMENTS OF OPERATIONS
(In thousands, except per share amounts)
| Year Ended June 30, | ||||||||||||
| 2010 | 2009 | 2008 | ||||||||||
| Revenue |
$ | 1,688,484 | $ | 1,376,874 | $ | 2,016,198 | ||||||
| Cost of sales |
1,444,156 | 1,194,173 | 1,752,191 | |||||||||
| 244,328 | 182,701 | 264,007 | ||||||||||
| Operating expenses: |
||||||||||||
| Operating expenses |
133,181 | 132,268 | 131,191 | |||||||||
| General and administrative expenses |
29,840 | 32,769 | 36,667 | |||||||||
| Depreciation and amortization |
39,769 | 41,899 | 35,944 | |||||||||
| Asset impairment |
— | 5,987 | — | |||||||||
| Loss on sale of assets |
— | — | 1,092 | |||||||||
| Business interruption insurance recoveries |
(17,051 | ) | (10,000 | ) | — | |||||||
| Unauthorized freight (recoveries) payments |
— | (4,694 | ) | 499 | ||||||||
| 185,739 | 198,229 | 205,393 | ||||||||||
| Income (loss) from operations |
58,589 | (15,528 | ) | 58,614 | ||||||||
| Other (income) expense: |
||||||||||||
| Interest expense |
15,062 | 16,836 | 19,045 | |||||||||
| Interest income |
(55 | ) | (20 | ) | (177 | ) | ||||||
| Unrealized (gain) loss on derivatives |
(3,464 | ) | 3,710 | (99 | ) | |||||||
| Other, net |
(2,287 | ) | (1,623 | ) | (1,394 | ) | ||||||
| 9,256 | 18,903 | 17,375 | ||||||||||
| Income (loss) before income taxes |
49,333 | (34,431 | ) | 41,239 | ||||||||
| Income tax expense (benefit) |
18,792 | (11,653 | ) | 14,615 | ||||||||
| Net income (loss) |
$ | 30,541 | $ | (22,778 | ) | $ | 26,624 | |||||
| Earnings per share: |
||||||||||||
| Basic |
$ | 1.70 | $ | (1.29 | ) | $ | 1.51 | |||||
| Diluted |
$ | 1.70 | $ | (1.29 | ) | $ | 1.47 | |||||
| Weighted average shares outstanding: |
||||||||||||
| Basic |
17,928 | 17,714 | 17,588 | |||||||||
| Diluted |
17,930 | 17,714 | 18,073 | |||||||||
The accompanying notes are an integral part of these consolidated financial statements.
48
Table of Contents
Index to Financial Statements
CONSOLIDATED STATEMENTS OF STOCKHOLDERS’ EQUITY
(In thousands)
| Additional Paid-in Capital |
Accumulated Earnings |
Accumulated Other Comprehensive Income (Loss) |
Treasury Stock at Cost |
Total Stockholders’ Equity |
||||||||||||||||||||||
| Common Stock | ||||||||||||||||||||||||||
| Shares | Amount | |||||||||||||||||||||||||
| Balances - June 30, 2007 |
17,327 | $ | 173 | $ | 179,651 | $ | 86,014 | $ | (54 | ) | $ | — | $ | 265,784 | ||||||||||||
| Net income |
— | — | — | 26,624 | — | — | 26,624 | |||||||||||||||||||
| Change in funded status of defined benefit plan, net of tax of $82 |
— | — | — | — | (152 | ) | — | (152 | ) | |||||||||||||||||
| Comprehensive income |
26,472 | |||||||||||||||||||||||||
| Exercise of stock options |
15 | — | 173 | — | — | — | 173 | |||||||||||||||||||
| Stock purchased by company |
(10 | ) | — | — | — | — | (300 | ) | (300 | ) | ||||||||||||||||
| Vesting of restricted stock |
256 | 3 | (3 | ) | — | — | — | — | ||||||||||||||||||
| Stock compensation expense |
— | — | 6,494 | — | — | — | 6,494 | |||||||||||||||||||
| Tax benefit windfall from share-based compensation arrangements |
— | — | 840 | — | — | — | 840 | |||||||||||||||||||
| Balances - June 30, 2008 |
17,588 | 176 | 187,155 | 112,638 | (206 | ) | (300 | ) | 299,463 | |||||||||||||||||
| Net loss |
— | — | — | (22,778 | ) | — | — | (22,778 | ) | |||||||||||||||||
| Change in funded status of defined benefit plan, net of tax of $218 |
— | — | — | — | (405 | ) | — | (405 | ) | |||||||||||||||||
| Comprehensive loss |
(23,183 | ) | ||||||||||||||||||||||||
| Exercise of stock options |
3 | — | 47 | — | — | — | 47 | |||||||||||||||||||
| Stock purchased by company |
(167 | ) | — | — | — | — | (3,019 | ) | (3,019 | ) | ||||||||||||||||
| Vesting of restricted stock |
262 | 3 | (3 | ) | — | — | — | — | ||||||||||||||||||
| Stock compensation expense |
— | — | 6,311 | — | — | — | 6,311 | |||||||||||||||||||
| Tax benefit shortfall from share-based compensation arrangements |
— | — | (576 | ) | — | — | — | (576 | ) | |||||||||||||||||
| Tax benefit windfall from share-based compensation arrangements |
— | — | 168 | — | — | — | 168 | |||||||||||||||||||
| Balances - June 30, 2009 |
17,686 | 179 | 193,102 | 89,860 | (611 | ) | (3,319 | ) | 279,211 | |||||||||||||||||
| Net income |
— | — | — | 30,541 | — | — | 30,541 | |||||||||||||||||||
| Change in funded status of defined benefit plan, net of tax of $51 |
— | — | — | — | (94 | ) | — | (94 | ) | |||||||||||||||||
| Comprehensive income |
30,447 | |||||||||||||||||||||||||
| Exercise of stock options |
298 | 3 | 3,017 | — | — | — | 3,020 | |||||||||||||||||||
| Vesting of restricted stock |
272 | 2 | (2 | ) | — | — | — | — | ||||||||||||||||||
| Stock compensation expense |
— | — | 1,186 | — | — | — | 1,186 | |||||||||||||||||||
| Tax benefit shortfall from share-based compensation arrangements |
— | — | (1,351 | ) | — | — | — | (1,351 | ) | |||||||||||||||||
| Tax benefit windfall from share-based compensation arrangements |
— | — | 337 | — | — | — | 337 | |||||||||||||||||||
| Balances - June 30, 2010 |
18,256 | $ | 184 | $ | 196,289 | $ | 120,401 | $ | (705 | ) | $ | (3,319 | ) | $ | 312,850 | |||||||||||
The accompanying notes are an integral part of these consolidated financial statements.
49
Table of Contents
Index to Financial Statements
CONSOLIDATED STATEMENTS OF CASH FLOWS
(In thousands)
| Year Ended June 30, | ||||||||||||
| 2010 | 2009 | 2008 | ||||||||||
| Cash flows from operating activities: |
||||||||||||
| Net income (loss) |
$ | 30,541 | $ | (22,778 | ) | $ | 26,624 | |||||
| Adjustments to reconcile net income (loss) to cash flows provided by operating activities: |
||||||||||||
| Depreciation and amortization |
39,769 | 41,899 | 35,944 | |||||||||
| Turnaround amortization |
5,032 | 4,307 | 2,432 | |||||||||
| Provision for bad debt expense |
132 | — | — | |||||||||
| Asset impairment |
— | 5,987 | — | |||||||||
| Loss on sale of assets |
— | — | 1,092 | |||||||||
| Amortization of debt issuance costs |
1,782 | 1,355 | 1,134 | |||||||||
| Pension expense |
1,464 | 1,393 | 1,180 | |||||||||
| Pension plan contributions |
(1,789 | ) | (1,209 | ) | (1,340 | ) | ||||||
| Deferred income taxes |
57,676 | (4,968 | ) | 11,343 | ||||||||
| Non-cash stock compensation expense |
1,186 | 6,311 | 6,494 | |||||||||
| Tax benefit windfall from share-based compensation arrangements |
(337 | ) | (168 | ) | (840 | ) | ||||||
| Tax benefit shortfall from share-based compensation arrangements |
(1,351 | ) | (576 | ) | — | |||||||
| Unrealized (gain) loss on derivatives |
(3,464 | ) | 3,710 | (99 | ) | |||||||
| Earnings from joint venture |
(1,406 | ) | (1,259 | ) | (1,204 | ) | ||||||
| Distributions received from joint venture |
1,528 | 900 | 964 | |||||||||
| Changes in assets and liabilities: |
||||||||||||
| Accounts receivable |
(18,024 | ) | 101,932 | (38,845 | ) | |||||||
| Inventories |
(57,723 | ) | 65,579 | (18,503 | ) | |||||||
| Accounts payable |
69,615 | (131,840 | ) | 35,241 | ||||||||
| Other assets and liabilities, net |
2,187 | (20,378 | ) | (3,791 | ) | |||||||
| Net cash provided by operating activities |
126,818 | 50,197 | 57,826 | |||||||||
| Cash flows from investing activities: |
||||||||||||
| Capital expenditures |
(14,400 | ) | (16,128 | ) | (87,783 | ) | ||||||
| Purchase of business assets |
— | — | (70,000 | ) | ||||||||
| Proceeds from sale of assets |
— | — | 1,470 | |||||||||
| Net cash used in investing activities |
(14,400 | ) | (16,128 | ) | (156,313 | ) | ||||||
| Cash flows from financing activities: |
||||||||||||
| Proceeds from term loan borrowings |
— | — | 70,000 | |||||||||
| Repayments on term loan |
(3,100 | ) | (2,744 | ) | (2,595 | ) | ||||||
| Net proceeds from (payments on) revolving credit facility borrowings |
— | (21,800 | ) | 21,800 | ||||||||
| Proceeds from insurance debt |
7,669 | 5,922 | 6,428 | |||||||||
| Payments on insurance debt |
(7,669 | ) | (5,922 | ) | (6,428 | ) | ||||||
| Debt issuance costs |
(4,621 | ) | (748 | ) | (350 | ) | ||||||
| Exercise of stock options |
3,020 | 47 | 173 | |||||||||
| Tax benefit windfall from share-based compensation arrangements |
337 | 168 | 840 | |||||||||
| Repurchase of common stock |
— | (3,019 | ) | (300 | ) | |||||||
| Net cash (used in) provided by financing activities |
(4,364 | ) | (28,096 | ) | 89,568 | |||||||
| Increase (decrease) in cash and cash equivalents |
108,054 | 5,973 | (8,919 | ) | ||||||||
| Cash and cash equivalents, beginning of period |
6,588 | 615 | 9,534 | |||||||||
| Cash and cash equivalents, end of period |
$ | 114,642 | $ | 6,588 | $ | 615 | ||||||
The accompanying notes are an integral part of these consolidated financial statements.
50
Table of Contents
Index to Financial Statements
NOTES TO CONSOLIDATED FINANCIAL STATEMENTS
June 30, 2010, 2009 and 2008
NOTE A – BASIS OF PRESENTATION
| 1. | Organization |
The accompanying consolidated financial statements include the accounts of TPC Group Inc., a Delaware corporation, and its wholly owned subsidiary, TPC Group LLC, a Texas limited liability company (collectively referred to as the “Company,” “our,” “we” or “us”). TPC Group Inc., formerly known as Texas Petrochemicals Inc., was incorporated on March 15, 2004. TPC Group Inc. owned a 1% interest in Texas Petrochemicals LP, a Texas limited partnership (the “Partnership”), and was its sole general partner. Texas Petrochemicals LLC, a Delaware limited liability company (the “Delaware LLC”), owned the remaining 99% ownership interest in, and was the limited partner of, the Partnership. On December 16, 2008, the Delaware LLC merged into TPC Group Inc., and the Partnership was converted to a Texas limited liability company named Texas Petrochemicals LLC, now known as TPC Group LLC.
| 2. | Business Segments |
We manage our business and conduct our activities in two operating segments, our C4 Processing segment and our Performance Products segment. These two operating segments are our primary reporting segments. In the C4 Processing segment, we process the crude C4 stream into several higher value components, namely butadiene, butene-1, raffinates and MTBE. In our Performance Products segment, we produce high purity isobutylene and we process isobutylene to produce higher value derivative products, such as polyisobutylene and diisobutylene. We also process refinery grade propylene into nonene, tetramer and associated by-products as a part of our Performance Products segment. We produce steam and electricity for our own use at our Houston facility, and we sell a portion of our steam production as well as excess electricity, which are reported as part of our C4 Processing segment.
| 3. | Fiscal Year End Change |
On July 15, 2010, our Board of Directors approved a change in our fiscal year end from June 30 to December 31, with the change to the calendar year reporting cycle beginning January 1, 2011. In addition to our report on Form 10-K for the fiscal year ended June 30, 2010, we expect to file a subsequent report on Form 10-K covering the six-month transition period ending December 31, 2010. The decision to align our financial reporting cycle with the calendar year is intended to make it easier for our stockholders and lenders to track the Company’s financial results in a timeframe that is consistent with many of our peers. Additionally, our management processes and financial reporting cycles will be more synchronized with those of our suppliers and customers.
| 4. | Principles of Consolidation |
The consolidated financial statements include the accounts of TPC Group Inc. and its direct and indirect subsidiaries, including its wholly owned subsidiary, TPC Group LLC, after the elimination of all significant intercompany accounts and transactions. Our investment in Hollywood/Texas Petrochemicals LP is accounted for under the equity method. The financial statements presented have been prepared by us in accordance with accounting principles generally accepted in the United States of America.
NOTE B – DESCRIPTION OF BUSINESS
We have three principal processing facilities, located in Houston, Texas, Port Neches, Texas and Baytown, Texas. The Houston and Port Neches facilities, which process crude C4 into butadiene and related products, are strategically located near most of the significant petrochemical consumers in Texas and Louisiana. Our Baytown facility primarily produces nonene and tetramer. All three locations provide convenient access to other Gulf Coast petrochemical producers and are connected to several of our customers and raw materials suppliers through an extensive pipeline network. In addition, our Houston and Port Neches facilities are serviced by rail, tank truck, barge and ocean-going vessel.
The products in our C4 Processing segment include butadiene, primarily used to produce synthetic rubber that is mainly used in tires and other automotive products; butene-1, primarily used in the manufacture of plastic resins and synthetic alcohols; raffinates, primarily used in the manufacturing of alkylate, a component of premium unleaded gasoline; and methyl tertiary butyl ether (“MTBE”), primarily used as a gasoline blending stock. The products in our Performance Products segment include high purity isobutylenes (“HPIB”), primarily used in the production of synthetic rubber, lubricant additives, surfactants and coatings; conventional polyisobutylenes (“PIB”) and highly reactive polyisobutylenes (“HR-PIB”), primarily used in the production of fuel and lubricant additives, caulks, adhesives, sealants and packaging; diisobutylene (“DIB”), primarily used in the manufacture of surfactants, plasticizers and resins; and nonene and tetramer, primarily used in the production of plasticizers, surfactants and lubricant additives. We sell our products primarily to chemical and petroleum based companies in North America.
51
Table of Contents
Index to Financial Statements
TPC Group Inc.
NOTES TO CONSOLIDATED FINANCIAL STATEMENTS – (Continued)
June 30, 2010, 2009 and 2008
Our principal raw material feedstocks are crude C4, crude isobutylene and refinery grade propylene. The pricing under our supply contracts and sales contracts is usually linked to a commodity price index, such as indices based on the price of unleaded regular gasoline, butane, isobutane or refinery grade propylene, or to the price at which we sell the finished product.
NOTE C – SIGNIFICANT ACCOUNTING POLICIES
| 1. | Reclassifications |
Certain reclassifications have been made to prior years’ financial statements to conform to the current year presentation. The reclassifications had no impact on equity, net income or cash flows.
| 2. | Use of Estimates |
The preparation of financial statements in conformity with generally accepted accounting principles requires management to make estimates and assumptions that affect the reported amount of assets and liabilities and disclosure of contingent assets and liabilities at the date of the financial statements and the reported amounts of revenues and expenses during the reporting period. Actual results could differ from those estimates.
| 3. | Cash and Cash Equivalents |
Cash and cash equivalents includes amounts on deposit with banks, cash invested temporarily in investments with original maturities of three months or less, and cash on hand. We maintain cash balances that are insured by the Federal Deposit Insurance Corporation (“FDIC”). FDIC’s insurance limit at June 30, 2010 was $0.25 million. At June 30, 2010, we had cash balances significantly in excess of FDIC limits; however our deposits are with a major bank and a major financial services company, and we have not experienced any losses in such accounts. We believe that the likelihood of any loss of cash and cash equivalents is remote and that we are not exposed to any significant credit risk on cash and cash equivalents.
| 4. | Accounts Receivable |
We extend credit to our customers in the normal course of business and generally do not require collateral for accounts receivable. We perform ongoing credit evaluations of our customers and, in some instances, require letters of credit or additional guarantees in support of contracted amounts. We review the collectability of receivables and use the allowance method to record bad debt expense for amounts that we believe may be uncollectible. We believe no allowance was necessary as of June 30, 2010 and 2009. Write-offs are recorded at the time a customer receivable is deemed uncollectible.
| 5. | Inventories |
Inventories consist of raw materials and finished goods and are valued at the lower of average cost or market. Costs include raw materials, labor and applicable manufacturing overhead. We may enter into product exchange agreements with suppliers and customers for raw materials and finished goods. Exchange balances due to or from exchange partners are recorded in inventory at the lower of average cost or market. At June 30, 2010 and 2009, we had exchange receivable positions of $1.6 million and $0.2 million, respectively, and exchange payable positions of $0.0 and $0.2 million, respectively.
| 6. | Investment in Limited Partnership |
We have a 50% limited partnership interest in Hollywood/Texas Petrochemicals LP. We and Kirby Inland Marine, Inc. formed this limited partnership to operate four barges capable of transporting chemicals. We account for this investment under the equity method and report our portion of the limited partnership’s net income as other income in the accompanying Consolidated Statements of Operations. The amounts attributable to this investment recorded in other income in 2010, 2009 and 2008 were $1.4 million, $1.3 million, and $1.2 million, respectively. The amounts of cash distributions received in 2010, 2009 and 2008 were $1.5 million, $0.9 million and $1.0 million, respectively.
52
Table of Contents
Index to Financial Statements
TPC Group Inc.
NOTES TO CONSOLIDATED FINANCIAL STATEMENTS – (Continued)
June 30, 2010, 2009 and 2008
| 7. | Property, Plant and Equipment |
Property, plant and equipment are stated at depreciated historical cost. Depreciation of property, plant and equipment is computed using the straight-line method over estimated useful lives ranging from five to forty-five years for financial reporting purposes and accelerated methods for income tax purposes. Maintenance and repairs and minor renewals are charged to expense as incurred while major improvements, renewals and betterments are capitalized. Interest is capitalized on long term construction projects using the Company’s internal cost of debt rate. Upon retirement or sale of an asset, the asset cost and the related accumulated depreciation are removed from the accounts and any resulting gain or loss is reflected in results of operations.
| 8. | Intangible Assets |
Our intangible assets include patents and technology licenses. Patents are amortized using the straight-line method over their useful lives. Our technology licenses have no legal, regulatory, contractual, competitive, economic, or other factors that would limit their useful lives; consequently, we have determined their useful lives to be indefinite.
| 9. | Impairment |
We follow Financial Accounting Standards Board Accounting Standards Codification (“FASB ASC”) 350, Intangibles – Goodwill and Other, regarding impairment of our indefinite life intangible assets (technology licenses) and FASB ASC 360, Property, Plant, and Equipment, regarding impairment of our other long-lived assets (property, plant and equipment and patents). Our policy is to assess both our indefinite life intangible assets and our other long-lived assets for impairment annually in the fourth quarter of each year or more frequently if events or changes in circumstances indicate that the carrying amount of these assets may not be recoverable.
An impairment loss is recognized only if the carrying value of a long-lived asset or asset group is not recoverable and is measured as the excess of its carrying value over its fair value. The carrying amount of a long-lived asset or asset group is considered not recoverable if it exceeds the sum of the undiscounted cash flows expected to result from the use of long-lived asset or asset group. Because our technology licenses are fundamental to and inseparable from their respective long-lived manufacturing assets, we assess impairment of the technology licenses together with the respective long-lived assets based on the undiscounted future cash flows related to the respective manufacturing processes.
We viewed the downturn in the economy that started in the first half of fiscal 2009 as a temporary condition that did not have a significant negative impact on our estimated long-term cash flows. Consequently, we did not perform impairment testing on our long-lived assets prior to the fourth quarter test in accordance with our policy.
Although our 2009 fourth quarter impairment test did not indicate any impairment of our indefinite life intangible assets or long-lived asset groups, based on circumstances specific to an idled manufacturing unit, in the fourth quarter of 2009 we recognized an impairment with respect to that unit – see Note E for further discussion. No impairment was indicated or recognized from our impairment test performed in the fourth quarter of fiscal 2010.
| 10. | Plant Turnaround Costs |
Plant turnarounds are major scheduled and required partial or complete shutdowns of chemical processing units for significant overhaul and refurbishment, for periods typically lasting from two to four weeks. We use the deferral method to account for the cost of turnarounds. Under the deferral method the costs of major scheduled plant turnarounds are deferred on the balance sheet and charged to operating expense on a straight-line basis during the period until the next scheduled turnaround.
The amounts of deferred turnaround costs recorded on the balance sheet in other assets at June 30, 2010 and 2009 were $11.6 million and $11.4 million, respectively. Amortization of deferred turnaround costs charged to operating expense for fiscal 2010, 2009 and 2008 were $5.0 million, $4.3 million and $2.4 million, respectively.
| 11. | Debt Issuance Costs |
Direct costs incurred in connection with the issuance of long-term debt or modification of a credit facility, if the borrowing capacity of the new arrangement is greater than or equal to the borrowing capacity of the old arrangement, are deferred and amortized as interest expense over the term of the debt or credit facility. The deferred costs are included in other assets on our Consolidated Balance Sheets.
53
Table of Contents
Index to Financial Statements
TPC Group Inc.
NOTES TO CONSOLIDATED FINANCIAL STATEMENTS – (Continued)
June 30, 2010, 2009 and 2008
| 12. | Revenue Recognition |
We recognize revenue from sales of products in the period when title and risk of loss transfer to the customer. Under certain contractual arrangements with a small number of customers, primarily related to butadiene, we invoice the customer prior to when title and risk of loss transfer to the customer. When these invoices are issued to the customer, typically at month-end, we record a customer receivable with an offsetting credit to deferred revenue. The customer will settle the liability based on credit terms independent of when the product actually ships. Deferred revenue is subsequently recognized as revenue at the time title and risk of loss transfer to the customer. The time lag between invoicing and shipping product for these deferred revenue transactions depends on when the customer has nominated delivery, which is normally the following month and seldom extends beyond two months. Product to be delivered under these deferred revenue arrangements remains in inventory until title and risk of loss transfer to the customer. The balance of deferred revenue can fluctuate significantly from period to period depending on the volume and pricing of the inventory and the timing of the customer’s needs.
| 13. | Environmental Remediation Costs |
Anticipated expenditures related to investigation and remediation of contaminated sites, which include operating facilities and waste disposal sites, are accrued when it is probable a liability has been incurred and the amount of the liability can be reasonably estimated.
| 14. | Comprehensive Income (Loss) |
Comprehensive income (loss) is reported in accordance with FASB ASC 220, Comprehensive Income. Our comprehensive income (loss) is defined as net income adjusted for the change (net of tax) during the year in the funded status of our defined benefit pension plan.
| 15. | Income Taxes |
We account for income taxes in accordance with FASB ASC 740, Income Taxes. We recognize deferred taxes at enacted tax rates on temporary differences between the carrying amounts of assets and liabilities for financial and tax reporting purposes and we record a valuation allowance on net deferred tax assets when it is more likely than not that these assets will not be realized.
We recognize interest and penalties related to uncertain tax positions taken or to be taken as part of income tax expense.
| 16. | Stock Based Compensation |
We account for stock-based compensation in accordance with FASB ASC 718, Compensation – Stock Compensation. We measure the cost of each stock option and restricted stock award at its fair value on the grant date. Each award vests over the subsequent period during which the recipient is required to provide service in exchange for the award (the vesting period). The cost of each award is recognized as expense in the financial statements over the respective vesting period. The expense recognized reflects an estimated forfeiture rate for unvested awards of 3%.
| 17. | Asset Retirement Obligations |
We follow FASB ASC 410, Asset Retirement and Environmental Obligations, regarding accounting for obligations associated with the retirement of tangible long-lived assets and the associated asset retirement costs. The provisions of this statement apply to legal obligations associated with the retirement of long-lived assets that result from the acquisition, construction, development and/or the normal operation of a long-lived asset.
We have asset retirement obligations with respect to certain of our chemical processing assets due to various legal obligations to clean and/or dispose of various components of the chemical plants at the time they are retired. However, these components can be used for extended and indeterminate periods of time as long as they are properly maintained and/or upgraded. It is our practice and current intent to maintain our chemical processing assets and continue making improvements to those assets based on technological advances.
54
Table of Contents
Index to Financial Statements
TPC Group Inc.
NOTES TO CONSOLIDATED FINANCIAL STATEMENTS – (Continued)
June 30, 2010, 2009 and 2008
As a result, management believes that our facilities have indeterminate lives for purposes of estimating asset retirement obligations because dates or ranges of dates upon which we would retire chemical processing assets cannot reasonably be estimated at this time. When a date or range of dates can reasonably be estimated for the retirement of any component part of a chemical plant, an estimate of the cost of performing the retirement activities will be provided and a liability will be recorded for the fair value of that cost using established present value techniques. We have not recorded an asset retirement obligation related to the retirement of any component parts of our facilities as of June 30, 2010 and 2009.
| 18. | Capitalized Interest |
Interest costs incurred during development and construction of certain long-term assets are capitalized as part of the cost of the assets. No interest costs were capitalized in fiscal 2010. Interest costs capitalized in fiscal 2009 and 2008 were $0.9 million and $2.4 million, respectively.
| 19. | Shipping and Handling Costs |
We account for shipping and handling costs in accordance with FASB ASC 605, Revenue Recognition. Amounts billed to customers in sale transactions related to shipping and handling costs are recorded as revenue. Shipping and handling costs incurred by us are included in cost of sales in the Consolidated Statements of Operations.
| 20. | Financial Instruments |
The carrying amounts for cash and cash equivalents, receivables and payables approximate fair value because of the short maturity of these instruments. Our long-term debt is variable rate debt and, as such, the carrying amount approximates fair value, as interest rates vary with prevailing market rates.
| 21. | Derivative Instruments |
We account for derivative instruments in accordance with FASB ASC 815, Derivatives and Hedging (“FASB ASC 815”). Such instruments are measured at fair value and recognized as assets or liabilities in the Consolidated Balance Sheets. Accounting for changes in the fair value of a derivative depends on the intended use of the derivative and the resulting designation established at the inception of the derivative. For derivatives that are designated as fair value hedges, changes in fair value are recognized currently through earnings with an offsetting, mark-to-fair-value of the hedged item. For derivatives designated as cash flow hedges and meeting the effectiveness guidelines of FASB ASC 815, changes in fair value, to the extent effective, are recognized as other comprehensive income or loss until the hedged item is recognized in earnings. Hedge effectiveness is measured at least quarterly based on the relative changes in fair value between the derivative contract and the hedged item over time, or in the case of options based on the change in intrinsic value. Any change in fair value of a derivative resulting from ineffectiveness or an excluded component of the gain or loss, such as time value for option contracts, is recognized immediately in earnings. For any derivative instrument not designated as a hedge at inception, changes in fair value of the instrument are recognized in earnings in the period in which the change occurs.
| 22. | Fair Value Option |
FASB ASC 825, Financial Instruments allows entities to choose, at specified election dates, to measure eligible financial assets and liabilities at fair value that are not otherwise required to be measured at fair value. If a company elects the fair value option for an eligible item, changes in that item’s fair value in subsequent reporting periods must be recognized in current earnings. The Company has currently elected not to measure its eligible financial assets and liabilities at fair value.
| 23. | Treasury Stock |
As of June 30, 2010, we had a total of 177,345 shares of common stock held as treasury stock. During fiscal 2009 and 2008, we acquired 167,000 and 10,345 shares valued at cost, for $3.0 million and $0.3 million, respectively. No treasury shares were acquired in fiscal 2010. We account for treasury stock under the cost method.
55
Table of Contents
Index to Financial Statements
TPC Group Inc.
NOTES TO CONSOLIDATED FINANCIAL STATEMENTS – (Continued)
June 30, 2010, 2009 and 2008
| 24. | Subsequent Events |
In accordance with FASB ASC 855, Subsequent Events, we determined there were no subsequent events that should be disclosed or recognized in the financial statements.
| 25. | Recent Accounting Pronouncements |
In February 2010, the Financial Accounting Standards Board (“FASB”) issued Accounting Standards Update (ASU) No. 2010-09, Subsequent Events (Topic 855); Amendments to Certain Recognition and Disclosure Requirements, effective upon issuance, which removed the requirement for an SEC filer to disclose the date through which subsequent events have been evaluated in both issued and revised financial statements.
In June 2009, the FASB issued the Accounting Standards Codification (“FASB ASC”) as the sole source of authoritative U.S. generally accepted accounting principles (GAAP) recognized by the FASB to be applied by nongovernmental entities in the preparation of financial statements, effective for interim and annual periods ending after September 15, 2009. FASB ASC does not change GAAP, but changes the way accounting principles are referenced in financial statements and notes to financial statements. As required, we adopted FASB ASC in the first quarter of fiscal 2010 and, other than accounting principle resource referencing, FASB ASC had no impact on our financial statements as of and for the periods ended June 30, 2010.
In December 2007, the FASB issued changes in accounting requirements for business combinations that are contained in FASB ASC 805, Business Combinations (“FASB ASC 805”). The requirements retain the purchase method of accounting for acquisitions, but require a number of changes, including changes in the way assets and liabilities are recognized in purchase accounting. It also changes the recognition of assets acquired and liabilities assumed arising from contingencies, requires the capitalization of in-process research and development at fair value, and requires the expensing of acquisition-related costs as incurred. The above provisions for changes in accounting requirements prescribed by FASB ASC 805, effective for the Company beginning July 1, 2009, were adopted in the first quarter of fiscal 2010 with no impact on our financial statements as of and for the periods ended June 30, 2010.
FASB ASC 820, Fair Value Measurements and Disclosures (“FASB ASC 820”) includes guidance which establishes a standard definition of fair value, and a framework under generally accepted accounting principles to measure fair value and expands disclosure requirements for fair value measurements. On July 1, 2008, we adopted the provisions of FASB ASC 820 for assets and liabilities measured or disclosed at fair value on a recurring basis. The provisions of FASB ASC 820 were adopted for nonfinancial assets and liabilities measured on a non-recurring basis on July 1, 2009 and had no impact on our financial statements at June 30, 2010, as we currently have no nonfinancial assets and liabilities measured on a non-recurring basis at fair value.
In June 2008, the FASB issued revisions to FASB ASC 260, Earnings Per Share (“FASB ASC 260”) which prescribe guidelines on determining whether instruments granted in share-based payment transactions are participating securities prior to vesting and, therefore, need to be included in the earnings allocation in computing earnings per share. Further, the revisions clarify that unvested share-based payment awards that contain non-forfeitable rights to dividends or dividend equivalents (whether paid or unpaid) are participating securities and shall be included in the computation of earnings per share pursuant to the two class method. As required, we adopted these revisions to FASB ASC 260 effective July 1, 2009.
NOTE D – DETAIL OF CERTAIN CONSOLIDATED BALANCE SHEET CAPTIONS
Inventories as of June 30 are as follows (in thousands):
| 2010 | 2009 | |||||
| Finished goods |
$ | 60,476 | $ | 24,913 | ||
| Raw materials and chemical supplies |
34,131 | 11,971 | ||||
| $ | 94,607 | $ | 36,884 | |||
56
Table of Contents
Index to Financial Statements
TPC Group Inc.
NOTES TO CONSOLIDATED FINANCIAL STATEMENTS – (Continued)
June 30, 2010, 2009 and 2008
Other current assets as of June 30 are as follows (in thousands):
| 2010 | 2009 | |||||
| Prepaid expense and other |
$ | 6,548 | $ | 7,164 | ||
| Repair parts inventory |
8,724 | 8,735 | ||||
| Deferred taxes, net |
6,031 | 4,365 | ||||
| $ | 21,303 | $ | 20,264 | |||
Property, plant and equipment as of June 30 are as follows (in thousands):
| 2010 | 2009 | |||||
| Land and land improvements |
$ | 41,803 | $ | 41,803 | ||
| Plant and equipment |
582,660 | 573,911 | ||||
| Construction in progress |
13,922 | 9,005 | ||||
| Other |
16,485 | 15,755 | ||||
| 654,870 | 640,474 | |||||
| Less accumulated depreciation |
163,788 | 124,097 | ||||
| $ | 491,082 | $ | 516,377 | |||
Intangible Assets
Changes in the carrying amount of our intangible assets for fiscal 2010 and 2009 were as follows (in thousands):
| Intangible assets |
Accumulated amortization |
Carrying value |
|||||||||
| Balance at June 30, 2008 |
4,601 | (158 | ) | 4,443 | |||||||
| Amortization |
— | (44 | ) | (44 | ) | ||||||
| Technology license additions |
1,619 | — | 1,619 | ||||||||
| Balance at June 30, 2009 |
$ | 6,220 | $ | (202 | ) | $ | 6,018 | ||||
| Amortization |
— | (44 | ) | (44 | ) | ||||||
| Balance at June 30, 2010 |
$ | 6,220 | $ | (246 | ) | $ | 5,974 | ||||
The following summarizes the gross carrying amounts and accumulated amortization of intangible assets as of June 30 (in thousands):
| 2010 | 2009 | |||||||||||||||||||
| Gross carrying value |
Accumulated amortization |
Net carrying value |
Gross carrying value |
Accumulated amortization |
Net carrying value | |||||||||||||||
| Technology license |
$ | 5,499 | $ | — | $ | 5,499 | $ | 5,499 | $ | — | $ | 5,499 | ||||||||
| Patents |
721 | (246 | ) | 475 | 721 | (202 | ) | 519 | ||||||||||||
| $ | 6,220 | $ | (246 | ) | $ | 5,974 | $ | 6,220 | $ | (202 | ) | $ | 6,018 | |||||||
57
Table of Contents
Index to Financial Statements
TPC Group Inc.
NOTES TO CONSOLIDATED FINANCIAL STATEMENTS – (Continued)
June 30, 2010, 2009 and 2008
Future estimated amortization expense for the periods ending December 31 is as follows (in thousands):
| 2010 Transition Period (six months) |
$ | 22 | |
| 2011 |
44 | ||
| 2012 |
44 | ||
| 2013 |
44 | ||
| 2014 |
44 | ||
| 2015 |
44 |
Accrued liabilities as of June 30 are as follows (in thousands):
| 2010 | 2009 | |||||
| Accrued payroll and benefits |
$ | 9,801 | $ | 7,009 | ||
| Accrued freight |
3,251 | 3,070 | ||||
| Accrued interest |
1,435 | 854 | ||||
| Federal and state income tax |
515 | 114 | ||||
| Property and sales tax |
4,091 | 4,330 | ||||
| Deferred revenue |
1,916 | — | ||||
| Fair value of derivative financial instruments |
— | 3,464 | ||||
| Other |
342 | 400 | ||||
| $ | 21,351 | $ | 19,241 | |||
NOTE E – DISCUSSION OF CERTAIN CONSOLIDATED STATEMENT OF OPERATIONS CAPTIONS
| 1. | Asset Impairment |
In conjunction with the completion of a capital project in October 2007, which allowed us to externally source isobutylene feedstock at our Houston facility, we idled our dehydrogenation units that were previously used to produce isobutylene. The carrying value of the dehydrogenation assets was not previously considered to be impaired because there were a number of realistic and probable alternative uses for these assets in which the carrying value would have been recovered. However, in fourth quarter fiscal 2009, we determined that the likelihood of investing additional capital in the foreseeable future necessary to recover the carrying value of these specific assets had been substantially reduced. Based on the unlikely capital investment in the foreseeable future and the fact that the assets had been idled for almost two years, we concluded that recovery of the carrying cost of these assets was not likely and in the fourth quarter of fiscal 2009 we recorded a charge of $6.0 million to recognize the impairment of these assets.
| 2. | Business Interruption Insurance Recoveries |
The business interruption insurance recoveries represent recoveries under our business interruption insurance claim related to Hurricane Ike in September 2008. The total amount of our settlement of $47.0 million consisted of a $19.5 million deductible, a $10.0 million payment received in fourth quarter of fiscal 2009 and the final payment of $17.5 million ($17.1 million net of expenses) received in second quarter of fiscal 2010.
| 3. | Unauthorized Freight Payments |
In July 2007, the Company discovered that a former employee, with the assistance of a non-employee conspirator, had directed unauthorized payments from our accounts to a fictitious vendor in various amounts in years prior to fiscal 2009. In August 2008, the former employee and his non-employee conspirator were convicted of certain crimes related to the unauthorized freight payments by the United States District Court for the Southern District of Texas.
58
Table of Contents
Index to Financial Statements
TPC Group Inc.
NOTES TO CONSOLIDATED FINANCIAL STATEMENTS – (Continued)
June 30, 2010, 2009 and 2008
As part of their convictions, the former employee and his non-employee conspirator were required to forfeit assets to the Office of the United States Attorney for restitution. These assets were liquidated by the U. S. government, and in April 2009 we received cash proceeds of $4.7 million as restitution for the losses represented by the unauthorized freight payments. We do not anticipate any future additional recoveries.
NOTE F – DEBT
Outstanding debt as of June 30 is as follows (in thousands):
| 2010 | 2009 | |||||
| Term loan |
$ | 269,470 | $ | 272,570 | ||
| Revolving credit facility |
— | — | ||||
| 269,470 | 272,570 | |||||
| Less current portion of long-term debt |
19,049 | 2,715 | ||||
| Total long-term debt |
$ | 250,421 | $ | 269,855 | ||
At June 30, 2010, the aggregate amount of payments required to meet long-term debt installments in the transition period and each of the following three years (to maturity), are as follows (in thousands):
| 2010 Transition period (six months) |
$ | 17,670 | |
| 2011 |
2,508 | ||
| 2012 |
2,484 | ||
| 2013 |
246,808 | ||
| $ | 269,470 | ||
Our financing arrangements consist principally of a term loan in the original principal amount of $280 million (the “Term Loan”), a $175 million revolving credit facility (the “Revolving Credit Facility”) and insurance premium financing.
Average outstanding debt was $304.6 million and $330.9 million for fiscal 2010 and 2009, respectively. Average interest expense was $1.3 million, $1.4 million, and $1.6 million for fiscal 2010, 2009, and 2008, respectively.
| 1. | Term Loan |
The $280.0 million Term Loan has a seven-year term, maturing June 27, 2013. The Term Loan provides for quarterly principal repayments of 0.25% of the outstanding principal balance thereof. Furthermore, the Term Loan requires annual prepayments equal to a specified percentage, which varies depending upon our calculated Leverage Ratio, of excess cash flow. For excess cash flow generated in fiscal 2010, we will make a payment in October 2010 of $16.4 million. For excess cash flow generated in fiscal 2009, we made a payment of $0.4 million in October 2009. The excess cash flow payment to be made in October 2010 and the payment made in October 2009 are included in current portion of long-term debt at June 30, 2010 and 2009, respectively.
The Term Loan bears interest at a floating rate, which, at our option, is based on LIBOR or the prime rate plus a spread. At June 30, 2010, our Term Loan spread was 2.50% and the total interest rate 2.875%. The Term Loan is secured by a first priority lien on all tangible and intangible fixed assets and is cross collateralized with the Revolving Credit Facility. The Term Loan agreement includes certain restrictive covenants, which include but are not limited to, limitations on debt, mergers and acquisitions, restricted payments, investments, asset sales, liens and transactions with affiliates. As of June 30, 2010, we were in compliance with the Term Loan covenants.
We were required under our Term Loan agreement to purchase interest rate protection by October 25, 2006 on at least $120.0 million of the Term Loan for not less than three years. To satisfy this requirement, on October 18, 2006, we entered into a three-year interest rate cap agreement for a one-time expense of approximately $0.3 million. The interest rate cap, which expired on October 31, 2009, provided protection on $120.0 million of our long term debt if LIBOR exceeded 6.0%.
59
Table of Contents
Index to Financial Statements
TPC Group Inc.
NOTES TO CONSOLIDATED FINANCIAL STATEMENTS – (Continued)
June 30, 2010, 2009 and 2008
In June 2008, we entered into a two-year interest rate swap whereby we effectively fixed the LIBOR interest rate at 3.406% plus a spread of 2.5% (total fixed rate of 5.906%) on $135.0 million of our outstanding variable rate Term Loan. The interest rate swap expired on June 30, 2010.
| 2. | Revolving Credit Facility |
The asset-based revolving credit facility in effect prior to April 29, 2010 had a five-year term, maturing on June 27, 2011, bearing interest at a floating rate based on LIBOR or the prime rate plus a 2.5% spread. Availability under the $140 million facility was limited to our borrowing base (comprised of 85% of eligible accounts receivable and 65% of eligible inventory), reduced by a $20 million availability block.
On April 29, 2010 we entered into an Amended and Restated Revolving Credit Agreement increasing the amount of the Revolving Credit Facility from $140 million to $175 million, subject to borrowing base calculations, and extending the maturity to the earlier of April 29, 2014, or if more than $25 million remains outstanding under the Term Loan, March 29, 2013. Direct costs of $4.6 million associated with the Amended and Restated Revolving Credit Agreement were capitalized and are being amortized over the new term. Amortization of debt issuance costs is included in interest expense.
Availability under the Revolving Credit Facility is limited to the borrowing base, comprised of 85% of eligible accounts receivable and 65% of eligible inventory, as redetermined monthly. Up to $30 million of the facility may be used for the issuance of letters of credit. The Revolving Credit Facility also includes an accordion feature under which the lenders may agree, upon our request, to increase their commitments to an aggregate amount not to exceed $200 million.
Amounts borrowed under the Revolving Credit Facility bear interest, at our option, at a rate equal to either (a) the Eurodollar Rate (as defined in the credit agreement) plus 3.00% to 3.75%, or (b) the base rate (as described below) plus 2.00% to 2.75%, in each case depending on the ratio of our consolidated debt to consolidated EBITDA (as defined in the credit agreement), with a lower leverage ratio resulting in lower rates. The base rate equals the highest of (i) the administrative agent’s prime lending rate, (ii) the Federal Funds Rate plus 1/2 of 1%, or (iii) the one-month Eurodollar Rate (as defined in the credit agreement) plus 1%.
A commitment fee is payable on the unused portion of the Revolving Credit Facility in an amount equal to 0.50% per annum if average availability is less than 50% of the total commitments, or 0.75% per annum if average availability is 50% or more of the total commitments, in each case based on average availability during the previous fiscal quarter.
The Revolving Credit Facility is secured with a first priority lien on cash, accounts receivable, inventory and certain intangibles, and through cross-collateralization with the Term Loan, a second priority lien on all other assets, including fixed assets. The Revolving Credit Facility is guaranteed by all of our material domestic subsidiaries and provides for customary events of default.
The Revolving Credit Facility includes covenants that restrict, subject to specified exceptions, our ability to:
| • | create or permit liens on assets; |
| • | incur additional indebtedness or issue redeemable equity securities; |
| • | guarantee indebtedness; |
| • | merge or consolidate with a third party; |
| • | sell or otherwise dispose of assets; |
| • | pay dividends or effect stock buy-backs; |
| • | issue or sell stock of subsidiaries; |
| • | make loans, investments and acquisitions; |
| • | enter into transactions with affiliates; |
| • | change the lines of business in which we are engaged; |
| • | change our fiscal year; |
| • | make voluntary prepayments or redemptions of subordinated indebtedness; |
| • | enter into agreements that limit our subsidiaries’ ability to pay distributions to or enter into transactions with us; |
| • | maintain cash balances in excess of $15 million without using such excess cash to prepay loans under the Revolving Credit Facility; and |
| • | enter into receivables financings or securitization programs. |
60
Table of Contents
Index to Financial Statements
TPC Group Inc.
NOTES TO CONSOLIDATED FINANCIAL STATEMENTS – (Continued)
June 30, 2010, 2009 and 2008
Although the Revolving Credit Facility restricts acquisitions, investments and the payment of dividends, respectively, acquisitions, investments and dividends are permitted, subject to restrictions under the existing Term Loan agreement, if (a) pro forma current and average 90-day historical availability each exceed the greater of $50 million or 50% of the total commitments, or (b) pro forma projected, current and average 90-day historical availability each exceed the greater of $25 million or 25% of the total commitments and we meet a minimum consolidated fixed charge coverage ratio. Finally, the Revolving Credit Facility agreement includes a covenant requiring a minimum consolidated fixed charge coverage ratio should availability be less than the greater of $15 million or 15% of the total commitments.
| 3. | Insurance Premium Financing |
In fiscal 2010, as in previous years, we financed our property and casualty insurance premiums through Flatiron Capital Corporation. The premiums were typically financed in July of each year for that particular fiscal year and the debt is amortized over 10-month periods; consequently, there was no liability on the balance sheet at June 30, 2010 and 2009. The amounts financed for fiscal 2010 and 2009 were $7.7 million and $5.9 million, respectively.
NOTE G – FAIR VALUE AND DERIVATIVE FINANCIAL INSTRUMENTS
| 1. | Fair Value |
Within the framework for measuring fair value, FASB ASC 820, Fair Value Measurements and Disclosures, establishes a fair value hierarchy, which requires an entity to maximize the use of observable inputs and minimize the use of unobservable inputs when measuring fair value. The standard defines the three levels of inputs used to measure fair value as follows:
| • | Level 1: Inputs are unadjusted quoted prices for identical assets or liabilities in active markets, which primarily consist of financial instruments, traded on exchange or futures markets. |
| • | Level 2: Inputs are other than quoted prices in active markets (included in Level 1) which are directly or indirectly observable as of the financial reporting date, including derivative instruments transacted primarily in over-the-counter markets. |
| • | Level 3: Unobservable inputs, which include inputs derived through extrapolation or interpolation that cannot be corroborated by observable market data. |
The table below presents the balance of liabilities measured at fair value on a recurring basis as of June 30 (in thousands):
| Significant other observable inputs (Level 2) | ||||||
| Description |
2010 | 2009 | ||||
| Derivative liabilities |
$ | — | $ | 3,464 | ||
The June 30, 2009 liability relates to the two-year interest rate swap entered into in June 2008, which expired on June 30, 2010. The swap effectively fixed the interest rate at 3.406% plus a spread of 2.5% (total fixed rate of 5.906%) on $135.0 million of our outstanding variable rate Term Loan. Since the interest rate swap was in a liability position at June 30, 2009, we evaluated risk of non-performance as a component of recorded value.
Effective June 30, 2009, fair value measurements were applied with respect to our nonfinancial assets and liabilities. We measure certain non-financial assets and liabilities, including long-lived assets, at fair value on a non-recurring basis. The fair market value of those assets is determined using Level 3 inputs, which requires management to make estimates about future cash flows. Management estimates the amount and timing of future cash flows based on its experience and knowledge of market factors.
| 2. | Derivative Financial Instruments |
The nature of our business involves market and financial risks. Specifically, we are exposed to commodity price risks and interest rate fluctuations. We seek to manage commodity price risks and interest rate fluctuations, from time to time, with commodity swap, interest rate swap, and interest rate cap instruments. Under interest rate swaps, we agree with other parties to exchange, at specified intervals, the difference between fixed rate and floating rate interest amounts calculated using an agreed-upon notional principal amount. The counterparties to the interest rate swap agreements are financial institutions with investment grade ratings.
61
Table of Contents
Index to Financial Statements
TPC Group Inc.
NOTES TO CONSOLIDATED FINANCIAL STATEMENTS – (Continued)
June 30, 2010, 2009 and 2008
We have not previously designated any of our derivative instruments as hedges; consequently, changes in the fair values have been recognized in earnings in the period in which the changes occurred.
The following table shows the location and fair value of our derivative financial instrument reported in the consolidated balance sheets at June 30 (in thousands):
| Description |
Balance Sheet Location |
2010 | 2009 | |||||
| Interest Rate Swap |
Accrued liabilities |
$ | — | $ | 3,464 | |||
The amount of all gains and losses recognized in income on derivatives not designated as hedging instruments were as follows for the fiscal years ended June 30 (in thousands):
| Description |
Location of (Gains) Losses Recognized in Income on Derivatives |
2010 | 2009 | |||||||
| Interest Rate Cap |
Unrealized (gain) loss on derivatives | $ | — | $ | 22 | |||||
| Interest Rate Swap |
Unrealized (gain) loss on derivatives | (3,464 | ) | 3,688 | ||||||
| Interest expense | 4,175 | 1,489 | ||||||||
| Commodity Swaps |
Cost of sales | 652 | (3,641 | ) | ||||||
| $ | 1,363 | $ | 1,558 | |||||||
We were required under our Term Loan agreement to purchase interest rate protection by October 25, 2006, on at least $120.0 million of the Term Loan for not less than three years. To satisfy this requirement, on October 18, 2006, we entered into a three year interest rate cap agreement for a one-time expense of approximately $0.3 million. The interest rate cap, which expired on October 31, 2009, provided protection on $120.0 million of our long term debt if LIBOR exceeded 6.0%.
In June 2008, we entered into a two-year interest rate swap whereby we effectively fixed the LIBOR interest rate at 3.406% plus a spread of 2.5% (total fixed rate of 5.906%) on $135.0 million of our outstanding variable rate Term Loan. The interest rate swap expired on June 30, 2010.
During the first quarter of fiscal 2010, we entered into a series of commodity swaps to mitigate risk on our fuel-related products inventory. All of the commodity swaps matured by December 31, 2009, and the resulting aggregate net realized losses of $0.7 million are reflected in cost of sales in fiscal 2010. During the second quarter of fiscal 2009, we entered into a series of commodity swaps also to mitigate risk of loss on our fuel-related products inventory. The swaps matured at various dates through December 2008, resulting in aggregate net realized gains of $3.6 million, reflected in cost of sales, in fiscal 2009.
NOTE H – EARNINGS PER SHARE
Basic income per share is computed by dividing income available to common stockholders by the weighted average number of shares of common stock outstanding for the period. Diluted income per share reflects potential dilution that could occur if securities or other contracts to issue common stock were exercised or converted into common stock or resulted in the issuance of common stock that then shared in the income of the Company, subject to anti-dilution limitations.
62
Table of Contents
Index to Financial Statements
TPC Group Inc.
NOTES TO CONSOLIDATED FINANCIAL STATEMENTS – (Continued)
June 30, 2010, 2009 and 2008
Basic and diluted earnings per share are computed for the fiscal years ended June 30 as follows (in thousands, except per share amounts):
| 2010 | 2009 | 2008 | ||||||||
| Basic earnings per share: |
||||||||||
| Net income (loss) available to common shareholders |
$ | 30,541 | $ | (22,778 | ) | $ | 26,624 | |||
| Average common shares outstanding |
17,928 | 17,714 | 17,588 | |||||||
| Basic earnings per share |
$ | 1.70 | $ | (1.29 | ) | $ | 1.51 | |||
| Diluted earnings per share: |
||||||||||
| Net income (loss) available to common shareholders |
$ | 30,541 | $ | (22,778 | ) | $ | 26,624 | |||
| Average common shares outstanding |
17,928 | 17,714 | 17,588 | |||||||
| Add: Common stock equivalents: |
||||||||||
| Stock options and restricted stock |
2 | — | 485 | |||||||
| 17,930 | 17,714 | 18,073 | ||||||||
| Diluted earnings per share |
$ | 1.70 | $ | (1.29 | ) | $ | 1.47 | |||
| Anti-dilutive stock options not included in the treasury stock method |
246 | 1,467 | 215 | |||||||
| Average grant price of stock options not included in the treasury stock method |
$ | 25.23 | $ | 18.24 | $ | 25.90 | ||||
63
Table of Contents
Index to Financial Statements
TPC Group Inc.
NOTES TO CONSOLIDATED FINANCIAL STATEMENTS – (Continued)
June 30, 2010, 2009 and 2008
NOTE I – INCOME TAXES
Deferred tax assets and liabilities consist of tax effects of temporary differences and net operating loss and credit carry-forwards as of June 30 as follows (in thousands):
| 2010 | 2009 | |||||||
| Deferred tax assets: |
||||||||
| Loss and credit carry-forwards |
$ | 4,523 | $ | 47,859 | ||||
| Accrued and other expenses |
4,524 | 4,712 | ||||||
| Inventory |
3,026 | 1,885 | ||||||
| Derivative instruments |
— | 1,263 | ||||||
| Debt conversion cost |
2,556 | 4,269 | ||||||
| Stock award plans |
1,174 | 2,794 | ||||||
| Deferred revenue |
670 | — | ||||||
| 16,473 | 62,782 | |||||||
| Deferred tax liabilities: |
||||||||
| Property, plant and equipment |
(115,444 | ) | (104,162 | ) | ||||
| Deferred turnaround costs |
(4,140 | ) | (4,046 | ) | ||||
| Prepaid expenses |
(1,929 | ) | (2,023 | ) | ||||
| Intangible assets |
(330 | ) | (202 | ) | ||||
| Investment in limited partnership |
(31 | ) | (74 | ) | ||||
| (121,874 | ) | (110,507 | ) | |||||
| Net deferred tax liability |
$ | (105,401 | ) | $ | (47,725 | ) | ||
We file a consolidated federal tax return and state tax returns in Texas and Louisiana.
In August 2008, the Internal Revenue Service (IRS) completed an audit of tax years ended June 30, 2007 and 2006, and we have received a Form 4549 from the IRS confirming that there are no changes to the tax returns filed for those years or the amounts of taxes paid or refunded.
In March 2008, the Texas State Comptroller of Public Accounts completed a franchise tax audit for the period January 1, 2005 through December 31, 2007, and in July 2008 we received notification from the State of Texas that no additional taxes are due for this period.
Our provision for income taxes is comprised of the following for the fiscal years ended June 30 (in thousands):
| 2010 | 2009 | 2008 | ||||||||||
| Current: |
||||||||||||
| Federal |
$ | (38,402 | ) | $ | (6,849 | ) | $ | 396 | ||||
| State |
481 | 164 | (48 | ) | ||||||||
| Deferred |
||||||||||||
| Federal |
56,297 | (5,256 | ) | 14,035 | ||||||||
| State |
416 | 288 | 232 | |||||||||
| Total provision for income taxes |
$ | 18,792 | $ | (11,653 | ) | $ | 14,615 | |||||
64
Table of Contents
Index to Financial Statements
TPC Group Inc.
NOTES TO CONSOLIDATED FINANCIAL STATEMENTS – (Continued)
June 30, 2010, 2009 and 2008
The provision for income taxes differs from the amount computed by applying the statutory federal income tax rate to income before income taxes. The reasons for this difference for the fiscal years ended June 30 are as follows (in thousands):
| 2010 | 2009 | 2008 | ||||||||||
| Income (loss) before income taxes |
$ | 49,333 | $ | (34,431 | ) | $ | 41,239 | |||||
| Statutory federal income tax rate |
35 | % | 35 | % | 35 | % | ||||||
| Computed “expected” federal income tax (benefit) |
$ | 17,267 | $ | (12,051 | ) | $ | 14,434 | |||||
| Increase (decrease) in tax resulting from: |
||||||||||||
| Loss of domestic production deduction |
— | — | — | |||||||||
| as a result of 2009 NOL carry-back |
950 | — | — | |||||||||
| Domestic production deduction - current year |
(123 | ) | — | (29 | ) | |||||||
| State tax, net of federal benefit |
583 | 294 | 120 | |||||||||
| Other, net |
115 | 104 | 90 | |||||||||
| Total income tax provision (benefit) |
$ | 18,792 | $ | (11,653 | ) | $ | 14,615 | |||||
We have conducted an evaluation of tax positions taken on previous tax returns and/or to be taken in the future. Based on that evaluation, we concluded that it is more likely than not, based on the technical merits of our tax positions, that we are entitled to the economic benefits resulting from positions taken on our tax returns. Consequently, we have not recorded any liabilities related to uncertain tax positions and have not reversed any benefits previously recognized. Therefore, we have not recognized any interest or penalties related to uncertain tax positions.
Deferred taxes at June 30, 2009 include a deferred tax asset of $46.4 million, which is the tax effect of the fiscal 2009 net operating loss (NOL) carry-forward of $132.6 million. On November 6, 2009, the Worker, Homeownership and Business Assistance Act of 2009 was signed into law and extended the NOL carry-back period from two to three, four, or five years. As a result, in December 2009, after we filed our fiscal 2009 federal tax return, we applied to carry back $124.3 million of the fiscal 2009 NOL to offset taxable income for fiscal years 2004, 2005 and 2006 and to receive a refund of federal income taxes paid in those years. In February 2010, we received a refund of taxes paid in fiscal 2004, 2005 and 2006 in the amount of $39.8 million. The remaining $8.3 million of the fiscal 2009 NOL will be utilized to offset taxable income on the fiscal 2010 tax return. The fiscal 2010 current and deferred federal tax provisions reflect the impact of the change in tax law that resulted in realization during fiscal 2010 of the NOL carry-forward deferred tax asset recorded in deferred taxes at June 30, 2009.
NOTE J – SUPPLEMENTAL CASH FLOW DISCLOSURES
Cash paid for interest and taxes for the fiscal years ended June 30 are as follows (in thousands):
| 2010 | 2009 | 2008 | |||||||||
| Interest payments, net |
$ | 17,322 | $ | 15,770 | $ | 16,865 | |||||
| Income tax payments (refunds), net |
(38,148 | ) | (5,162 | ) | 4,452 | ||||||
Net income tax refund for fiscal 2010 reflects the fiscal 2009 NOL carry-back refund of $39.8 million.
Purchase of Business Assets
On June 27, 2006, we acquired a butadiene and related products manufacturing facility located in Port Neches, Texas from Huntsman Petrochemical Corporation and Huntsman Fuels, LP (collectively, “Huntsman”) for $278.8 million. Of the total purchase price, $208.8 million was funded at closing and financed through long-term debt. The additional $70.0 million payment was contingent upon certain milestones related to the restart and resumption of crude C4 supply from the Huntsman olefins unit located in Port Arthur, Texas, which had been damaged by fire prior to the acquisition. All of the contingencies related to the Port Arthur olefins unit were met, and the $70.0 million payment was made in November 2007. The $70.0 million contingent payment was also financed through long-term debt. We have no further contingent liabilities related to the acquisition.
65
Table of Contents
Index to Financial Statements
TPC Group Inc.
NOTES TO CONSOLIDATED FINANCIAL STATEMENTS – (Continued)
June 30, 2010, 2009 and 2008
NOTE K – COMMITMENTS AND CONTINGENCIES
We lease tank cars, barges and tug boats under non-cancelable operating leases. The future minimum lease payments under non-cancelable operating leases, in excess of one year, at June 30, 2010 consist of the following (in thousands):
| 2010 Transition period (six months) |
$ | 8,998 | |
| 2011 |
14,047 | ||
| 2012 |
7,808 | ||
| 2013 |
3,362 | ||
| 2014 |
560 | ||
| Thereafter |
803 | ||
| $ | 35,578 | ||
Total rent expense was $12.0 million, $12.8 million and $14.4 million for fiscal 2010, 2009 and 2008, respectively.
| 1. | Purchase Commitments |
We have purchase commitments incident to the ordinary conduct of business. The prices of such purchase commitments are based on indices, which are determined from the prevailing market rates for the associated products. These commitments generally have provisions permitting cancellation upon satisfaction of notification requirements.
| 2. | Legal Matters |
From time to time, we are party to routine litigation incidental to the normal course of our business, consisting primarily of claims for personal injury or exposure to our chemical products or feedstocks, and environmental matters. We intend to defend these actions vigorously and believe, based on currently available information, that adverse results or judgments from such actions, if any, will not be material to our financial condition or results of operations. We record reserves for contingencies when information available indicates that a loss is probable and the amount of the loss is reasonably estimable. Management’s judgment may prove materially inaccurate, and such judgment is subject to the uncertainty of litigation. Many of the personal injury or product exposure lawsuits to which we are a party are covered by insurance and are being defended by our insurance carriers. To the extent that we are named in any legal proceedings relating to the assets acquired from Huntsman Petrochemical Corporation and Huntsman Fuels, LP (collectively, “Huntsman”) on June 27, 2006 (the Port Neches Assets”) where the alleged events giving rise to the proceeding occurred prior to our ownership of the assets, we should be indemnified in such proceedings by Huntsman, subject to specified terms and limitations contained in the Purchased and Sales Agreement with Huntsman.
Our contractual arrangements with our customers and suppliers are typically very complicated and can include, for example, complex index-based pricing formulas that determine the price for our feedstocks or finished products. Due to the complicated nature of our contractual arrangements, we can, from time to time, be involved in disputes with our customers and suppliers regarding the interpretation of these contracts, including the index-based pricing formulas. These disputes occur in the normal course of our business, seldom result in actual formal litigation, and are typically resolved in the context of the broader commercial relationship that we have with the customer or supplier. As described above, we record reserves for contingencies when information available indicates that a loss is probable and the amount of the loss is reasonably estimable. Management’s judgment may prove materially inaccurate, and such judgment is subject to the uncertainty of the dispute resolution or litigation process.
| 3. | MTBE Litigation |
MTBE, or Methyl Tertiary Butyl Ether, is a product formerly made by our company at our Houston and Port Neches facilities. Our Houston facility still produces MTBE as an intermediary step for the production of some of our Performance Products and for limited sales in markets outside of the United States.
66
Table of Contents
Index to Financial Statements
TPC Group Inc.
NOTES TO CONSOLIDATED FINANCIAL STATEMENTS – (Continued)
June 30, 2010, 2009 and 2008
In March 2007, four local governmental authorities in the United States (City of Inverness Water District, City of Tampa Bay Water District, Homosassa Water District and the City of Crystal River) filed separate suits against our company and other co-defendants in the United States District Court for the Southern District of New York alleging that MTBE, a product made by several petrochemicals companies including our company, may have contaminated the soil and groundwater of their respective jurisdictions. Each of these governmental authorities sought more than $1.5 billion in compensatory and punitive damages from all of the defendants in the aggregate, including an unspecified amount of damages from us.
On March 31, 2009, eight local governmental authorities in the United States (South Farmingdale Water District, Plainview Water District, Oyster Bay Water District, Manhasset-Lakeville Water District, City of Glen Cove Water District, Garden City Park Water District, Incorporated Village of Garden City and Bethpage Water District) each filed additional separate suits against our company and other co-defendants alleging similar damages in the Supreme Court of the State of New York, County of Nassau. On March 31, 2009, four local governmental authorities in the United States (Town of Riverhead Water District, Town of Huntington/Dix Hills Water District, City of Greenlawn Water District and South Huntington Water District) each filed additional separate suits against our company and other co-defendants alleging similar damages in the Supreme Court of the State of New York, County of Suffolk. On May 12, 2009, Aqua New York of Sea Cliff, Inc., a local governmental authority in the United States, filed an additional separate suit against our company and other co-defendants alleging similar damages in the Supreme Court of the State of New York, County of Nassau. On August 31, 2009, Hampton Bays Water District, a local governmental authority in the United States, filed an additional separate suit against our company and other co-defendants alleging similar damages in the Supreme Court of the State of New York, County of Suffolk. Each of these governmental authorities sought more than $1.5 billion in compensatory and punitive damages from all of the defendants in the aggregate, including an unspecified amount of damages from us.
We defended these claims vigorously. In July 2010, we settled all of the eighteen cases described above for an aggregate amount of approximately $1.1 million, which amount was accrued in fiscal 2010 and paid in August 2010. Orders of dismissal have been entered by the respective courts in which the cases were pending. The Port Neches acquisition agreement with Huntsman includes an obligation of Huntsman to indemnify us for claims related to MTBE without monetary limitation for up to eight years from the June 2006 closing date for any claims arising from an act predating the acquisition. There can be no assurance as to when similar lawsuits and related issues may arise or be resolved or the degree of any adverse effect these matters may have on our financial condition and results of operations. A substantial settlement payment or judgment could result in a significant decrease in our working capital and liquidity and recognition of a loss in our consolidated statement of operations.
| 4. | Environmental and Safety Matters |
We are subject to extensive federal, state, local and foreign environmental laws, regulations, rules and ordinances. These include, for example:
| • | the federal Resource Conservation and Recovery Act (“RCRA”) and comparable state laws that impose requirements for the generation, handling, transportation, treatment, storage, disposal and cleanup of waste from our facilities; |
| • | the federal Comprehensive Environmental Response, Compensation, and Liability Act (“CERCLA”) also known as “Superfund,” and comparable state laws that regulate the cleanup of hazardous substances that may have been released at properties currently or previously owned or operated by us or locations to which we have sent waste for disposal; |
| • | the federal Clean Water Act (“CWA”) and analogous state laws and regulations that impose detailed permit requirements and strict controls on discharges of waste water from our facilities; |
| • | the federal Clean Air Act (“CAA”) and comparable state laws and regulations that impose obligations related to air emissions; and |
| • | federal and state laws and regulations currently under development to address greenhouse gas (“GHG”) emissions. |
In the ordinary course of business, we undertake frequent environmental inspections and monitoring and are subject to occasional investigations by governmental enforcement authorities. In addition, our production facilities require a number of environmental permits and authorizations that are subject to renewal, modification and, in certain circumstances, revocation. Actual or alleged violations of environmental laws or permit requirements or the discovery of releases of hazardous substances at or from our facilities could result in restrictions or prohibitions on plant operations, significant remedial expenditures, substantial civil or criminal sanctions, as well as, under some environmental laws, the assessment of strict and/or joint and several liabilities. Moreover, changes in environmental regulations could inhibit or interrupt our operations, or require us to modify our facilities or operations. Accordingly, environmental or regulatory matters may cause us to incur significant unanticipated losses, costs or liabilities.
67
Table of Contents
Index to Financial Statements
TPC Group Inc.
NOTES TO CONSOLIDATED FINANCIAL STATEMENTS – (Continued)
June 30, 2010, 2009 and 2008
We are committed to establishing and maintaining compliance with applicable environmental, health, safety (including process safety) and security (“EHS&S”) legal requirements, and we have developed policies and management systems intended to identify the various EHS&S legal requirements applicable to our operations and facilities, enhance and assure compliance with applicable requirements, ensure the safety of our employees, contractors, community neighbors and customers, and minimize the generation of wastes, the emission of air contaminants and the discharge of pollutants. These EHS&S management systems also serve to foster efficiency and improvement and to reduce operating risks.
The following is a summary of some of the existing laws, rules and regulations to which our business operations are subject.
Waste Management. The federal RCRA and comparable state statutes, laws and regulations regulate the generation, handling, transportation, treatment, storage, disposal and cleanup of hazardous and non-hazardous solid wastes. In the course of our operations, we generate industrial wastes that are regulated as hazardous wastes.
Comprehensive Environmental Response, Compensation, and Liability Act. The federal CERCLA and comparable state statutes, laws and regulations impose joint and several liability, without regard to fault or legality of conduct, on classes of persons who are considered to be responsible for the release of a hazardous substance into the environment. These persons include the current and past owner or operator of the site where the release occurred, and anyone who disposed or arranged for the disposal of a hazardous substance released at the site. Under CERCLA and comparable statutes, such persons may be subject to joint and several liability for the costs of cleaning up the hazardous substances that have been released into the environment, for damages to natural resources, and for the costs of certain environmental studies. In addition, it is not uncommon for neighboring landowners and other third parties to file claims for personal injury and property damage allegedly caused by the hazardous substances released into the environment.
Although we believe that we have utilized operating and waste disposal practices that were standard in the industry at the time, hazardous substances, wastes or hydrocarbons may have been released on or under the properties owned or operated by us, or on or under other locations, including off-site locations, where such substances have been taken for disposal. These properties and the substances disposed or released on them may be subject to CERCLA, RCRA, and analogous state laws. Under such laws, we could be required to remove previously disposed substances and wastes, or remediate contaminated property to prevent future contamination.
To the extent that liabilities arise from operations or events relating to our Port Neches facility that occurred prior to our ownership of the facility, we will generally be entitled to be indemnified by Huntsman for eight years after the June 2006 closing, subject to the terms and limitations of the indemnity provisions contained in the Purchase and Sale Agreement with Huntsman. We can provide no assurance, however, that all of such matters will be covered by the indemnity, that the indemnifying party will honor its obligations, or that the existing indemnities will be sufficient to cover the liabilities for such matters.
Water Discharges. The federal CWA and comparable state statutes, laws, and regulations impose restrictions and strict controls with respect to the discharge of pollutants in waste water and storm water, including spills and leaks of oil and other substances, into regulated waters. The discharge of pollutants into regulated waters is prohibited, except in accordance with the terms of a permit issued by the United States Environmental Protection Agency (“EPA”) or an analogous state agency. Spill prevention, control and countermeasure requirements may require appropriate containment berms and similar structures to help prevent the contamination of regulated waters in the event of a petroleum hydrocarbon tank spill, rupture or leak. Regulatory agencies can also impose administrative, civil and criminal penalties for non-compliance with discharge permits or other requirements of the Clean Water Act and analogous state laws and regulations.
Air Emissions. The federal CAA and comparable state statutes, laws and regulations regulate emissions of various air pollutants or contaminants through air emissions permitting programs and the imposition of other requirements. Such laws and regulations may require a facility to obtain pre-approval for the construction or modification of projects or facilities expected to emit air contaminants or result in the increase of existing emissions of air contaminants, and to obtain and strictly comply with air permits containing various emissions limitations and operational requirements, including the utilization of specific emission control technologies to limit emissions of particular pollutants. In addition, the EPA and state regulatory agencies have developed, and continue to develop, stringent regulations governing emissions of air contaminants at specified sources. Regulatory agencies can also impose administrative, civil and criminal penalties for non-compliance with air permits or other legal requirements regarding air emissions. Depending on the state-specific statutory authority, individual states may be able to impose air emissions limitations that are more stringent than the federal standards imposed by the EPA.
68
Table of Contents
Index to Financial Statements
TPC Group Inc.
NOTES TO CONSOLIDATED FINANCIAL STATEMENTS – (Continued)
June 30, 2010, 2009 and 2008
Permits and related compliance obligations under the CAA, as well as changes to state implementation plans for controlling air emissions in regional non-attainment areas, including the Houston-Galveston-Brazoria ozone non-attainment area, may require our operations to incur future capital expenditures in connection with the addition or modification of existing air emission control equipment and strategies. For example, as part of our efforts to comply with rules changes related to the emissions of nitrogen oxides (“NOx”) from our facilities, we installed two new, low-NOx boilers at each of our Houston and Port Neches facilities in fiscal 2006 through 2008, for a total capital investment of approximately $40 million. Failure to comply with these emission control requirements could subject us to monetary penalties, injunctions, conditions or restrictions on operations and enforcement actions. Our facilities may also be required to incur certain capital expenditures in the future for air pollution control equipment in connection with obtaining and maintaining operating permits and approvals for air emissions.
Legislative and regulatory measures to address concerns that emissions of certain gases, commonly referred to as GHGs, including carbon dioxide, may be contributing to warming of the Earth’s atmosphere are in various phases of discussions or implementation at the international, national, regional and state levels. The petrochemical industry is a direct source of certain GHG emissions, namely carbon dioxide, and future restrictions on such emissions could impact our future operations. In the United States, federal legislation imposing restrictions on GHG is under consideration. In addition, EPA has promulgated a series of rulemakings and other actions that EPA states will result in the regulation of GHGs as pollutants under the CAA. In April 2010, EPA promulgated final motor vehicle GHG emission standards, which take effect in model year 2012. According to EPA, the motor vehicle GHG emission standards will trigger construction and operating permitting requirements for stationary sources of GHG emissions beginning January 2, 2011. In May 2010, EPA finalized the Prevention of Significant Deterioration and Title V GHG Tailoring Rule, which phases in permitting requirements for stationary sources of GHG emissions, beginning January 2, 2011 through July 30, 2013. These EPA rulemakings could affect our operations and ability to obtain air permits for new or modified facilities. Furthermore, in 2010, EPA regulations became effective that require monitoring and reporting of GHG emissions on an annual basis, including extensive GHG monitoring and reporting requirements. Although this new rule does not control GHG emission levels from any facilities, it will cause us to incur monitoring and reporting costs. Moreover, lawsuits have been filed seeking to require individual companies to reduce GHG emissions from their operations. These and other lawsuits relating to GHG emissions may result in decisions by state and federal courts and agencies that could impact our operations and ability to obtain certifications and permits to construct future projects.
Passage of climate change legislation or other federal or state legislative or regulatory initiatives that regulate or restrict GHG emissions in areas in which we conduct business could adversely affect the demand for our products, and depending on the particular program adopted, could increase the costs of our operations, including costs to operate and maintain our facilities, to install new emission controls on our facilities, to acquire allowances to authorize our GHG emissions, to pay any taxes related to our GHG emissions and/or to administer and manage a GHG emissions program. At this time, it is not possible to accurately estimate how laws or regulations addressing GHG emissions would impact our business, but we do not believe that the impact on us will be any more burdensome to us than to any other similarly situated companies.
In addition to potential impacts on our business resulting from climate-change legislation or regulations, our business also could be negatively affected by climate-change related physical changes or changes in weather patterns. A loss of coastline in the vicinity of our facilities, which are located near the Gulf of Mexico, or an increase in severe weather patterns, could result in damages to or loss of our physical assets and/or a disruption of our supply and distribution channels. Changes of this nature could have a material adverse impact on our business. In addition to potential direct impacts on us, climate change legislation or regulation and climate change related physical changes could affect entities that provide goods and services to us and indirectly have an adverse effect on our business as result of increases in the costs or availability of such goods or services. At this time, it is not possible to accurately project the effects of any such indirect impacts.
In addition to the requirements imposed upon us by law, we also enter into other agreements from time to time with state and local environmental agencies either to avoid the risks of potential regulatory action against us or to implement improvements that exceed current legal requirements. To that end, we have entered into the following agreements that will require us to reduce our emissions of butadiene and other volatile organic compounds at our Houston facility as described below:
| • | In June 2005, we executed a Voluntary Emissions Reduction Agreement (“VERA”) with the Texas Commission on Environmental Quality (“TCEQ”), in which we agreed to reduce emissions of butadiene from three main sources at our Houston facility by fifty percent by the end of December 2008. We were in substantial compliance with the reduced emissions |
69
Table of Contents
Index to Financial Statements
TPC Group Inc.
NOTES TO CONSOLIDATED FINANCIAL STATEMENTS – (Continued)
June 30, 2010, 2009 and 2008
| threshold by the agreed deadline. In addition to the emissions reductions, we committed to a series of operational initiatives, including the installation of a state-of-the-art fence line monitoring system to detect emissions at our Houston facility. Similarly, in December 2005, we entered into a Settlement Agreement with the City of Houston (“COH”), in which we agreed to many of the same emissions reductions and operational commitments contained in the VERA in exchange for a global release by COH of potential claims that could be asserted against us related to past emissions events. |
| • | In January 2009, we signed an Agreed Corrective Action Order (“ACAO”) with TCEQ related to our Houston facility. The ACAO was approved by the TCEQ Commissioners in April 2009 following a public agenda hearing. The ACAO obligates us to undertake a five-year, $20 million incremental spending program on projects designed to enhance environmental performance that would not normally have been done as part of routine maintenance at our Houston facility. We expect to implement the required measures and incur the incremental spending through a combination of (a) increases in our annual maintenance and capital expenditures throughout the five-year period and (b) additional expenditures in connection with our regularly scheduled turnarounds (typically occurring every three to four years). We expect to fund the incremental expenditures from our operations and/or from borrowings under our Revolving Credit Facility and do not expect the expenditures to have a material impact on our operations or liquidity. In the ACAO, we also commit to reduce emissions of volatile organic compounds from discrete emissions events at our Houston facility on a rolling twelve-month basis by more than thirty-five percent of annual pre-ACAO levels. We are currently in compliance with all requirements in the ACAO. |
Chemical Product Safety Regulation. The products we make are subject to laws and regulations governing chemical product safety, including the federal Toxic Substances Control Act (“TSCA”) and chemical product safety laws in jurisdictions outside the United States where our products are distributed. The goal of TSCA is to prevent unreasonable risks of injury to health or the environment associated with the manufacture, processing, distribution in commerce, use or disposal of chemical substances. Under TSCA, the EPA has established reporting, record-keeping, testing and control-related requirements for new and existing chemicals with which we must comply. In December 2006, the European Union adopted a new regulatory framework concerning the Registration, Evaluation and Authorization of Chemicals (known as REACH), which became effective on June 1, 2007. One of its main objectives is the protection of human health and the environment. REACH requires manufacturers and importers to gather information on the properties of their substances that meet certain volume or toxicological criteria and register the information in a central database to be maintained by a Chemical Agency in Finland. REACH also contains a mechanism for the progressive substitution of the most dangerous chemicals when suitable alternatives have been identified. We met the deadline of December 1, 2008 for the pre-registration of those chemicals manufactured in, or imported into, the European Economic Area in quantities of one metric ton or more that were not otherwise exempted. Complete registrations containing extensive data on the characteristics of the chemicals will be required in three phases, depending on production usage or tonnage imported per year, and the toxicological criteria of the chemicals. The first registrations are required in 2010; subsequent registrations are due in 2013 and 2018. The toxicological criteria considered for registration determinations are carcinogenicity, mutagenicity, reproductive toxicity (category 1 and 2), and aquatic toxicity. By June 1, 2013, the European Commission will review whether substances with endocrine disruptive properties should be authorized if safer alternatives exist. By June 1, 2019, the European Commission will determine whether to extend the duty to warn from substances of very high concern to those that could be dangerous or unpleasant. We do not expect that the costs to comply with current chemical product safety requirements or REACH will be material to our operations or financial position. It is possible that other regions in which we operate could follow the European Union approach and adopt more stringent chemical product safety requirements.
Health and Safety Regulation. We are subject to the requirements of the federal Occupational Safety and Health Act and comparable state statutes, laws and regulations. These laws and the implementing regulations strictly govern the protection of the health and safety of employees. The Occupational Safety and Health Administration’s (“OSHA”) hazard communication standard, the EPA’s community right-to-know regulations under the Title III of CERCLA and similar state laws require that we organize and/or disclose information about hazardous materials used or produced in our operations.
Our operations are also subject to standards designed to ensure the safety of our processes, including OSHA’s Process Safety Management standard. The Process Safety Management standard imposes requirements on regulated entities relating to the management of hazards associated with highly hazardous chemicals. Such requirements include conducting process hazard analyses for processes involving highly hazardous chemicals, developing detailed written operating procedures, including procedures for managing change, and evaluating the mechanical integrity of critical equipment. As a result of a process safety audit of our Houston plant conducted by OSHA’s local office under its process safety Regional Emphasis Program, we entered into a compliance agreement on October 6, 2007 with OSHA, which agreement requires us to implement certain corrective actions on a three-year timetable through June 2010. We met all of the abatement and corrective action requirements in compliance with the deadlines in the compliance agreement.
70
Table of Contents
Index to Financial Statements
TPC Group Inc.
NOTES TO CONSOLIDATED FINANCIAL STATEMENTS – (Continued)
June 30, 2010, 2009 and 2008
Security Regulation. We are subject to the requirements of the United States Department of Homeland Security’s Chemical Facility Anti-Terrorism Standard at our Baytown facility and the Marine Transportation Security Act at our Houston, Port Neches, and Lake Charles facilities. These requirements establish minimum standards for security at chemical facilities and marine-based chemical facilities, respectively. We are currently in the process of scope definition and engineering design of facility modifications for compliance with these requirements. Under the Marine Transportation Security Act, we have been awarded partial grants to assist with compliance at the Port Neches and Houston facilities.
NOTE L – EMPLOYEE BENEFITS
| 1. | Retirement Plan |
We sponsor a defined contribution plan that is available to all full-time employees after the first day of the month following their employment date. Employees can contribute up to 25% of their base compensation to a tax-deferred fund not to exceed $16,500 for 2010 and 2009 and $15,500 for 2008. We match at the rate of one dollar for each dollar contributed by the employee up to 5% of such employee’s base compensation and company contributions vest over a period of five years at 20% per year. Our expense to match employee contributions was approximately $2.1 million, $2.0 million, and $2.1 million for fiscal 2010, 2009 and 2008, respectively. Additionally, we made discretionary quarterly contributions to the plan of approximately $1.0 million, $0.5 million, and $0.9 million for fiscal 2010, 2009 and 2008, respectively.
| 2. | Stock Compensation Plans |
In December 2004, our stockholders approved the 2004 Stock Award Plan (the “Plan”). In March 2006, we amended the Plan to authorize up to an additional 788,433 shares of common stock under the Plan. The Plan authorized 2,613,317 shares of our common stock in the form of 1,331,722 stock options and 1,281,595 restricted stock awards for issuance to certain of our directors, officers and employees. The stock option and restricted stock awards under the Plan vest in a period of five years or less. While the Plan expires on its own terms effective December 15, 2010 for purposes of new grants, certain awards remain in effect after the Plan’s expiration date, per the terms of the award agreements.
In November 2008, our stockholders approved the 2009 Long Term Incentive Plan (the “2009 Plan”), which authorizes up to 1,125,000 shares of common stock for awards granted in whole or in part, in common stock, including rights or options which may be exercised for or settled in common stock. Awards under the 2009 Plan vest over a period of ten years or less, per the terms of the award agreements. The 2009 Plan expires on its own terms effective November 11, 2018 for purposes of new grants.
71
Table of Contents
Index to Financial Statements
TPC Group Inc.
NOTES TO CONSOLIDATED FINANCIAL STATEMENTS – (Continued)
June 30, 2010, 2009 and 2008
The following table summarizes the activity under the 2004 and 2009 Plans for fiscal 2010 and 2009 and the number of stock awards available and outstanding at June 30, 2010 and 2009:
| 2004 Stock Award Plan | 2009 Long Term Incentive Plan | ||||||||||||||||
| Available | Stock options |
Restricted stock |
Available | Performance unit awards |
Restricted stock units |
Restricted stock | |||||||||||
| Balance at July 1, 2008 |
4 | 1,183,599 | 558,428 | — | — | — | — | ||||||||||
| Shares authorized |
— | — | — | 1,125,000 | |||||||||||||
| Granted |
— | — | — | — | — | — | — | ||||||||||
| Forfeited/Expired |
9,800 | (8,500 | ) | (1,300 | ) | — | — | — | — | ||||||||
| Exercised/Vested |
— | (3,000 | ) | (261,730 | ) | — | — | — | — | ||||||||
| Balance at June 30, 2009 |
9,804 | 1,172,099 | 295,398 | 1,125,000 | — | — | — | ||||||||||
| Granted |
— | — | — | (190,823 | ) | 98,195 | 38,280 | 54,348 | |||||||||
| Forfeited/Expired |
658,230 | (604,786 | ) | (53,444 | ) | — | — | — | — | ||||||||
| Exercised/Vested |
— | (298,446 | ) | (217,219 | ) | — | — | — | — | ||||||||
| Balance at June 30, 2010 |
668,034 | 268,867 | 24,735 | 934,177 | 98,195 | 38,280 | 54,348 | ||||||||||
Upon option exercises shares are issued out of the shares reserved that are authorized under the plans.
We recognize deferred tax benefits as we recognize stock-based compensation expense over the vesting period; however, actual tax deductions are typically not realized until the time stock options are exercised or restricted stock grants vest. If the actual tax deduction exceeds the cumulative compensation expense recognized in the financial statements, the tax benefit associated with such excess deduction is considered to be a “windfall” benefit and is recognized as additional paid-in capital (APIC). If the actual tax deduction is less than the cumulative compensation expense recognized, the difference is considered to be a “shortfall” and the associated deferred tax benefit is charged to APIC to the extent of the accumulated amount of previously recognized windfalls, with any remainder charged to income tax expense.
Stock-based compensation expense for the fiscal 2010, 2009 and 2008 was $1.2 million, $7.1 million and $7.3 million, respectively, and was recorded as a component of general and administrative expense in the accompanying Consolidated Statements of Operations. The fair value of the shares that vested in fiscal 2010 is $1.1 million. The tax benefits related to stock-based compensation included in income tax expense for fiscal 2010, 2009 and 2008 was $0.4 million, $2.5 million and $2.6 million, respectively.
The tax deduction related to stock-based compensation for fiscal 2010 was $2.9 million, for which the tax benefit was deferred as part of the net operating loss carry forward deferred tax asset.
Tax benefit windfalls are reported in the Consolidated Statements of Cash Flows as inflows from financing activities with offsetting outflows from operating activities, and tax benefit shortfalls are reported as outflows from operating activities. Tax benefit windfalls for fiscal 2010, 2009 and 2008 were $0.3 million, $0.2 million and $0.8 million, respectively. Tax benefit shortfalls for fiscal 2010, 2009 and 2008 were $1.4 million, $0.6 million and $0.0 million respectively.
The fair value of options granted is estimated on the date of grant using a Black-Scholes option pricing model based on the assumptions in the table below:
| 2010 | 2009 | 2008 | |||||
| Expected term (years) |
N/A | N/A | 4.5 | ||||
| Risk-free interest rate |
N/A | N/A | 3.6 | % | |||
| Volatility |
N/A | N/A | 22.3 | % | |||
| Dividend yield |
N/A | N/A | 0.0 | % | |||
72
Table of Contents
Index to Financial Statements
TPC Group Inc.
NOTES TO CONSOLIDATED FINANCIAL STATEMENTS – (Continued)
June 30, 2010, 2009 and 2008
No options were granted during fiscal 2009 or 2010.
The expected term of the options is based on evaluations of historical and expected future employee exercise behavior. The risk-free interest rate is based on the U.S. Treasury rate at the date of grant with maturity dates approximately equal to the expected life at the grant date. Volatility is based on historical volatility of our stock. We have not historically paid any dividends.
The following table summarizes the components of our stock-based compensation programs recorded as expense for the fiscal years ended June 30 (in thousands):
| 2010 | 2009 | 2008 | ||||||||||
| Restricted stock, restricted stock units and performance units: |
||||||||||||
| Pretax compensation expense |
$ | 1,054 | $ | 5,460 | $ | 5,569 | ||||||
| Tax benefit |
(369 | ) | (1,911 | ) | (1,949 | ) | ||||||
| Expense, net of tax |
685 | 3,549 | 3,620 | |||||||||
| Stock options: |
||||||||||||
| Pretax compensation expense |
129 | 1,680 | 1,754 | |||||||||
| Tax benefit |
(45 | ) | (588 | ) | (614 | ) | ||||||
| Expense, net of tax |
84 | 1,092 | 1,140 | |||||||||
| Total stock based compensation: |
||||||||||||
| Pretax compensation expense |
1,183 | 7,140 | 7,323 | |||||||||
| Tax benefit |
(414 | ) | (2,499 | ) | (2,563 | ) | ||||||
| Expense, net of tax |
$ | 769 | $ | 4,641 | $ | 4,760 | ||||||
As of June 30, 2010, we had unrecognized compensation cost of $2.4 million related to restricted stock, restricted stock units and performance unit awards and $0.1 million related to stock options. The unrecognized compensation costs are expected to be recognized over a weighted average period of approximately 2.5 years for the restricted stock, restricted stock units and performance unit awards and over the next year with respect to stock options.
The following table summarizes the option activity under the 2004 Plan for fiscal 2010 and the status as of June 30, 2010:
| Number of options |
Weighted average exercise price |
Weighted average remaining contractual life in years |
Aggregate intrinsic value | ||||||||
| Outstanding at June 30, 2009 |
1,172,099 | $ | 17.41 | ||||||||
| Granted |
— | — | |||||||||
| Canceled |
(604,786 | ) | 15.81 | ||||||||
| Exercised |
(298,446 | ) | 14.25 | ||||||||
| Outstanding at June 30, 2010 |
268,867 | $ | 24.27 | 1.9 | $ | 57,375 | |||||
| Fully vested and expected to vest at June 30, 2010 |
268,267 | $ | 24.27 | 1.9 | $ | 57,375 | |||||
| Exercisable at June 30, 2010 |
255,867 | $ | 24.18 | 1.8 | $ | 57,375 | |||||
73
Table of Contents
Index to Financial Statements
TPC Group Inc.
NOTES TO CONSOLIDATED FINANCIAL STATEMENTS – (Continued)
June 30, 2010, 2009 and 2008
The weighted average grant-date fair value of options granted during fiscal 2008 was $4.83. The aggregate intrinsic value in the table above represents the total pre-tax intrinsic value that would have been received by the option holders had all option holders exercised their options on June 30, 2010. The aggregate intrinsic value represents the aggregate amount by which our closing stock price on the last trading day of fiscal year 2010 exceeded the exercise price of each outstanding stock option. Aggregate intrinsic value will change based on the fair market value of our stock. The total intrinsic value of stock options exercised during fiscal 2010, 2009 and 2008 was $2.0 million, $0.0 million and $0.2 million, respectively.
We received cash from options exercised during fiscal 2010, 2009 and 2008 of $3.0 million, $0.0 million and $0.2 million, respectively. The impact of these cash receipts is included in financing activities in the accompanying Consolidated Statements of Cash Flows.
| 3. | Defined Benefit Pension Plan |
On January 1, 2007, we established a cash balance plan for the benefit of represented employees at the Port Neches facility acquired from Huntsman in June 2006. Participation in the cash balance plan is subject to terms of negotiated contracts. For participating employees, the cash balance plan benefit formula provides annual pay credits from 4% to 12% of eligible pay, depending on age and service, plus accrued interest. Participants with service under the Huntsman defined benefit plan may be eligible for additional annual pay credits from 1% to 8%, depending on their age and service as of that date, for up to five years. The plan’s assets are maintained by trustees in separately managed portfolios consisting of equity and fixed income securities.
The components of the change in benefit obligation, the change in plan assets and the development of the liabilities recognized in the Consolidated Balance Sheets as of June 30 are as follows (in thousands):
| 2010 | 2009 | |||||||
| Change in benefit obligation: |
||||||||
| Benefit obligation at beginning of year |
$ | 3,563 | $ | 1,877 | ||||
| Service cost |
1,325 | 1,334 | ||||||
| Interest cost |
220 | 128 | ||||||
| Actuarial loss |
378 | 240 | ||||||
| Benefit payments |
(710 | ) | (16 | ) | ||||
| Benefit obligation at end of year |
4,776 | 3,563 | ||||||
| Change in plan assets: |
||||||||
| Fair value of plan assets at beginning of year |
2,129 | 1,250 | ||||||
| Actual return on plan assets |
319 | (310 | ) | |||||
| Employer contributions |
1,788 | 1,209 | ||||||
| Benefit payments |
(710 | ) | (16 | ) | ||||
| Expenses |
(4 | ) | (4 | ) | ||||
| Fair value of plan assets at end of year |
3,522 | 2,129 | ||||||
| Funded status, end of year |
$ | (1,254 | ) | $ | (1,434 | ) | ||
| Reconciliation of accrued liability: |
||||||||
| Accrued liability at beginning of year |
$ | (494 | ) | $ | (310 | ) | ||
| Net periodic pension cost for the year |
(1,464 | ) | (1,393 | ) | ||||
| Employer contributions |
1,788 | 1,209 | ||||||
| (170 | ) | (494 | ) | |||||
| Accumulated amounts recognized in OCI (before tax) |
(1,084 | ) | (940 | ) | ||||
| Total liability recognized in balance sheet - accrued liabilities |
$ | (1,254 | ) | $ | (1,434 | ) | ||
74
Table of Contents
Index to Financial Statements
TPC Group Inc.
NOTES TO CONSOLIDATED FINANCIAL STATEMENTS – (Continued)
June 30, 2010, 2009 and 2008
Net periodic pension cost for the fiscal years ended June 30 consists of the following components (in thousands):
| 2010 | 2009 | 2008 | |||||||||
| Components of net periodic pension cost: |
|||||||||||
| Service cost |
$ | 1,325 | $ | 1,334 | $ | 1,141 | |||||
| Interest cost |
220 | 128 | 35 | ||||||||
| Expected return on assets |
(138 | ) | (81 | ) | 2 | ||||||
| Amortization of actuarial loss |
57 | 12 | 2 | ||||||||
| $ | 1,464 | $ | 1,393 | $ | 1,180 | ||||||
The projected net periodic pension cost for the six month transition period ending December 31, 2010 consists of the following components (in thousands):
| Service cost |
$ | 662 | ||
| Interest cost |
125 | |||
| Expected return on assets |
(108 | ) | ||
| Amortization of actuarial loss |
30 | |||
| $ | 709 | |||
Weighted average assumptions used to determine benefit obligations and net periodic benefit cost as of June 30 are as follows:
| 2010 | 2009 | 2008 | |||||||
| Discount rate |
6.20 | % | 6.82 | % | 6.50 | % | |||
| Expected return on plan assets |
6.50 | % | 6.50 | % | 6.50 | % | |||
| Rate of compensation increase |
4.50 | % | 4.50 | % | 4.50 | % | |||
We use a June 30 measurement date for our defined benefit pension plan. Our pension plan assets are managed by outside investment managers. Our investment strategy with respect to pension plan assets is to maximize returns while preserving principal. At June 30, 2010, pension plan assets were invested 78.5% in equity securities, 18.5% in debt securities and 3.0% in cash equivalents. The expected return on assets assumption was determined based on the anticipated performance of the various asset classes in the plan’s portfolio.
The following benefit payments are expected to be paid to eligible plan participants under our defined benefit pension plan (in thousands):
| 2010 Transition period (six months) |
$ | 280 | |
| 2011 |
293 | ||
| 2012 |
277 | ||
| 2013 |
345 | ||
| 2014 |
273 | ||
| 2015 - 2019 |
2,094 |
NOTE M – CONCENTRATION RISKS
We had sales of $156.7 million, $90.5 million and $78.5 million to customers outside the United States during the fiscal 2010, 2009 and 2008, respectively.
75
Table of Contents
Index to Financial Statements
TPC Group Inc.
NOTES TO CONSOLIDATED FINANCIAL STATEMENTS – (Continued)
June 30, 2010, 2009 and 2008
Sales to customers who accounted for at least 10% of our annual sales for the fiscal years ended June 30 are as follows:
| 2010 | 2009 | 2008 | |||||||
| Goodyear Tire & Rubber Company |
10 | % | 14 | % | 12 | % | |||
We perform ongoing credit evaluations of our customers and generally do not require collateral for accounts receivable. Historically, our credit losses have been minimal.
Customers who accounted for at least 10% of our accounts receivable balance as of the fiscal years ended June 30 are as follows:
| 2010 | 2009 | |||||
| Dow Chemical Company |
11 | % | 4 | % | ||
| Motiva Enterprises LLC |
5 | % | 11 | % | ||
| SI Group Inc. |
8 | % | 15 | % | ||
| Valero Marketing and Supply Company |
4 | % | 12 | % | ||
We maintain our cash deposits and short-term investments with a major bank and a major financial services company. At various times during fiscal 2010, our balances significantly exceed the federally insured limits. Management assesses the financial condition of these institutions and believes that the likelihood of any possible credit loss is remote.
A small number of suppliers for our feedstocks account for a significant percentage of our feedstock purchases. Our top five suppliers accounted for an aggregate of, 35.7%, 34.6% and 31.5% of our vendor purchases in fiscal 2010, 2009 and 2008, respectively.
Some of the employees at our Port Neches facility are covered by collective bargaining agreements that expire in February 2012. To the extent that we experience work stoppages in the future as a result of labor disagreements, a prolonged labor disturbance at one or more of our facilities could have a material adverse effect on our operations.
NOTE N – RELATED PARTY TRANSACTIONS
We have a 50% limited partnership interest in Hollywood/Texas Petrochemicals LP. We and Kirby Inland Marine, Inc. formed the limited partnership to operate four barges capable of transporting chemicals. During fiscal 2010, 2009 and 2008, we paid Kirby Inland Marine, Inc. $13.7 million, $16.0 million and $16.1 million, respectively, for barge and tug boat services. As of June 30, 2010 and 2009, we owed Kirby Inland Marine, Inc, $0.5 million and $0.5 million, respectively.
NOTE O – SEGMENT INFORMATION
We manage our core business as two operating segments based on the products we offer and the markets we serve. Our organizational structure is designed to most effectively manage our business segments and service the needs of our customers. Our operating segments are the C4 Processing business and the Performance Products business.
In the C4 Processing segment, we process the crude C4 stream into several higher value components, namely butadiene, butene-1, raffinates and MTBE. In our Performance Products segment, we produce high purity isobutylene, and we process isobutylene to produce higher value derivative products, such as polyisobutylene and diisobutylene. We also process refinery grade propylene into nonene, tetramer and associated by-products. With the completion of our isobutylene processing unit in the first quarter of fiscal 2008, we idled our Houston dehydrogenation units and stopped production of MTBE from those units. Subsequent to the dehydrogenation units being idled, MTBE has been produced only from our C4 processing activities at significantly reduced volumes, and is used either as a feedstock to the Performance Products segment or sold opportunistically into overseas markets. From third quarter of fiscal 2008 forward, MTBE revenues and operating results are included in our C4 Processing segment category for reporting purposes.
We produce steam and electricity for our own use at our Houston facility and we sell a portion of our steam production as well as excess electricity. The revenues and expenses related to sale of steam and electricity are not significant and are included in the C4 Processing segment.
76
Table of Contents
Index to Financial Statements
TPC Group Inc.
NOTES TO CONSOLIDATED FINANCIAL STATEMENTS – (Continued)
June 30, 2010, 2009 and 2008
The primary products produced in our C4 Processing segment and their primary uses are as follows:
| • | Butadiene - primarily used to produce synthetic rubber that is mainly used in tires and other automotive products; |
| • | Butene-1 - primarily used in the manufacture of plastic resins and synthetic alcohols; |
| • | Raffinates - primarily used in the manufacturing of alkylate, a component of premium unleaded gasoline; and |
| • | Methyl Tertiary Butyl Ether (“MTBE”) - primarily used as a gasoline blending stock. |
The primary products produced in our Performance Products segment and their primary uses are as follows:
| • | High purity isobutylene (“HPIB”) - primarily used in the production of synthetic rubber, lubricant additives, surfactants and coatings; |
| • | Conventional polyisobutylenes (“PIB”) and highly reactive polyisobutylenes (“HR-PIB”) - primarily used in the production of fuel and lubricant additives, caulks, adhesives, sealants and packaging; |
| • | Diisobutylene - primarily used in the manufacture of surfactants, plasticizers and resins; and |
| • | Nonene and tetramer - primarily used in the production of plasticizers, surfactants, and lubricant additives. |
| 1. | Reportable Segments |
The following table provides sales volumes (unaudited), revenues, cost of sales, operating expenses, and Adjusted EBITDA by reportable segment for the periods presented. The table also provides a reconciliation of Adjusted EBITDA to Net Income, the most direct comparative GAAP measure reported in the Consolidated Statements of Operations. Adjusted EBITDA is not a measure computed in accordance with GAAP. Accordingly it does not represent cash flow from operations, nor is it intended to be presented herein as a substitute to operating income or net income as indicators of our operating performance. We calculate Adjusted EBITDA in accordance with our credit facilities, meaning earnings before interest, taxes, depreciation and amortization, then adjusted to add back certain additional items. Such additional items include certain non-cash items defined by the credit facilities and reflected in the Reconciliation of Adjusted EBITDA to Net Income below. Our calculation of Adjusted EBITDA may be different from the calculation used by other companies; therefore, it may not be comparable to other companies.
Adjusted EBITDA is the primary performance measurement used by senior management and our Board of Directors to evaluate operating results and to allocate capital resources between our business segments. We also are presenting Adjusted EBITDA because our lenders require us to report this measure (referred to as Consolidated EBITDA in the credit facilities) to them, and the measure is used in ratio calculations that affect our ability to pay dividends and other distributions, and to make certain investments and acquisitions, in compliance with covenants under our credit facilities.
77
Table of Contents
Index to Financial Statements
TPC Group Inc.
NOTES TO CONSOLIDATED FINANCIAL STATEMENTS – (Continued)
June 30, 2010, 2009 and 2008
Financial results by operating segment for the fiscal years ended June 30 are as follows (in thousands):
| 2010 | 2009 | 2008 | ||||||||||
| Sales volumes (lbs) (unaudited) (1): |
||||||||||||
| C4 Processing |
2,441,304 | 2,270,670 | 2,802,257 | |||||||||
| Performance Products |
601,590 | 576,550 | 732,439 | |||||||||
| MTBE (2) |
— | — | 172,596 | |||||||||
| 3,042,894 | 2,847,220 | 3,707,292 | ||||||||||
| Revenues: |
||||||||||||
| C4 Processing |
$ | 1,328,687 | $ | 1,061,939 | $ | 1,483,736 | ||||||
| Performance Products |
359,797 | 314,935 | 466,352 | |||||||||
| MTBE (2) |
— | — | 66,110 | |||||||||
| $ | 1,688,484 | $ | 1,376,874 | $ | 2,016,198 | |||||||
| Cost of sales (3): |
||||||||||||
| C4 Processing (4) |
$ | 1,157,899 | $ | 940,798 | $ | 1,306,666 | ||||||
| Performance Products |
286,257 | 253,375 | 386,340 | |||||||||
| MTBE (2) |
— | — | 59,185 | |||||||||
| $ | 1,444,156 | $ | 1,194,173 | $ | 1,752,191 | |||||||
| Operating expenses (3): |
||||||||||||
| C4 Processing |
$ | 96,614 | $ | 98,442 | $ | 93,947 | ||||||
| Performance Products |
36,567 | 33,826 | 36,527 | |||||||||
| MTBE (2) |
— | — | 717 | |||||||||
| $ | 133,181 | $ | 132,268 | $ | 131,191 | |||||||
| Adjusted EBITDA (unaudited) (5): |
||||||||||||
| C4 Processing (4) |
$ | 91,225 | $ | 37,391 | $ | 82,624 | ||||||
| Performance Products |
36,974 | 27,736 | 43,485 | |||||||||
| MTBE (2) |
— | — | 6,207 | |||||||||
| Corporate |
(26,368 | ) | (24,835 | ) | (28,778 | ) | ||||||
| $ | 101,831 | $ | 40,292 | $ | 103,538 | |||||||
| (1) | Sales volumes represent product sales volumes only and do not include volumes of products delivered under tolling or similar arrangements, in which we do not purchase the raw materials, but process raw materials for another party for a specified fee. |
| (2) | As reported in the above table, the “MTBE” segment represents MTBE produced by our Houston dehydrogenation units. In conjunction with the start-up of our isobutylene processing unit in the first quarter of fiscal 2008, the dehydrogenation units were idled and all MTBE produced from those units was sold by the end of the second quarter of fiscal 2008. Beginning with third quarter of fiscal 2008, MTBE production as a byproduct of the crude C4 isobutylene process was insignificant, and related revenues and operating results were included in the C4 Processing segment. |
| (3) | Does not include depreciation and amortization expense. |
| (4) | C4 Processing segment Adjusted EBITDA for fiscal 2010 reflected the second and final installment of our business interruption insurance claim of $17.1 million (net of expenses) and fiscal 2009 Adjusted EBITDA reflect the first installment of the insurance claim of $10.0 million as well as the unauthorized freight payment recovery of $4.7 million. |
| (5) | See above for further discussion of Adjusted EBITDA and below for a reconciliations of Adjusted EBITDA to Net Income (Loss) for the years presented. Net Income (Loss) is the most direct comparative GAAP measure reported in the Consolidated Statements of Operations. |
78
Table of Contents
Index to Financial Statements
TPC Group Inc.
NOTES TO CONSOLIDATED FINANCIAL STATEMENTS – (Continued)
June 30, 2010, 2009 and 2008
The table below provides a reconciliation of Adjusted EBITDA to Net Income (Loss) (in thousands) for the three most recent fiscal years. Net Income (Loss) is the most direct comparative GAAP measure reported in the Consolidated Statements of Operations.
| Year Ended June 30, | ||||||||||||
| 2010 | 2009 | 2008 | ||||||||||
| Net income (loss): |
$ | 30,541 | $ | (22,778 | ) | $ | 26,624 | |||||
| Income tax expense (benefit) |
18,792 | (11,653 | ) | 14,615 | ||||||||
| Interest expense, net |
15,007 | 16,816 | 18,868 | |||||||||
| Depreciation and amortization |
39,769 | 41,899 | 35,944 | |||||||||
| EBITDA: |
104,109 | 24,284 | 96,051 | |||||||||
| Impairment of assets |
— | 5,987 | — | |||||||||
| Loss on sale of assets |
— | — | 1,092 | |||||||||
| Non-cash stock-based compensation |
1,186 | 6,311 | 6,494 | |||||||||
| Unrealized (gain) loss on derivatives |
(3,464 | ) | 3,710 | (99 | ) | |||||||
| Adjusted EBITDA (unaudited): |
$ | 101,831 | $ | 40,292 | $ | 103,538 | ||||||
| 2. | Segment Assets |
We do not identify and report assets by segment internally; consequently, such information is not presented herein.
| 3. | Intersegment Sales |
Inter-segment product transfers from the C4 Processing segment to the Performance Products segment are not significant and, as such, are not reported as inter-segment revenues.
| 4. | Geographic Areas |
We do not conduct operations or have long-lived assets in countries other than the United States.
79
Table of Contents
Index to Financial Statements
TPC Group Inc.
NOTES TO CONSOLIDATED FINANCIAL STATEMENTS – (Continued)
June 30, 2010, 2009 and 2008
NOTE P – SELECTED QUARTERLY FINANCIAL DATA (quarterly data unaudited)
The schedule below contains quarterly financial data for fiscal 2010 and 2009 (in thousands, except per share).
| First Quarter |
Second Quarter |
Third Quarter |
Fourth Quarter |
Year | ||||||||||||||
| Year ended June 30, 2010 |
||||||||||||||||||
| Total revenues |
$ | 340,166 | $ | 415,760 | $ | 400,725 | $ | 531,833 | $ | 1,688,484 | ||||||||
| Cost of sales |
282,436 | 366,732 | 341,012 | 453,976 | 1,444,156 | |||||||||||||
| Income from operations |
8,957 | 16,436 | 8,732 | 24,464 | 58,589 | |||||||||||||
| Net income |
3,704 | 8,376 | 4,052 | 14,409 | 30,541 | |||||||||||||
| Earnings per share (a): |
||||||||||||||||||
| Basic |
0.21 | 0.47 | 0.23 | 0.80 | 1.70 | |||||||||||||
| Diluted |
0.21 | 0.47 | 0.23 | 0.80 | 1.70 | |||||||||||||
| Weighted average shares outstanding: |
||||||||||||||||||
| Basic |
17,845 | 17,915 | 17,957 | 17,997 | 17,928 | |||||||||||||
| Diluted |
17,845 | 17,915 | 17,957 | 18,004 | 17,930 | |||||||||||||
| Year ended June 30, 2009 |
||||||||||||||||||
| Total revenues |
$ | 543,345 | $ | 409,999 | $ | 162,619 | $ | 260,911 | $ | 1,376,874 | ||||||||
| Cost of sales |
481,263 | 387,253 | 126,956 | 198,701 | 1,194,173 | |||||||||||||
| Income (loss) from operations |
6,219 | (29,732 | ) | (7,093 | ) | 15,078 | (15,528 | ) | ||||||||||
| Net income (loss) |
1,388 | (26,697 | ) | (5,291 | ) | 7,822 | (22,778 | ) | ||||||||||
| Earnings per share (a): |
||||||||||||||||||
| Basic |
0.08 | (1.51 | ) | (0.30 | ) | 0.44 | (1.29 | ) | ||||||||||
| Diluted |
0.08 | (1.51 | ) | (0.30 | ) | 0.44 | (1.29 | ) | ||||||||||
| Weighted average shares outstanding: |
||||||||||||||||||
| Basic |
17,797 | 17,686 | 17,686 | 17,686 | 17,714 | |||||||||||||
| Diluted |
18,203 | 17,686 | 17,686 | 17,695 | 17,714 | |||||||||||||
| (a) | The sum of the individual quarterly net income per share may not agree to the total for the year as each period’s computation is based on the weighted average number of shares outstanding during each period. |
80
Table of Contents
Index to Financial Statements
| ITEM 9. | CHANGES IN AND DISAGREEMENTS WITH ACCOUNTANTS ON ACCOUNTING AND FINANCIAL DISCLOSURE |
None.
| ITEM 9A. | CONTROLS AND PROCEDURES |
Evaluation of Disclosure Controls and Procedures
As of the end of the period covered by this report, an evaluation was carried out under the supervision and with the participation of our management, including our Chief Executive Officer and our Chief Financial Officer, of the effectiveness of the design and operation of our disclosure controls and procedures (as defined in Rules 13a-15(e) and 15d-15(e) under the Securities Exchange Act of 1934, as amended (the “Exchange Act”)). This evaluation included consideration of the various processes carried out under the direction of our disclosure committee. This evaluation also considered the work completed relating to our compliance with Section 404 of the Sarbanes-Oxley Act of 2002. Based on this evaluation, our President and Chief Executive Officer and our Senior Vice President and Chief Financial Officer concluded that our disclosure controls and procedures were effective as of June 30, 2010.
Management’s Report on Internal Control over Financial Reporting
This annual report does not include a report of management’s assessment regarding internal control over financial reporting or an attestation report of our independent registered public accountants due to a transition period established by rules of the Securities and Exchange Commission for newly reporting companies.
Changes in Internal Controls
There were no changes in our internal control over financial reporting that have materially affected or are reasonably likely to materially affect our internal control over financial reporting during the quarter ended June 30, 2010.
| ITEM 9B. | OTHER INFORMATION |
None.
81
Table of Contents
Index to Financial Statements
PART III
| ITEM 10. | DIRECTORS, EXECUTIVE OFFICERS AND CORPORATE GOVERNANCE. |
The information required to be set forth in this Item 10 is incorporated herein by reference to our definitive proxy statement with respect to the 2010 annual meeting to be filed with the SEC within 120 days following the end of fiscal year 2010.
| ITEM 11. | EXECUTIVE COMPENSATION. |
The information required to be set forth in this Item 11 is incorporated herein by reference to our definitive proxy statement with respect to the 2010 annual meeting to be filed with the SEC within 120 days following the end of fiscal year 2010.
| ITEM 12. | SECURITY OWNERSHIP OF CERTAIN BENEFICIAL OWNERS AND MANAGEMENT AND RELATED STOCKHOLDER MATTERS. |
The following table reflects information regarding the securities authorized for issuance under our equity compensation plans as of June 30, 2010:
| Plan Category |
Number of Securities to
be issued upon exercise of outstanding options, warrants and rights (a) |
Weighted-average
exercise price of outstanding options, warrants and rights (b) |
Number of securities remaining available for future issuance under equity compensation plans (excluding securities reflected in column (a)) (c) | ||||
| Equity compensation plans approved by security holders |
484,225 | $ | 16.98 | 1,602,211 | |||
| Equity compensation plans not approved by security holders |
— | N/A | — | ||||
| Total |
484,225 | $ | 16.98 | 1,602,211 | |||
Additional information required to be set forth in this Item 12 is incorporated herein by reference to our definite proxy statement with respect to the 2010 annual meeting of stockholders, to be filed with the Securities and Exchange Commission within 120 days following the end of the 2009 fiscal year end.
| ITEM 13. | CERTAIN RELATIONSHIPS AND RELATED TRANSACTIONS, AND DIRECTOR INDEPENDENCE. |
The information required to be set forth in this Item 13 is incorporated herein by reference to our definitive proxy statement with respect to the 2010 annual meeting to be filed with the SEC within 120 days following the end of fiscal year 2010.
| ITEM 14. | PRINCIPAL ACCOUNTANT FEES AND SERVICES. |
The information required to be set forth in this Item 14 is incorporated herein by reference to our definitive proxy statement with respect to the 2010 annual meeting to be filed with the SEC within 120 days following the end of fiscal year 2010.
82
Table of Contents
Index to Financial Statements
PART IV
| ITEM 15. | EXHIBITS AND FINANCIAL STATEMENTS SCHEDULES. |
The following financial statements, schedules and exhibits are filed as part of this report:
| (1) | Financial Statements. Reference is made to the Index to Consolidated Financial Statements on page of this report. |
| (2) | Schedules. All schedules are omitted because they are not applicable or the required information is shown in the financial statements or the notes to the financial statements. |
| (3) | Exhibits. |
INDEX TO EXHIBITS
| Exhibit No. |
Description | |
| 2.1 | Texas Petrochemicals LP’s Fourth Amended Plan of Reorganization (incorporated herein by reference to Exhibit 2.1 to the Company’s Registration Statement on Form 10 filed November 25, 2009). | |
| 2.2 | Investment Agreement dated as of February 28, 2004 by and among Texas Petrochemicals LP, Castlerigg Master Investments, Ltd. and RCG Carpathia Master Fund, Ltd. (incorporated herein by reference to Exhibit 2.2 to the Company’s Registration Statement on Form 10 filed November 25, 2009). | |
| 2.3 | Asset Purchase Agreement dated as of April 5, 2006 by and among Texas Petrochemicals LP, Huntsman Petrochemical Corporation and Huntsman Fuels, LP (incorporated herein by reference to Exhibit 2.3 to the Company’s Registration Statement on Form 10 filed November 25, 2009). | |
| 2.4 | First Amendment to Asset Purchase Agreement dated as of April 27, 2006 by and among Texas Petrochemicals LP, Huntsman Petrochemical Corporation and Huntsman Fuels, LP (incorporated herein by reference to Exhibit 2.4 to the Company’s Registration Statement on Form 10 filed November 25, 2009). | |
| 2.5 | Second Amendment to Asset Purchase Agreement dated as of June 14, 2006 by and among Texas Petrochemicals LP, Huntsman Petrochemical Corporation and Huntsman Fuels, LP (incorporated herein by reference to Exhibit 2.5 to the Company’s Registration Statement on Form 10 filed November 25, 2009). | |
| 3.1 | Amended and Restated Certificate of Incorporation of TPC Group Inc. (incorporated herein by reference to Exhibit 3.1 to the Company’s Quarterly Report on Form 10-Q filed February 16, 2010). | |
| 3.2 | Bylaws of TPC Group Inc., as amended and restated August 26, 2010 (incorporated herein by reference to Exhibit 3.1 to the Company’s Current Report on Form 8-K filed August 31, 2010). | |
| 4.1 | Term Loan Agreement dated as of June 27, 2006, among Texas Petrochemicals LP, various lending institutions and Deutsche Bank Trust Company Americas, as Administrative Agent (incorporated herein by reference to Exhibit 4.1 to Amendment No. 1 to the Company’s Registration Statement on Form 10 filed January 8, 2010). | |
| 4.2 | First Amendment to Term Loan Agreement dated as of June 4, 2010 among TPC Group LLC and Deutsche Bank Trust Company Americas, as lender and administrative agent, and the other financial institutions parties thereto, as lenders (incorporated herein by reference to Exhibit 4.6 to the Company Current Report on Form 8-K filed June 4, 2010). | |
| 4.3 | Revolving Credit Agreement dated as of June 27, 2006, among Texas Petrochemicals LP and the other borrowers named therein, as Borrowers, Texas Petrochemicals LP, as Funds Administrator, various lending institutions, as Lenders, Deutsche Bank Trust Company Americas, as Administrative Agent, and LaSalle Bank National Association, as Collateral Agent (incorporated herein by reference to Exhibit 4.2 to Amendment No. 1 to the Company’s Registration Statement on Form 10 filed January 8, 2010). | |
83
Table of Contents
Index to Financial Statements
| 4.4 | Joinder To Credit Agreement dated as of March 28, 2008, among Texas Petrochemicals LP, Texas Butylene Chemical Corporation, various financial institutions, and Deutsche Bank Trust Company Americas as administrative agent for the Lenders, with Deutsche Bank Securities Inc., as Lead Arranger (incorporated herein by reference to Exhibit 4.3 to the Company’s Registration Statement on Form 10 filed November 25, 2009). | |
| 4.5 | First Amendment to Revolving Credit Agreement dated as of February 10, 2009, by and among Texas Petrochemicals LLC and Texas Butylene Chemical Corporation, as Borrowers, and various lenders named therein (incorporated herein by reference to Exhibit 4.4 to the Company’s Registration Statement on Form 10 filed November 25, 2009). | |
| 4.6 | Amended and Restated Revolving Credit Agreement dated as of April 29, 2010 among TPC Group LLC and the other borrowers named therein, as Borrowers, TPC Group LLC, as Funds Administrator, various lending institutions, as Lenders, Deutsche Bank Trust Company Americas, as Administrative Agent, Deutsche Bank Trust Company Americas and Wells Fargo Capital Finance LLC as Co-Collateral Agents, and Deutsche Bank Trust Company Americas, as Collateral Agent (incorporated herein by reference to Exhibit 4.5 to the Company’s Current Report on Form 8-K filed May 3, 2010). | |
| 10.1 † | Employment Agreement dated effective July 1, 2006, between Texas Petrochemicals Inc., Texas Petrochemicals LP and Charles W. Shaver (incorporated herein by reference to Exhibit 10.1 to the Company’s Registration Statement on Form 10 filed November 25, 2009). | |
| 10.2 † | Amendment No. 1 to Employment Agreement dated effective July 1, 2008, between Texas Petrochemicals Inc., Texas Petrochemicals LP and Charles W. Shaver (incorporated herein by reference to Exhibit 10.2 to the Company’s Registration Statement on Form 10 filed November 25, 2009). | |
| 10.3 † | Amendment No. 2 to Employment Agreement dated May 24, 2010, effective as of January 1, 2009, between TPC Group Inc., TPC Group LLC and Charles W. Shaver (incorporated herein by reference to Exhibit 10.3 to the Company’s Current Report on Form 8-K filed May 26, 2010). | |
| 10.4 † | Employment Agreement dated effective July 1, 2006, between Texas Petrochemicals Inc., Texas Petrochemicals LP and Ruth I. Dreessen (incorporated herein by reference to Exhibit 10.3 to the Company’s Registration Statement on Form 10 filed November 25, 2009). | |
| 10.5 † | Amendment No. 1 to Employment Agreement dated effective July 1, 2008, between Texas Petrochemicals Inc., Texas Petrochemicals LP and Ruth I. Dreessen (incorporated herein by reference to Exhibit 10.4 to the Company’s Registration Statement on Form 10 filed November 25, 2009). | |
| 10.6 † | Amendment No. 2 to Employment Agreement dated May 24, 2010, effective as of January 1, 2009, between TPC Group Inc., TPC Group LLC and Ruth I. Dreessen (incorporated herein by reference to Exhibit 10.4 to the Company’s Current Report on Form 8-K filed May 26, 2010). | |
| 10.7 † | Agreement dated March 23, 2010 between TPC Group Inc., TPC Group LLC and Ruth I. Dreessen (incorporated herein by reference to Exhibit 10.1 to the Company’s Current Report on Form 8-K filed March 24, 2010). | |
| 10.8 † | Employment offer letter agreement dated May 14, 2010, effective as of June 1, 2010, between TPC Group Inc. and Miguel A. Desdin (incorporated herein by reference to Exhibit 10.2 to the Company’s Current Report on Form 8-K/A (Amendment No. 1) filed August 16, 2010. | |
| 10.9 † | Employment Agreement dated as of June 1, 2010 between TPC Group Inc. and Miguel A. Desdin (incorporated herein by reference to Exhibit 10.1 to the Company’s Current Report on Form 8-K filed June 4, 2010). | |
| 10.10 † | Employment Agreement dated effective July 1, 2006, between Texas Petrochemicals Inc., Texas Petrochemicals LP and Christopher A. Artzer (incorporated herein by reference to Exhibit 10.5 to the Company’s Registration Statement on Form 10 filed November 25, 2009). | |
| 10.11 † | Amendment No. 1 to Employment Agreement dated effective July 1, 2008, between Texas Petrochemicals Inc., Texas Petrochemicals LP and Christopher A. Artzer (incorporated herein by reference to Exhibit 10.6 to the Company’s Registration Statement on Form 10 filed November 25, 2009). | |
84
Table of Contents
Index to Financial Statements
| 10.12 † | Amendment No. 2 to Employment Agreement dated May 24, 2010, effective as of January 1, 2009, between TPC Group Inc., TPC Group LLC and Christopher A. Artzer (incorporated herein by reference to Exhibit 10.5 to the Company’s Current Report on Form 8-K filed May 26, 2010). | |
| 10.13 † | Employment Agreement dated effective March 19, 2007, between Texas Petrochemicals Inc., Texas Petrochemicals LP and Luis E. Batiz (incorporated herein by reference to Exhibit 10.7 to the Company’s Registration Statement on Form 10 filed November 25, 2009). | |
| 10.14 † | Amendment No. 1 to Employment Agreement dated effective March 20, 2009, between Texas Petrochemicals Inc., Texas Petrochemicals LP and Luis E. Batiz (incorporated herein by reference to Exhibit 10.8 to the Company’s Registration Statement on Form 10 filed November 25, 2009). | |
| 10.15 † | Amendment No. 2 to Employment Agreement dated May 24, 2010, effective as of January 1, 2009, between TPC Group Inc., TPC Group LLC and Luis E. Batiz (incorporated herein by reference to Exhibit 10.6 to the Company’s Current Report on Form 8-K filed May 26, 2010). | |
| 10.16 † | Employment Agreement dated effective September 2, 2008, between Texas Petrochemicals Inc., Texas Petrochemicals LP and Russell T. Crockett Jr. (incorporated herein by reference to Exhibit 10.9 to the Company’s Registration Statement on Form 10 filed November 25, 2009). | |
| 10.17 † | Amendment No. 1 to Employment Agreement dated May 24, 2010, effective as of January 1, 2009, between TPC Group Inc., TPC Group LLC and Russell T. Crockett Jr. (incorporated herein by reference to Exhibit 10.7 to the Company’s Current Report on Form 8-K filed May 26, 2010). | |
| 10.18 † | TPC Group Inc. Executive Severance Plan dated effective July 1, 2010 (incorporated herein by reference to Exhibit 10.1 to the Company’s Current Report on Form 8-K filed July 6, 2010). | |
| 10.19 † | Texas Petrochemicals Inc. 2004 Stock Awards Plan (incorporated herein by reference to Exhibit 10.10 to the Company’s Registration Statement on Form 10 filed November 25, 2009). | |
| 10.20 † | Form of Option Award Agreement under 2004 Stock Awards Plan (incorporated herein by reference to Exhibit 10.11 to the Company’s Registration Statement on Form 10 filed November 25, 2009). | |
| 10.21 † | Form of Restricted Stock Award Agreement under 2004 Stock Awards Plan (incorporated herein by reference to Exhibit 10.12 to the Company’s Registration Statement on Form 10 filed November 25, 2009). | |
| 10.22 † | Texas Petrochemicals Inc. 2009 Long-Term Incentive Plan (incorporated herein by reference to Exhibit 10.13 to the Company’s Registration Statement on Form 10 filed November 25, 2009). | |
| 10.23 † | Form of Restricted Stock Award Agreement for directors under the 2009 Long-Term Incentive Plan (incorporated herein by reference to Exhibit 10.14 to Amendment No. 1 to the Company’s Registration Statement on Form 10 filed January 8, 2010). | |
| 10.24 † | Form of Performance Share Award Agreement dated May 24, 2010 for key employees under the 2009 Long-Term Incentive Plan (incorporated herein by reference to Exhibit 10.1 to the Company’s Current Report on Form 8-K filed May 26, 2010). | |
| 10.25 † | Form of Restricted Stock Unit Award Agreement dated May 24, 2010 for key employees under the 2009 Long-Term Incentive Plan (incorporated herein by reference to Exhibit 10.2 to the Company’s Current Report on Form 8-K filed May 26, 2010). | |
| 10.26 † | Form of Indemnification Agreement (incorporated herein by reference to Exhibit 10.15 to the Company’s Registration Statement on Form 10 filed November 25, 2009). | |
| 21 * | Subsidiaries of TPC Group Inc. | |
| 23.1 * | Consent of Grant Thornton LLP | |
| 31.1 * | Certification of Chief Executive Officer pursuant to Section 302 of the Sarbanes-Oxley Act of 2002. | |
| 31.2 * | Certification of Chief Financial Officer pursuant to Section 302 of the Sarbanes-Oxley Act of 2002. | |
| 32.1 * | Certification of Chief Executive Officer pursuant to 18 U.S.C. Section 1350, as adopted pursuant to Section 906 of the Sarbanes-Oxley Act of 2002. | |
| 32.2 * | Certification of Chief Financial Officer pursuant to 18 U.S.C. Section 1350, as adopted pursuant to Section 906 of the Sarbanes-Oxley Act of 2002. | |
| * | Filed herewith |
| † | Management contracts or compensatory plans or arrangements |
85
Table of Contents
Index to Financial Statements
SIGNATURES
Pursuant to the requirements of Section 13 or 15(d) of the Securities Exchange Act of 1934, the registrant has duly caused this report to be signed on its behalf by the undersigned, thereunto duly authorized.
| TPC Group Inc. | ||||
| Date: September 17, 2010 |
By: |
/s/ Charles W. Shaver | ||
| Charles W. Shaver | ||||
| President and Chief Executive Officer | ||||
Pursuant to the requirements of the Securities Exchange Act of 1934, this report has been signed below by the following persons on behalf of the registrant and in the capacities and on the dates indicated.
| /s/ Charles W. Shaver |
President, Chief Executive Officer and Director | September 17, 2010 | ||
| Charles W. Shaver | (Principal Executive Officer) |
|||
| /s/ Miguel A. Desdin |
Senior Vice President and Chief Financial Officer | September 17, 2010 | ||
| Miguel A. Desdin | (Principal Financial Officer) |
|||
| /s/ Roger Wollenberg |
Vice President and Controller | September 17, 2010 | ||
| Roger Wollenberg | (Principal Accounting Officer) |
|||
| /s/ Michael E. Ducey |
Chairman of the Board | September 17, 2010 | ||
| Michael E. Ducey | ||||
| /s/ James A. Cacioppo |
Director | September 17, 2010 | ||
| James A. Cacioppo | ||||
| /s/ Kenneth E. Glassman |
Director | September 17, 2010 | ||
| Kenneth E. Glassman | ||||
| /s/ Richard B. Marchese |
Director | September 17, 2010 | ||
| Richard B. Marchese | ||||
| /s/ Jeffrey M. Nodland |
Director | September 17, 2010 | ||
| Jeffrey M. Nodland | ||||
| /s/ Jeffrey A. Strong |
Director | September 17, 2010 | ||
| Jeffrey A. Strong | ||||
86