Attached files
| file | filename |
|---|---|
| 8-K - CURRENT REPORT OF MATERIAL EVENTS OR CORPORATE CHANGES - Digital Generation, Inc. | a10-17982_18k.htm |
Exhibit 99.1
|
|
Investor Presentation Nasdaq: DGIT September 2010 |
|
|
Safe Harbor Language This presentation contains forward-looking statements relating to the Company, including the expansion of its digital distribution network, the demand among certain clients for digital audio and video delivery services, and its expectations for previous acquisitions. These statements are based on current economic and market conditions and assume no material changes in economic conditions or other major world events. The Company can give no assurance as to whether these conditions will continue, or if they change, how such changes may affect the Company’s current expectations. While the Company may, from time to time, revise its outlook or issue updated guidance, it assumes no obligation to do so. These forward-looking statements involve risks and uncertainties, which could cause actual results to differ materially from those projected. Additional information on these and other risks, uncertainties and factors is included in DG FastChannel’s Annual Report on Form 10-K, Quarterly Reports on Form 10-Q, Current Reports on Form 8-K and other documents filed with the SEC. |
|
|
Company Overview |
|
|
Investment Highlights Leveraging key industry growth trends Shift of advertising budgets to TV & online from other mediums Transition from analog to digital content distribution Transition from SD to HD quality formats Significant barriers to full service entry Mutually exclusive edge server networks for short form & long form content HD/SD/International standards compliant Highly scalable and redundant platform built for massive volume Pricing HD advertising campaigns mandate premium pricing Strong financial position Targeted +$100M adjusted 2010 EBITDA Fixed cost operating model Debt-free balance sheet Significant cash reserves Growth into new markets Expand long format syndication business: transitioning from wholesale to full service network Digitize direct response marketplace Develop business-to-consumer market Worldwide expansion plans |
|
|
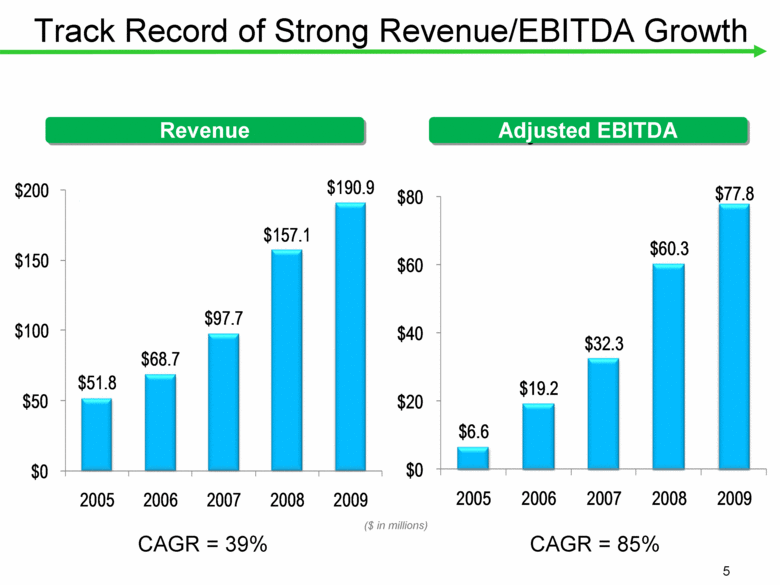
Track Record of Strong Revenue/EBITDA Growth Adjusted EBITDA Revenue ($ in millions) CAGR = 39% CAGR = 85% $6.6 $19.2 $32.3 $60.3 $77.8 $0 $20 $40 $60 $80 2005 2006 2007 2008 2009 $51.8 $68.7 $97.7 $157.1 $190.9 $0 $50 $100 $150 $200 2005 2006 2007 2008 2009 |
|
|
Ranked #16 - Fortune 2010 “Fastest Growing Companies in the World” Investment Highlights |
|
|
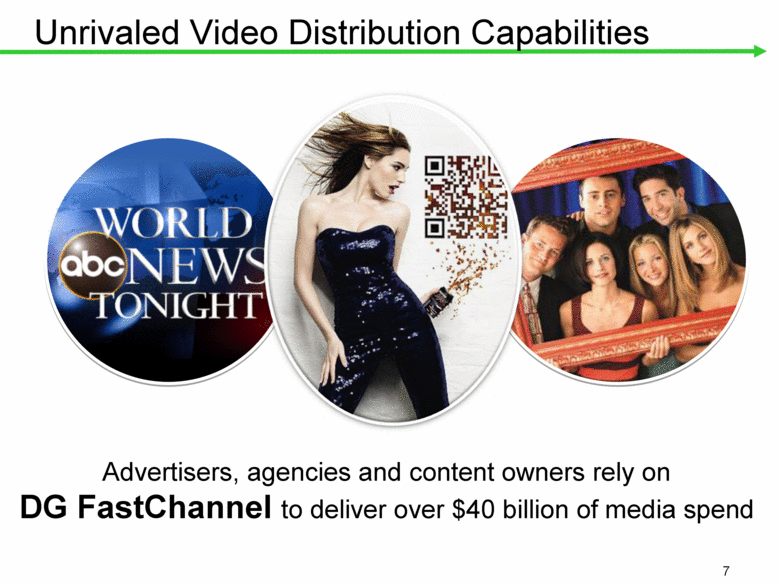
Unrivaled Video Distribution Capabilities Advertisers, agencies and content owners rely on DG FastChannel to deliver over $40 billion of media spend |
|
|
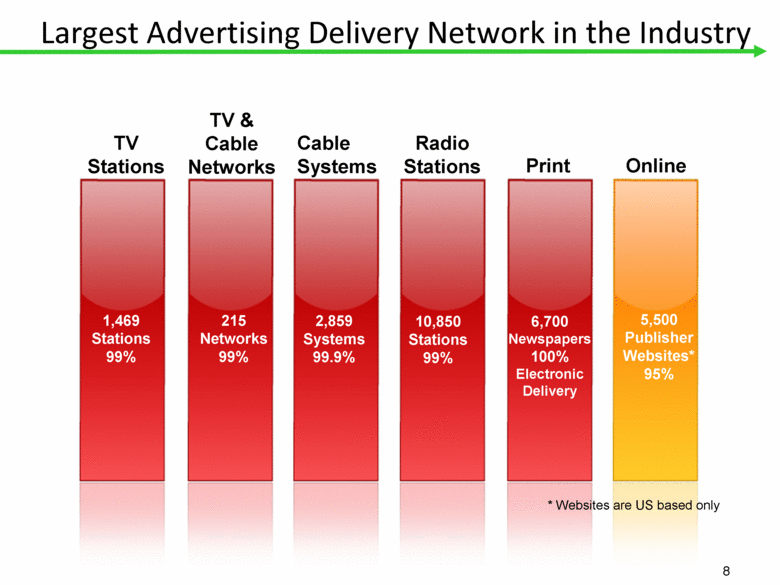
Largest Advertising Delivery Network in the Industry TV Stations TV & Cable Networks Cable Systems Radio Stations Print Online 1,469 Stations 99% 215 Networks 99% 2,859 Systems 99.9% 5,500 Publisher Websites* 95% 6,700 Newspapers 100% Electronic Delivery 10,850 Stations 99% * Websites are US based only |
|
|
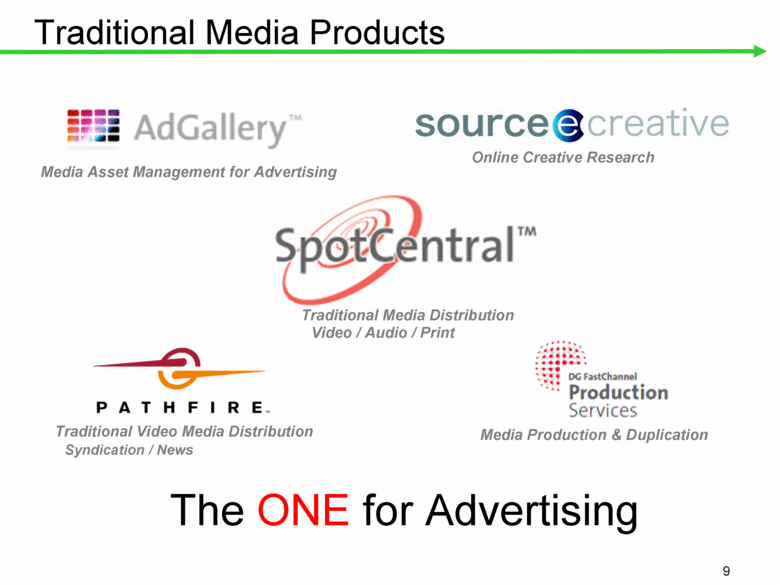
Traditional Media Products The ONE for Advertising Media Production & Duplication Traditional Media Distribution Video / Audio / Print Media Asset Management for Advertising Traditional Video Media Distribution Syndication / News Online Creative Research |
|
|
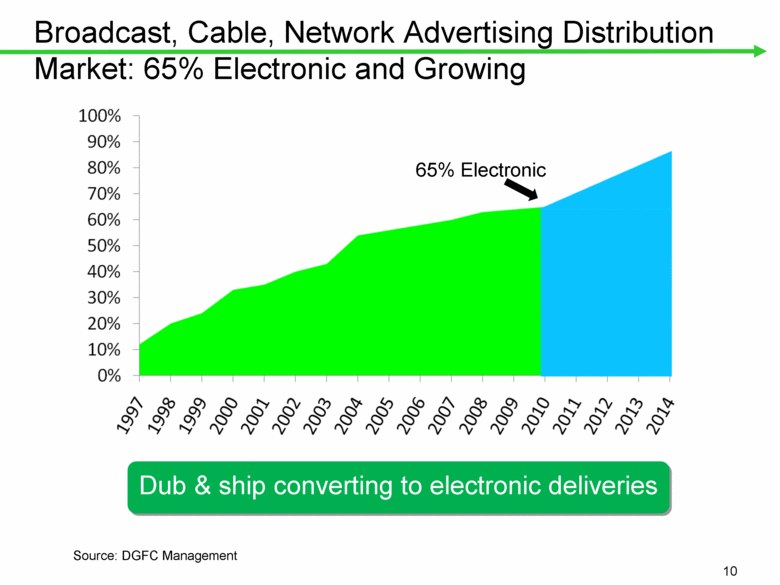
Broadcast, Cable, Network Advertising Distribution Market: 65% Electronic and Growing Convert Standard Definition (SD) Dub and Ship to Electronic Distribution 65% Electronic Dub & ship converting to electronic deliveries Source: DGFC Management |
|
|
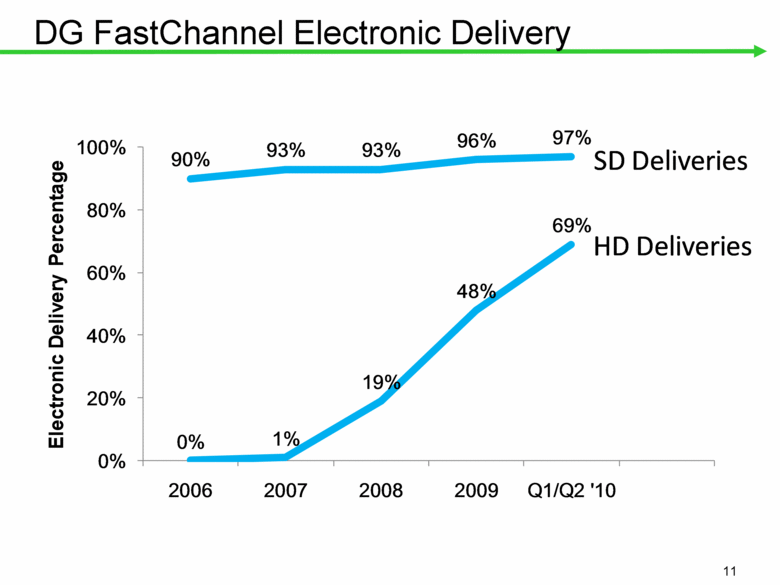
DG FastChannel Electronic Delivery ($ in millions) 0% 1% 19% 48% 69% 90% 93% 93% 96% 97% 0% 20% 40% 60% 80% 100% 2006 2007 2008 2009 Q1/Q2 '10 Electronic Delivery Percentage SD Deliveries HD Deliveries |
|
|
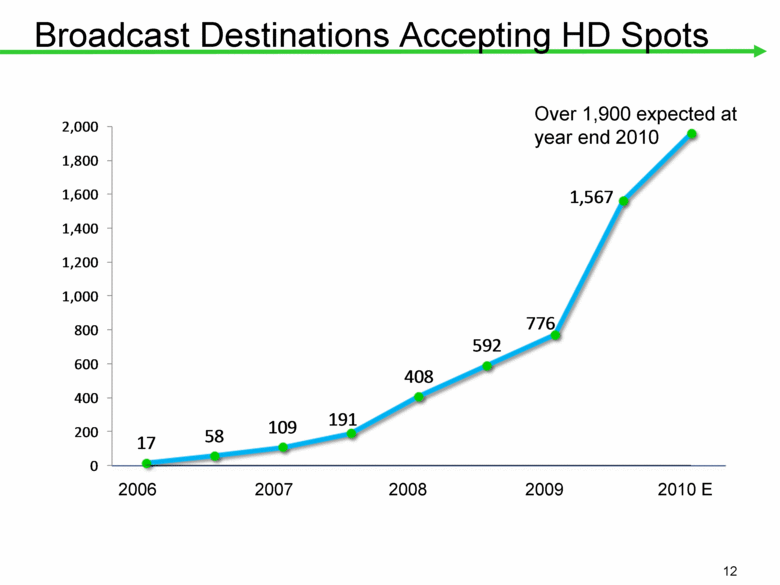
Broadcast Destinations Accepting HD Spots Over 1,900 expected at year end 2010 2006 2009 2007 2008 2010 E 17 58 109 191 408 592 776 1,567 0 200 400 600 800 1,000 1,200 1,400 1,600 1,800 2,000 |
|
|
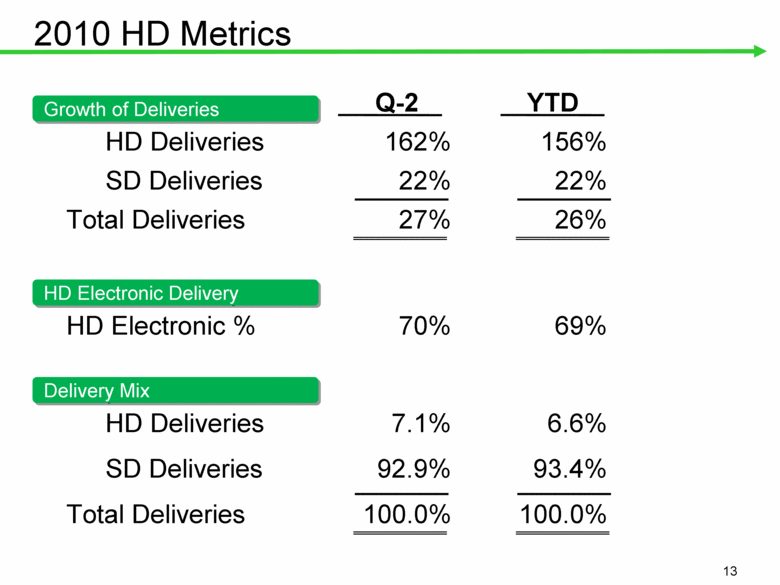
2010 HD Metrics Q-2 YTD HD Deliveries 162% 156% SD Deliveries 22% 22% Total Deliveries 27% 26% HD Electronic % 70% 69% HD Deliveries 7.1% 6.6% SD Deliveries 92.9% 93.4% Total Deliveries 100.0% 100.0% Delivery Mix Growth of Deliveries HD Electronic Delivery |
|
|
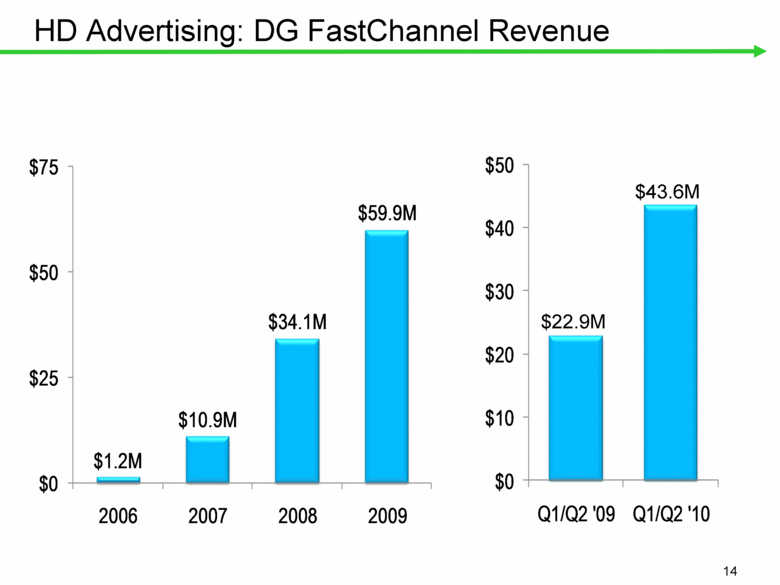
HD Advertising: DG FastChannel Revenue $22.9M $43.6M $1.2M $10.9M $34.1M $59.9M $0 $25 $50 $75 2006 2007 2008 2009 $0 $10 $20 $30 $40 $50 Q1/Q2 '09 Q1/Q2 '10 |
|
|
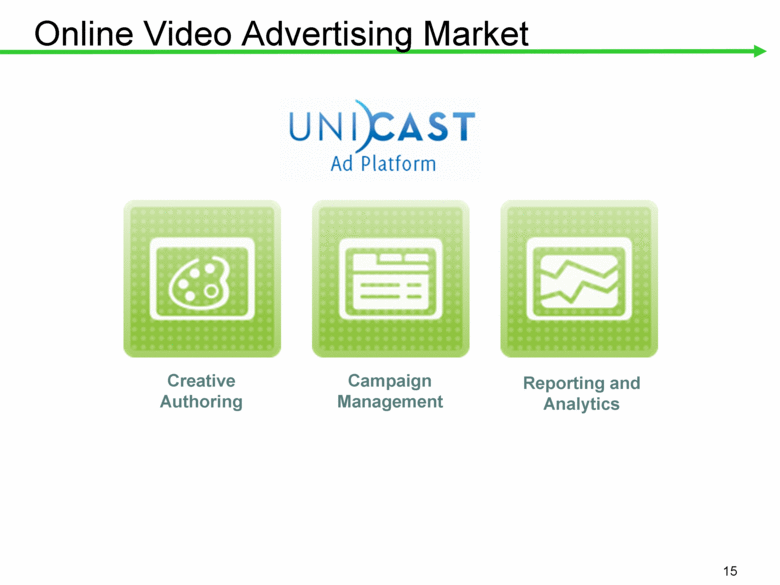
Online Video Advertising Market Creative Authoring Campaign Management Reporting and Analytics |
|
|
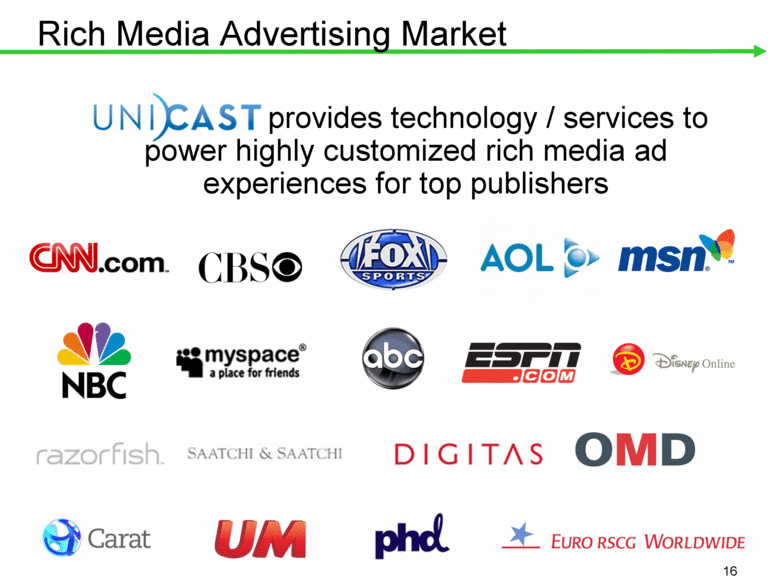
Rich Media Advertising Market provides technology / services to power highly customized rich media ad experiences for top publishers |
|
|
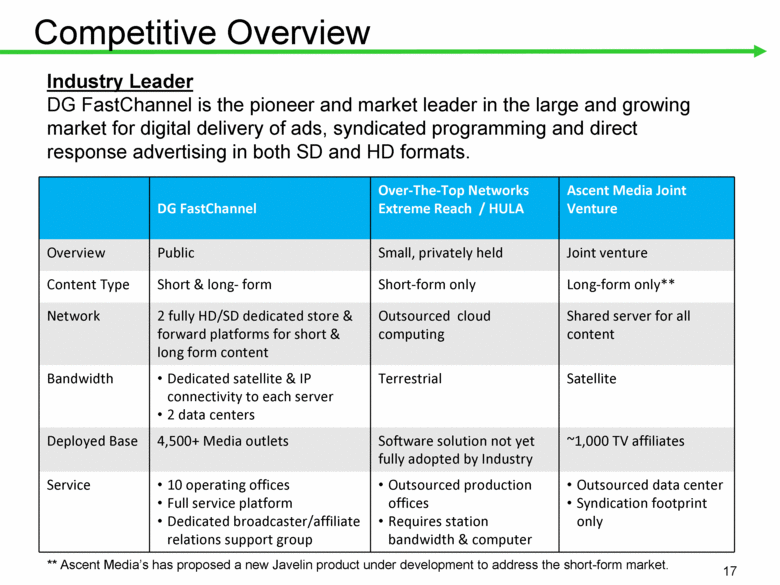
Competitive Overview DG FastChannel Over-The-Top Networks Extreme Reach / HULA Ascent Media Joint Venture Overview Public Small, privately held Joint venture Content Type Short & long- form Short-form only Long-form only** Network 2 fully HD/SD dedicated store & forward platforms for short & long form content Outsourced cloud computing Shared server for all content Bandwidth Dedicated satellite & IP connectivity to each server 2 data centers Terrestrial Satellite Deployed Base 4,500+ Media outlets Software solution not yet fully adopted by Industry ~1,000 TV affiliates Service 10 operating offices Full service platform Dedicated broadcaster/affiliate relations support group Outsourced production offices Requires station bandwidth & computer Outsourced data center Syndication footprint only Industry Leader DG FastChannel is the pioneer and market leader in the large and growing market for digital delivery of ads, syndicated programming and direct response advertising in both SD and HD formats. ** Ascent Media’s has proposed a new Javelin product under development to address the short-form market. |
|
|
Financial Review |
|
|
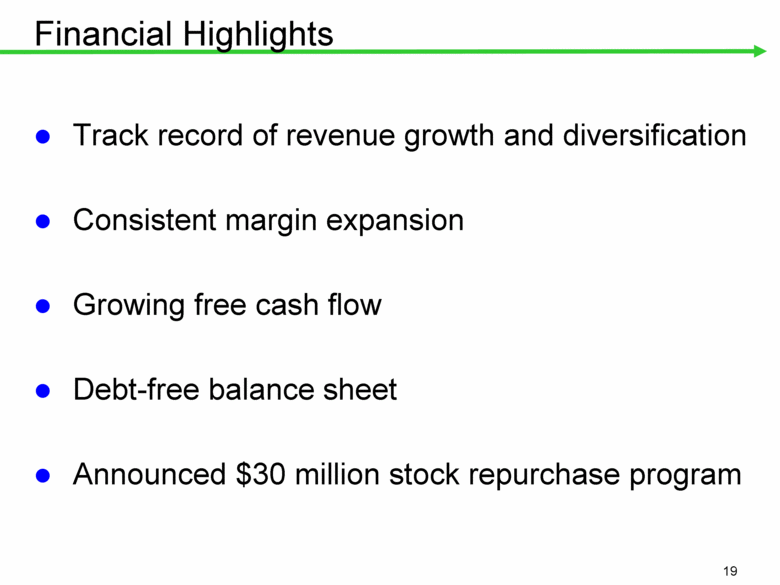
Financial Highlights Track record of revenue growth and diversification Consistent margin expansion Growing free cash flow Debt-free balance sheet Announced $30 million stock repurchase program |
|
|
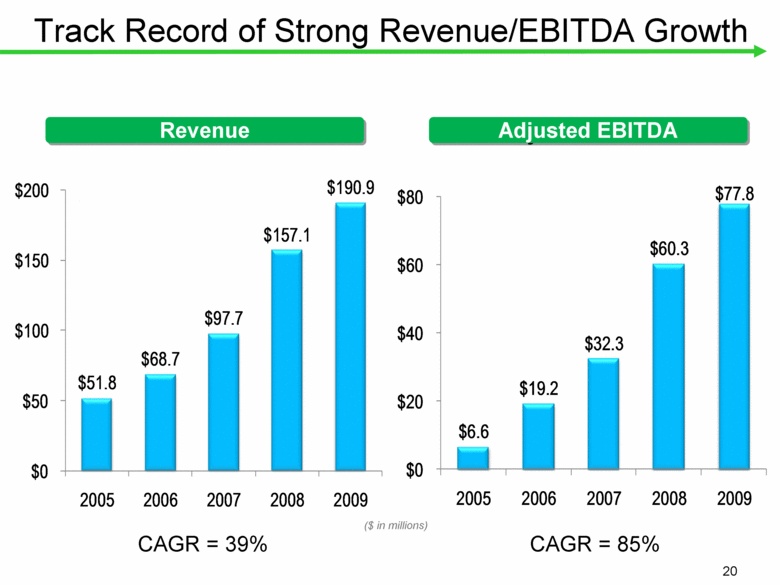
Track Record of Strong Revenue/EBITDA Growth Adjusted EBITDA Revenue ($ in millions) CAGR = 39% CAGR = 85% $6.6 $19.2 $32.3 $60.3 $77.8 $0 $20 $40 $60 $80 2005 2006 2007 2008 2009 $51.8 $68.7 $97.7 $157.1 $190.9 $0 $50 $100 $150 $200 2005 2006 2007 2008 2009 |
|
|
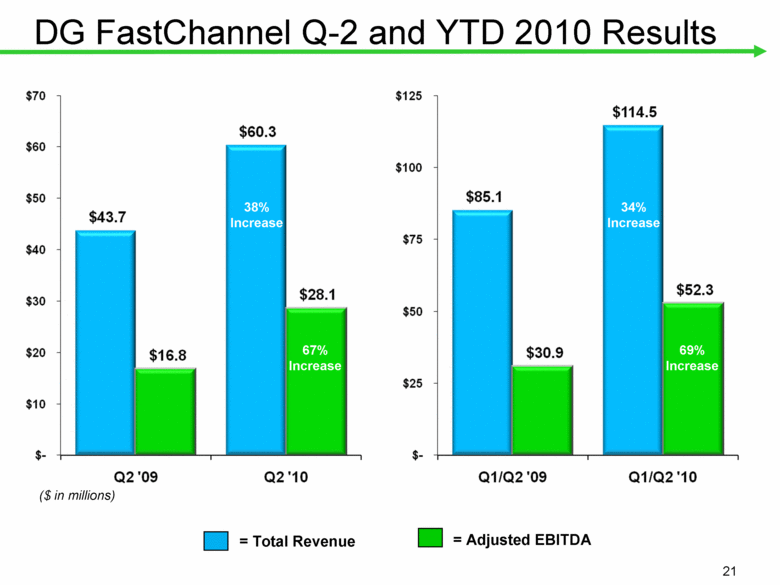
DG FastChannel Q-2 and YTD 2010 Results = Adjusted EBITDA ($ in millions) = Total Revenue 38% Increase 67% Increase 34% Increase 69% Increase |
|
|
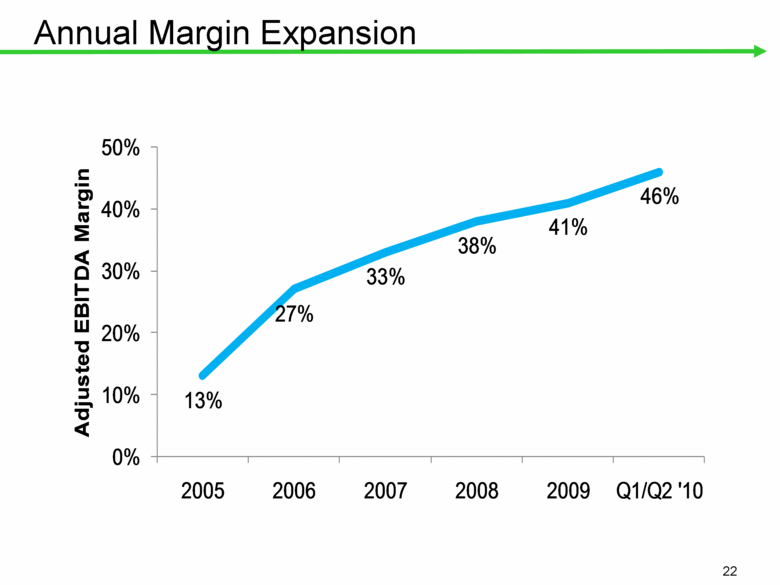
Annual Margin Expansion ($ in millions) 13% 27% 33% 38% 41% 46% 0% 10% 20% 30% 40% 50% 2005 2006 2007 2008 2009 Q1/Q2 '10 Adjusted EBITDA Margin |
|
|
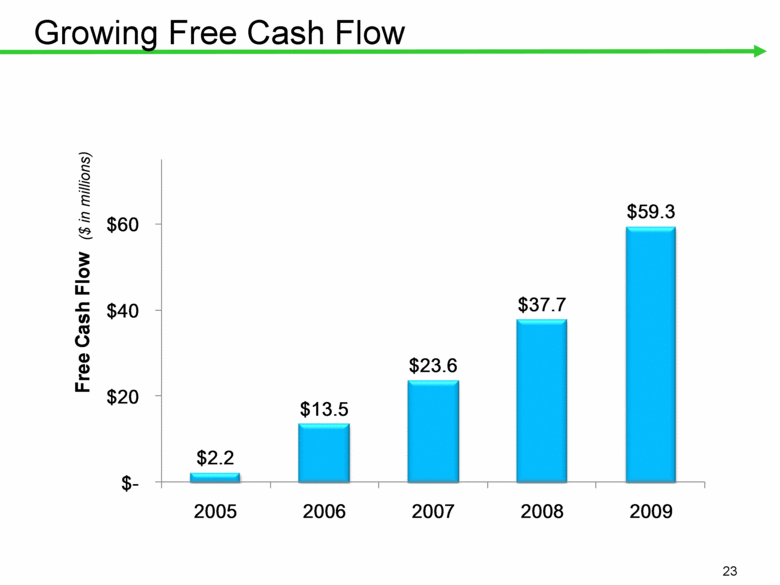
Growing Free Cash Flow ($ in millions) ($ in millions) $2.2 $13.5 $23.6 $37.7 $59.3 $ - $20 $40 $60 2005 2006 2007 2008 2009 Free Cash Flow |
|
|
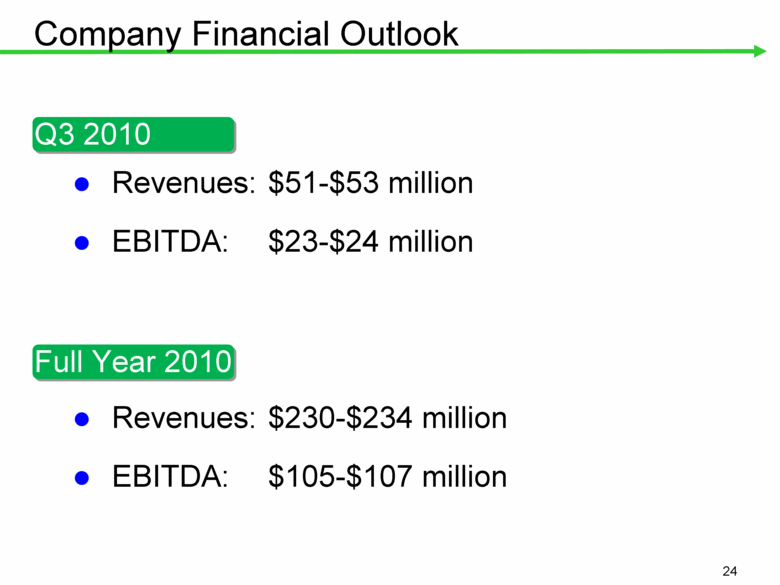
Company Financial Outlook Revenues: $51-$53 million EBITDA: $23-$24 million Revenues: $230-$234 million EBITDA: $105-$107 million Q3 2010 Full Year 2010 |
|
|
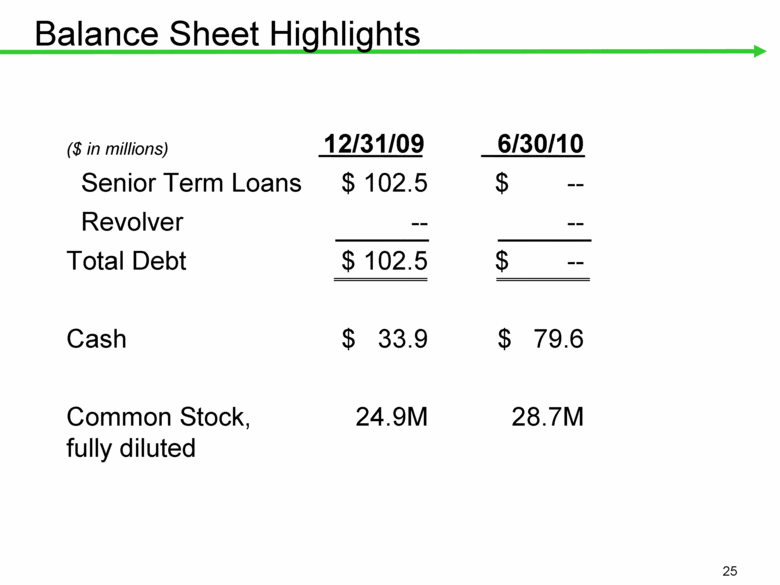
Balance Sheet Highlights ($ in millions) 12/31/09 6/30/10 Senior Term Loans $ 102.5 $ -- Revolver -- -- Total Debt $ 102.5 $ -- Cash $ 33.9 $ 79.6 Common Stock, fully diluted 24.9M 28.7M |
|
|
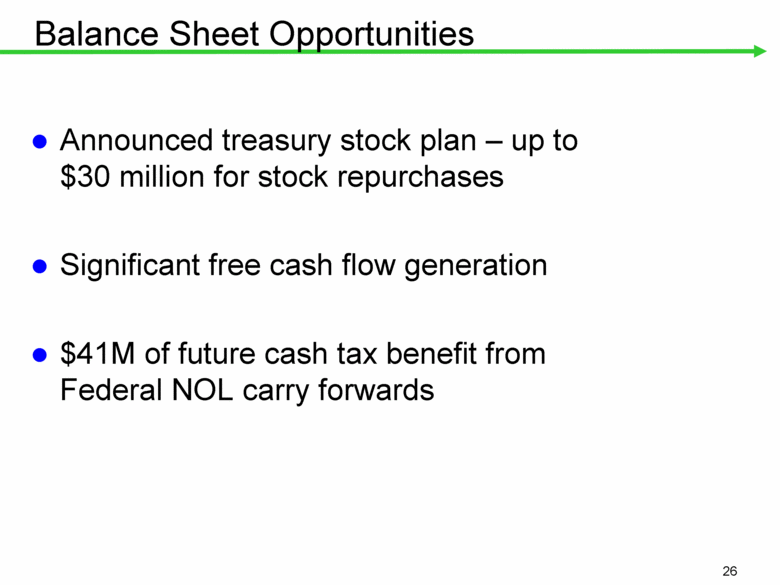
Balance Sheet Opportunities Announced treasury stock plan – up to $30 million for stock repurchases Significant free cash flow generation $41M of future cash tax benefit from Federal NOL carry forwards |
|
|
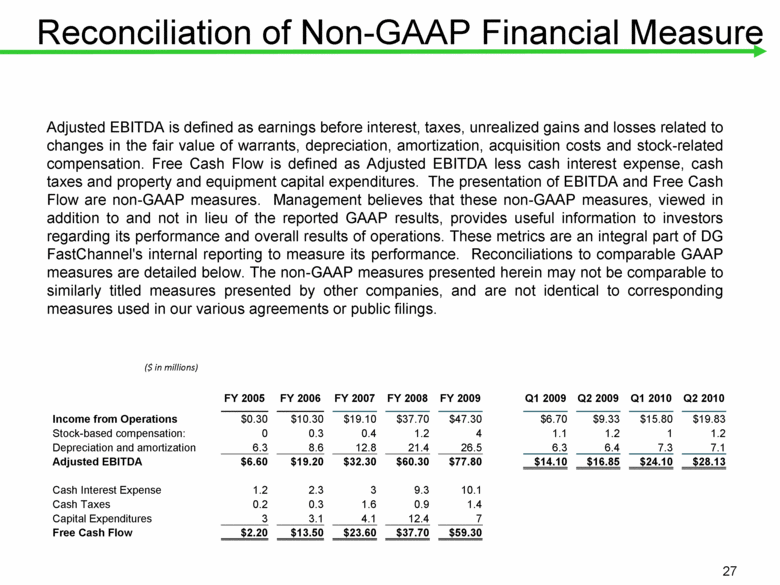
Reconciliation of Non-GAAP Financial Measure Adjusted EBITDA is defined as earnings before interest, taxes, unrealized gains and losses related to changes in the fair value of warrants, depreciation, amortization, acquisition costs and stock-related compensation. Free Cash Flow is defined as Adjusted EBITDA less cash interest expense, cash taxes and property and equipment capital expenditures. The presentation of EBITDA and Free Cash Flow are non-GAAP measures. Management believes that these non-GAAP measures, viewed in addition to and not in lieu of the reported GAAP results, provides useful information to investors regarding its performance and overall results of operations. These metrics are an integral part of DG FastChannel's internal reporting to measure its performance. Reconciliations to comparable GAAP measures are detailed below. The non-GAAP measures presented herein may not be comparable to similarly titled measures presented by other companies, and are not identical to corresponding measures used in our various agreements or public filings. ($ in millions) FY 2005 FY 2006 FY 2007 FY 2008 FY 2009 Q1 2009 Q2 2009 Q1 2010 Q2 2010 Income from Operations $0.30 $10.30 $19.10 $37.70 $47.30 $6.70 $9.33 $15.80 $19.83 Stock-based compensation: 0 0.3 0.4 1.2 4 1.1 1.2 1 1.2 Depreciation and amortization 6.3 8.6 12.8 21.4 26.5 6.3 6.4 7.3 7.1 Adjusted EBITDA $6.60 $19.20 $32.30 $60.30 $77.80 $14.10 $16.85 $24.10 $28.13 Cash Interest Expense 1.2 2.3 3 9.3 10.1 Cash Taxes 0.2 0.3 1.6 0.9 1.4 Capital Expenditures 3 3.1 4.1 12.4 7 Free Cash Flow $2.20 $13.50 $23.60 $37.70 $59.30 |
|
|
[LOGO] |

