Attached files
| file | filename |
|---|---|
| 8-K - FORM 8-K - PERDOCEO EDUCATION Corp | d8k.htm |
 Career Education Corporation
BMO Capital Markets
Back to School Education Conference
September 16, 2010
Copyright Career Education Corporation 2010
Exhibit 99.1 |
 Gary
E. McCullough President and Chief Executive Officer
Copyright Career Education Corporation 2010 |
 The
Company has included some non-GAAP financial measures in this presentation to discuss the
Company's financial results and outlook. As a general matter, the Company
uses these non-GAAP measures in addition to and in conjunction with
results presented in accordance with GAAP. Among other things, the Company
may use such non-GAAP financial measures in addition to and in conjunction with corresponding
GAAP measures, to help analyze the performance of its core business, in connection
with the preparation of annual budgets, and in measuring performance for
some forms of compensation. In addition, the Company believes that
non-GAAP financial measures are used by analysts and others in the investment community to
analyze the Company's historical results and in providing estimates of future
performance and that failure to report these non-GAAP measures could
result in confusion among analysts and others and a misplaced perception
that the Company's results have underperformed or exceeded expectations.
These non-GAAP financial measures reflect an additional way of viewing aspects
of the Company's operations that, when viewed with the GAAP results and the
reconciliations to corresponding GAAP financial measures,
provide
a
more
complete
understanding
of
the
Company's
results
of
operations
and
the
factors
and trends affecting the Company's business. However, these non-GAAP measures
should be considered as a supplement to, and not as a substitute for, or
superior to, the corresponding measures calculated in accordance with
GAAP. Non-GAAP Financial Measures |
 During this presentation, we will make forward-looking statements subject to
known and unknown risks and uncertainties that could cause actual
performance to differ materially from that expressed or implied by the
statements. These statements are based on information currently
available to us. Some factors that could cause actual results and
performance to differ are:
•
Our
ability
to
comply
with
the
extensive
regulatory
requirements
and
accreditation
requirements for school operations
•
Changes
and
uncertainties
in
student
lending
markets
and
federal
and
state
student
financial
aid programs
•
Financial
and
operating
results,
including
new
student
starts
•
Our
ability
to
manage
and
grow
our
business
in
current
and
changing
economic,
political,
regulatory and competitive environments
•
Litigation,
claims
and
administrative
proceedings
involving
the
company
•
Other
risks
described
from
time
to
time
in
our
press
releases
and
our
filings
with
the
Securities and Exchange Commission
We undertake no obligation to publicly release any revisions to forward-looking
statements to reflect events or expectations after the date of this
presentation. We provide a detailed discussion of risk factors in our
SEC filings and encourage you to review the filings. Safe Harbor
|
 Career Education Overview
Purpose:
To
change
lives
through
education.
Purpose:
To
change
lives
through
education.
Bachelors
28%
Masters
4%
Certificate
24%
Associates
44%
21 to 30
43%
Under 21
16%
Over 30
41%
Students by Degree Type
Students by Age
*Demographics as of December 31, 2009
*Student Population as of June 30, 2010
*Graduate information as of August 16, 2010
Over 104,000 Students
Over 483,000 Graduates
High
School |
 Population
61,000
28,600
12,100
2,800
% Online
75%
<1%
<1%
N/A
# of Campuses
24
38
18
13
Accreditation
Regional
National
National
Program
Emphasis
Business, IT
Health, Design,
Protective
Health
Culinary
Business,
Design
Bachelors
Masters
Certificate
Associates
Career Education:
Diversified Institutions
University
TM
TM
International
Career-focused
*Demographics as of December 31, 2009
*Student Population as of June 30, 2010
Career-focused |
 $1.66
$1.84
2008
2009
2010 E
Business Results Continue to Improve,
Well Positioned for Future
Revenue
(In Billions)
15%+
Remain on pace to achieve operating performance improvement outlined in
February 2010 Analyst and Investor Day
Operating Income
(In Millions)
$350 -
$370
$143
$252
2008
2009
2010 E |
 CEC Strategy
Focus+Growth
Focus+Growth
= Value
= Value |
 CEC Strategic Summary
Operational
Focus
Solid
Demand
Enhance
Program
Development
Investment in
Leading IT
Platform
Utilize Scale &
Resources
Accelerate
M & A and
Geographic
Expansion
Growth
Elements
Continue Culture
of Quality and
Compliance
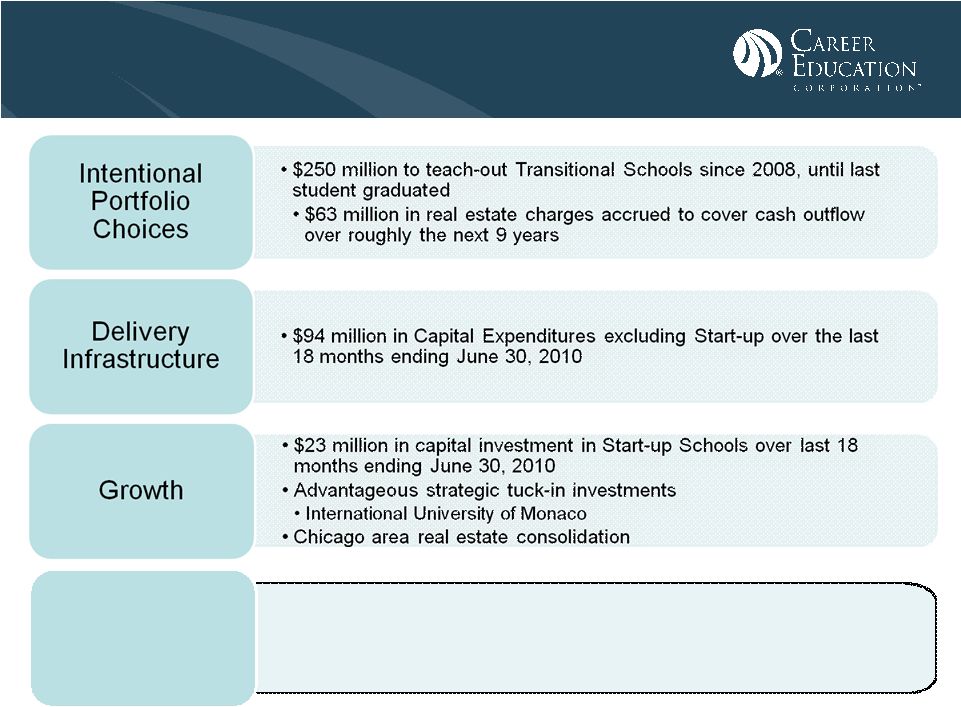
Intentional
Portfolio
Choices
Improve
Marketing
Effectiveness
Improve Human
Capital
Management
+ |
 CEC Strategic Summary: Focus
Focus
Continue
Culture of
Quality and
Compliance
Intentional
Portfolio
Choices
Improve
Marketing
Effectiveness
Improve
Human
Capital
Management
•
New Student Orientation Programs
•
College Preparatory Course
•
98% AIU/CTU Faculty have Masters/Doctoral Degrees
•
Employment placement of 78% within 6 months after end
of Academic Year (June 30)
•
15% increase in Career Services personnel since 2009
•
Low risk Institutional Self-Assessment ranking -
the number of
low-risk institutions more than tripled since 2007
•
CEC institutions comprise 25% of ACICS 2009 Honor Roll
•
6,500 Faculty dedicated to serving students |
 CEC Strategic Summary: Focus
Focus
Continue
Culture of
Quality and
Compliance
Intentional
Portfolio
Choices
Improve
Marketing
Effectiveness
Improve
Human
Capital
Management
•
Programs aligned with expected job growth
•
Business
•
IT
•
Healthcare |
 CEC Strategic Summary: Focus
Focus
Continue
Culture of
Quality and
Compliance
Intentional
Portfolio
Choices
Improve
Marketing
Effectiveness
Improve
Human
Capital
Management
•
Compliance
•
Lifetime Value Model
•
Student Interest Inquiry Model |
 CEC Strategic Summary: Focus
Focus
Continue
Culture of
Quality and
Compliance
Intentional
Portfolio
Choices
Improve
Marketing
Effectiveness
Improve
Human
Capital
Management
•
Significant
reduction
in
employee
turnover
•
Increase in employee training and instruction |
 CEC Strategic Summary: Growth
Growth
Solid
Demand
Enhance
Program
Development
Investment in
Leading IT
Platforms
Utilize Scale
& Resources
Accelerate
M & A and
Geographic
Expansion
•
Unmet student needs
•
“Working Adult”
segment expected to grow twice the rate of
traditional
•
Launched over 90 new programs YTD
•
Award winning architecture
•
Simpro
Technology Innovation
•
6 Start-ups in 2010
•
Disciplined approach to M&A
•
Tuck–in/Strategic acquisitions
•
Shared Services Model
•
Growth in student-facing functions |
 CEC Strategic Summary
Focus
Solid
Demand
Enhance
Program
Development
Investment in
Leading IT
Platform
Utilize Scale &
Resources
Accelerate
M & A and
Geographic
Expansion
+
Growth
Continue Culture
of Quality and
Compliance
Intentional
Portfolio
Choices
Improve
Marketing
Effectiveness
Improve Human
Capital
Management
=
Value
Value
For:
Students
Employees
Shareholders |
 Critical Role of Private-Sector Education
•
President Obama has stated goal of 8 million more college graduates by
2020
•
Education Secretary Duncan has said this can not be achieved without
Proprietary institutions
•
Without
Proprietary
institutions,
traditional
schools
would
need
another
5
million graduates or 13 million additional graduates by 2020
•
Without Proprietary schools, President’s initiative will cost U.S.
taxpayers over $800 billion over the next decade due to direct taxpayer
subsidies to traditional institutions |
 Mike
Graham Executive Vice President and
Chief Financial Officer
Copyright Career Education Corporation 2010 |
 2010 First Half Performance
Well positioned to achieve 2010 milestones
Well positioned to achieve 2010 milestones
established at February Analyst and Investor Day
established at February Analyst and Investor Day
•
Nearly 20,000 Graduates YTD*
•
22% Increase in Student Population
•
720 Basis Point Increase in Operating Margins to 17.3%
•
16% Increase in Career Services Personnel
•
18% Increase in Faculty
•
Placed Students at nearly 10,000 Employers
•
$155 million in Share Repurchases through June 30, 2010
•
Strong Balance Sheet and Cash Flow
•
Opened 4 New Health School Locations
*
Number
Graduates
from
1/1/2010
-
9/2/2010 |
  2010
2011 -
2014
Student Population Growth
15%+
8-10%
Revenue Growth
15%+
8-10%
Operating Income Growth
40%+
15-20%
Annual Growth
Milestones
2010+
•
Focus
•
Growth
•
Value |
 Revenue growth accelerates
•
Balanced
growth
across
key
segments with strong student
outcome prospects
•
Spent
over
$635
million
over
the
last twelve months on
Educational Services and
Facilities
Operating Expenses
•
Efficiency
Gains
-
Fixed-cost leverage
-
Advertising efficiency
•
Investments
-
Health start-ups
-
Chicago area Real Estate
Consolidation
-
High return projects
2010 Operating Margin
17.0%
to
17.5%
9.2%
8.6%
13.7%
Operating Margin
2007
2008
2009
2010 |
   Uses of Cash
•
Will continue to return cash to shareholders after high return
investments and consideration of Department of Education
Responsibility ratios
•
$355 million in share repurchase in 2009 and first half of 2010
Commitments |
 Gainful Employment
•
Proposed rules are highly complex
•
Conflicting Regulations
•
Potentially establishes price controls
•
Requires “threading the eye of the
needle”
•
Limited institutional control due to over
stipending of students limits
•
Retroactive application
•
Practical limitations to implementation
•
Availability of data
•
Transparency of calculations
•
Access to required information
•
Support for impact of proposed rules
•
Well developed process flows
•
Disproportional impact on schools with
diverse student population and open
enrollment
•
•
Comments submitted on
Comments submitted on
September 9, 2010
September 9, 2010
•
•
Hopeful Department will
Hopeful Department will
thoughtfully consider
thoughtfully consider
submission
submission
•
•
Plan to critically assess
Plan to critically assess
final rules and determine
final rules and determine
required business changes
required business changes
•
•
Believe combined impact of
Believe combined impact of
3 proposed tests would
3 proposed tests would
potentially affect Culinary
potentially affect Culinary
and Art & Design segments
and Art & Design segments
more than University and
more than University and
Health segments
Health segments
•
•
International Exempt
International Exempt |
 Thank You!
Copyright Career Education Corporation 2010 |