Attached files
| file | filename |
|---|---|
| 8-K - FORM 8-K - Archipelago Learning, Inc. | d76135e8vk.htm |
| EX-99.2 - EX-99.2 - Archipelago Learning, Inc. | d76135exv99w2.htm |
Exhibit 99.1
| 1 Safe Harbor Summary These slides and accompanying oral presentation contain forward-looking statements. These statements relate to future events or to future financial performance and involve known and unknown risks, uncertainties, and other factors that may cause our actual results, levels of activity, performance, or achievements to be materially different from any future results, levels of activity, performance, or achievements expressed or implied by these forward-looking statements. In some cases, you can identify forward-looking statements by the use of words such as "may," "could," "expect," "intend," "plan," "seek," "anticipate," "believe," "estimate," "predict," "potential," or "continue" or the negative of these terms or other comparable terminology. You should not place undue reliance on forward-looking statements because they involve known and unknown risks, uncertainties and other factors that are, in some cases, beyond our control and that could materially affect actual results, levels of activity, performance, or achievements. Factors that could materially affect actual results, levels of activity, performance or achievements include those referenced in the current report on Form 8-K filed with the Securities and Exchange Commission on June 10, 2010, and those listed under the caption "Risk Factors" of Archipelago Learning's Prospectus dated November 19, 2009, its annual report on Form 10-K filed with the Securities and Exchange Commission on March 5, 2010, and its quarterly reports filed on Form 10-Q with the Securities and Exchange Commission on May 12, 2010 and August 16, 2010. If any of these risks or uncertainties materialize, or if our underlying assumptions prove to be incorrect, actual results may vary significantly from our forward-looking statements. Any forward-looking statement you see or hear during this presentation reflects our current views with respect to future events and is subject to these and other risks, uncertainties, and assumptions relating to our operations, results of operations, growth strategy, and liquidity. We assume no obligation to publicly update or revise these forward-looking statements for any reason, whether as a result of new information, future events, or otherwise, except as required by law. |
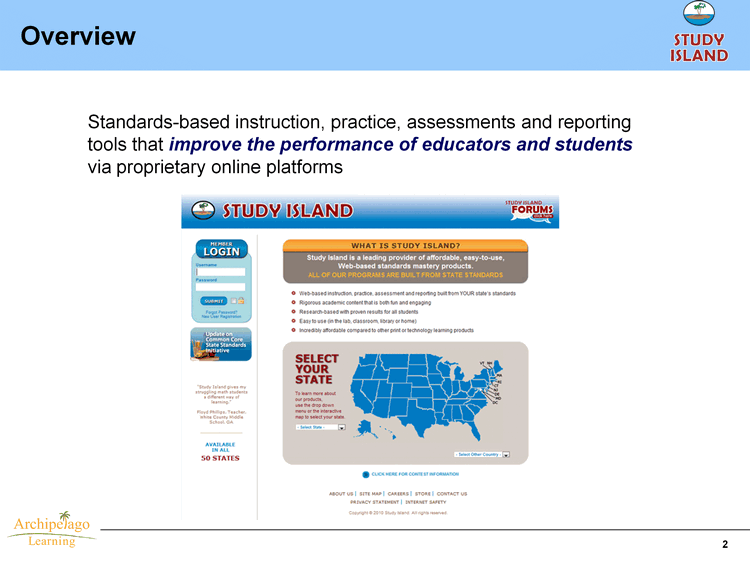
| 2 Overview Standards-based instruction, practice, assessments and reporting tools that improve the performance of educators and students via proprietary online platforms |
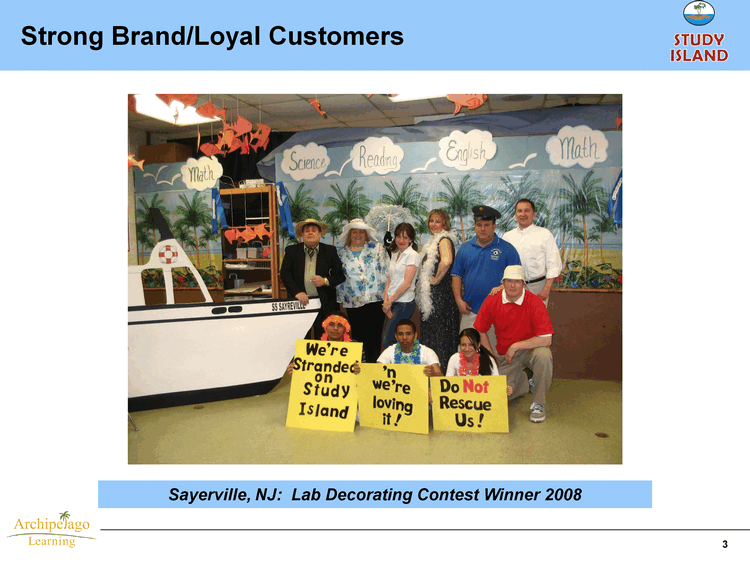
| 3 Sayerville, NJ: Lab Decorating Contest Winner 2008 Strong Brand/Loyal Customers |
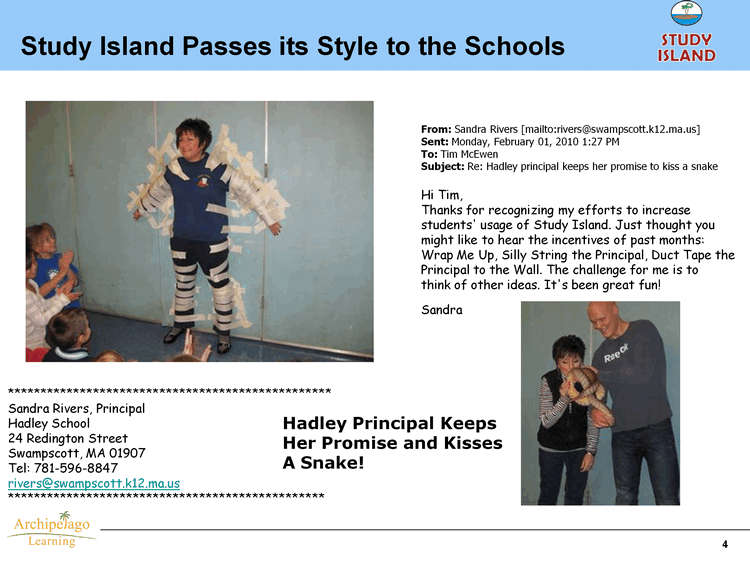
| Study Island Passes its Style to the Schools 4 From: Sandra Rivers [mailto:rivers@swampscott.k12.ma.us] Sent: Monday, February 01, 2010 1:27 PM To: Tim McEwen Subject: Re: Hadley principal keeps her promise to kiss a snake Hi Tim, Thanks for recognizing my efforts to increase students' usage of Study Island. Just thought you might like to hear the incentives of past months: Wrap Me Up, Silly String the Principal, Duct Tape the Principal to the Wall. The challenge for me is to think of other ideas. It's been great fun! Sandra ************************************************* Sandra Rivers, Principal Hadley School 24 Redington Street Swampscott, MA 01907 Tel: 781-596-8847 rivers@swampscott.k12.ma.us ************************************************ Hadley Principal Keeps Her Promise and Kisses A Snake! |

| 5 Study Island Highlights subscription-based revenue with strong renewal rates, high margins and cash flow 100% online across 50 states 22,842 schools student users 10.2 million Study Island questions answered by students in 2009 - 2010 school year 3.5 billion of new customers come via educator "word-of-mouth" referrals 68% Products |
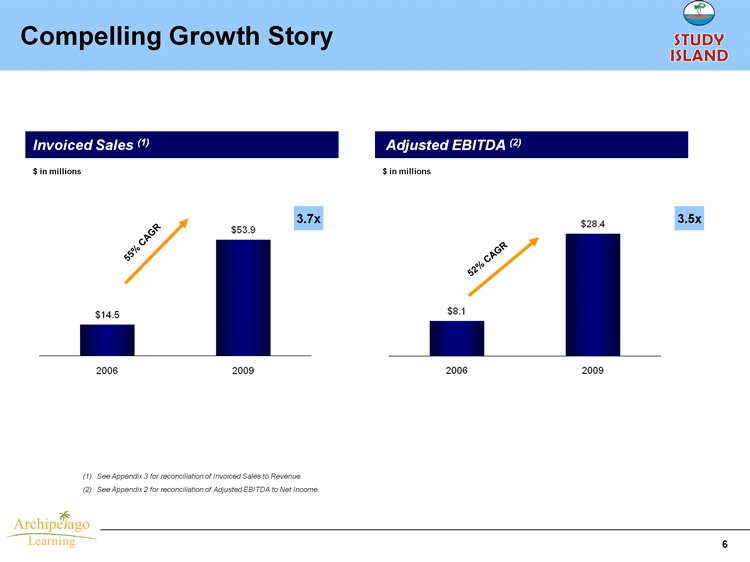
| 6 Compelling Growth Story $ in thousands Invoiced Sales (1) Adjusted EBITDA (2) 55% CAGR 52% CAGR 3.7x $ in millions 3.5x $ in millions See Appendix 3 for reconciliation of Invoiced Sales to Revenue. See Appendix 2 for reconciliation of Adjusted EBITDA to Net Income. |
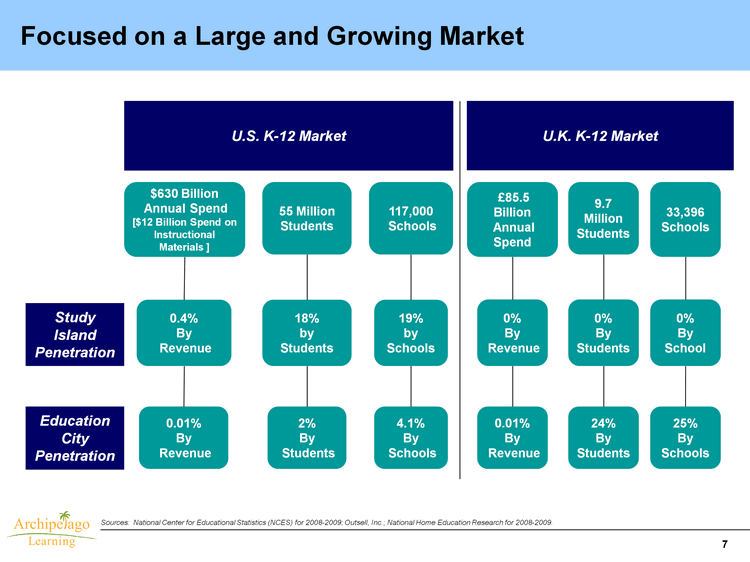
| 7 Focused on a Large and Growing Market Sources: National Center for Educational Statistics (NCES) for 2008-2009; Outsell, Inc.; National Home Education Research for 2008-2009. U.K. K-12 Market Study Island Penetration $630 Billion Annual Spend [$12 Billion Spend on Instructional Materials ] 55 Million Students 117,000 Schools 0.4% By Revenue 18% by Students 19% by Schools Education City Penetration U.S. K-12 Market 9.7 Million Students 33,396 Schools 0% By Students 0% By School 0.01% By Revenue 2% By Students 4.1% By Schools 25% By Schools 24% By Students £85.5 Billion Annual Spend 0% By Revenue 0.01% By Revenue |
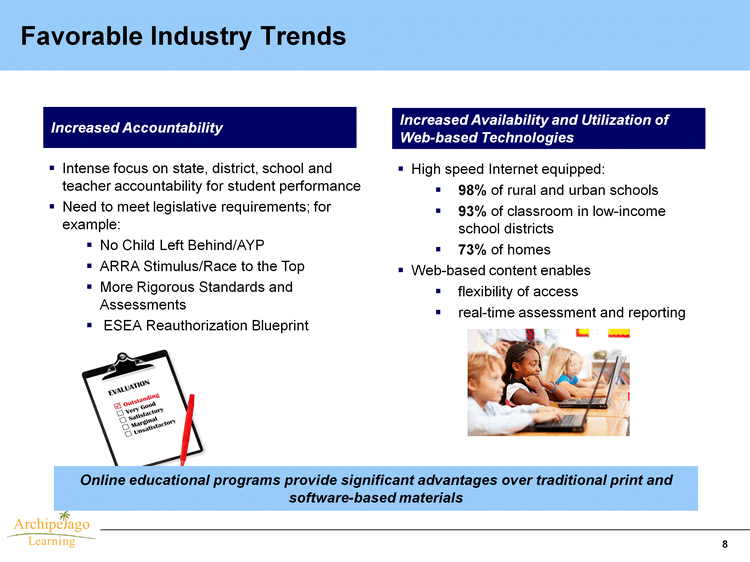
| 8 Favorable Industry Trends Increased Accountability Increased Availability and Utilization of Web-based Technologies Intense focus on state, district, school and teacher accountability for student performance Need to meet legislative requirements; for example: No Child Left Behind/AYP ARRA Stimulus/Race to the Top More Rigorous Standards and Assessments ESEA Reauthorization Blueprint High speed Internet equipped: 98% of rural and urban schools 93% of classroom in low-income school districts 73% of homes Web-based content enables flexibility of access real-time assessment and reporting Online educational programs provide significant advantages over traditional print and software-based materials |
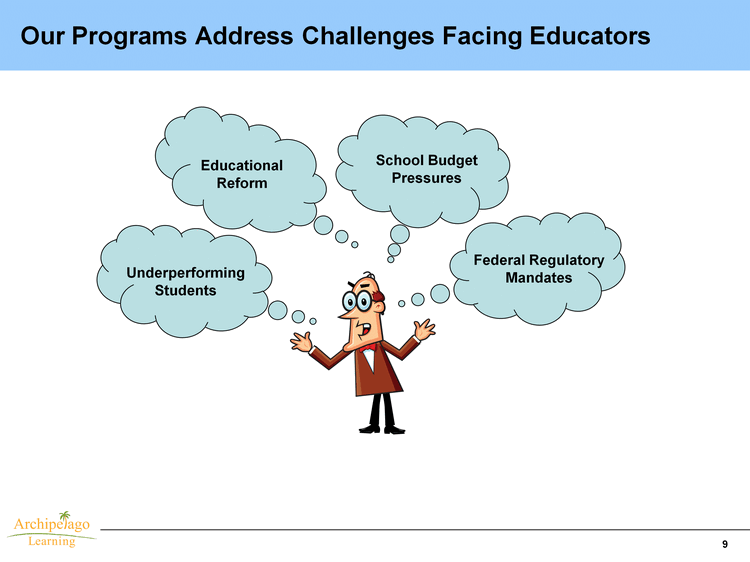
| 9 Our Programs Address Challenges Facing Educators School Budget Pressures Federal Regulatory Mandates Underperforming Students Educational Reform |
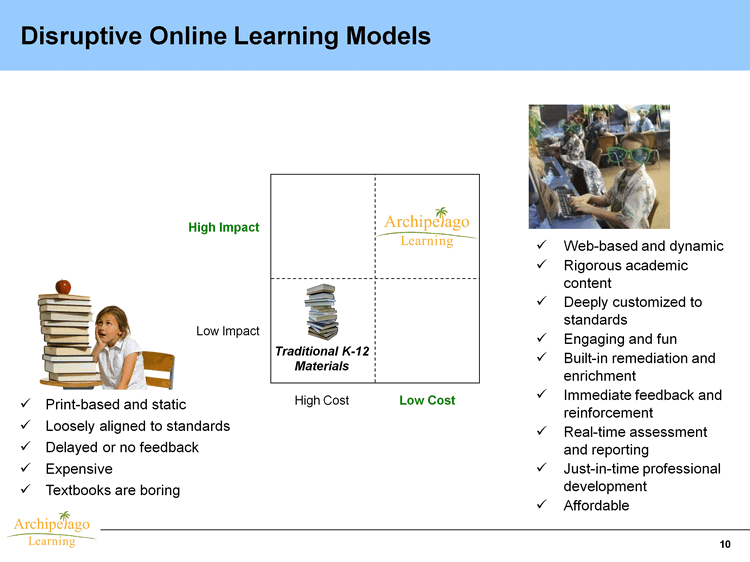
| 10 Disruptive Online Learning Models Web-based and dynamic Rigorous academic content Affordable Real-time assessment and reporting Immediate feedback and reinforcement High Cost Low Cost Low Impact High Impact Traditional K-12 Materials u Print-based and static u Loosely aligned to standards u Delayed or no feedback u Expensive Engaging and fun u Textbooks are boring u u u u u u Deeply customized to standards u Built-in remediation and enrichment u Just-in-time professional development u |

| 11 Attractive Value Proposition $3 to $10 per student, per subject Pricing based on # of students per grade and # of subject areas purchased School level decision making; District level approval often not required Reading Writing Mathematics Science Social Studies Comprehensive High-Impact Solution Multiple Sources of Funding Affordably Priced Study Island's high impact / low cost value proposition makes it an attractive purchase when budgets are tight Federal (ESEA) Grants Private Tuition ARRA Stimulus State PTA Charities School Discretionary Budget Above-Grade: Gifted On-Grade: Level Below-Grade: Tier I and Tier II Intervention Standards Based Remediation and Enrichment Race to the Top |

| 3 Content Creation via "Rapid Application Development" Team System Process Results "Is it possible to add a story about Ninjas?" - teacher input "Let's add a Ninja story to 4th grade Reading for all states" - content team discussion Ninja story in place for 4th grade Reading for all states! Highly talented specialists across all disciplines, many former teachers Self-directed discipline teams Animation development team supports all subjects Fully integrated content management system, with direct HTML authoring Content tagged for maximum reuse Searchable across multiple vectors Supports video, animations, etc. Subject teams leverage expertise to quickly develop, validate initial draft Peer review, customer feedback allow for real-time continuous improvement Content reuse allows for extremely fast time to market 324,000 proprietary questions and problem sets 233 topic level instructional videos 96 professional development clips Tuesday - 11:00am Tuesday - 9:00am Tuesday - 10:00pm Success Criteria 12 |
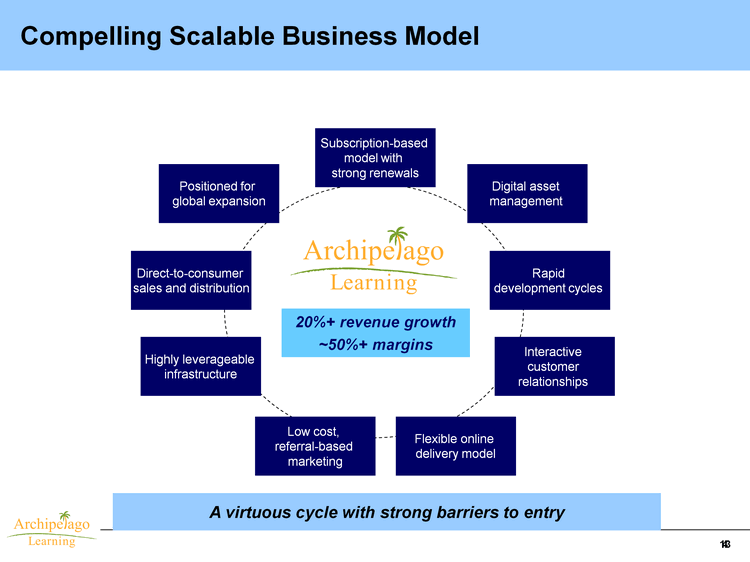
| 4 Highly leverageable infrastructure Compelling Scalable Business Model 20%+ revenue growth ~50%+ margins Digital asset management Rapid development cycles Direct-to-consumer sales and distribution Subscription-based model with strong renewals Low cost, referral-based marketing Positioned for global expansion Flexible online delivery model Interactive customer relationships A virtuous cycle with strong barriers to entry 13 |

| 14 Multiple Opportunities for Growth ? Expand number of schools Increase revenue per school New growth initiatives Pursue additional growth opportunities |
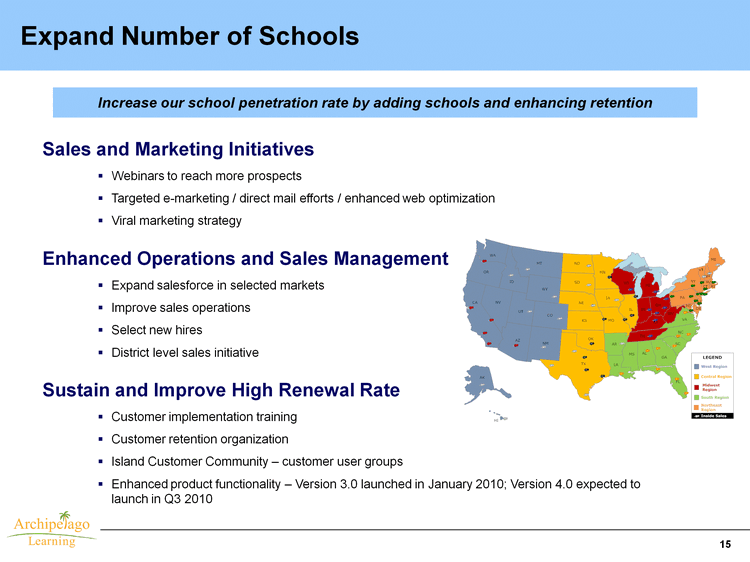
| 15 Expand Number of Schools Increase our school penetration rate by adding schools and enhancing retention Webinars to reach more prospects Targeted e-marketing / direct mail efforts / enhanced web optimization Viral marketing strategy Sales and Marketing Initiatives Expand salesforce in selected markets Improve sales operations Select new hires District level sales initiative Enhanced Operations and Sales Management Customer implementation training Customer retention organization Island Customer Community - customer user groups Enhanced product functionality - Version 3.0 launched in January 2010; Version 4.0 expected to launch in Q3 2010 Sustain and Improve High Renewal Rate |
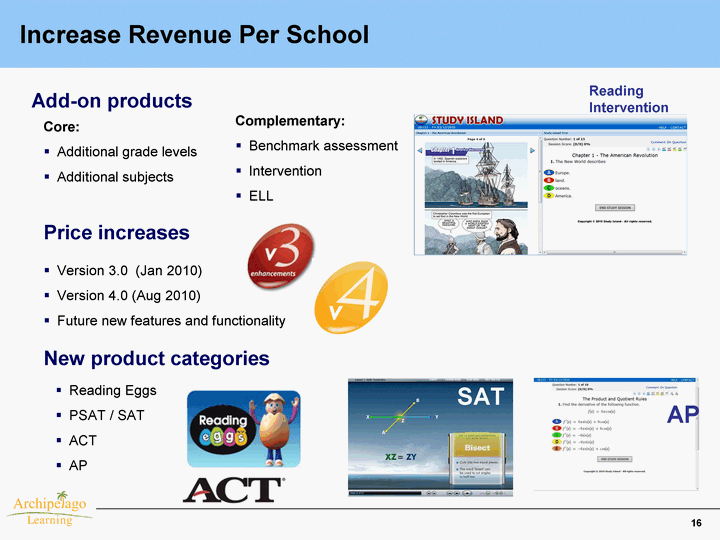
| 16 Increase Revenue Per School Core: Additional grade levels Additional subjects Add-on products Version 3.0 (Jan 2010) Version 4.0 (Aug 2010) Future new features and functionality Price increases Reading Eggs PSAT / SAT ACT AP New product categories Complementary: Benchmark assessment Intervention ELL SAT AP Reading Intervention |
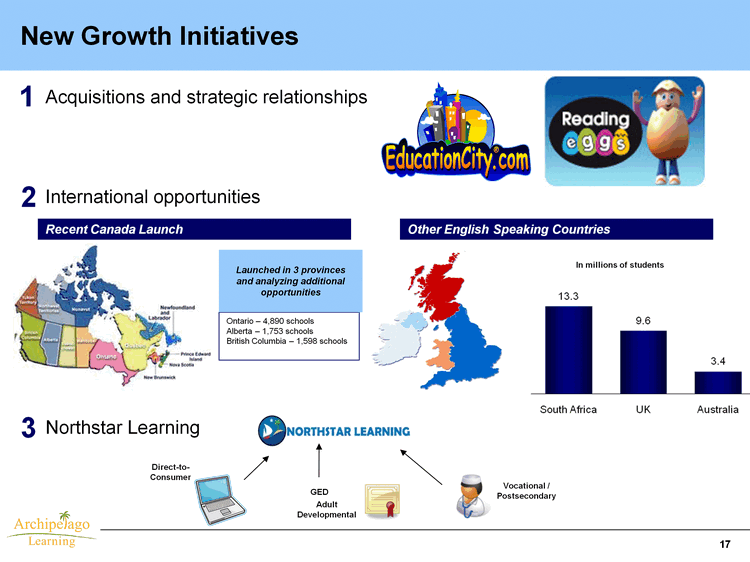
| 17 International opportunities New Growth Initiatives Northstar Learning GED Vocational / Postsecondary Adult Developmental Direct-to- Consumer 1 2 Recent Canada Launch Other English Speaking Countries In millions of students Acquisitions and strategic relationships 3 Ontario - 4,890 schools Alberta - 1,753 schools British Columbia - 1,598 schools Launched in 3 provinces and analyzing additional opportunities |
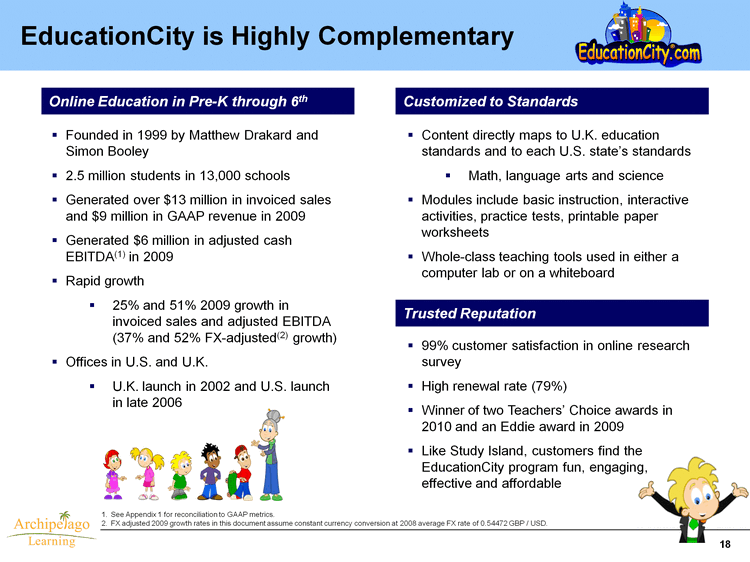
| EducationCity is Highly Complementary Online Education in Pre-K through 6th Customized to Standards Founded in 1999 by Matthew Drakard and Simon Booley 2.5 million students in 13,000 schools Generated over $13 million in invoiced sales and $9 million in GAAP revenue in 2009 Generated $6 million in adjusted cash EBITDA(1) in 2009 Rapid growth 25% and 51% 2009 growth in invoiced sales and adjusted EBITDA (37% and 52% FX-adjusted(2) growth) Offices in U.S. and U.K. U.K. launch in 2002 and U.S. launch in late 2006 Content directly maps to U.K. education standards and to each U.S. state's standards Math, language arts and science Modules include basic instruction, interactive activities, practice tests, printable paper worksheets Whole-class teaching tools used in either a computer lab or on a whiteboard Trusted Reputation 99% customer satisfaction in online research survey High renewal rate (79%) Winner of two Teachers' Choice awards in 2010 and an Eddie award in 2009 Like Study Island, customers find the EducationCity program fun, engaging, effective and affordable See Appendix 1 for reconciliation to GAAP metrics. FX adjusted 2009 growth rates in this document assume constant currency conversion at 2008 average FX rate of 0.54472 GBP / USD. 18 |

| Strong Strategic Fit Compelling Product Offering Well Aligned with Study Island Brand Expands Archipelago Learning into core classroom instruction and individualized instruction to help students learn basic academic content, which can then be reinforced and mastered using Study Island Like Study Island, customers find the EducationCity program fun, engaging, effective and affordable Enhances Capabilities of Existing Study Island Offering Bolsters Study Island's current K-6 product offering, particularly at the lower grades, K-3 Complements Study Island's standards-based practice, assessment and test-prep value proposition Provides Entry Point for Study Island into U.K. Market Attractive Organic Growth Profile and Business Model Invoiced sales growth of 37% in 2009 (FX-adjusted) High impact, low cost product with strong recurring revenue base and high margins Opportunity for Synergy / Revenue Upside from Combination Potential to leverage each company's sales force and customer base to drive greater sales of EducationCity's offerings in the U.S. and of ARCL's offerings in the U.K. and other English speaking countries EducationCity's growth potential is significant Study Island customers recognized EducationCity as the most desired complementary product (1) 1. As identified by independent Market Measurement customer survey, November 2009. 19 |

| 20 Strong Leadership Team Name Tim McEwen James Walburg Martijn Tel Ray Lowrey Cathy Caldwell Julie Huston Allison Duquette Greg Smith Matt Drakard Simon Booley Years in Education 34 3 7 12 8 17 13 21 11 11 Position CEO CFO COO CTO VP, Product Development EVP, Sales Chief Marketing Officer Director, Customer Retention Founder, Education City Founder, Education City Management experience Educational expertise Entrepreneurial culture 1 2 3 |

| Financial Overview 21 |
| 22 Financial Highlights High Growth Revenue & Earnings Visibility Profitable & Scalable Strong Cash Flow Conversion Disruptive SaaS model in K-12 education |
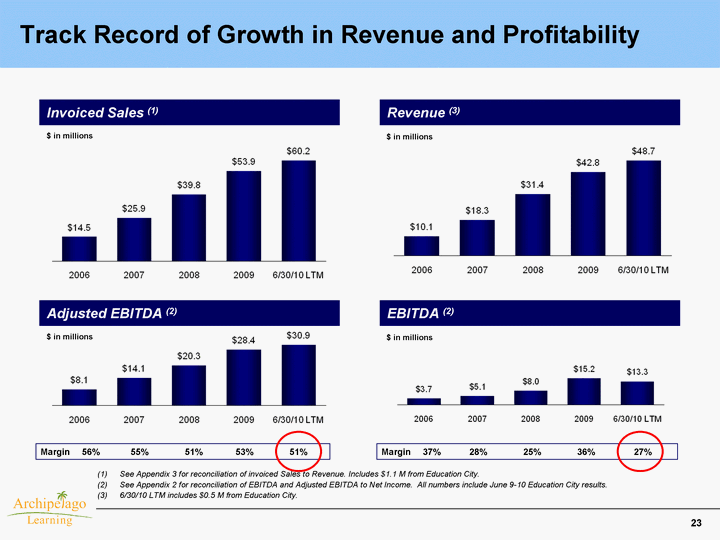
| 23 Track Record of Growth in Revenue and Profitability See Appendix 3 for reconciliation of invoiced Sales to Revenue. Includes $1.1 M from Education City. See Appendix 2 for reconciliation of EBITDA and Adjusted EBITDA to Net Income. All numbers include June 9-10 Education City results. 6/30/10 LTM includes $0.5 M from Education City. Invoiced Sales (1) Revenue (3) Adjusted EBITDA (2) EBITDA (2) $ in millions $ in millions 56% Margin 55% 51% 53% 37% Margin 28% 25% 36% $ in millions $ in millions 27% 51% |
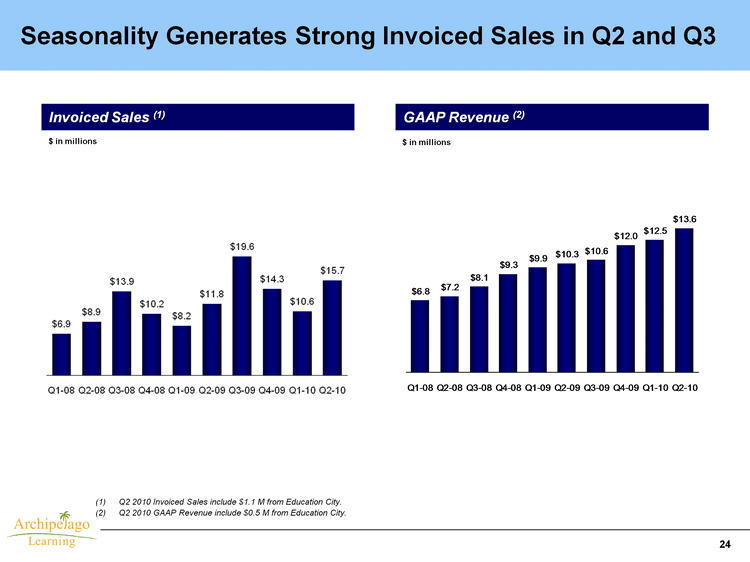
| 24 Seasonality Generates Strong Invoiced Sales in Q2 and Q3 Invoiced Sales (1) GAAP Revenue (2) $ in millions $ in millions Q2 2010 Invoiced Sales include $1.1 M from Education City. Q2 2010 GAAP Revenue include $0.5 M from Education City. |

| 25 Key Performance Metrics - 2009 Invoiced Sales GAAP Revenue % of Invoiced Sales % of GAAP Revenue Invoiced Sales $53,874 Cost of Revenue 6% Gross Profit 94% Sales and Marketing 26% Content Development 7% General & Administrative 17% Operating Profit 44% GAAP Revenue $42,768 Cost of Revenue 7% Gross Profit 93% Sales and Marketing 33% Content Development 9% General & Administrative 22% Operating Profit 29% See Appendix 2 for reconciliation of Adjusted EBITDA to Net Income. Depreciation & Amortization Non-recurring Charges & Other 5% 4% Adjusted EBITDA (1) Depreciation & Amortization Non-recurring Charges & Other 6% 5% Adjusted EBITDA (1) 66% 53% Change in Deferred Revenue 26% |

| 26 Strong Cash Flow Conversion Adjusted Free Cash Flow (FCF) (1) (3) $ in millions 239% Conversion EBITDA (2) 136% 124% (1) See Appendix 4 for reconciliation of Adjusted Free Cash Flow (FCF) to cash flow from operating activities. Conversion defined as Adjusted FCF / EBITDA and Adjusted FCF/Adjusted EBITDA. See Appendix 2 and 4 for reconciliation of EBITDA, Adjusted EBITDA and Adjusted FCF. Adjusted FCF includes June 9-30 Education City results. The Company's strong cash flow generation supports additional growth 87% Conversion Adj. EBITDA (2) 54% 67% 161% 70% |
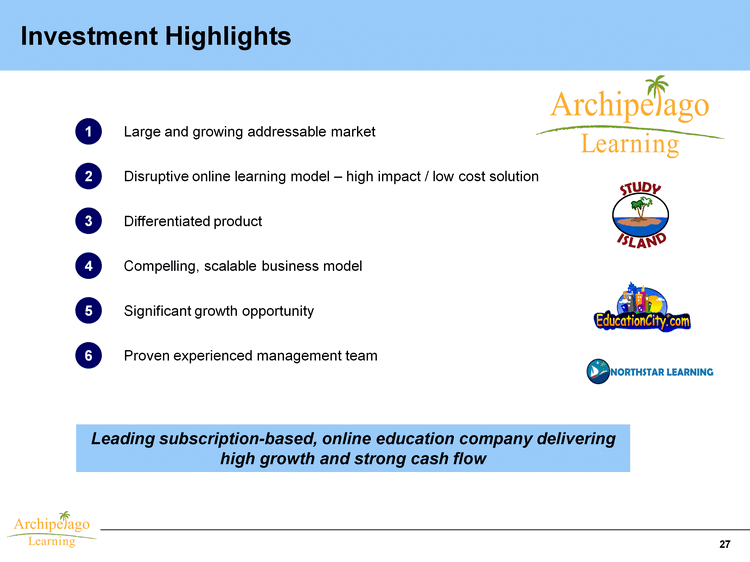
| 27 Investment Highlights Large and growing addressable market Differentiated product Disruptive online learning model - high impact / low cost solution Compelling, scalable business model Significant growth opportunity Proven experienced management team 1 2 3 4 5 6 Leading subscription-based, online education company delivering high growth and strong cash flow |

| The Combined Company is a Powerful Player in the Online Education Market subscription-based revenue with strong renewal rates, high margins and cash flow 100% online across the U.S., U.K. and Canada ~35,000 schools student users worldwide ~12+ million ...and we're just getting started... The Future of K-12 Education is Here Today 28 |
| Appendix 29 |
| Acquisition of EducationCity June 9, 2010 Appendix 1 30 |
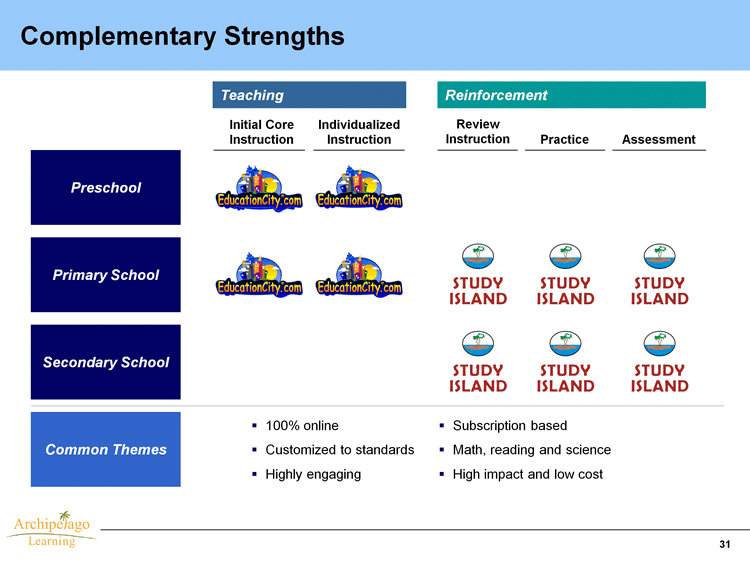
| 31 Complementary Strengths Reinforcement Teaching 100% online Customized to standards Highly engaging Preschool Primary School Secondary School Common Themes Subscription based Math, reading and science High impact and low cost Practice Assessment Review Instruction Initial Core Instruction Individualized Instruction |

| Entry into Attractive U.K. Market Furthers U.S. Penetration & Growth Opportunities 32 Naperville, Illinois (near Chicago) Entered U.S. market in late 2006 5,200 square feet / leased office space 38 employees and 30 seasonal sales temps Rutland, U.K. (near Birmingham) Entered U.K. market in 2002 Moved office to new premises in 2009 Over 9,000 square feet / leased office space 67 employees U.K. Market Opportunity Addressable market: ~30,000+ schools ~10 million students Currently in 8,200 schools U.S. Market Opportunity Addressable market: 118,000 schools 50+ million students Currently in 4,800 schools Attractive Global Footprint |

| 33 Appendix 2: Adjusted EBITDA Reconciliation Adjusted EBITDA Reconciliation includes $.6 M from June 9-30 Education City results. |
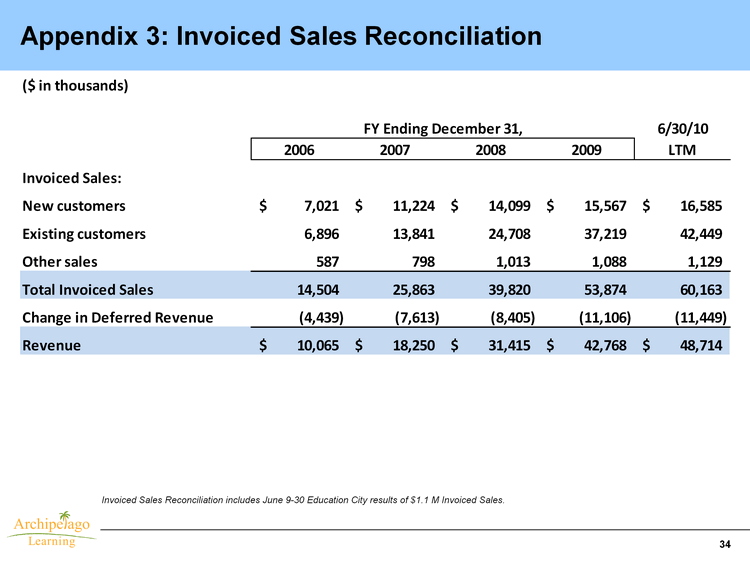
| Appendix 3: Invoiced Sales Reconciliation ($ in thousands) 6/30/10 2006 2007 2008 2009 LTM FY Ending December 31, Invoiced Sales: New customers $ 7,021 $ 11,224 $ 14,099 $ 15,567 $ 16,585 Existing customers 6,896 13,841 24,708 37,219 42,449 Other sales 587 798 1,013 1,088 1,129 Total Invoiced Sales 14,504 25,863 39,820 53,874 60,163 Change in Deferred Revenue (4,439) (7,613) (8,405) (11,106) (11,449) Revenue $ 10,065 $ 18,250 $ 31,415 $ 42,768 $ 48,714 34 Invoiced Sales Reconciliation includes June 9-30 Education City results of $1.1 M Invoiced Sales. |
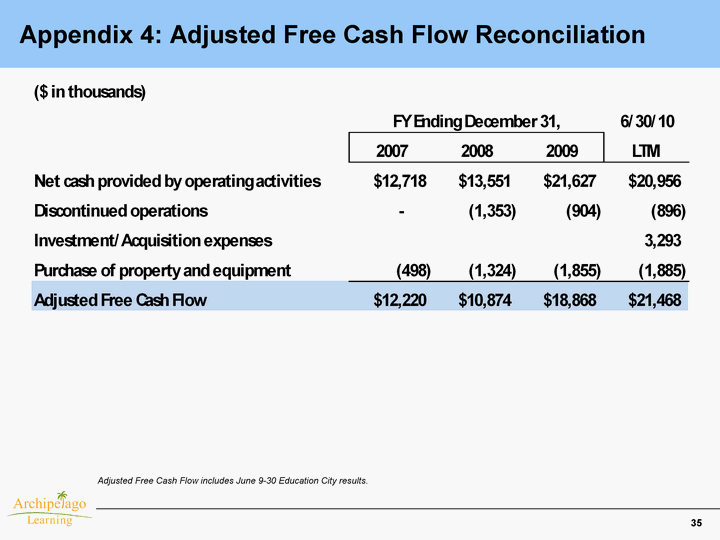
| 35 Appendix 4: Adjusted Free Cash Flow Reconciliation Adjusted Free Cash Flow includes June 9-30 Education City results. |