Attached files
| file | filename |
|---|---|
| 8-K - 8-K FOR UBS CONFERENCE PRESENTATION - TEMPLE INLAND INC | tin8k20100915.htm |

1
Our job is to be the best
UBS Global Paper and Forest Products
Conference
Conference
September 15, 2010

2
This presentation contains “forward-looking statements” within the meaning of the federal
securities laws. These statements reflect management’s current views with respect to future
events and are subject to risk and uncertainties. We note that a variety of factors and uncertainties
could cause our actual results to differ significantly from the results discussed in the forward-
looking statements. Factors and uncertainties that might cause such differences include, but are
not limited to: general economic, market, or business conditions; the opportunities (or lack
thereof) that may be presented to us and that we may pursue; fluctuations in costs and expenses
including the costs of raw materials, purchased energy, and freight; changes in interest rates;
demand for new housing; accuracy of accounting assumptions related to impaired assets,
pension and postretirement costs, contingency reserves and income taxes; competitive actions by
other companies; changes in laws or regulations; our ability to execute certain strategic and
business improvement initiatives; the accuracy of certain judgments and estimates concerning the
integration of acquired operations; and other factors, many of which are beyond our control.
Except as required by law, we expressly disclaim any obligation to publicly revise any forward-
looking statements contained in this presentation to reflect the occurrence of events after the date
of this presentation.
This presentation includes non-GAAP financial measures. The required reconciliations to
GAAP financial measures are included on our website, www.templeinland.com.
GAAP financial measures are included on our website, www.templeinland.com.

3
Create Superior and Sustainable Value
• Maximize ROI
• Profitably grow our business

Scorecard
• Corrugated Packaging
– 10.8% first half 2010 ROI
– Positioned for record earnings in the second half of
2010
2010
– Fifth consecutive year of above cost of capital returns
• Building Products
– Positive first half EBIT
– First half EBITDA of $27 million
4
5
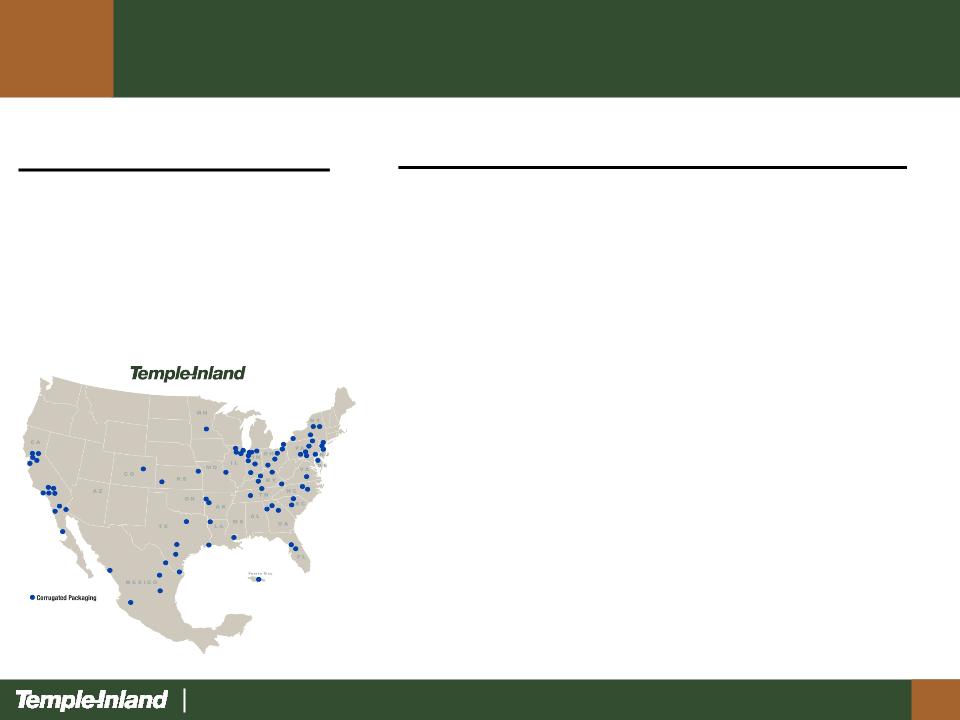
Corrugated Packaging Segment Highlights
• 7 mills
- 3.9 million tons
• 60 converting facilities
- 3.7 million tons
• # 3 industry producer
Business Highlights
Financial Highlights
|
($ in Millions)
|
|
2006
|
2007
|
2008
|
2009
|
|
Revenue
|
|
$2,977
|
$3,044
|
$3,190
|
$3,001
|
|
EBIT
|
|
$255
|
$287
|
$225
|
$347
|
|
Investment
|
|
$2,039
|
$2,004
|
$1,990
|
$2,109
|
|
ROI
|
|
12.5%
|
14.3%
|
11.3%
|
16.5%
|
|
EBITDA
|
|
$408
|
$429
|
$371
|
$492
|

6
Corrugated Packaging Strategic Initiatives
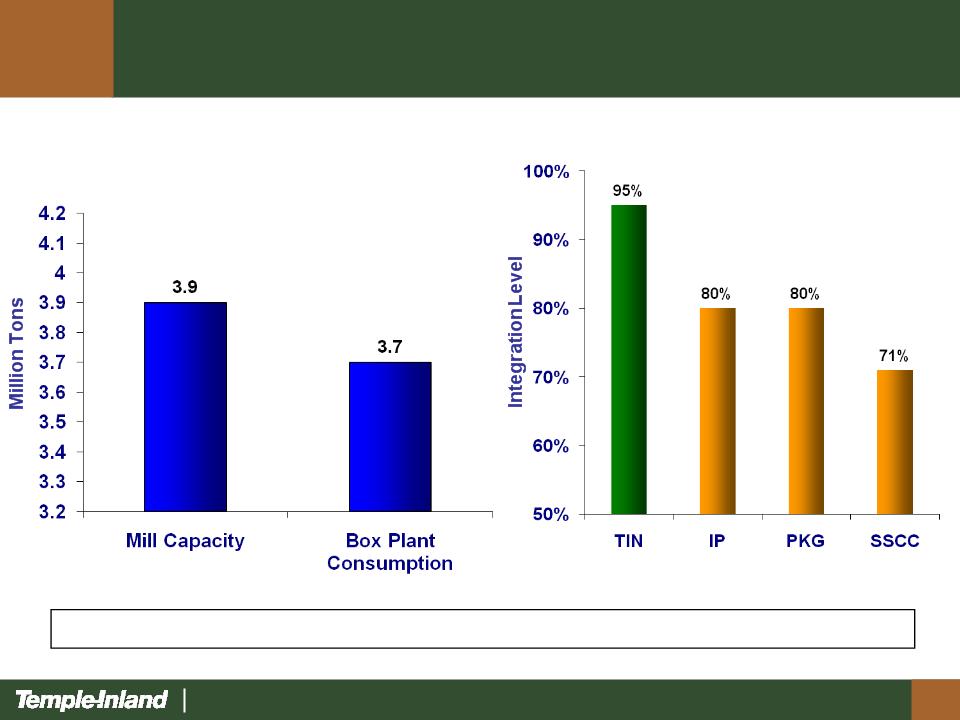
• Maintain high integration level
- Box plant consumption = mill capacity
• Drive for low cost
- Asset utilization and manufacturing excellence
• Improve mix and margins
- Sales excellence
• Profitably grow business
- Organically / Acquisition
Lowering Costs, Improving Efficiencies and Growing Profitably
7
Integration Level - Highest in the Industry
Source: Company reports
Temple-Inland is the most integrated producer of corrugated containers

Drive For Low Cost
• Lower mill cost
– Targeted capital to enhance reliability, reduce
energy consumption and enhance mix
flexibility
energy consumption and enhance mix
flexibility
• Lower box plant cost
– Box Plant Transformation I and II
8

9
Box Plant Transformation I (2006-2010)
• EBIT (Lower Costs) $80MM/Year
– Fewer Plants 4
– Fewer Machines 88
– Fewer Positions 1,157
• Investment $174MM
• ROI 46%

10
Box Plant Transformation II (2010-2013)
• EBIT (Lower Costs) $100MM/Year
– Fewer Plants 12
– Fewer Machines 65
– Fewer Positions 900
• Investment $250MM
• ROI 40%

11
Improve Mix and Margins
• Customer segmentation
• Target richer segment of customer
portfolio
portfolio

12
Profitably Grow Our Business
• PBL acquisition
– $20 million of synergies
– $30 million from white-top
– 60% ROI
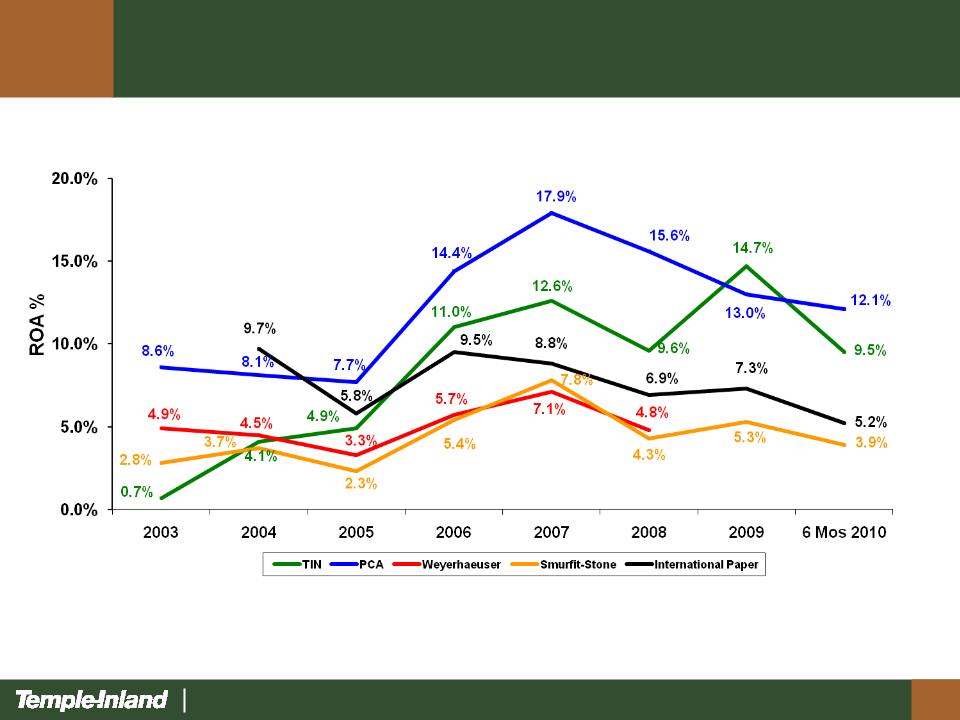
Corrugated Packaging
Comparative Peer Group Returns
Comparative Peer Group Returns
Notes: (1) As reported by segment excluding special items for TIN, IP and Weyerhaeuser. For TIN and IP, the asset base was adjusted to include acquisitions made in Q3 2008.
(2) For PCA, EBIT = Gross profit-selling and administrative expenses. (3) For SSCC, EBIT as reported by segment; total assets reported for the company beginning in 2007.
For prior years, total assets = segment assets + other assets of $3.3 billion.
13

North American Corrugated Packaging
Industry Fundamentals
Industry Fundamentals
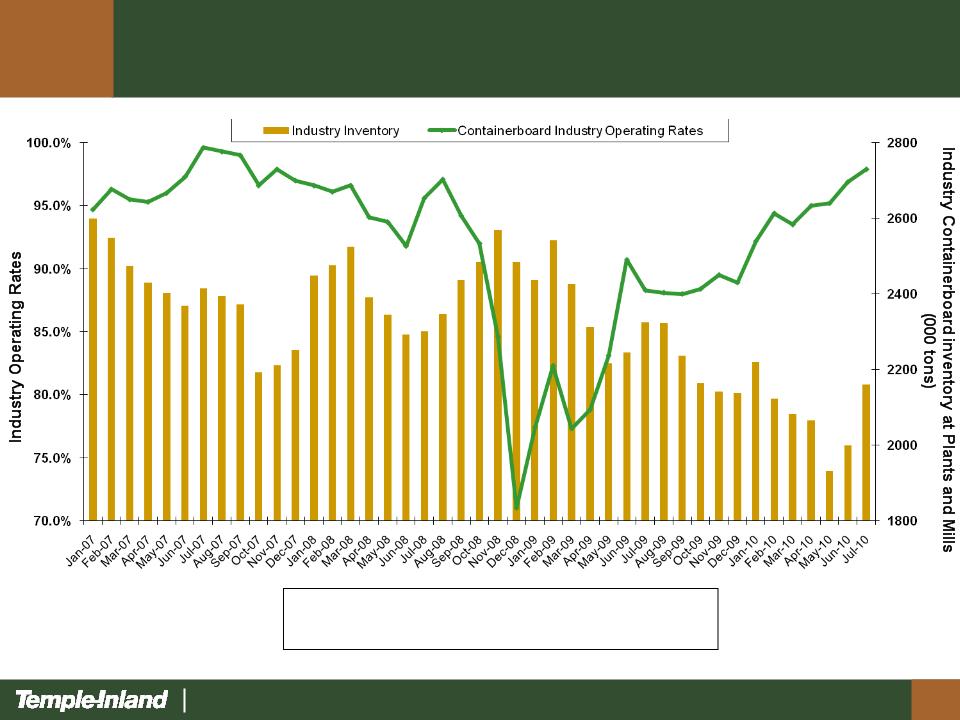
• Low inventories
• High operating rates
• Positive demand
• Improved linerboard pricing
14
15
Source: Fibre Box Association and AF&PA
July 2010 inventories were lowest
July level since 1979
Rising Industry Operating Rates
and Lower Inventories
and Lower Inventories
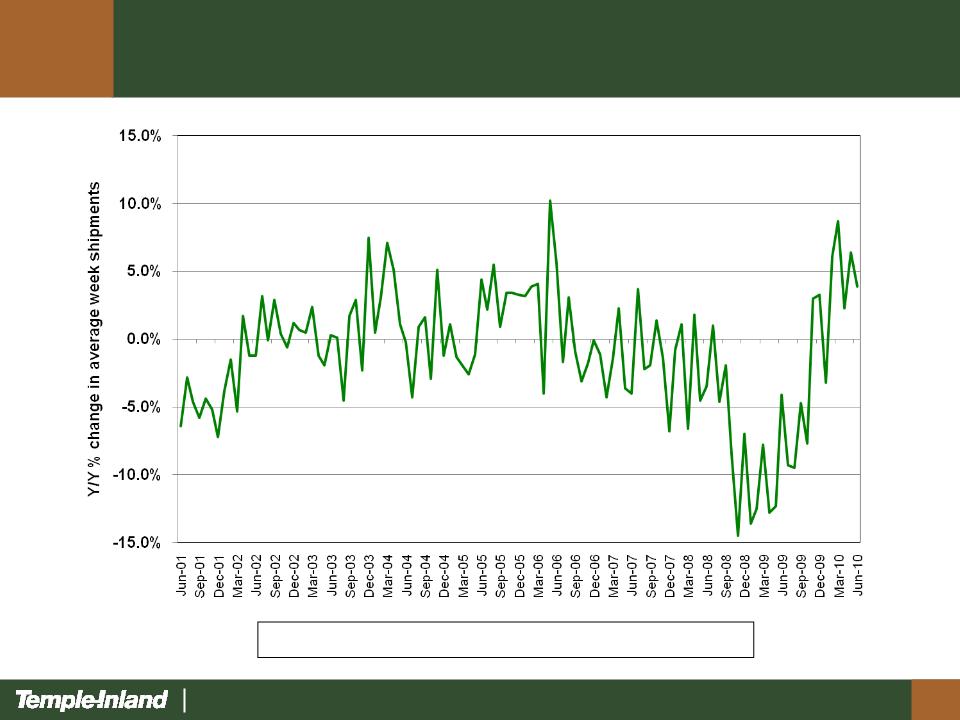
Improving Box Demand
16
Year-to-date industry box demand is up 3.2%
Source: Fibre Box Association
17
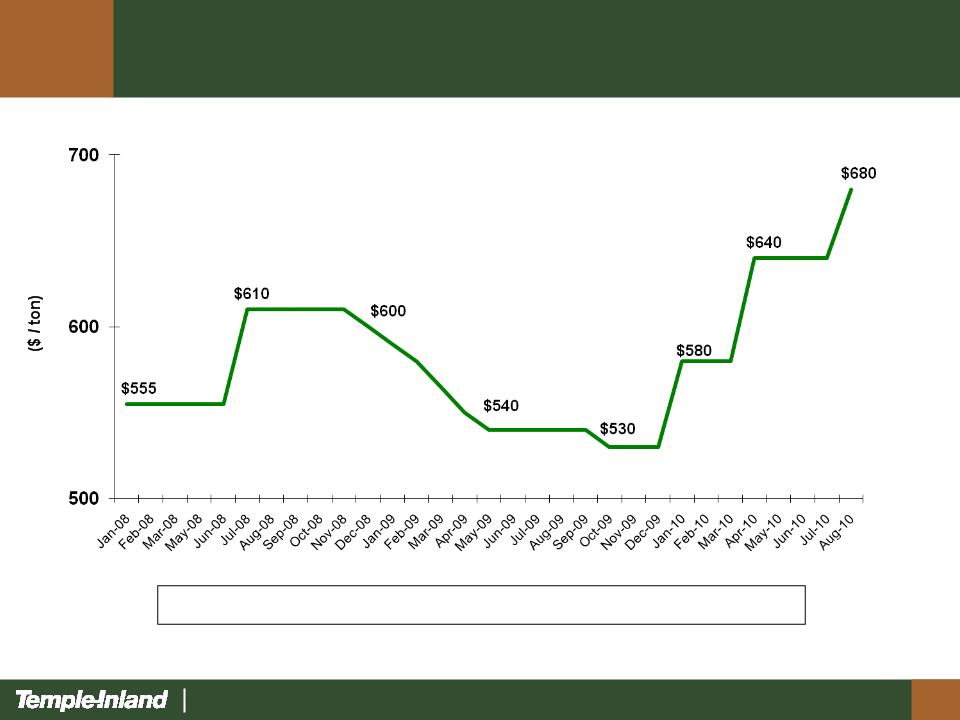
Improving Linerboard Pricing
Linerboard prices have risen 28% in the last 12 months
Source: Pulp and Paper Week

18
Corrugated Packaging Summary
• Simple, effective strategy…execution = results
• Track record of success
• Improved industry fundamentals
19
Building Products
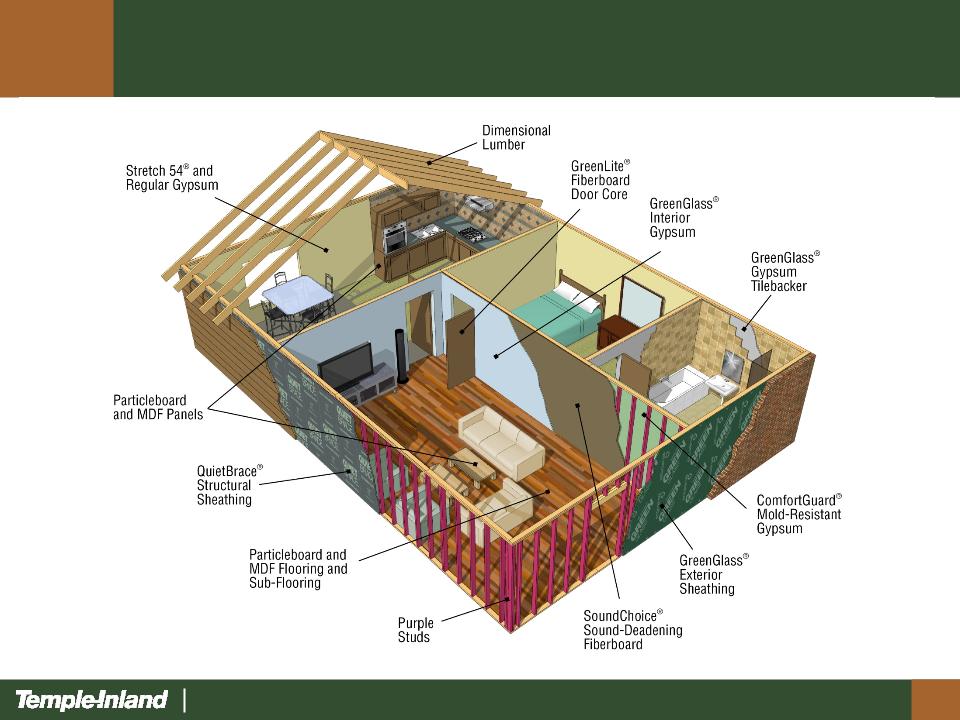
• Portfolio of Products
– Lumber
– Gypsum
– Particleboard
– MDF
• Lowest quartile cost converting
operations
operations
• Located near large, high-growth
markets
markets
Financial Highlights
Business Highlights
|
($ in Millions)
|
2006
|
2007
|
2008
|
2009
|
|
Revenue
|
$1,119
|
$806
|
$694
|
$576
|
|
EBIT
|
$221
|
$8
|
($40)
|
($27)
|
|
Investment
|
$586
|
$562
|
$560
|
$535
|
|
ROI
|
37.7%
|
1.4%
|
(7.1%)
|
(5.0%)
|
|
EBITDA
|
$265
|
$53
|
$8
|
$17
|
|
Housing Starts (000’s)
|
1,812
|
1,342
|
900
|
553
|

20
Building Products Strategic Initiatives
• Deliver tailored portfolio of building products
– Products for new home, repair and remodeling
and commercial markets
and commercial markets
• Drive low cost
– Manufacturing excellence
• Serve preferred markets
– Favorable demographics
• Profitably grow business
21
Tailored Products

22
Low Cost Operations
Buna
Pineland
Diboll
Rome
DeQuincy
Lumber
Competitive
Position
1st
Quartile
2nd
Quartile
3rd
Quartile
4th
Quartile
Gypsum
Competitive
Position
Cumberland
Fletcher
W. Memphis
McQueeney
Panels
Competitive
Position
Monroeville
Hope
Diboll
Thomson
PB
MDF
El Dorado
Mt. Jewett
80% of Building Products operations are in lowest cost quartile
1st
Quartile
2nd
Quartile
3rd
Quartile
4th
Quartile
1st
Quartile
2nd
Quartile
3rd
Quartile
4th
Quartile
Source: Beck & RISI studies and internal analysis
23
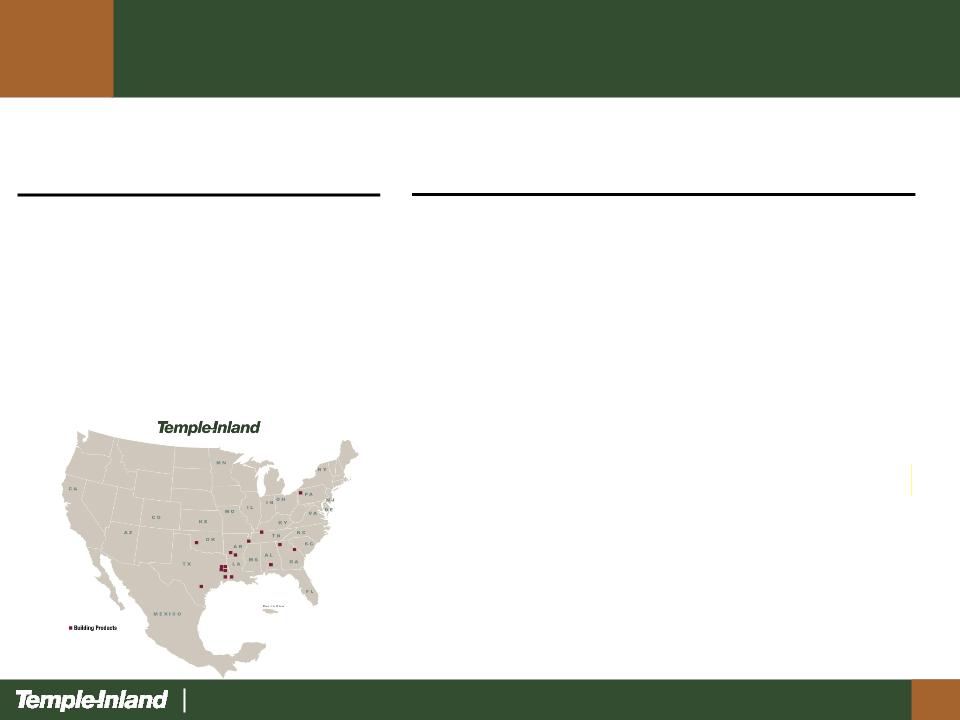
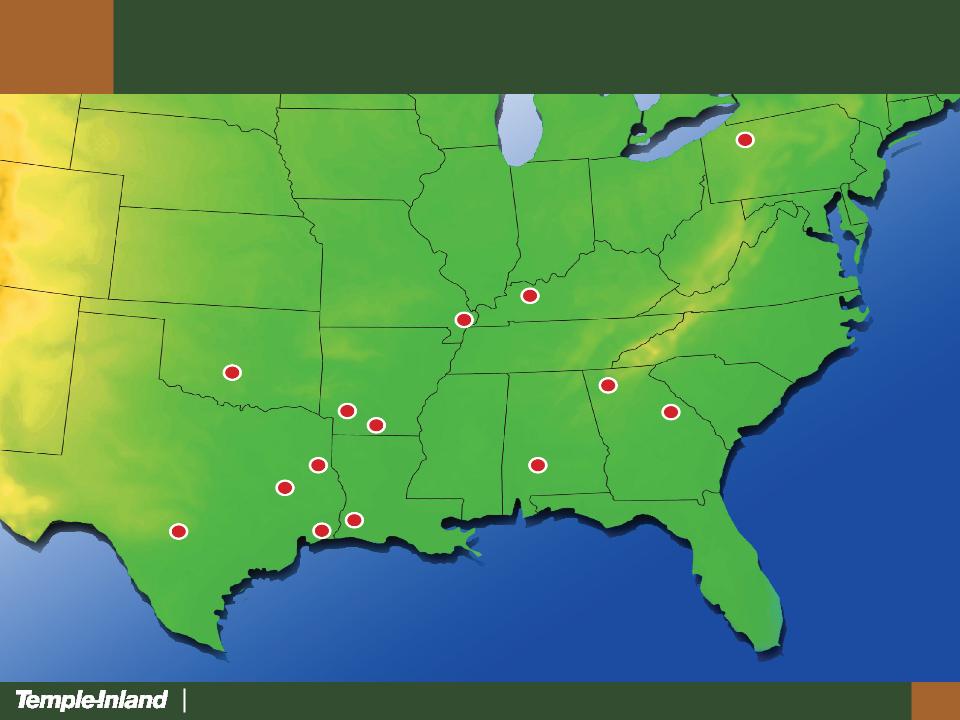
Building Products Facilities
Mt. Jewett
Cumberland City
West Memphis
Fletcher
El Dorado
Hope
Rome
Thomson
Pineland
Diboll
Monroeville
DeQuincy
Buna
McQueeney

24
Housing Starts
TIN EBITDA
2006
2007
2008
2009
2010

25
Financial Priorities
• Return cash to shareholders
– Dividend increased 10% to annual
rate of $0.44 per share in Q1 2010
rate of $0.44 per share in Q1 2010
• Reduce debt
• Invest in our business
• Profitably grow

26
Create Superior and Sustainable Value
• Maximize ROI
• Profitably grow our business

27
Our job is to be the best