Attached files
| file | filename |
|---|---|
| 8-K - FORM 8-K - JPMORGAN CHASE & CO | d8k.htm |
 September 14, 2010
Jamie Dimon, Chairman and Chief Executive Officer
Barclays Global Financial Services Conference
Exhibit 99.1 |
 I.
Exceptional franchises
II.
Issues facing JPM, the industry and
global economy
III.
Key investor topics
Regulatory reform impact
–
Banking activity restrictions
–
Derivatives
Retail Financial Services
–
Credit trends
–
Mortgage repurchase risk
–
Regulatory reform impact–
Regulation E, debit interchange and
BCFP
Agenda
Fortress balance sheet
Capital generation
Basel III Capital proposals
Hierarchy of capital usage
Basel III Liquidity proposals
Interest rate positioning
IV.
Outlook
V.
Commitment to drive economic recovery
VI.
Summary
VII.
Appendix
1 |
 JPM’s
fundamentals remain extremely strong
Excellent client franchises and businesses
Each standalone business has a top 1, 2 or 3 position
Unparalleled client relationships in 100+ countries
Culture
of
innovation;
new
products
and
programs
launched
during
crisis
Continued
investment
across
LOBs
driving
organic
growth
Consistent record of operating efficiency and delivering merger saves
Businesses stronger together than apart; additional revenue streams
generated Further strengthened balance sheet: Tier 1 Capital of $137B or
12.1%, Tier 1 Common at $108B or 9.6%
High quality capital and very high level of reserves ($36.7B), loan loss reserve
of 5.34%
Strong funding and liquidity profile: $888B deposits, 1.3x loan coverage
Strong and stable management team
Deep bench of talent; thoughtful succession planning
1
See note 3 on slide 52
2
See note 2 on slide 52
2
Excellent client
franchises and
businesses
Significant
earnings
power
Fortress
balance sheet
Strong
management
team
Robust technology infrastructure to serve clients
Benefits
from
diversification
–
funding,
capital,
lower
volatility
2
1 |
 Agenda
Page
3
Exceptional franchises
3
Issues facing JPM, the industry and global economy
16
Key investor topics
21
Summary remarks
38
Appendix
42 |
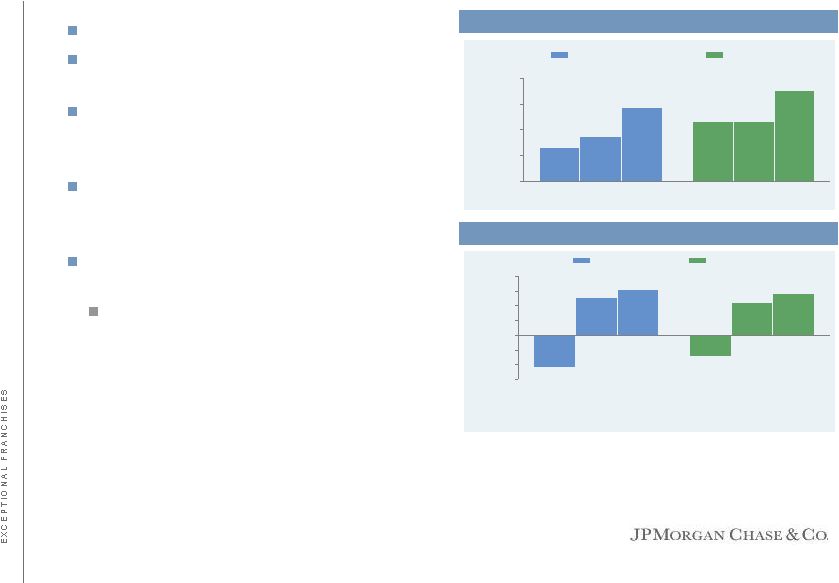
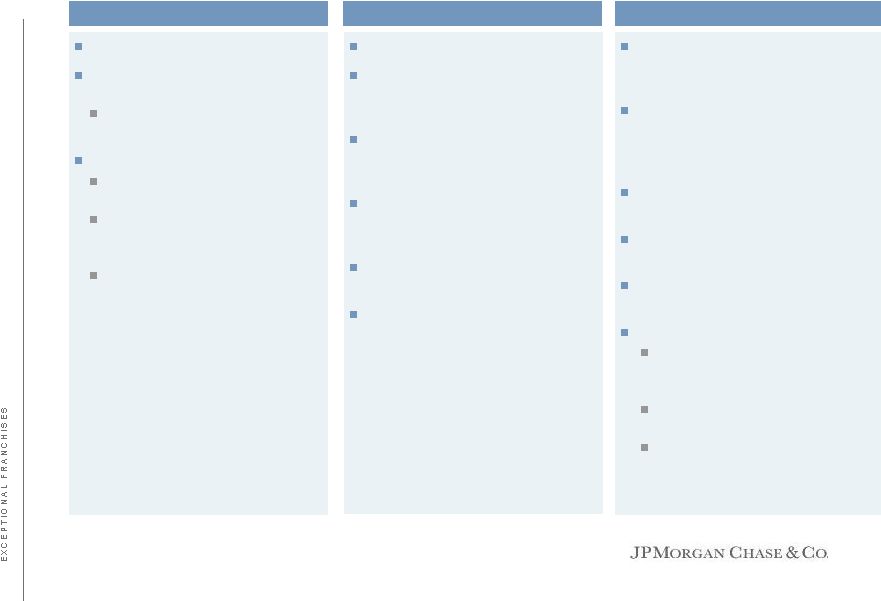 Market leading exceptional franchises
ROE of 35% is best in peer group
Only bank in peer group with a loan-to-
deposit ratio under 100%
Strong deposit base will support NII
as the rate environment improves
Best
of
the
top
5
banks
71% of Chase clients use Chase for
their TS needs
87% of Chase clients say it is likely
they will continue doing business
with Chase
36% of Chase clients say they will
increase the amount of business
they award Chase going forward
1
Greenwich Research, 2009
2
Ernst & Young and Federal Reserve
3
Nilson
4
2Q10 Company reports
5
iMoney.net, June 2010
Pretax margin of 32% is second highest
and ROE of 24% is highest in peer
group
Long-term AUM net inflows of 14% over
last 12 months through June 2010,
higher than all peers reporting flows by
asset class
Leader in alternatives with $91B in
AUM
#1 Institutional Money Market Fund
Manager Worldwide
5
#1 Ultra-High-Net-Worth Private Bank
Globally
6
Leading International Asset Manager
#1 Asset Management Company in
Asia; Asset Management Company
of the Year
7
#1 Pan-European Fund
Management Firm
8
Best overall performing foreign
asset manager operating in China
9
ROE of 18% consistent with peer group
Top tier player in cash management,
processing a market leading average of
$3.1T in U.S. dollar transfers daily
#1 clearer of U.S. dollars in the world
and #1 Automated Clearing House for
originations
#1 Visa/ MasterCard Commercial,
Purchasing and Prepaid card issuer in
the U.S.
#2 in Assets under Custody with
$14.9T serviced
4
Top provider of custody services
leveraging significant scale and global
footprint
6
EuroMoney, February 2010
7
The Asset Magazine, 2009
8
Thomson Reuters, June 2010
9
PWC survey
4
Commercial
Banking
Treasury & Securities Services
Asset Management
2
3
1 |
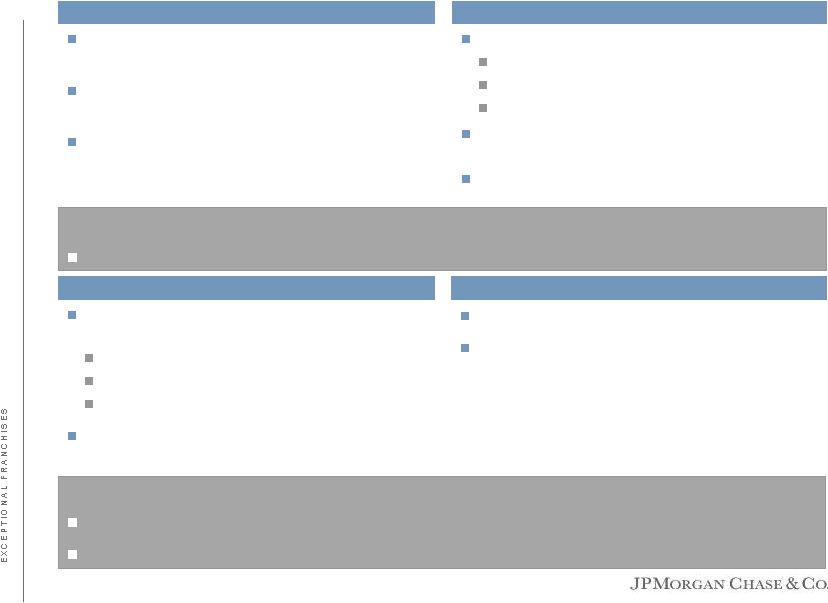
 Global Corporate Bank
Joint-Venture between IB and TSS to manage/better serve global corporate
banking relationships with ~2,300 of the world’s largest global
companies Significant TS international growth opportunity
Targeting ~10% international share of wallet by 2014
Material growth opportunity for IB and TSS
Opportunity
Expansion plans
Expand coverage/ footprint, extend more credit and increase product
capabilities
Extended footprint
Over 20+ branches and representative offices across EMEA, APAC and
LATAM
Nearly 500 front office employees
–
Nearly 200 Corporate Bankers and analysts, over 250 TS Sales,
Product Support Specialists, and Credit Officers
Approximately $50B+ in incremental lending over 5 years
Expansion of local treasury capabilities in 10 locations
Nearly $400mm additional investment targeted for key product gaps
5 |
 IB
– AM
CB –
IB/TSS/AM
IB –
TSS
Significant competitive advantage created and benefit to franchise value from
cross-sell collaboration
Integrated IB/TSS/AM offering provided through CB
Bankers
Corporate Finance
FX/Derivatives
TS and Liquidity
Leverage new GCB/International capabilities for Mid-
Corp and Mid-Market clients
Liquidity solutions
Important cross-referrals between IM and WSS
(e.g., insurance companies, pension funds)
Global Corporate Bank: enhance international
capabilities to meet global clients needs
Integrated Prime Custody services for asset
managers and hedge funds
Joint FX offering sold through TSS and executed by
IB
Institutional AM:
Liquidity solutions
Long-term asset management
Retirement Plan Services
Private client access to IB product capabilities (e.g.,
trading desk, IPOs, research)
IB is an important source of referrals for the Private
Bank
AM –
TSS
Large-Corp, Financial Institutions and Private Clients
65% of Fortune 500 companies were simultaneously clients of IB, TSS and AM in
2009 Mid-Corporate / Middle Market Clients
80%+ CB clients used at least one TSS product in 2009
~25% CB clients used IB capabilities each year over the last 3 years
6 |
 ~25mm transactions done by CB clients in 2009 at
branches
~40% CB customers used a branch teller in
4Q09
CB has 2.7x greater revenue in high branch
density locations
Asset Management
Commercial Banking
Card Services
Retail branches are invaluable to the rest of our Franchise
Treasury & Securities Services
$8B of JPM investment products sold through
branches in 2009
$24B of JPM investment balance AUM comes
from the branch
~50% Private Wealth Management customers and
~30% PB customers used a branch teller in 4Q09
New offering for affluent RFS customers
Use of core banking services (e.g., deposits and
change orders)
Check Cashing Agreements: cashing of employee
payroll checks without a fee across Branch network
Chase At Work: better payroll management,
convenient banking & discounts to employees
7
~1.5mm cards sold through branches
~40% of RFS customers have a Card
relationship
Significant uplift (~10%+) in Card Services direct
mail production driven by local market presence
Integrated experience for Card branch clients |
 JPM
Rank
Share%
2001
5
9.9
2002
7
9.2
2003
5
10.2
2004
7
8.4
2005
9
8.1
2006
8
7.6
2007
6
7.2
2008
5
8.6
2009
3
12.4
1H10
2
12.2
Market leading franchises –
Investment Bank
JPM
Rank
Share%
2001
7
5.3
2002
6
6.5
2003
3
9.2
2004
4
7.2
2005
4
7.7
2006
5
7.3
2007
2
9.5
2008
2
11.6
2009
1
11.6
1H10
1
8.1
Market leader for Global IB Fees, ranking #1 for the past two years
Improved Equity Underwriting rank from #7 in 2001 to #1 in 1H10
Ranked #1 2010 All-America Fixed Income Research team by
Institutional Investor magazine
55 ranked analysts –
up from 31 in 2002
Record number of coverage areas honored as best-in-class
Top 2 player in emerging markets over past 5 years
1
Material improvement in trading market share from 2005 to YTD 2010
Added Prime Brokerage and continue to build-out Commodities
1
Source: Coalition
2
Source:
Per
external
disclosure.
Global
markets
represents
JPM’s
share of top 10 competitors. 2006 to 1H10 represents
current pro-forma competitor set; 2001 to 2005 represents competitors as
reported 3
Source: Dealogic
Global Equity & Equity-related
Global Markets
2002
2003
2004
2005
2006
2007
2008
2009
2010
Equity
US
10
8
9
7
6
3
2
2
NA
Europe
9
8
9
10
10
8
8
3
2
Fixed Income
US
2
3
2
2
2
3
2
2
1
Europe
4
1
1
1
2
2
2
NA
NA
Institutional Investor Research Analyst Rankings
8
3
2 |
 Rank
1989
1999
2009
1
Merrill Lynch
Salomon Smith Barney
JPMorgan
2
Goldman Sachs
Merrill Lynch
Bank of America Merrill Lynch
3
First Boston
Goldman Sachs
Citi
4
Salomon
Morgan Stanley
Barclays
5
Morgan Stanley
Lehman Brothers
Goldman Sachs
6
Shearson Lehman
Credit Suisse
Morgan Stanley
7
Drexel
JPMorgan
Deutsche Bank
8
Bear Stearns
Bear Stearns
Credit Suisse
9
Prudential Securities
Donald Lufkin & Jenrette
UBS
10
Kidder Peabody
Chase
Royal Bank of Scotland
Market leading franchises –
Investment Bank
US Equity, Equity-related and Debt
JPM has built outstanding underwriting and advisory franchises in the last 10
years Source: Thomson Reuters. Data as of 8/31/10. Ranking based on $ volume
Note:
Light
gray
font
designates
firms
that
no
longer
exist,
red
font indicates non-US based firms
Competition from international firms has strengthened significantly
Based on market capitalization, US firms represent 11 of top 50 financial
institutions for YTD 2010 vs. 44 in 1989
US banking system is far less concentrated than other countries
Banks represent only a third of the credit lent or financed in the US vs.
two-thirds in Europe 9 |
 Added
over
13,000
Personal
Bankers
since
2005
-
annual growth rate
of 26%; 14% organic
Branch
network
of
5,159
up
2,518
branches
from
2005
-
annual growth
rate of 16%; 5% organic
Added
8,342
ATMs
since
2005
-
annual growth rate of 18%; 12%
organic
Market leading franchises –
Retail Banking competitive position
2009
net
income
$3.9B
-
up 24% annually since 2005; 15% organic
10
Net income
Branch / ATM
distribution
Strong organic growth consistently year after year and lift from WaMu
acquisition |
 Active
online
customers
of
16.6mm+
-
annual
growth
rate
of
42%
since
2006
3.7mm+
households
with
active
online
bill
pay
-
annual
growth
rate
of
46%; 30% organic
385mm
electronic
alerts
sent
to
customers
in
2009
-
~doubling
year
over
year
Strong
checking
account
growth
-
28%
annually
since
2005;
12%
organic
Average
deposits
of
$336B
-
annual
growth
rate
of
16%
since
2005;
7%
organic
Total
households
served
of
22.8mm,
up
13.6mm
since
2007
-
annual
growth rate of 38%; 9% organic
11mm+
households
with
direct
deposit
-
annual
growth
rate
of
34%
since 2007; 16% organic
18mm+
households
with
debit
cards
-
annual
growth
rate
of
40%
since
2007; 19% organic
Market leading franchises –
Retail Banking competitive position (cont.’d.)
11
Serving our
customers
Innovation —
Online &
Mobile
Banking
Strong organic growth consistently year after year and lift from WaMu
acquisition |
 0
100
200
300
400
500
600
700
800
900
1,000
1,100
1,200
2Q05
2Q06
2Q07
2Q08
2Q09
2Q10
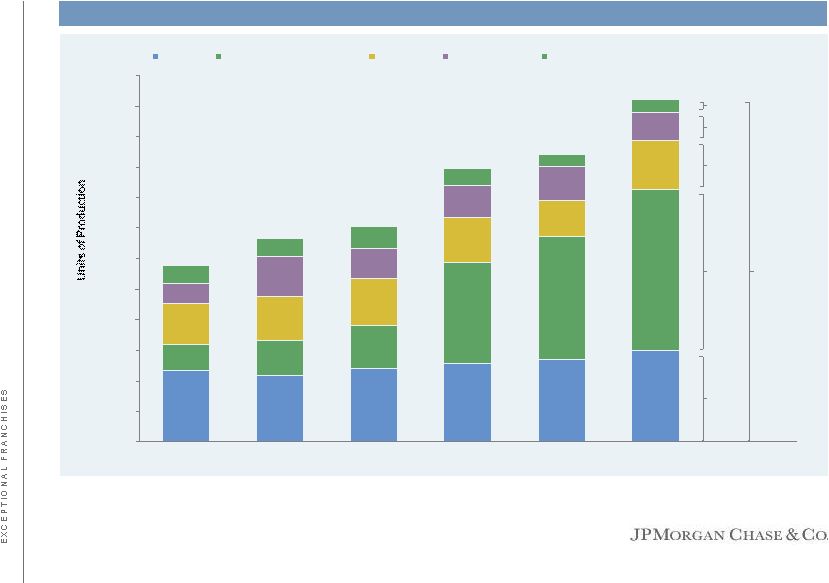
DDAs
Convenience Products
Savings
Credit Cards
Investments & Loans
Sales
Production
(in
units)
per
branch
–
hChase
Sales production has increased steadily over the past six years…
2Q10 vs. 2Q05
% Change
94%
(28)%
41%
17%
525%
28%
Convenience
products
include
Direct
Deposit,
Online
Bill
Pay,
Business
Online
Banking,
and
Fee-Based
Debit
Card
Sales
&
Upgrades.
Totals
exclude
instore
branches
12 |
 Retail Financial Services –
factors impacting revenue and growth
Revenue currently adversely impacted by portfolio run-off and repurchase
expense Real Estate Portfolios expected to make a positive contribution to
earnings and capital over time as credit losses are reduced and significant
expense reductions are realized 2009
2010
2011
2012
2013
Balances
$270
$235
$200
$175
$150
Net interest income
6.6
5.5
4.5
4.0
3.5
Capital returned
—
—
1.0
1.0
1.0
Ultimately all of these factors will result in higher quality revenue and better
returns on capital
13
Real Estate portfolios —
simulated balance run-off & NII (Average balances, $ in billions)
Real Estate
portfolios
—
simulated
balance
run-off
&
NII
(Average
balances,
$
in
billions) |
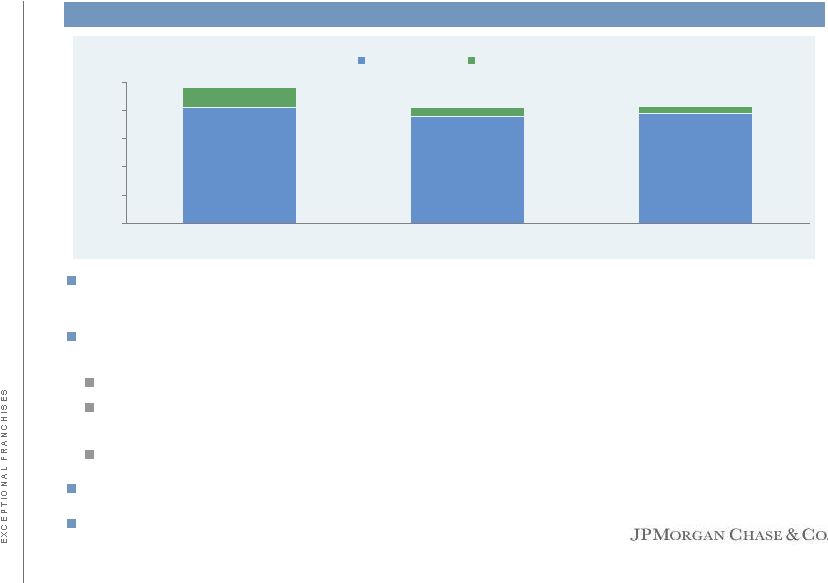
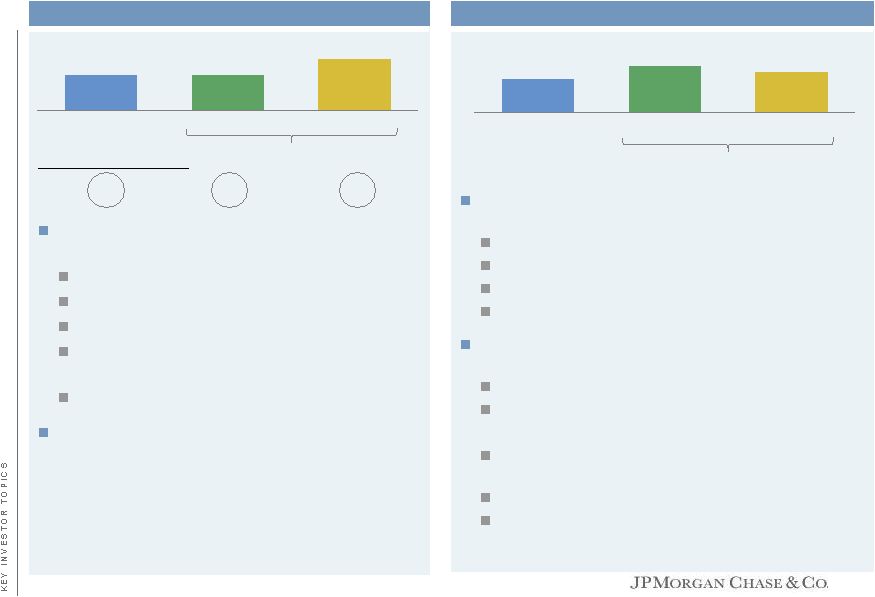
 Market leading franchises —
Card Services
Annualized spend per open account –
AXP vs. Chase Affluent
Sales
growth
YoY
–
DFS
vs.
Chase
Brands
Mass
Affluent
Chase is #1 Visa credit card issuer
Over 50mm customers receive a credit card
statement from Chase each month
Our affluent portfolio, though far smaller,
exhibits higher spend per account behavior
relative to AXP US Card
Targeting Mass Affluent and business card
markets with Chase branded cards and
suite of products
Continue to invest in innovation and our
branded portfolio
Including Blueprint, Sapphire, Ink, Slate,
and Ultimate Rewards
$12,862
$13,503
$12,302
$11,320
$12,304
$11,711
$10,000
$11,000
$12,000
$13,000
$14,000
AXP US Card¹
Chase Affluent²
2Q09
1Q10
2Q10
2Q09
1Q10
2Q10
6.3%
5.7%
(2.8)%
(4.3)%
4.5%
5.2%
(6.0)%
(4.0)%
(2.0)%
0.0%
2.0%
4.0%
6.0%
8.0%
DFS³
Chase Mass Affluent
2Q09
1Q10
2Q10
2Q09
1Q10
2Q10
1
AXP open accounts represents ‘Basic Cards in Force’
2
Chase
Affluent
portfolio
includes
Cobrand
T&E
and
Branded
Affluent-HNW
portfolios
3
Discover’s portfolio includes mass affluent as well as affluent
customers Source: Earnings release, Internal Chase data
$21.5
$22.4
$22.9
$21.2
$19.8
$22.4
Sales in $B:
14 |
 Card
Services
–
reduction
in
EOP
outstandings
–
lower
revenue,
higher
quality
WaMu
portfolio declined to $16B in 2Q10 from $20B at year-end 2009, expected to
decline to $10B by end of 2011
EOP outstandings
for Chase (excluding WaMu) are projected to decline by 15% or $21B
year-over- year in 2010
More than half of the decline in receivables is driven by conscious pullback in
balance transfer offers Expect underlying receivables growth in late 2010.
Overall receivables growth in 2011, reflecting a better mix of
customers Decline in receivables will free up capital and reserves
Reserve levels were down $1.5B last quarter, this will probably continue
Expect
Chase
losses
of
approximately
8.00%+/-
in
3Q10
vs.
9.02%
in
2Q10
$123
$113
$116
$21
$10
$9
$0
$30
$60
$90
$120
$150
12/31/09
Est. 12/31/10
Est. 12/31/11
Core balances
Balance transfers
$144
$123
$125
15
Chase (excluding WaMu) EOP outstandings ($ in billions)
|
 Agenda
Page
16
Issues facing JPM, the industry and global economy
16
Exceptional franchises
3
Key investor topics
21
Summary remarks
38
Appendix
42 |
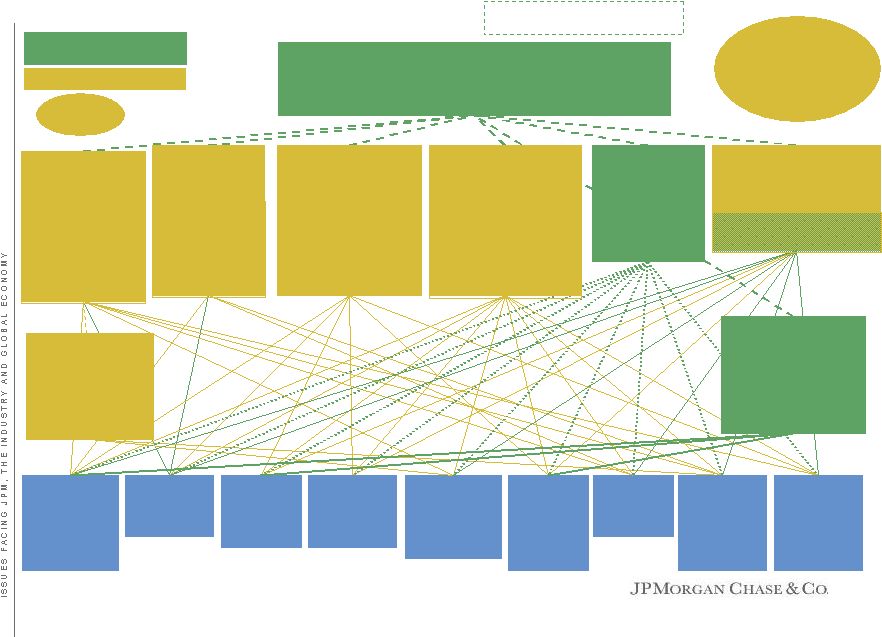
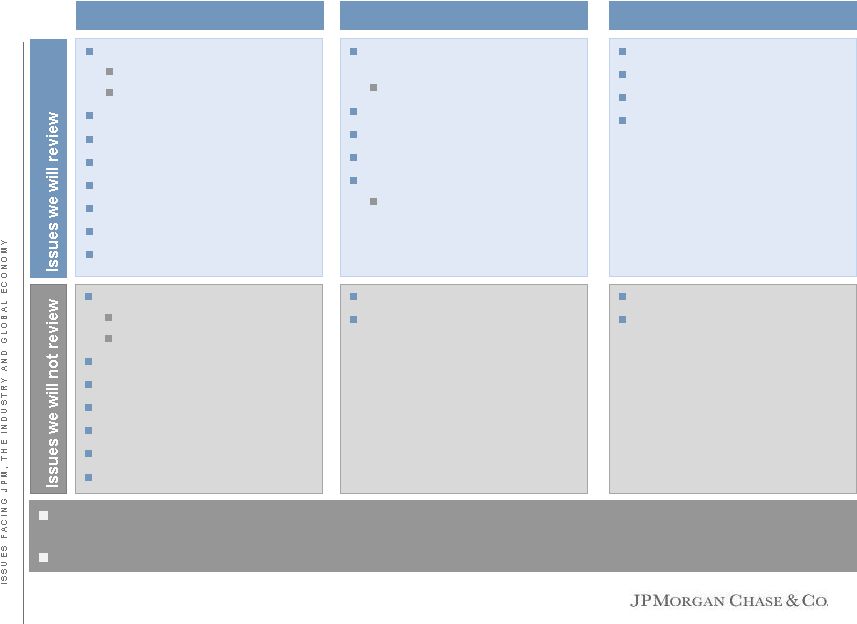 Industry is facing multiple regulatory, market and other issues
Ongoing issues in the mortgage
market
Home prices
Capital markets activity levels
Unemployment / economic growth
Low interest rate environment
Consumer and wholesale credit
Commercial real estate
Revenue growth opportunities
Portfolio run-off
International expansion
Global convergence
Regulation
Market
Other
Governance
Say-on-Pay
Proxy access
Living will
Compensation rules
Pre-emption
Bail-in and contingent capital
Bank taxes
FDIC assessment
Securitization
GSEs
and future structure
Healthcare
Litigation
JPM
will
continue
to
invest
in
its
businesses
and
expand
product
capabilities, to maintain best-in-class
franchises and drive organic growth
These issues will have a significant impact on the industry and markets
Capital, Liquidity, Basel III
Trust preferred securities
Dividend, stock buyback
Basel III
Derivatives
Volcker rule
Debit interchange
NSF/OD
Fair value accounting
Enhanced regulatory oversight
including Fed, FSA, BCFP, etc.
17 |
          Investment
Advisory
Mutual and
money market
funds; wealth
management;
trust services
Consumer
Lending
Credit cards;
student and
auto loans
Commercial
Lending
Commercial and
industrial
lending
Broker-dealer
Institutional and
retail brokerage;
securities lending;
prime broker
services
Retail
Banking
Deposit
products;
mortgages
and home
equity
Payment and
Clearing
Systems
Payments
processing;
custody and
clearing
State Regulatory
Authorities and AG’s
Power to enforce rules
promulgated by Bureau
of Consumer Financial
Protection
Derivatives
Futures,
commodities
and derivatives
Alternative
Investments
Hedge funds;
private equity
Investment
Banking
Securities
underwriting;
M&A financial
advisory
services
Financial Stability Oversight Council
Identify risks to the financial stability of the U.S. from activities of large,
interconnected financial
companies.
Authority
to
gather
information
from
financial
institutions.
1
Make
recommendations to the Fed and other primary financial regulatory agencies
regarding heightened prudential standards.
OFAC /
FinCEN
CFTC
Market oversight and
enforcement
functions.
Authority over swaps,
swap dealers and
major swap
participants.
Regulates trading
markets, clearing
organizations and
intermediaries.
SEC
Regulates securities
exchanges; mutual
funds and investment
advisers. Examination
authority for broker-
dealers.
Authority over security-
based swaps, security-
based swap dealers and
major security-based
swap participants.
FDIC
Focus on protecting deposits
through insurance fund; safety and
soundness; manage bank
receiverships.
Examination authority.²
Orderly
liquidation of systemically important
financial institutions³.
Office of the Comptroller of
the Currency
Focus on safety and
soundness. Primary
regulator of national banks
and federal savings
associations. Examination
authority. Examines loan
portfolio, liquidity, internal
controls, risk management,
audit, compliance, foreign
branches.
Federal Reserve
Focus on safety and
soundness-Supervisor for bank
holding companies: monetary
policy; payment systems.
Supervisor for systemically
important financial institutions
and their subsidiaries.
Establish heightened prudential
standards on its own and based
on Council recommendations.
Examination authority.
FINRA
Regulates brokerage
firms and registered
securities
representatives. Writes
and enforces rules.
Examination authority
over securities firms.
Office of Financial
Research
Office within
Treasury, which may
collect data from
financial institutions
on behalf of Council.
No examination
authority.
Strengthened but not simplified
Green indicates new agency or
new powers and authority
Gold indicates old agency.
Dotted line indicates authority to request
information, but no examination authority.
Bureau of Consumer
Financial Protection
Focus on protecting
consumers in the financial
products and services
markets. Authority to write
rules, examine institutions
and enforcement. No
prudential mandate.
18
This chart assumes these activities are conducted in a systemically important bank holding company
(BHC) 1
The Council, through Office of Financial Research, may request reports from systemically important
BHCs 2
FDIC may conduct exams of systemically important BHCs for purposes of implementing its authority for
orderly liquidations, but may not examine those in generally sound condition
3
The Dodd-Frank Act expanded the FDIC’s authority when liquidating a financial institution to
include the bank holding company, not just entities that house FDIC-insured deposits
Note: Green lines from SEC and CFTC represent enhanced authority over existing relationships
|
 Multiple regulatory and market issues (and not just in U.S.)
Topic & Section
Rulemaking
One-time Reports
/ Studies
Periodic Reports
TOTAL
Financial Stability (Title I)
35
8
5
48
Orderly Liquidation (Title II)
14
12
2
28
Private Fund Investment Advisers (Title IV)
14
5
2
21
Insurance (Title V)
8
2
3
13
Regulation of Bank Holding Companies, Savings & Loan Holding Companies and
Depository Institutions (excluding Volcker Rule) (Title VI)
9
3
0
12
Volcker Rule (Title VI – Section 619)
3
1
0
4
Derivatives (Title VII)
56
7
3
66
Payment, Clearing and Settlement Supervision (Title VIII)
6
1
0
7
Investor Protection and Regulatory Enforcement (Title IX – Subtitle A)
7
6
2
15
Credit Rating Agencies (Title IX – Subtitle C)
14
6
0
20
Asset-Backed Securitization (Title IX – Subtitle D)
7
2
0
9
Executive Compensation and Corporate Governance (Title IX – Subtitles E and G)
11
1
0
12
Municipal Securities (Title IX – Subtitle H)
6
4
0
10
Bureau of Consumer Financial Protection (Title X)
29
6
1
36
Mortgage Reform and Anti-Predatory Lending (Title XIV)
37
9
4
50
Miscellaneous – Titles III, XI, XII, XIII, XV and parts of Title IX
29
19
22
70
TOTAL
285
92
44
421
Source: Sullivan & Cromwell LLP
19
Dodd-Frank legislation rulemaking summary |
 Although
regulatory
reform
will
potentially
have
a
significant
impact
on
our
businesses
and clients, we are convinced we can manage through the change and thrive
JPM remains supportive of safe and sound regulatory reform
Much
regulatory
reform
was
needed
–
financial
industry
and
global
economy
are
better
for
it. However, some was ill-conceived and there are unknown, unintended
consequences Industry
capital
and
liquidity
were
too
low
–
we
need
to
get
it
right
–
need
level
global
playing field
JPM has substantial franchise strength
Always continue to invest in our businesses
Extremely strong balance sheet
Continue to build our excellent client franchises
Always strive to maintain strong relationships with regulators
Committed to ensuring that the implementation of regulatory reform is done in a
way that is good for our clients and our company
Adding
people
to
75+
existing
work
streams
–
dedicated
to
implementing regulatory
reform
20 |
 Agenda
Page
21
Key investor topics
21
Exceptional franchises
3
Issues facing JPM, the industry and global economy
16
Summary remarks
38
Appendix
42 |
 Regulatory reform impact –
Banking activity restrictions (Volcker)
Law does not limit the growth of our client businesses, market-making activities
or ability to serve our clients
Can continue to sponsor client-only hedge funds (i.e., Highbridge)
3%
limitation
for
seed
capital
—
consistent with current practice
Can
continue
to
make
permissible
merchant
banking
investments
(through
OEP)
We will keep OEP and wind down third-party investments within regulatory
period Remaining
few
proprietary
trading
areas
will
be
transitioned
to
Asset
Management
—
de minimus
impact
22 |
 Regulatory reform impact –
Derivatives
Always supported moving standardized and liquid swaps to clearinghouses
Revenue impact of $1B+/-, potentially positive offsets
May create significant liquidity and margin requirements for clients
Overall capital impact on dealers is unclear, but likely positive
Do not expect spread to change materially on liquid products
Critical that central clearinghouses are properly managed
Clearing and Swap Execution Facility (SEF)
Major
concern
is
that
we
can
properly
serve
clients
across
legal
entities
Creates significant operational work which will be done
Complicated regulation
Majority
of
derivatives
–
except commodities (other than metals), equity, and high yield and
certain
investment
grade
CDS
–
are not required to be moved
Possible capital requirements of $6B+/-, not incremental to the Firm
Final operational and legal structure has yet to be decided
Conduct certain activities in a non-bank subsidiary
23 |
 Home
lending
credit
trends
–
Net credit losses and loan loss reserve levels
Current
loss
guidance
–
at
the
current
rate
of
delinquency
and
loss
severity,
quarterly
losses
could be:
Home equity $1B
Prime mortgage $400mm
Subprime mortgage $400mm
Rate
of
improvement
slowed
and
delinquencies
flattened
in
2Q10
–
July
and
August
remained flat to June
Home
Lending
reserves
for
the
nonpurchased
credit impaired portfolio at 2Q10 of $11.3B
Current loss guidance annualized of $7B +/-
Reserve level reflects significant uncertainty, allow for further stress
If delinquencies return to 2H09 levels with 10-15% incremental HPI decline
from here, losses
could
run
to
$8B
+/-
in 2011/2012
When roll rates and severities improve and uncertainty in the environment is
reduced, we will release reserves
In the purchased credit impaired portfolio lifetime losses plus additional
impairment through reserves are $33.4B
If
delinquencies
and
severities
remain
flat
-
additional impairment over the next two years
could be $3B+/-
If delinquencies return to 2H09 levels with 10-15% incremental HPI decline
from here - additional
impairment
over
the
next
two
years
could be $7B+/-
24 |
 Home
lending
credit
trends
–
Net credit losses and loan loss reserve levels (cont.’d.)
Performance of loans modified after trial periods is still not certain as a large
number of these modifications were completed in the last six months
Early indications are that performance is better than that experienced on prior
modifications
Foreclosure
inventory
will
remain
at
current
elevated
levels
+/-
through
beginning of 2011 as
improvement in delinquencies is offset by new referrals, and then trend down
gradually through 2013; in turn REO inventory will increase through
2013 25 |
 Repurchase demands elevated at $1B+ per quarter; demands driven by 2006-2008
vintages (~90%) and third-party originated (~40%)
Demands
lag
loans
reaching
90
DPD
by
12-20
months
-
delinquency
improvements
have
not
yet
flowed through to demand activity; demands expected to remain elevated well into
2011 Reserves of $2.0B ($2.3B firmwide) at June 30, 2010 for demands
presented and expected future demands
Key reserve assumptions include demand frequency, cure rate, loss severity and
third party recoveries; assumptions are reviewed and adjusted
quarterly based upon actual experience A 10% adverse change in all key
assumptions would increase repurchase liability by $1B +; a more severe
stress of 20% by $2-2.5B When demands and losses trend downwards, we
will release reserves Losses could approach $1.2B+/-
in 2010 and $1.0B+/-
in 2011
Repurchase risk
1
Heritage Chase only
26
Repurchase settlement experience and reserves ($ in millions)
2009
1
1Q10
2Q10
Repurchase settlements
$580
$238
$312
Reserve build
1,032
194
355
Total repurchase expense
1,612
432
667
EOP reserves
$1.4B
$2.0B |
 Regulatory reform impact –
Reg
E, debit interchange and BCFP
All industries decide what to charge for services and what to provide for free
Pricing should be relative to the value provided, not just the costs incurred
Pricing of specific products and services need to cover broader fixed costs related
to servicing accounts and the relationship
Many services are free. Checking account customers receive the following free
services: debit cards, ATM access at Chase’s 15,500 ATMs, on-line
banking and on-line bill pay, access to Chase’s 5,100 branches,
and 100% fraud protection on debit transactions We
agree
that
merchants
should
have
the
option
to
accept/decline
a
form
of
payment
or
to
discount as they choose
However, the government should not be able to set pricing
Cash and checks are cheaper than debit and credit alternatives, but they are not
without cost Industry will inevitably reprice
as result of regulatory change:
Many products and services will no longer be free
Banks will exit certain customer relationships
The industry may reduce investment in distribution and innovation
We
will
work
with
the
BCFP
to
ensure
consumer
financial
products
are
transparent
and
fair.
However, consumers may be adversely affected by potential unintended consequences,
which could include reduced credit availability and increased costs
27 |
 Fortress balance sheet as of 2Q10
Strong
capital
base
–
Tier
1
Common
of
$108B
or
9.6%
High quality capital and very high level of reserves ($36.7B), loan loss coverage
of 5.34% Large
deposit
base
–
~$900B.
Stable
source
of
funding
–
retail
and
wholesale
–
geographic
Low
reliance
on
short
term
unsecured
capital
markets
–
plenty
of
capacity
in
these
short-term
markets as well as long-term unsecured funding markets
Significant unused liquidity in the form of cash and high quality liquid
unencumbered collateral Loss
of
trust
preferred
securities
(~$21B)
regulatory
capital
credit
–
minimum
impact
on
JPM
–
unfair
to
many
US
banks
–
we
will
determine
what
to
do
when
we
see
final
rules
Wholesale
(Investment
Bank
and
Commercial
Banking)
credit
trends
have
improved
from
2009
peak
levels but remain above historical averages
Strong loan loss reserves -
allowance for loan losses of $4.8B
Net charge-off rate of 0.55%
Total net fair value assets of $777B
Level
1
and
2
assets
are
85%
of
total
assets
at
fair
value
–
actively
traded
in
liquid
markets
Level 3 assets represent 15% of total assets at fair value
Strong capital position today will be further strengthened by significant
earnings and need for lower reserve levels over time
28 |
 Analyst
Projections "Stressed" Analyst Projections
2010
2011
2012
2013
2010
2011
2012
2013
Tier 1 Common (%)
10%
12%
13%
14%
10%
11%
11%
12%
Tier 1 Common ($)
$120
$130
$150
$170
$110
$120
$130
$140
Excess Tier 1 Common Over 8%
$25
$40
$60
$75
$20
$30
$40
$45
ROE
9%
11%
11%
12%
6%
7%
7%
8%
Allowance for Loan Loss
$35
$30
$20
$25
$35
$35
$35
$35
Dividend
$0.29
$0.74
$1.12
$1.33
$0.29
$0.74
$1.12
$1.33
We have significant capital generation
Illustrative “stress”
case based on analyst projections
$15.5
$19.0
$22.5
$24.5
~$15
~$14
~$12
~$10
2010
2011
2012
2013
Analyst Projections
"Stressed" Analyst Projections
¹
Analyst average includes 8 analysts through 2012; 2013 is composed of 3 analysts
plus I/B/E/S LTG projections for other 5 in 2013; Regulatory changes are assumed to be incorporated in the analyst projections. One analyst is excluded from 2013 Tier 1 Common average due
to assumption that JPM repurchases a significant amount of shares during the year;
ratios reflect Basel I through ‘12 & Basel III in ‘13 (~50bp impact); other capital deployment represents analyst average less 1 firm in ‘13 due to significant share repurchase. JPM does not
endorse these projections
²
“Stressed”
Analyst Projections incorporate JPM stressed scenario assumptions
³
Analyst projection of capital deployment through common dividends of $11.8B:
analyst average dividend of $0.29, $0.74, $1.12, $1.33 in ‘10, ‘11, ‘12 & ‘13, respectively (assumes 2013 payout constant to 2012)
Note: Basel I through 2012 and Basel III in 2013; Numbers rounded for presentation
purposes. Ratios and other calculations may not round perfectly Net
Income
Capital
Multiple stress scenarios are run on a regular basis. Highly stressed
scenario has Tier 1 Common of ~12% despite:
Peak unemployment of 12% in 4Q13
HPI peak-to-trough of 45% in 1Q12
Excess capital reduces ROEs
Equity markets bottom at 850 during 1H11 & remain
stagnant through 4Q13
Fed funds stay at 20bps through 4Q13
29
Analyst
and
“stressed”
analyst
projections
($
in
billions)
¹,²,³ |
 Basel III capital summary as of 2Q10
Tougher capital standards (which we always believed in)
More restrictive capital definitions (e.g., deductions)
Higher risk-weighted assets (e.g., CVA, Market Risk)
Higher required capital
Basel I: 4% Tier 1 Common standard (SCAP)
Basel
III:
7%
Tier
1
Common
standard
1
9.6% JPM’s
2Q10 Tier 1 Common ratio under Basel I
Results
in
estimated
9%
2
Basel
III
Tier
1
Common
ratio
in
4Q11
after
taking
known actions
JPM will mostly manage to the new capital rules effective immediately
JPM does not need to or intend to issue common stock
JPM will probably not operate with an additional self-imposed buffer, as we
have in the past, because we believe the new capital requirements are
sufficient 1
Preliminary view (as of 9/12/10) of Basel III based on interpretation of current
rules/initial estimates. Subject to change as interpretation of Basel III rules is ongoing and dependant on guidance from
Basel/International regulators
²
Based on JPM and analyst projections (see page 29)
30
Tougher
standard and
higher
calibration
Estimated
impact on JPM
Current JPM
expectations |
 Basel I 2Q10
Basel III 4Q10
Basel III 4Q11
JPM estimated capital levels under Basel III are well in excess of Basel I standards
Estimated projections as of 2Q10
$1.1
$1.5
Adjustments to RWA from 2Q10 Basel I to 4Q11
Basel III (+$400B):
Market risk impact (+$180B)
Risk weight 50/50 deductions at 1250% (+$140B)
CVA (+$60B)
Other (+$30B)
Known actions by 4Q11 to reduce Basel III RWA
(-$180B):
Market risk –
reduce IB & CIO positions (-$50B)
CVA –
reduction/ hedging of derivative positions
(-$20B)
RWA on 50/50 deductions; reduce IB/CIO
securitization (-$70B) exposure
Retail loan run-off (-$40B)
Other (-$5B)
Basel I 2Q10
Basel III 4Q10
Basel III 4Q11
Adjustments to Capital from 2Q10 Basel I to 4Q11
Basel III with known actions (-$0.5B):
Deduct net pension asset (-$2B)
Deduct PCCR (-$1B)
Deduct
DTA
from
NOL
carryforward-(-$0.5B)
Net Impact of adding back 50/50 deductions
(+$1B)
Add back of OCI balance (+$2B)
Includes estimated capital generation of $15B
based on average analyst projections¹
$108
$109
$1.4
$123
Includes known actions
Includes known actions
¹
Based on analyst projections of capital generation; see page 29
Note: Numbers rounded for presentation purposes. Ratios and other calculations may
not round perfectly 10%
7%
9%
Tier 1 Common Ratio
31
Capital ($ in billions)
RWA ($ in trillions) |
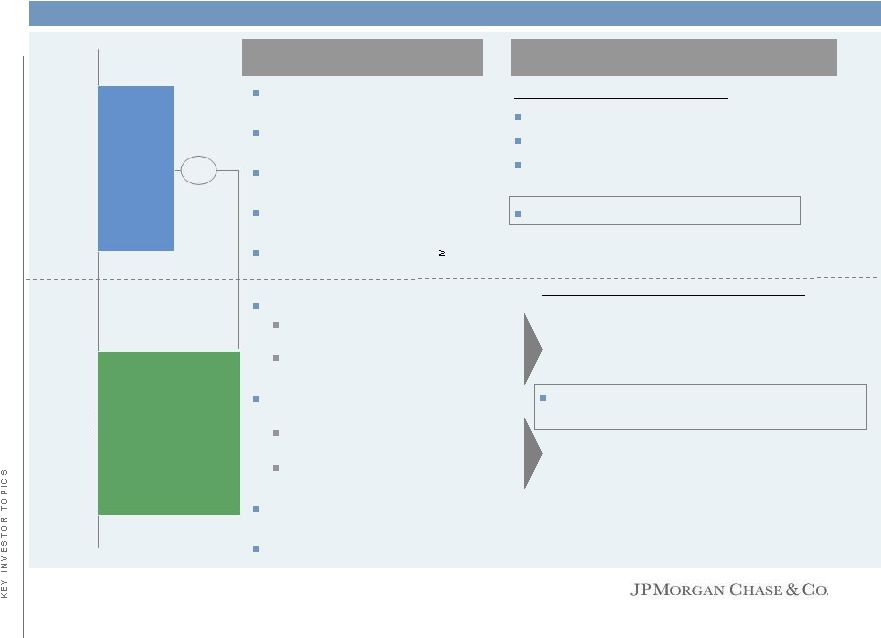
 Hierarchy of capital usage
We intend to restore the dividend
Ultimately return to dividend payout ratio of 30-40% of normalized earnings
(pending tax rule changes)
Initial
increase
is
not
likely
to
hit
payout
ratio,
but
would
be
material
Subject to final analysis of Basel III in November and regulatory capital
adequacy Hopefully early 2011
Hierarchy of capital after restoration of dividend
Investing in organic growth
Stock buyback
–
Will be higher when stock price is lower
–
Will be lower when stock price is higher
–
Will be adjusted for other future opportunities
Acquisitions
32
We clearly have excess capital generation, which will be used to benefit
shareholders |
 Implications
of
Basel
III
liquidity
proposal
–
Liquidity
Coverage
Ratio
53%
Liquid
Asset
Buffer
Net
Funding
Outflow
< 30
days
Items included in LCR
Comments
$72B:
Cash & Central Bank reserves
100% factor
$83B:
US Treasuries / Sovereigns
100% factor
$22B:
Agency / Agency MBS
85% factor
$7B:
Public fund deposits collateral
25% factor
$2B:
Eligible
Corp.
Securities
(
AA-
)
85% factor
$225B:
Deposits
(25% average factor)
$124B:
Non-Operational Deposits
75-100% factor
$101B:
Wholesale
Operational
&
Retail/SME Deposits –
5-25% factor
$100B:
Unfunded commitments
48% average factor
$89B:
Liquidity
Commitments
&
FI
Credit Commitments –
100% factor
$11B:
Wholesale
Credit
(ex
FI)
&
Retail
Commitment outflow –
5-10% factor
$31B:
Secured
funding
outflow
(Repo)
10% factor
($7B):
Other
funding
Inflows/Outflows²
0-100% factor
Example of items not included in LCR
Munis
Corp. securities below AA-
Sovereign guaranteed loans (i.e., EXIM)
Fed Discount Window Eligible loans
(~$80B)
JPM experienced net deposit inflows
Historic experience during the financial crisis¹
JPM experienced 6-8% drawdown on unfunded balances
We understand banks under stress would have
outflows / draw-downs; it is prudent to be prepared
33
186
349
Preliminary view of JPM Liquidity Coverage Ratio (LCR) -
Estimate based on 2Q10 balances for illustrative purposes ($B)
¹ Financial crisis occurred between late 2007 and mid 2009
²Includes impact of account payable/receivable, trading assets derivatives payable/receivable, and
other contractual payments <30 days Note: Preliminary view (as of 9/7/10) of JPM LCR ratio
based on interpretation of current rules/ initial estimates of 2Q10 asset buffer and net funding
outflow. Subject to change as interpretation of Basel III liquidity rules is ongoing and
dependant on guidance from Basel/International regulators
Numbers rounded for presentation purposes. Ratios and other calculations may not round perfectly
|
 Business
evolution
Potential levers to meet proposed Basel III LCR requirements
Known actions:
Reduction
in
size
of
IB
(~$8B)
&
CIO
portfolios
(~$2B)
–
estimated
notional
impact
by
end of 2011
RFS
loan
run-off
(~$80B)
&
reduction
in
size
of
PE
(~$2B)
–
estimated
notional
impact
by end of 2013
Raise Unsecured Term Debt (e.g., term CP, CDs, and 1+ year notes)
Term-out existing Short-Term debt
Raise Secured Term Debt (e.g., FHLB, Auto and Card ABS)
Reduce
“illiquid”
assets
so
that
proceeds
can
count
towards
the
buffer
Consider profitability impact
Raise additional Retail deposits
Consider profitability impact
Reduce
Committed
Credit
and
Liquidity
Facilities
-
probably
done
through
pricing
Consider client impact
Reduce
wholesale
deposits
-
probably
done
through
pricing
Convert Financial Institution deposits to Term
Outflows
34
Buffer
Outflows |
   Potential market pricing changes due to Basel III liquidity constraints
Due to
modest
ROEs
on
current
credit
pricing
and
higher
funding
costs,
client
pricing
expected
to
increase
Does not take into account potentially higher capital charges under Basel III or
funding costs if short- term funding supply constraints develop in
market Impact will be dramatically different by client and type of
product Annual pricing impact on client¹
-
Illustrative example ($ in 000’s)
1
Example is meant to be illustrative and based on hypothetical client experience,
which include assumptions on probability of draw and current/future upfront and arranger fees. Pricing increase over
current expected price to client, including arranger/other upfront fees is
amortized over the life of the facility (where applicable) ²
Assumes
JPM
ROE
and
capital
stay
constant;
Does
not
reflect
leverage
ratio
constraintthat
would likely lead to more severe price impact
Client
Characteristics of Facility
Actual Cost to Client
Incremental Funding Cost to
JPM to be LCR neutral ²
Large Corporate
A / A2
3 Year Revolver (CP Backstop)
$100mm JPM Exposure
$275
$800
35 |
 Overall okay; but will cause some capital shortfall for banks
RWA needs to be done fairly across global banks
Basel III industry implications
Appropriate to do right; likely some changes to come
Either way JPM will be fine
Could create additional funding costs and pricing issues for clients
Role of banks likely reduced
Policy mismatch between LCR and money market industry, LCR and Interbank
lending
Basel III
Capital
Basel III
Liquidity
36 |
 Firm
interest
rate
positioning
—
NIM
by
line
of
business
Increase from higher long-term rates due to increased value of deposits
Negatively impacted by higher short-term rate (flatter and stagflation)
scenarios Retail Financial
Services
Card Services
Commercial
Banking, TSS,
AM
Corporate
Firm benefits from immediate +100 bps parallel rate shock by +$947mm over the next
12 months Firm benefits from higher long term rates (steeper yield curve) and
slightly negative to rising short-term rates (flatter yield curve)
If rates remain where they are, NIM could be compressed
Benefit from higher long-term rates, adversely impacted by higher
short-term rates
Immediate ability to reposition, refinance, change size of investment
portfolio Modest benefit from rising short-term rates
Fairly neutral to higher long-term rates
If rates remain where they are, NIM could be modestly compressed
Generally benefits from rising short and/or low long-term rates
37 |
 Agenda
Page
38
Summary remarks
38
Exceptional franchises
3
Issues facing JPM, the industry and global economy
16
Key investor topics
21
Appendix
42 |
 Chase
and
WaMu
credit
losses
expected
to
continue
to
improve
Chase
losses
of
approximately
8.00%+/-
in
3Q10
vs.
9.02%
in
2Q10
Total net income impact from the CARD Act, including recent legislative reasonable
and proportional fee changes is $750mm+/-
65% of run-rate expected to be included in 3Q10 results vs. 25% in 2Q10
Outlook
Corporate quarterly net income expected to decline to $300mm+/-, subject to
the size and duration of the investment securities portfolio
Investment Bank
Trading environment has been stable
Card Services
Corporate
39 |
 Commitment to drive economic recovery
Providing capital, financing and liquidity: annualized 1H10 of $1.4T,
up 3% and up 6% vs. 2009 and 2008, respectively
1H10 small business lending of $4.7B up 35% vs. 1H09
Remain committed to 2010 originations target of $10B for small
business lending
On track to hire 10K people in the US in 2010
40 |
 Significant
earnings
power
JPM’s
fundamentals remain extremely strong
Excellent client franchises and businesses
Each standalone business has a top 1, 2 or 3 position
Unparalleled client relationships in 100+ countries
Culture
of
innovation;
new
products
and
programs
launched
during
crisis
Robust technology infrastructure to serve clients
Excellent
client
franchises and
businesses
Fortress
balance sheet
Continued
investment
across
LOBs
driving
organic
growth
Consistent record of operating efficiency and delivering merger saves
Businesses stronger together than apart; additional revenue streams
generated Further strengthened balance sheet: Tier 1 Capital of $137B or
12.1%, Tier 1 Common
1
at $108B or 9.6%
High quality capital and very high level of reserves ($36.7B), loan loss reserve
of 5.34%
2
Strong funding and liquidity profile: $888B deposits, 1.3x loan coverage
Benefits
from
diversification
–
funding,
capital,
lower
volatility
Strong
management
team
Strong and stable management team
Deep bench of talent; thoughtful succession planning
1
See note 3 on slide 52
2
See note 2 on slide 52
41 |
 Agenda
Page
42
Appendix
42
Exceptional franchises
3
Issues facing JPM, the industry and global economy
16
Key investor topics
21
Summary remarks
38 |
 Financial results
$O/(U)
1H10
1H09
1H09
Investment Bank
$3,852
$3,077
$775
Retail Financial Services
911
489
422
Card Services
40
(1,219)
1,259
Commercial Banking
1,083
706
377
Treasury & Securities Services
571
687
(116)
Asset Management
783
576
207
Corporate/Private Equity
881
546
335
Total Firm Net Income
$8,121
$4,862
$3,259
Firmwide
results ( $ in millions)
Net income by line of business ($ in millions)
1
Revenue is on a fully taxable-equivalent (FTE) basis. See note 1 on slide
52 2
Net income used to calculate the ratios for 1H09 excludes the one-time,
non-cash negative adjustment of $1.1B resulting from the repayment of
TARP preferred capital 3
See note 4 on slide 52
43
$O/(U)
1H10
1H09
1H09
Revenue (FTE)
1
$53,785
$54,631
($846)
Credit Costs
1
10,373
19,755
(9,381)
Expense
30,755
26,893
3,863
Reported Net Income
$8,121
$4,862
$3,259
Reported EPS
$1.83
$0.68
$1.15
ROE
2
10%
6%
ROTCE
2,3
15%
9% |
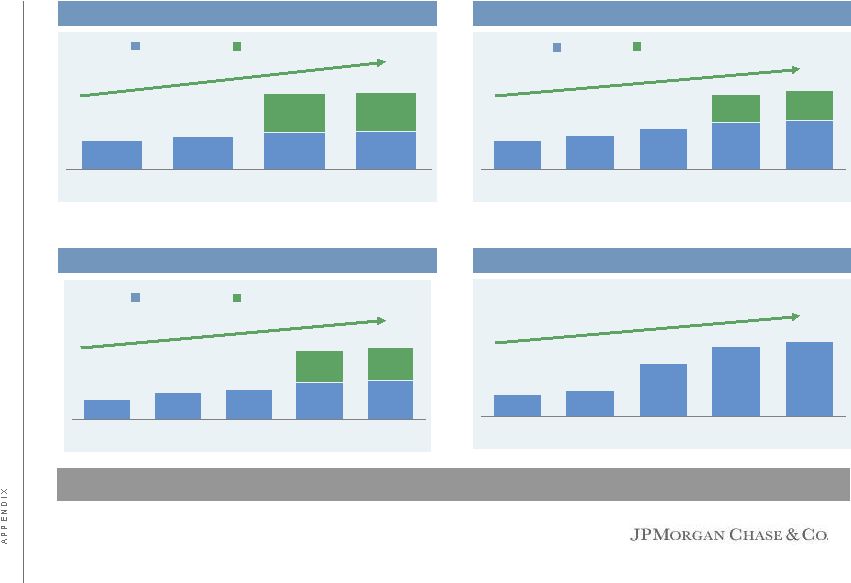
 Market leading franchises –
Retail Banking growth drivers
Checking accounts (# in 000s)
25,712
10,839
9,995
24,499
8,793
26,351
2005
2006
2007
2008
2009
2Q10
CAGR 28% (hChase
12%)
Branches
5,159
2,641
5,474
3,079
3,152
5,154
2005
2006
2007
2008
2009
2Q10
Average deposits ($ in billions)
338
175
245
190
207
341
2005
2006
2007
2008
2009
2Q10
CAGR 16% (hChase
7%)
CAGR 16%
WaMu
WaMu
ATMs
15,654
7,312
15,424
8,506
9,186
15,406
2005
2006
2007
2008
2009
2Q10
CAGR 18%
hChase
hChase
44
Strong growth through organic expansion and WaMu
acquisition
|
 5,760
17,391
7,414
8,409
18,357
Jan-07
Jan-08
Jan-09
Dec-09
Jun-10
Market leading franchises –
Retail Banking growth drivers
Households with direct deposit (# in 000’s)
4,240
10,860
4,926
5,852
11,364
Jan-07
Jan-08
Jan-09
Dec-09
Jun-10
Households with debit cards (# in 000’s)
CAGR 34% (hChase
16%)
CAGR 40% (hChase
19%)
WaMu
(data not available until 2009)
WaMu
(data not available until 2009)
Total households (# in 000s)
10,285
22,838
11,125
22,541
Jan-08
Jan-09
Dec-09
Jun-10
CAGR 38% (hChase
9%)
WaMu
(data not available until 2009)
Active online customers (# in 000s)
4,909
15,424
5,918
11,710
16,584
2006
2007
2008
2009
2Q10
CAGR 42%
hChase
hChase
hChase
45
Strong growth through organic expansion and WaMu
acquisition
|
 1.7
3.0
1.9
2.2
3.9
2005
2006
2007
2008
2009
Market leading franchises –
Retail Banking growth drivers
Strong
growth
through
organic
expansion
and
WaMu
acquisition
20,170
7,067
15,825
7,573
9,650
17,991
2005
2006
2007
2008
2009
2Q10
CAGR 26%
Alerts (# in millions)
135.2
103.1
83.9
124.5
73.6
155.3
1Q09
2Q09
3Q09
4Q09
1Q10
2Q10
CAGR 82%
Households with active online bill pay (# in 000’s)
1,022
3,266
1,279
1,685
3,752
Jan-07
Jan-08
Jan-09
Dec-09
Jun-10
CAGR 46% (hChase
30%)
WaMu
(data not available until 2009)
CAGR
24% (hChase
15%)
WaMu
Personal bankers
Net income ($ in billions)
hChase
hChase
46 |
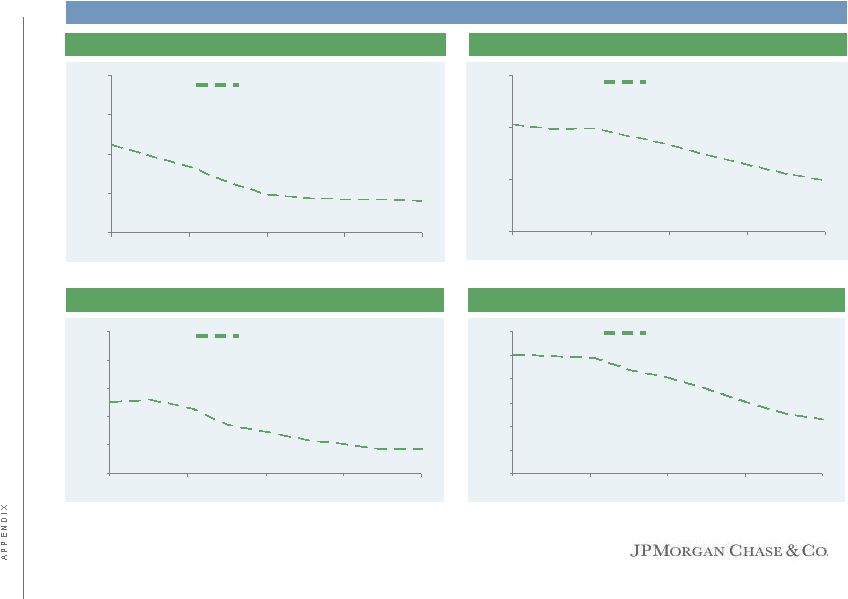
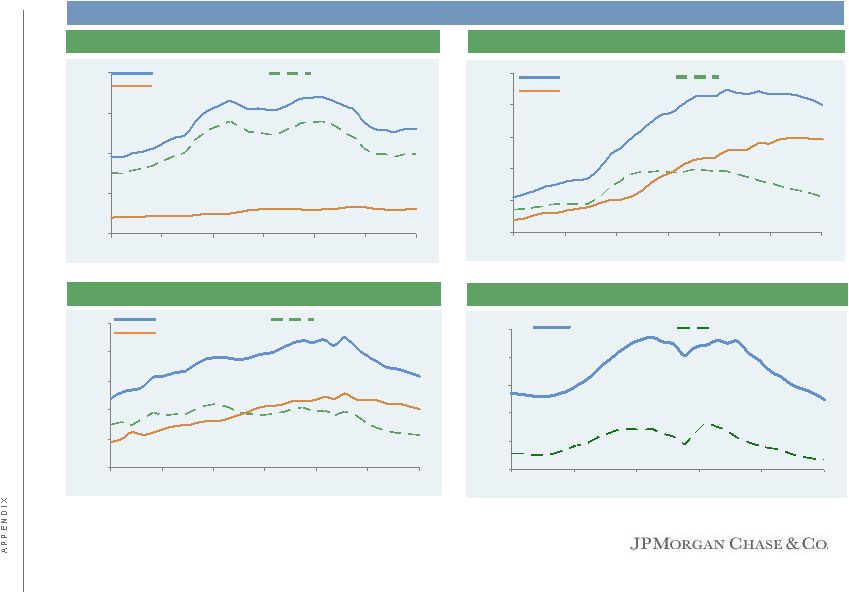 Consumer credit —
delinquency trends (Excl. purchased credit-impaired loans)
Note: Delinquencies prior to September 2008 are heritage Chase
Prime Mortgage excludes held-for-sale, Asset Management and Government
Insured loans 1
See note 1 on slide 52
2
“Payment holiday”
in 2Q09 impacted 30+ day and 30-89 day delinquency trends in 3Q09
$2,000
$3,300
$4,600
$5,900
$7,200
$8,500
Mar-08
Aug-08
Feb-09
Aug-09
Feb-10
Aug-10
30+ day delinquencies
30-89 day delinquencies
Card Services delinquency trend
1,2
—
Excl. WaMu
($ in millions)
Prime Mortgage delinquency trend ($ in millions)
Subprime Mortgage delinquency trend ($ in millions)
Home Equity delinquency trend ($ in millions)
$0
$1,000
$2,000
$3,000
$4,000
Mar-08
Jul-08
Dec-08
May-09
Oct-09
Mar-10
Aug-10
$0
$1,300
$2,600
$3,900
$5,200
$6,500
Mar-08
Jul-08
Dec-08
May-09
Oct-09
Mar-10
Aug-10
$0
$1,000
$2,000
$3,000
$4,000
$5,000
Mar-08
Jul-08
Dec-08
May-09
Oct-09
Mar-10
Aug-10
30 –
150 day delinquencies
30+ day delinquencies
150+ day delinquencies
30 –
150 day delinquencies
30+ day delinquencies
150+ day delinquencies
30 –
150 day delinquencies
30+ day delinquencies
150+ day delinquencies
March 2008 –
August 2010
47 |
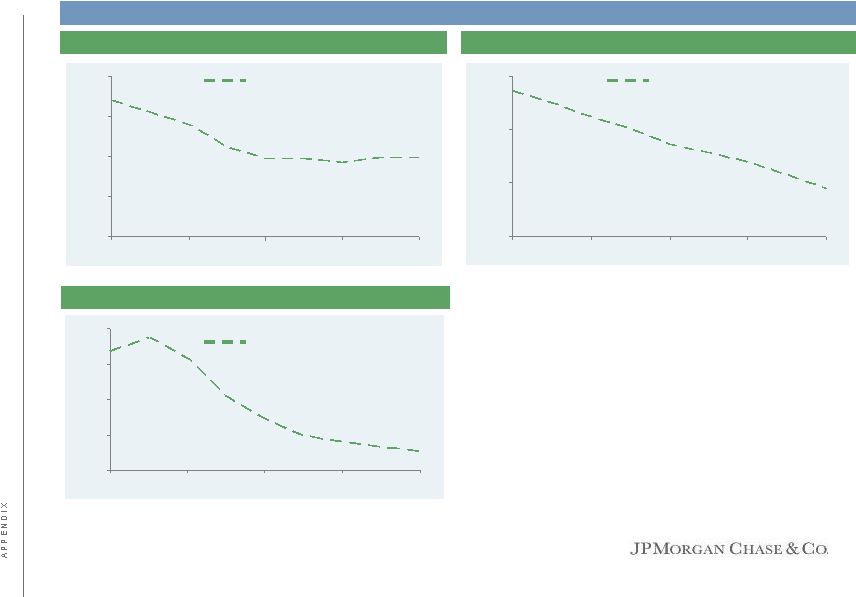 Consumer credit —
Home lending delinquency trends (Excl. purchased credit-impaired loans)
Prime Mortgage excludes held-for-sale, Asset Management and Government
Insured loans Prime Mortgage delinquency trend ($ in millions)
Subprime Mortgage delinquency trend ($ in millions)
Home Equity delinquency trend ($ in millions)
$1,000
$1,500
$2,000
$2,500
$3,000
Dec-09
Jan-10
Apr-10
Jun-10
Aug-10
$1,000
$1,500
$2,000
$2,500
Dec-09
Jan-10
Apr-10
Jun-10
Aug-10
$1,000
$1,250
$1,500
$1,750
$2,000
Dec-09
Jan-10
Apr-10
Jun-10
Aug-10
30 –
150 day delinquencies
30 –
150 day delinquencies
30 –
150 day delinquencies
December 2009 –
August 2010
48 |
 $0
$3,000
$6,000
$9,000
$12,000
$15,000
Sep-08
Jan-09
Jun-09
Oct-09
Mar-10
Aug-10
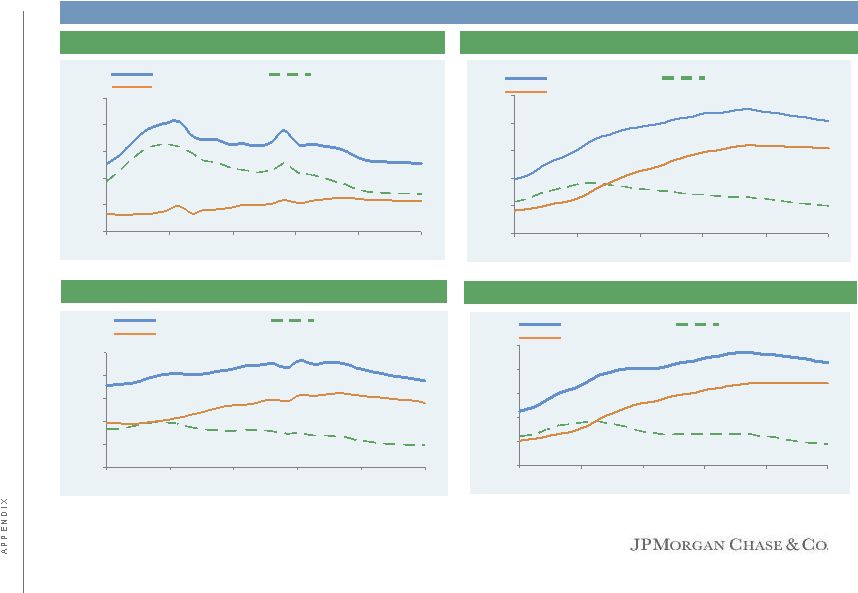
Consumer credit —
Home lending delinquency trends (Purchased credit-impaired loans)
Note: Credit Impaired delinquency is gross UPB. Prime Mortgage excludes
Government Insured loans Subprime Mortgage delinquency trend ($ in
millions) Home Equity delinquency trend ($ in millions)
$0
$1,000
$2,000
$3,000
$4,000
$5,000
Sep-08
Jan-09
Jun-09
Oct-09
Mar-10
Aug-10
$0
$1,500
$3,000
$4,500
$6,000
$7,500
Sep-08
Jan-09
Jun-09
Oct-09
Mar-10
Aug-10
$0
$1,000
$2,000
$3,000
$4,000
$5,000
Sep-08
Jan-09
Jun-09
Oct-09
Mar-10
Aug-10
30 –
150 day delinquencies
30+ day delinquencies
150+ day delinquencies
30 –
150 day delinquencies
30+ day delinquencies
150+ day delinquencies
30 –
150 day delinquencies
30+ day delinquencies
150+ day delinquencies
Option ARM delinquency trend ($ in millions)
30 –
150 day delinquencies
30+ day delinquencies
150+ day delinquencies
September 2008 –
August 2010
Prime Mortgage delinquency trend ($ in millions)
49 |
 Note: Credit Impaired Delinquency is gross UPB. Prime Mortgage excludes Government
Insured loans Prime Mortgage delinquency trend ($ in millions)
Subprime Mortgage delinquency trend ($ in millions)
Home Equity delinquency trend ($ in millions)
$1,000
$1,500
$2,000
$2,500
$3,000
Dec-09
Jan-10
Apr-10
Jun-10
Aug-10
$1,000
$1,500
$2,000
$2,500
Dec-09
Jan-10
Apr-10
Jun-10
Aug-10
$750
$1,000
$1,250
$1,500
$1,750
$2,000
Dec-09
Jan-10
Apr-10
Jun-10
Aug-10
Option ARM delinquency trend ($ in millions)
$1,500
$2,000
$2,500
$3,000
$3,500
$4,000
$4,500
Dec-09
Jan-10
Apr-10
Jun-10
Aug-10
30 –
150 day delinquencies
30 –
150 day delinquencies
30 –
150 day delinquencies
30 –
150 day delinquencies
Consumer credit —
Home lending delinquency trends (Purchased credit-impaired loans)
December 2009 –
August 2010
50 |
 6,933
8,953
11,401
14,785
17,767
17,564
17,050
16,179
13,246
19,052
23,164
27,381
5,273
30,633
35,836
38,186
31,602
29,072
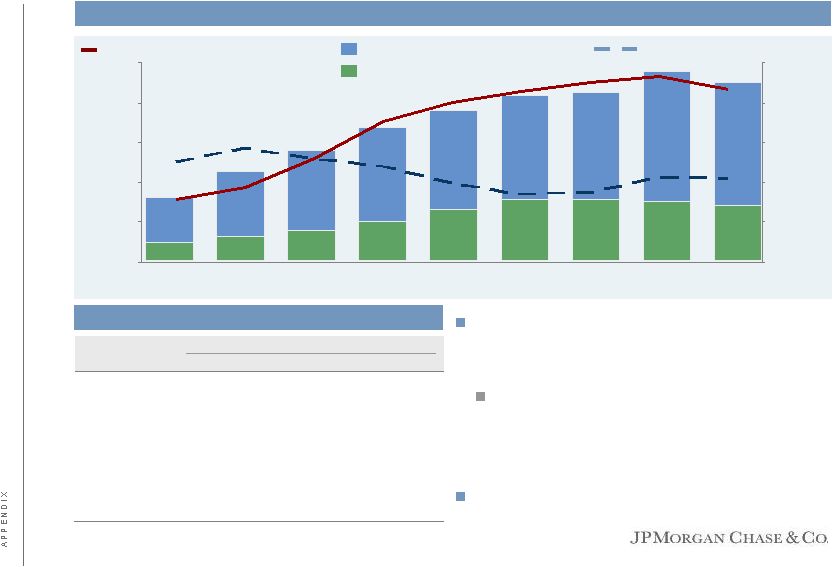
Coverage ratio remains strong
Loan Loss Reserve
Nonperforming Loans
Loan Loss Reserve/Total Loans
Loan Loss Reserve/NPLs
Peer comparison
1
See note 2 on slide 52
2
Peer average reflects equivalent metrics for key competitors. Peers are defined as
C, BAC and WFC. Consumer and wholesale peer average percentages reflected in
table differ from actual average percents due to peer loan disclosure
3
See note 1 on slide 52
($ in millions)
$35.8B of loan loss reserves in 2Q10, up
~$22.6B from $13.2B two years ago; loan
loss
coverage
ratio
of
5.34%
1
$7.5B (pretax) addition in allowance for
loan losses predominantly related to the
consolidation of credit card receivables in
1Q10
3
Strong coverage ratios compared to peers
51
2Q10
JPM
1
Peer
Avg.²
Consumer
LLR/Total Loans
6.88
%
5.75
%
LLR/NPLs
265
%
181
%
Wholesale
LLR/Total Loans
2.42
%
2.95
%
LLR/NPLs
97
%
63
%
Firmwide
LLR/Total Loans
5.34
%
4.87
%
LLR/NPLs
209
%
131
%
1.00%
2.00%
3.00%
4.00%
5.00%
6.00%
2Q08
3Q08
4Q08
1Q09
2Q09
3Q09
4Q09
1Q10
2Q10
0%
100%
200%
300%
400%
500%
1
1 |
 Notes on non-GAAP financial measures
52
1.
In addition to analyzing the Firm’s results on a reported basis, management reviews the
Firm’s results and the results of the lines of business on a “managed” basis,
which is a non-GAAP financial measure. The Firm’s definition of managed basis starts with the
reported U.S. GAAP results and includes certain reclassifications to present total net revenue
for the Firm (and each of the business segments) on a FTE basis. Accordingly, revenue from tax-exempt securities and investments that receive
tax credits is presented in the managed results on a basis comparable to taxable securities and
investments. This non-GAAP financial measure allows management to assess the comparability
of revenue arising from both taxable and tax-exempt sources. The corresponding income tax impact related to these items is recorded within
income tax expense. These adjustments have no impact on net income as reported by the Firm as a whole
or by the lines of business. Prior to January 1, 2010, the Firm’s managed-basis presentation also included certain
reclassification adjustments that assumed credit card loans securitized by CS remained on the
balance sheet. Effective January 1, 2010, the Firm adopted new accounting guidance that amended the accounting for the transfer of financial assets
and the consolidation of VIEs. Additionally, the new guidance required the Firm to consolidate its
Firm-sponsored credit card securitizations trusts. The income, expense and credit costs
associated with these securitization activities are now recorded in the 2010 Consolidated Statements of Income in the same classifications that were
previously used to report such items on a managed basis. As a result of the consolidation of the
credit card securitization trusts, reported and managed basis relating to credit card
securitizations are comparable for periods beginning after January 1, 2010. The presentation in 2009 of CS results on a managed basis assumed that credit card loans that had been
securitized and sold in accordance with U.S. GAAP remained on the Consolidated Balance Sheets,
and that the earnings on the securitized loans were classified in the same manner as the earnings on retained loans recorded on the
Consolidated Balance Sheets. JPMorgan Chase used the concept of managed basis to evaluate the credit
performance and overall financial performance of the entire managed credit card portfolio.
Operations were funded and decisions were made about allocating resources, such as employees and capital, based on managed financial
information. In addition, the same underwriting standards and ongoing risk monitoring are used for
both loans on the Consolidated Balance Sheets and securitized loans. Although securitizations
result in the sale of credit card receivables to a trust, JPMorgan Chase retains the ongoing customer relationships, as the customers may
continue to use their credit cards; accordingly, the customer’s credit performance affects both
the securitized loans and the loans retained on the Consolidated Balance Sheets. JPMorgan Chase
believed that this managed-basis information was useful to investors, as it enabled them to understand both the credit risks associated with the
loans reported on the Consolidated Balance Sheets and the Firm’s retained interests in
securitized loans 2.
The ratio for the allowance for loan losses to end-of-period loans excludes the following:
loans accounted for at fair value and loans held-for-sale; purchased credit-
impaired loans; the allowance for loan losses related to purchased credit-impaired loans; and,
loans from the Washington Mutual Master Trust, which were consolidated on the firm's balance
sheet at fair value during the second quarter of 2009. Additionally, Real Estate Portfolios net charge-off rates exclude the impact of purchased credit-
impaired loans. The allowance for loan losses related to the purchased credit-impaired portfolio
was $2.8 billion, $2.8 billion, $1.6 billion and $1.1 billion at June 30, 2010, March 31, 2010,
December 31, 2009 and September 30, 2009, respectively. No allowance for loan losses was recorded at or for any period prior to, June 30, 2009
related to these loans.
3.
Tier 1 Common Capital ("Tier 1 Common") is defined as Tier 1 capital less elements of capital
not in the form of common equity – such as qualifying perpetual preferred stock,
qualifying noncontrolling interest in subsidiaries and qualifying trust preferred capital debt securities. Tier 1 Common, a non-GAAP financial measure, is used by
banking regulators, investors and analysts to assess and compare the quality and composition of the
Firm’s capital with the capital of other financial services companies. The Firm uses Tier
1 Common along with the other capital measures to assess and monitor its capital position. 4.
Tangible Common Equity ("TCE") is calculated, for all purposes, as common stockholders equity
(i.e., total stockholders' equity less preferred stock) less identifiable intangible assets
(other than MSRs) and goodwill, net of related deferred tax liabilities. Return on tangible common equity, a non-GAAP financial ratio, measures the
Firm’s earnings as a percentage of TCE, and is in management’s view a meaningful measure to
assess the Firm’s use of equity. The TCE measures used in this presentation are not
necessarily comparable to similarly titled measures provided by other firms due to differences in calculation methodologies.
5.
Headcount-related expense includes salary and benefits (excluding performance-based
incentives), and other noncompensation costs related to employees. |
 Forward-looking statements
This presentation contains forward-looking statements within the meaning of the
Private Securities Litigation Reform Act of 1995. Such statements are
based upon the current beliefs and expectations of JPMorgan Chase’s
management and are subject to significant risks and uncertainties. Actual
results may differ from those set forth in the forward-looking
statements. Factors that could cause JPMorgan Chase’s actual
results to differ materially from those described in the forward-looking
statements can be found in JPMorgan Chase’s Annual Report on Form 10-K for
the year ended December 31, 2009 and Quarterly Reports on Form 10-Q for
the quarters ended June 30, 2010 and March
31,
2010,
each
of
which
has
been
filed
with
the
Securities
and
Exchange
Commission
and
is
available
on
JPMorgan
Chase’s
website
(www.jpmorganchase.com)
and
on
the
Securities
and
Exchange
Commission’s
website
(www.sec.gov).
JPMorgan
Chase
does
not
undertake
to
update
the
forward-looking statements to reflect the impact of circumstances or events
that may arise after the date of the forward-looking statements.
53 |