Attached files
| file | filename |
|---|---|
| 8-K - 8-K - INLAND REAL ESTATE CORP | a10-17766_18k.htm |
| EX-99.2 - EX-99.2 - INLAND REAL ESTATE CORP | a10-17766_1ex99d2.htm |
Exhibit 99.1
|
|
Investor Presentation BMO Capital Markets North American Real Estate Conference September 15-17, 2010 www.inlandrealestate.com NYSE: IRC |
|
|
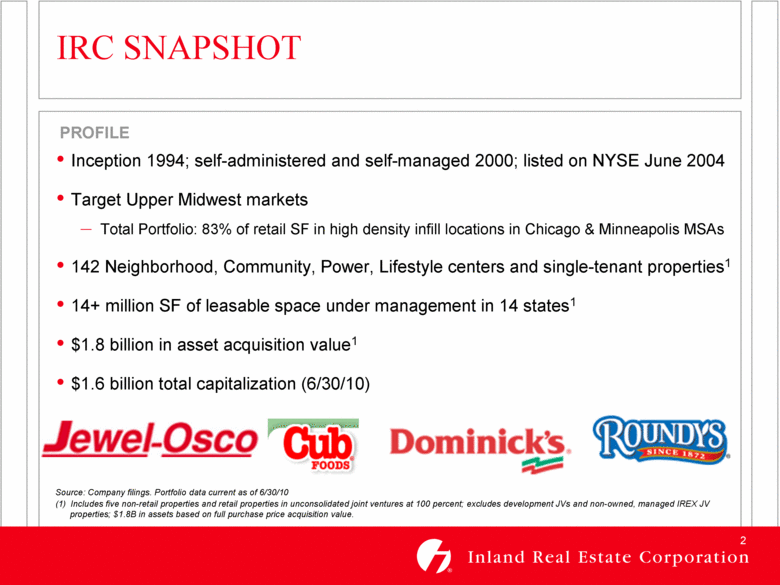
IRC SNAPSHOT PROFILE Inception 1994; self-administered and self-managed 2000; listed on NYSE June 2004 Target Upper Midwest markets Total Portfolio: 83% of retail SF in high density infill locations in Chicago & Minneapolis MSAs 142 Neighborhood, Community, Power, Lifestyle centers and single-tenant properties1 14+ million SF of leasable space under management in 14 states1 $1.8 billion in asset acquisition value1 $1.6 billion total capitalization (6/30/10) Source: Company filings. Portfolio data current as of 6/30/10 (1) Includes five non-retail properties and retail properties in unconsolidated joint ventures at 100 percent; excludes development JVs and non-owned, managed IREX JV properties; $1.8B in assets based on full purchase price acquisition value. |
|
|
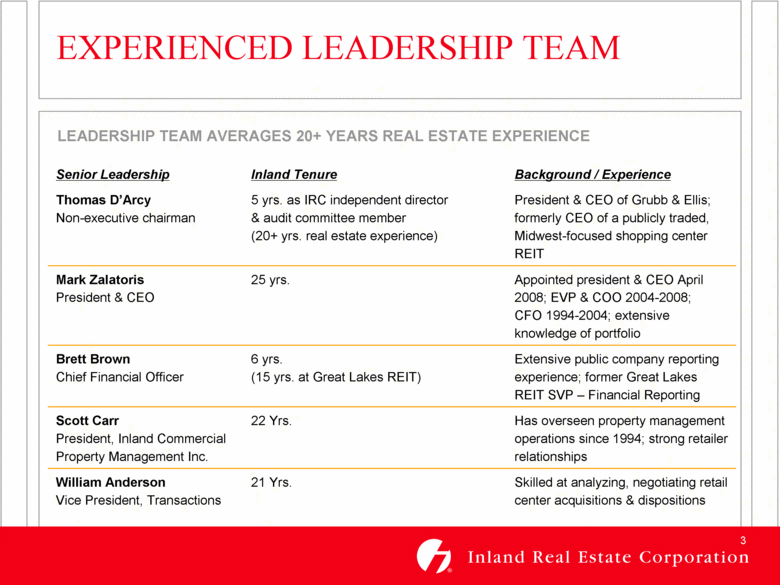
EXPERIENCED LEADERSHIP TEAM Senior Leadership Inland Tenure Background / Experience Thomas D’Arcy Non-executive chairman 5 yrs. as IRC independent director & audit committee member (20+ yrs. real estate experience) President & CEO of Grubb & Ellis; formerly CEO of a publicly traded, Midwest-focused shopping center REIT Mark Zalatoris President & CEO 25 yrs. Appointed president & CEO April 2008; EVP & COO 2004-2008; CFO 1994-2004; extensive knowledge of portfolio Brett Brown Chief Financial Officer 6 yrs. (15 yrs. at Great Lakes REIT) Extensive public company reporting experience; former Great Lakes REIT SVP – Financial Reporting Scott Carr President, Inland Commercial Property Management Inc. 22 Yrs. Has overseen property management operations since 1994; strong retailer relationships William Anderson Vice President, Transactions 21 Yrs. Skilled at analyzing, negotiating retail center acquisitions & dispositions LEADERSHIP TEAM AVERAGES 20+ YEARS REAL ESTATE EXPERIENCE |
|
|
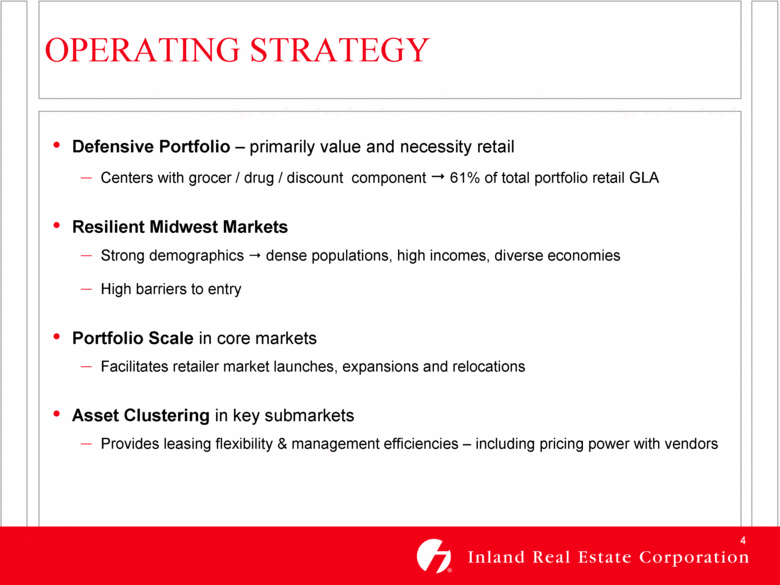
OPERATING STRATEGY Defensive Portfolio – primarily value and necessity retail Centers with grocer / drug / discount component 61% of total portfolio retail GLA Resilient Midwest Markets Strong demographics dense populations, high incomes, diverse economies High barriers to entry Portfolio Scale in core markets Facilitates retailer market launches, expansions and relocations Asset Clustering in key submarkets Provides leasing flexibility & management efficiencies – including pricing power with vendors |
|
|
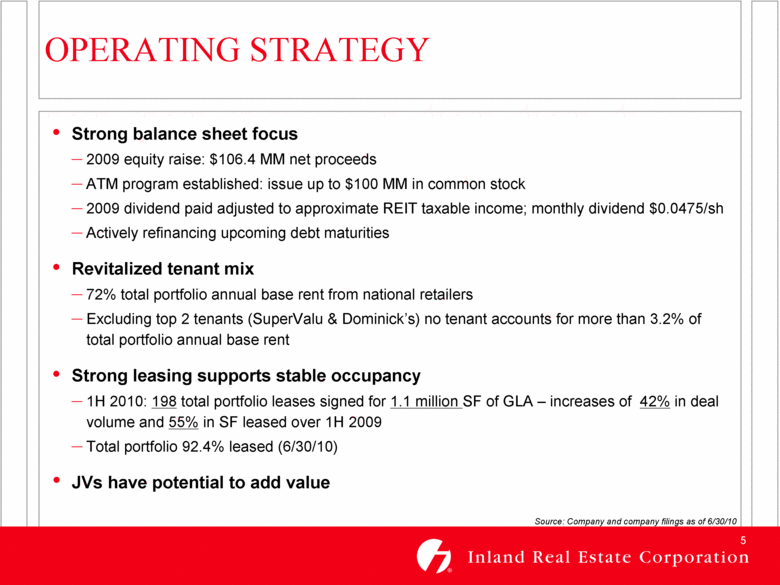
OPERATING STRATEGY Source: Company and company filings as of 6/30/10 Strong balance sheet focus 2009 equity raise: $106.4 MM net proceeds ATM program established: issue up to $100 MM in common stock 2009 dividend paid adjusted to approximate REIT taxable income; monthly dividend $0.0475/sh Actively refinancing upcoming debt maturities Revitalized tenant mix 72% total portfolio annual base rent from national retailers Excluding top 2 tenants (SuperValu & Dominick’s) no tenant accounts for more than 3.2% of total portfolio annual base rent Strong leasing supports stable occupancy 1H 2010: 198 total portfolio leases signed for 1.1 million SF of GLA – increases of 42% in deal volume and 55% in SF leased over 1H 2009 Total portfolio 92.4% leased (6/30/10) JVs have potential to add value |
|
|
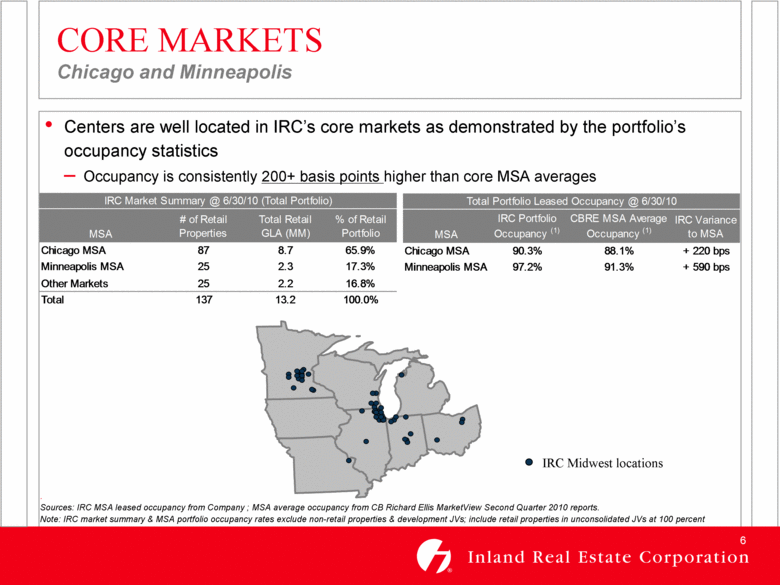
CORE MARKETS Chicago and Minneapolis . Sources: IRC MSA leased occupancy from Company ; MSA average occupancy from CB Richard Ellis MarketView Second Quarter 2010 reports. Note: IRC market summary & MSA portfolio occupancy rates exclude non-retail properties & development JVs; include retail properties in unconsolidated JVs at 100 percent Centers are well located in IRC’s core markets as demonstrated by the portfolio’s occupancy statistics Occupancy is consistently 200+ basis points higher than core MSA averages IRC Midwest locations MSA IRC Portfolio Occupancy (1) CBRE MSA Average Occupancy (1) IRC Variance to MSA Chicago MSA 90.3% 88.1% + 220 bps Minneapolis MSA 97.2% 91.3% + 590 bps Total Portfolio Leased Occupancy @ 6/30/10 MSA # of Retail Properties Total Retail GLA (MM) % of Retail Portfolio Chicago MSA 87 8.7 65.9% Minneapolis MSA 25 2.3 17.3% Other Markets 25 2.2 16.8% Total 137 13.2 100.0% IRC Market Summary @ 6/30/10 (Total Portfolio) |
|
|
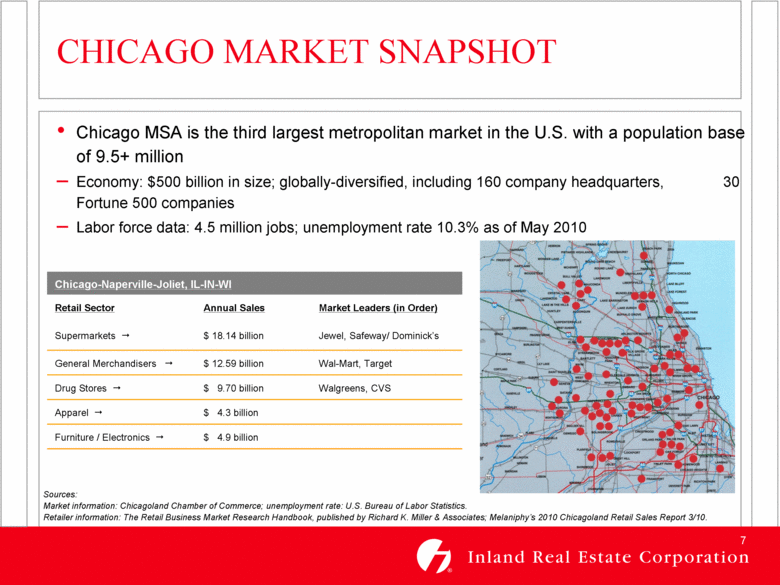
CHICAGO MARKET SNAPSHOT Sources: Market information: Chicagoland Chamber of Commerce; unemployment rate: U.S. Bureau of Labor Statistics. Retailer information: The Retail Business Market Research Handbook, published by Richard K. Miller & Associates; Melaniphy’s 2010 Chicagoland Retail Sales Report 3/10. Chicago-Naperville-Joliet, IL-IN-WI Retail Sector Annual Sales Market Leaders (in Order) Supermarkets $ 18.14 billion Jewel, Safeway/ Dominick’s General Merchandisers $ 12.59 billion Wal-Mart, Target Drug Stores $ 9.70 billion Walgreens, CVS Apparel $ 4.3 billion Furniture / Electronics $ 4.9 billion Chicago MSA is the third largest metropolitan market in the U.S. with a population base of 9.5+ million Economy: $500 billion in size; globally-diversified, including 160 company headquarters, 30 Fortune 500 companies Labor force data: 4.5 million jobs; unemployment rate 10.3% as of May 2010 |
|
|
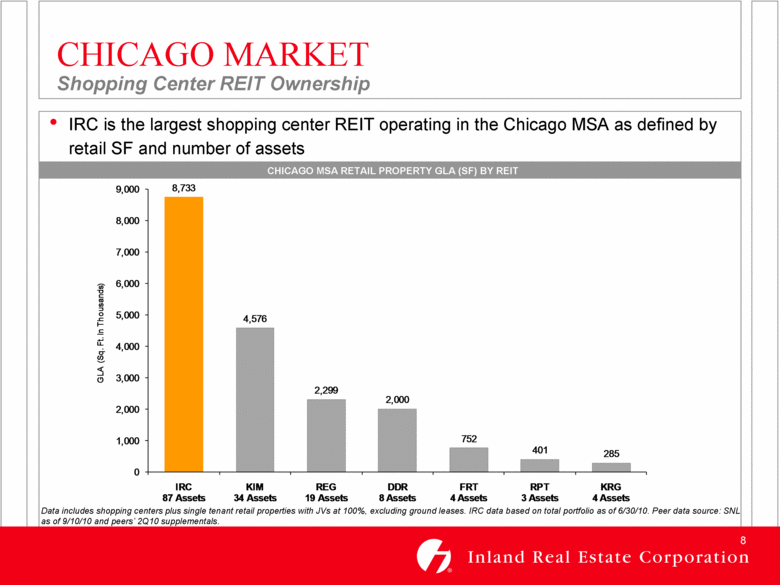
CHICAGO MARKET Shopping Center REIT Ownership Data includes shopping centers plus single tenant retail properties with JVs at 100%, excluding ground leases. IRC data based on total portfolio as of 6/30/10. Peer data source: SNL as of 9/10/10 and peers’ 2Q10 supplementals. IRC is the largest shopping center REIT operating in the Chicago MSA as defined by retail SF and number of assets CHICAGO MSA RETAIL PROPERTY GLA (SF) BY REIT 8,733 4,576 2,299 2,000 752 401 285 0 1,000 2,000 3,000 4,000 5,000 6,000 7,000 8,000 9,000 IRC 87 Assets KIM 34 Assets REG 19 Assets DDR 8 Assets FRT 4 Assets RPT 3 Assets KRG 4 Assets GLA (Sq. Ft. In Thousands) |
|
|
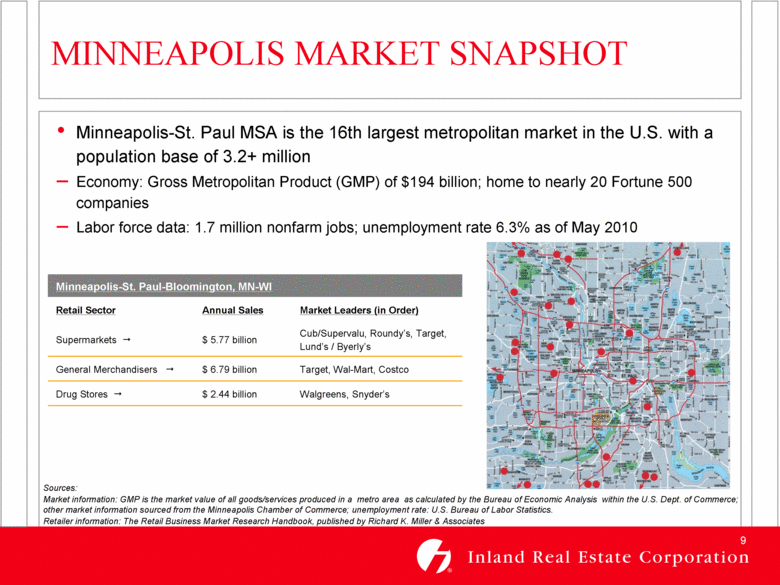
MINNEAPOLIS MARKET SNAPSHOT Sources: Market information: GMP is the market value of all goods/services produced in a metro area as calculated by the Bureau of Economic Analysis within the U.S. Dept. of Commerce; other market information sourced from the Minneapolis Chamber of Commerce; unemployment rate: U.S. Bureau of Labor Statistics. Retailer information: The Retail Business Market Research Handbook, published by Richard K. Miller & Associates Minneapolis-St. Paul-Bloomington, MN-WI Retail Sector Annual Sales Market Leaders (in Order) Supermarkets $ 5.77 billion Cub/Supervalu, Roundy’s, Target, Lund’s / Byerly’s General Merchandisers $ 6.79 billion Target, Wal-Mart, Costco Drug Stores $ 2.44 billion Walgreens, Snyder’s Minneapolis-St. Paul MSA is the 16th largest metropolitan market in the U.S. with a population base of 3.2+ million Economy: Gross Metropolitan Product (GMP) of $194 billion; home to nearly 20 Fortune 500 companies Labor force data: 1.7 million nonfarm jobs; unemployment rate 6.3% as of May 2010 |
|
|
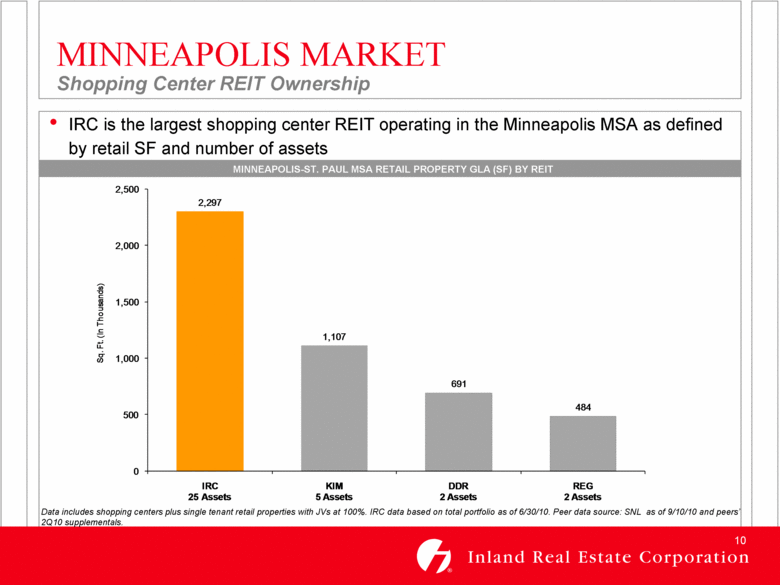
MINNEAPOLIS MARKET Shopping Center REIT Ownership IRC is the largest shopping center REIT operating in the Minneapolis MSA as defined by retail SF and number of assets MINNEAPOLIS-ST. PAUL MSA RETAIL PROPERTY GLA (SF) BY REIT Data includes shopping centers plus single tenant retail properties with JVs at 100%. IRC data based on total portfolio as of 6/30/10. Peer data source: SNL as of 9/10/10 and peers’ 2Q10 supplementals. 2,297 1,107 691 484 0 500 1,000 1,500 2,000 2,500 IRC 25 Assets KIM 5 Assets DDR 2 Assets REG 2 Assets Sq. Ft. (In Thousands) |
|
|
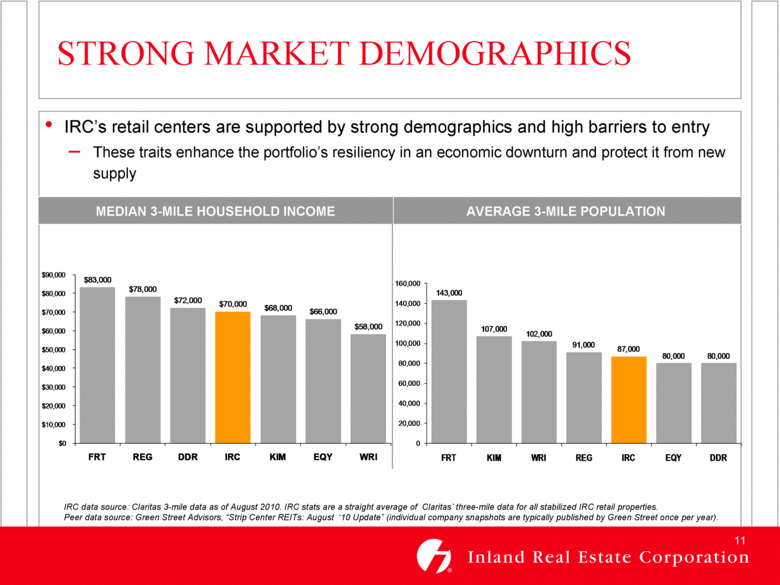
STRONG MARKET DEMOGRAPHICS IRC data source: Claritas 3-mile data as of August 2010. IRC stats are a straight average of Claritas’ three-mile data for all stabilized IRC retail properties. Peer data source: Green Street Advisors, “Strip Center REITs: August ‘10 Update” (individual company snapshots are typically published by Green Street once per year). IRC’s retail centers are supported by strong demographics and high barriers to entry These traits enhance the portfolio’s resiliency in an economic downturn and protect it from new supply MEDIAN 3-MILE HOUSEHOLD INCOME AVERAGE 3-MILE POPULATION 143,000 107,000 102,000 91,000 87,000 80,000 80,000 0 20,000 40,000 60,000 80,000 100,000 120,000 140,000 160,000 FRT KIM WRI REG IRC EQY DDR |
|
|
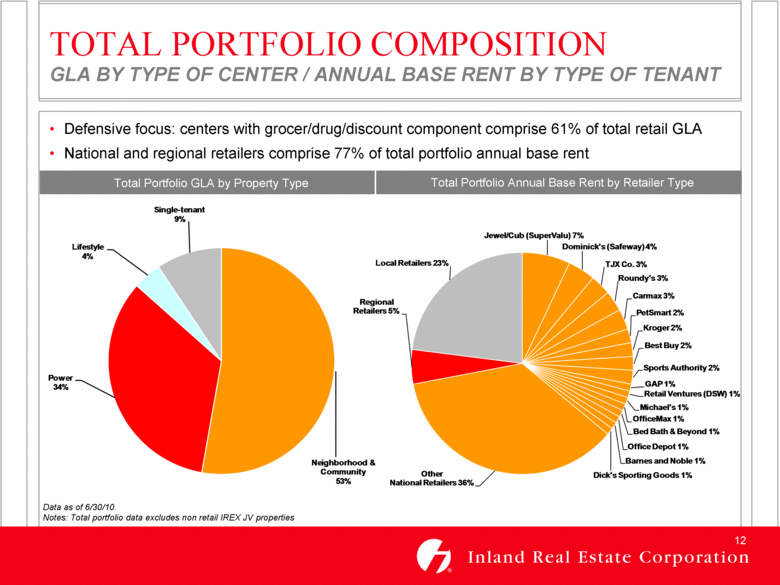
TOTAL PORTFOLIO COMPOSITION GLA BY TYPE OF CENTER / ANNUAL BASE RENT BY TYPE OF TENANT (1) Data as of 6/30/10. Notes: Total portfolio data excludes non retail IREX JV properties Defensive focus: centers with grocer/drug/discount component comprise 61% of total retail GLA National and regional retailers comprise 77% of total portfolio annual base rent Total Portfolio GLA by Property Type Total Portfolio Annual Base Rent by Retailer Type Neighborhood & Community 53% Power 34% Lifestyle 4% Single - tenant 9% Jewel/Cub (SuperValu) 7% Dominick's (Safeway) 4% TJX Co. 3% Roundy's 3% Carmax 3% PetSmart 2% Kroger 2% Best Buy 2% Sports Authority 2% GAP 1% Retail Ventures (DSW) 1% Michael's 1% OfficeMax 1% Bed Bath & Beyond 1% Office Depot 1% Barnes and Noble 1% Dick's Sporting Goods 1% Other National Retailers 36% Regional Retailers 5% Local Retailers 23% |
|
|
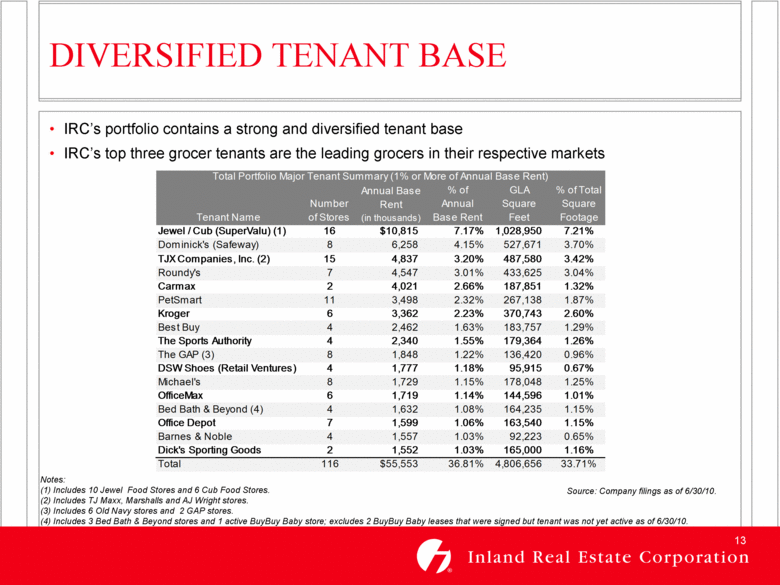
DIVERSIFIED TENANT BASE IRC’s portfolio contains a strong and diversified tenant base IRC’s top three grocer tenants are the leading grocers in their respective markets (1) Notes: (1) Includes 10 Jewel Food Stores and 6 Cub Food Stores. (2) Includes TJ Maxx, Marshalls and AJ Wright stores. (3) Includes 6 Old Navy stores and 2 GAP stores. (4) Includes 3 Bed Bath & Beyond stores and 1 active BuyBuy Baby store; excludes 2 BuyBuy Baby leases that were signed but tenant was not yet active as of 6/30/10. Source: Company filings as of 6/30/10. Tenant Name Number of Stores Annual Base Rent (in thousands) % of Annual Base Rent GLA Square Feet % of Total Square Footage Jewel / Cub (SuperValu) (1) 16 $10,815 7.17% 1,028,950 7.21% Dominick's (Safeway) 8 6,258 4.15% 527,671 3.70% TJX Companies, Inc. (2) 15 4,837 3.20% 487,580 3.42% Roundy's 7 4,547 3.01% 433,625 3.04% Carmax 2 4,021 2.66% 187,851 1.32% PetSmart 11 3,498 2.32% 267,138 1.87% Kroger 6 3,362 2.23% 370,743 2.60% Best Buy 4 2,462 1.63% 183,757 1.29% The Sports Authority 4 2,340 1.55% 179,364 1.26% The GAP (3) 8 1,848 1.22% 136,420 0.96% DSW Shoes (Retail Ventures) 4 1,777 1.18% 95,915 0.67% Michael's 8 1,729 1.15% 178,048 1.25% OfficeMax 6 1,719 1.14% 144,596 1.01% Bed Bath & Beyond (4) 4 1,632 1.08% 164,235 1.15% Office Depot 7 1,599 1.06% 163,540 1.15% Barnes & Noble 4 1,557 1.03% 92,223 0.65% Dick's Sporting Goods 2 1,552 1.03% 165,000 1.16% Total 116 $55,553 36.81% 4,806,656 33.71% Total Portfolio Major Tenant Summary (1% or More of Annual Base Rent) |
|
|
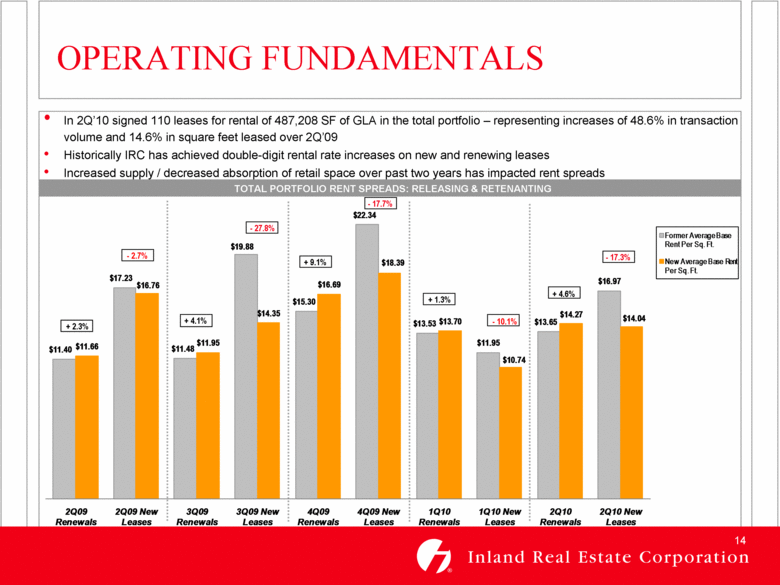
In 2Q’10 signed 110 leases for rental of 487,208 SF of GLA in the total portfolio – representing increases of 48.6% in transaction volume and 14.6% in square feet leased over 2Q’09 Historically IRC has achieved double-digit rental rate increases on new and renewing leases Increased supply / decreased absorption of retail space over past two years has impacted rent spreads TOTAL PORTFOLIO RENT SPREADS: RELEASING & RETENANTING OPERATING FUNDAMENTALS + 2.3% - 2.7% - 10.1% + 9.1% + 4.1% - 27.8% + 1.3% - 17.7% + 4.6% - 17.3% $11.40 $17.23 $11.48 $19.88 $15.30 $22.34 $13.53 $11.95 $13.65 $16.97 $11.66 $16.76 $11.95 $14.35 $16.69 $18.39 $13.70 $10.74 $14.27 $14.04 2Q09 Renewals 2Q09 New Leases 3Q09 Renewals 3Q09 New Leases 4Q09 Renewals 4Q09 New Leases 1Q10 Renewals 1Q10 New Leases 2Q10 Renewals 2Q10 New Leases Former Average Base Rent Per Sq. Ft. New Average Base Rent Per Sq. Ft. |
|
|
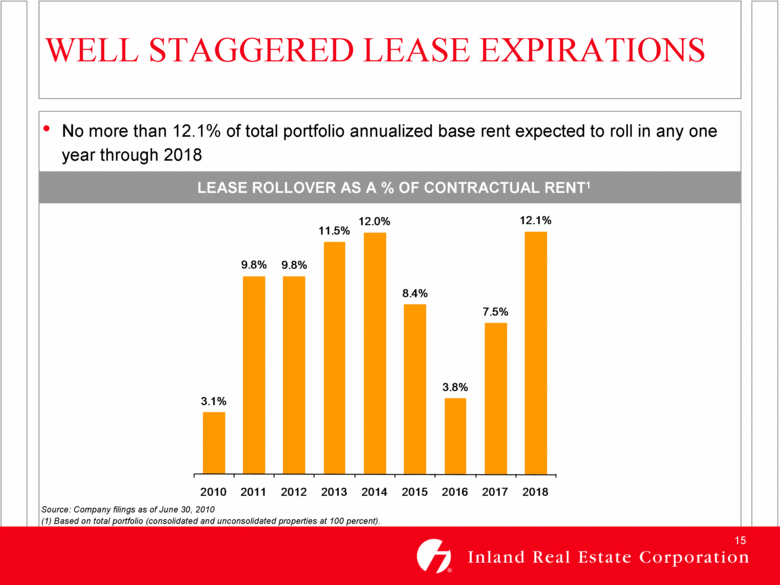
WELL STAGGERED LEASE EXPIRATIONS No more than 12.1% of total portfolio annualized base rent expected to roll in any one year through 2018 Source: Company filings as of June 30, 2010 (1) Based on total portfolio (consolidated and unconsolidated properties at 100 percent). LEASE ROLLOVER AS A % OF CONTRACTUAL RENT1 3.1% 9.8% 9.8% 11.5% 12.0% 8.4% 3.8% 7.5% 12.1% 2010 2011 2012 2013 2014 2015 2016 2017 2018 |
|
|
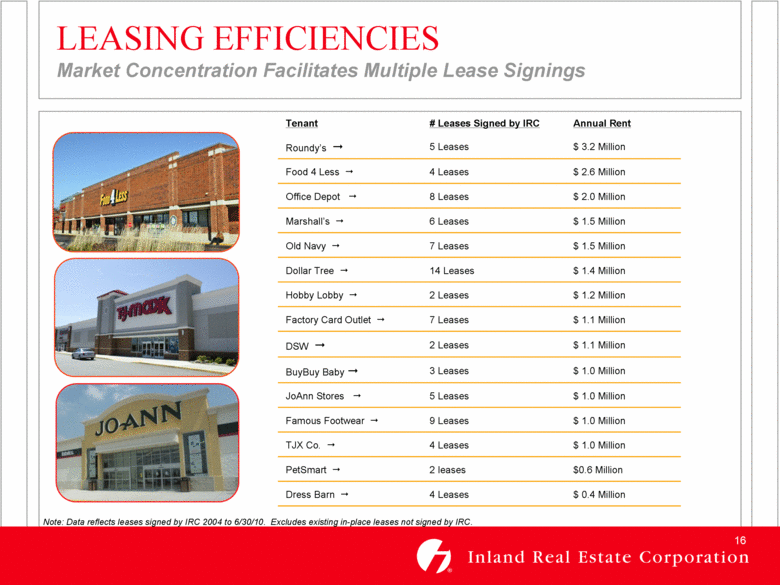
Tenant # Leases Signed by IRC Annual Rent Roundy’s 5 Leases $ 3.2 Million Food 4 Less 4 Leases $ 2.6 Million Office Depot 8 Leases $ 2.0 Million Marshall’s 6 Leases $ 1.5 Million Old Navy 7 Leases $ 1.5 Million Dollar Tree 14 Leases $ 1.4 Million Hobby Lobby 2 Leases $ 1.2 Million Factory Card Outlet 7 Leases $ 1.1 Million DSW 2 Leases $ 1.1 Million BuyBuy Baby 3 Leases $ 1.0 Million JoAnn Stores 5 Leases $ 1.0 Million Famous Footwear 9 Leases $ 1.0 Million TJX Co. 4 Leases $ 1.0 Million PetSmart 2 leases $0.6 Million Dress Barn 4 Leases $ 0.4 Million LEASING EFFICIENCIES Market Concentration Facilitates Multiple Lease Signings Note: Data reflects leases signed by IRC 2004 to 6/30/10. Excludes existing in-place leases not signed by IRC. |
|
|
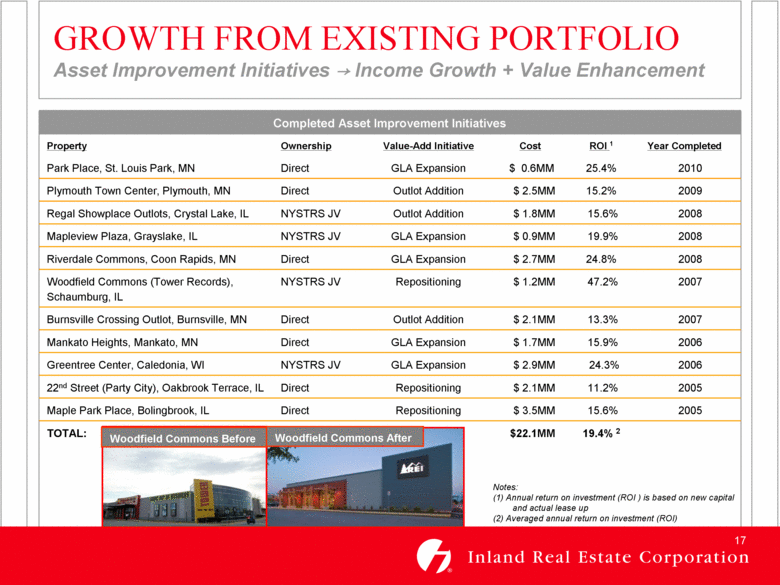
GROWTH FROM EXISTING PORTFOLIO Asset Improvement Initiatives → Income Growth + Value Enhancement Completed Asset Improvement Initiatives Property Ownership Value-Add Initiative Cost ROI 1 Year Completed Park Place, St. Louis Park, MN Direct GLA Expansion $ 0.6MM 25.4% 2010 Plymouth Town Center, Plymouth, MN Direct Outlot Addition $ 2.5MM 15.2% 2009 Regal Showplace Outlots, Crystal Lake, IL NYSTRS JV Outlot Addition $ 1.8MM 15.6% 2008 Mapleview Plaza, Grayslake, IL NYSTRS JV GLA Expansion $ 0.9MM 19.9% 2008 Riverdale Commons, Coon Rapids, MN Direct GLA Expansion $ 2.7MM 24.8% 2008 Woodfield Commons (Tower Records), Schaumburg, IL NYSTRS JV Repositioning $ 1.2MM 47.2% 2007 Burnsville Crossing Outlot, Burnsville, MN Direct Outlot Addition $ 2.1MM 13.3% 2007 Mankato Heights, Mankato, MN Direct GLA Expansion $ 1.7MM 15.9% 2006 Greentree Center, Caledonia, WI NYSTRS JV GLA Expansion $ 2.9MM 24.3% 2006 22nd Street (Party City), Oakbrook Terrace, IL Direct Repositioning $ 2.1MM 11.2% 2005 Maple Park Place, Bolingbrook, IL Direct Repositioning $ 3.5MM 15.6% 2005 TOTAL: $22.1MM 19.4% 2 Notes: (1) Annual return on investment (ROI ) is based on new capital and actual lease up (2) Averaged annual return on investment (ROI) Woodfield Commons Before Woodfield Commons After |
|
|
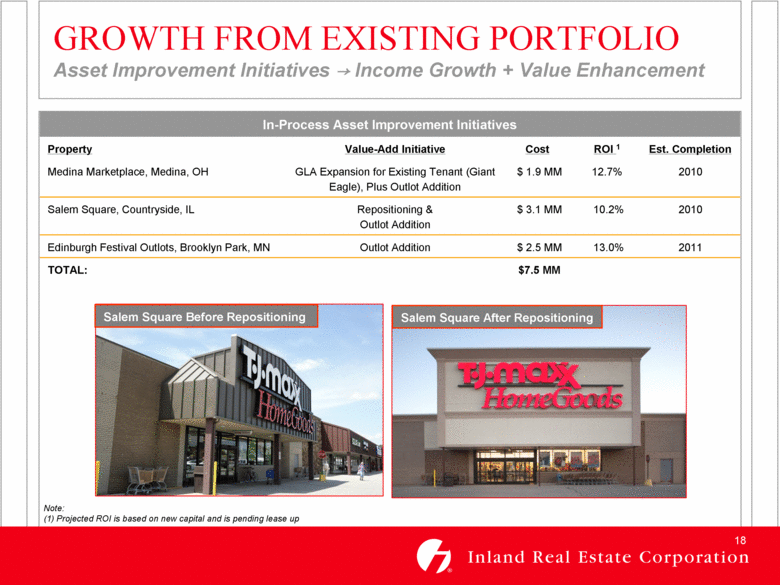
GROWTH FROM EXISTING PORTFOLIO Asset Improvement Initiatives → Income Growth + Value Enhancement In-Process Asset Improvement Initiatives Property Value-Add Initiative Cost ROI 1 Est. Completion Medina Marketplace, Medina, OH GLA Expansion for Existing Tenant (Giant Eagle), Plus Outlot Addition $ 1.9 MM 12.7% 2010 Salem Square, Countryside, IL Repositioning & Outlot Addition $ 3.1 MM 10.2% 2010 Edinburgh Festival Outlots, Brooklyn Park, MN Outlot Addition $ 2.5 MM 13.0% 2011 TOTAL: $7.5 MM Note: (1) Projected ROI is based on new capital and is pending lease up Salem Square Before Repositioning Salem Square After Repositioning |
|
|
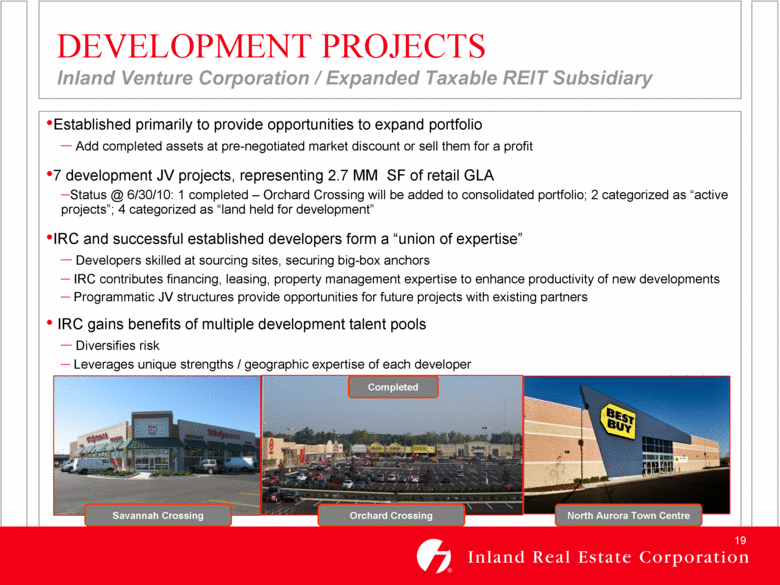
DEVELOPMENT PROJECTS Inland Venture Corporation / Expanded Taxable REIT Subsidiary Established primarily to provide opportunities to expand portfolio Add completed assets at pre-negotiated market discount or sell them for a profit 7 development JV projects, representing 2.7 MM SF of retail GLA Status @ 6/30/10: 1 completed – Orchard Crossing will be added to consolidated portfolio; 2 categorized as “active projects”; 4 categorized as “land held for development” IRC and successful established developers form a “union of expertise” Developers skilled at sourcing sites, securing big-box anchors IRC contributes financing, leasing, property management expertise to enhance productivity of new developments Programmatic JV structures provide opportunities for future projects with existing partners IRC gains benefits of multiple development talent pools Diversifies risk Leverages unique strengths / geographic expertise of each developer Savannah Crossing North Aurora Town Centre Orchard Crossing Completed |
|
|
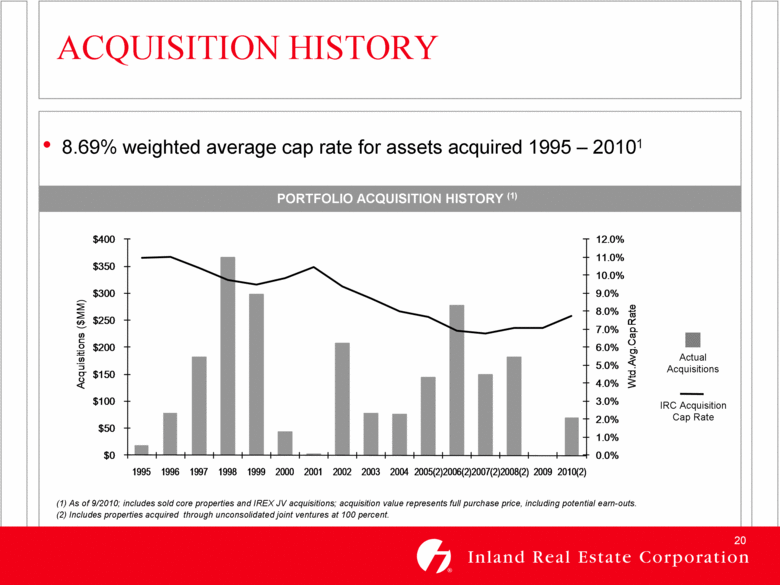
(1) As of 9/2010; includes sold core properties and IREX JV acquisitions; acquisition value represents full purchase price, including potential earn-outs. (2) Includes properties acquired through unconsolidated joint ventures at 100 percent. ACQUISITION HISTORY 8.69% weighted average cap rate for assets acquired 1995 – 20101 Actual Acquisitions IRC Acquisition Cap Rate PORTFOLIO ACQUISITION HISTORY (1) 0.0% 1.0% 2.0% 3.0% 4.0% 5.0% 6.0% 7.0% 8.0% 9.0% 10.0% 11.0% 12.0% $0 $50 $100 $150 $200 $250 $300 $350 $400 1995 1996 1997 1998 1999 2000 2001 2002 2003 2004 2005(2) 2006(2) 2007(2) 2008(2) 2009 2010(2) Wtd.Avg.Cap Rate Acquisitions ($MM) |
|
|
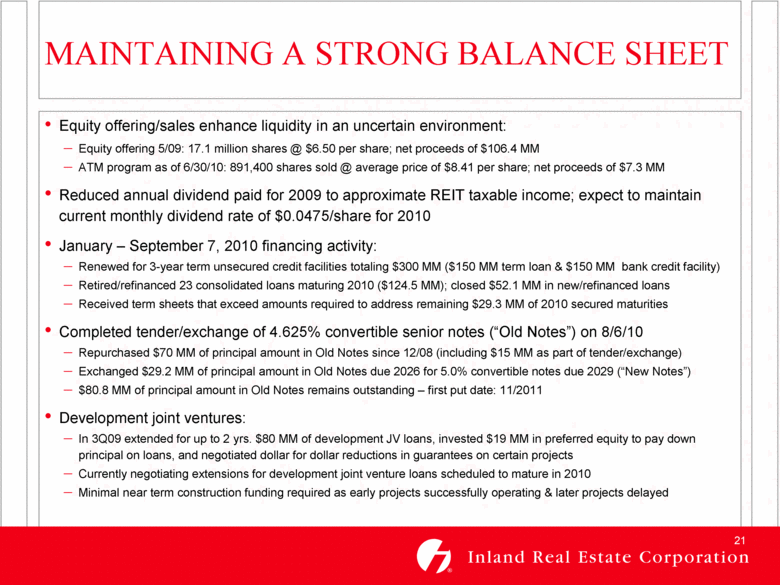
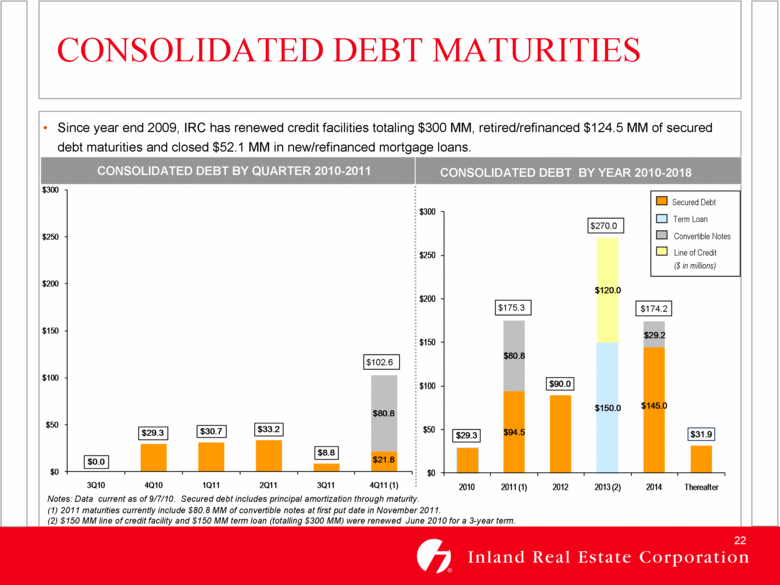
MAINTAINING A STRONG BALANCE SHEET Equity offering/sales enhance liquidity in an uncertain environment: Equity offering 5/09: 17.1 million shares @ $6.50 per share; net proceeds of $106.4 MM ATM program as of 6/30/10: 891,400 shares sold @ average price of $8.41 per share; net proceeds of $7.3 MM Reduced annual dividend paid for 2009 to approximate REIT taxable income; expect to maintain current monthly dividend rate of $0.0475/share for 2010 January – September 7, 2010 financing activity: Renewed for 3-year term unsecured credit facilities totaling $300 MM ($150 MM term loan & $150 MM bank credit facility) Retired/refinanced 23 consolidated loans maturing 2010 ($124.5 MM); closed $52.1 MM in new/refinanced loans Received term sheets that exceed amounts required to address remaining $29.3 MM of 2010 secured maturities Completed tender/exchange of 4.625% convertible senior notes (“Old Notes”) on 8/6/10 Repurchased $70 MM of principal amount in Old Notes since 12/08 (including $15 MM as part of tender/exchange) Exchanged $29.2 MM of principal amount in Old Notes due 2026 for 5.0% convertible notes due 2029 (“New Notes”) $80.8 MM of principal amount in Old Notes remains outstanding – first put date: 11/2011 Development joint ventures: In 3Q09 extended for up to 2 yrs. $80 MM of development JV loans, invested $19 MM in preferred equity to pay down principal on loans, and negotiated dollar for dollar reductions in guarantees on certain projects Currently negotiating extensions for development joint venture loans scheduled to mature in 2010 Minimal near term construction funding required as early projects successfully operating & later projects delayed |
|
|
CONSOLIDATED DEBT MATURITIES $175.3 $270.0 Since year end 2009, IRC has renewed credit facilities totaling $300 MM, retired/refinanced $124.5 MM of secured debt maturities and closed $52.1 MM in new/refinanced mortgage loans. Notes: Data current as of 9/7/10. Secured debt includes principal amortization through maturity. (1) 2011 maturities currently include $80.8 MM of convertible notes at first put date in November 2011. (2) $150 MM line of credit facility and $150 MM term loan (totalling $300 MM) were renewed June 2010 for a 3-year term. $102.6 CONSOLIDATED DEBT BY YEAR 2010-2018 ($ in millions) Secured Debt Term Loan Convertible Notes Line of Credit $174.2 $29.3 $94.5 $90.0 $145.0 $31.9 $150.0 $80.8 $29.2 $120.0 $0 $50 $100 $150 $200 $250 $300 2010 2011 (1) 2012 2013 (2) 2014 Thereafter $0.0 $29.3 $30.7 $33.2 $8.8 $21.8 $80.8 $0 $50 $100 $150 $200 $250 $300 3Q10 4Q10 1Q11 2Q11 3Q11 4Q11 (1) |
|
|
JOINT VENTURE STRATEGIES Diversify Capital Resources + Expand Platform + Drive Future Growth Asset Management and Asset Based Joint Venture Strategies Retail Focus → IRC Knowledge High Quality Partners → ‘Union of Expertise’ Long-term Asset Management Role Value-enhancing |
|
|
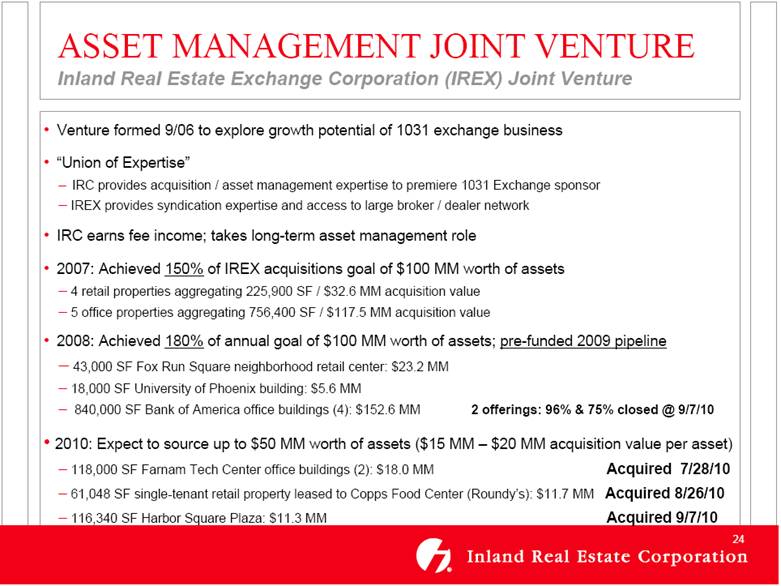
ASSET MANAGEMENT JOINT VENTURE Inland Real Estate Exchange Corporation (IREX) Joint Venture Venture formed 9/06 to explore growth potential of 1031 exchange business “Union of Expertise” IRC provides acquisition / asset management expertise to premiere 1031 Exchange sponsor IREX provides syndication expertise and access to large broker / dealer network IRC earns fee income; takes long-term asset management role 2007: Achieved 150% of IREX acquisitions goal of $100 MM worth of assets 4 retail properties aggregating 225,900 SF / $32.6 MM acquisition value 5 office properties aggregating 756,400 SF / $117.5 MM acquisition value 2008: Achieved 180% of annual goal of $100 MM worth of assets; pre-funded 2009 pipeline 43,000 SF Fox Run Square neighborhood retail center: $23.2 MM 18,000 SF University of Phoenix building: $5.6 MM 840,000 SF Bank of America office buildings (4): $152.6 MM 2 offerings: 96% & 75% closed @ 9/7/10 2010: Expect to source up to $50 MM worth of assets ($15 MM – $20 MM acquisition value per asset) 118,000 SF Farnam Tech Center office buildings (2): $18.0 MM Acquired 7/28/10 61,048 SF single-tenant retail property leased to Copps Food Center (Roundy’s): $11.7 MM Acquired 8/26/10 116,340 SF Harbor Square Plaza: $11.3 MM Acquired 9/7/10 |
|
|
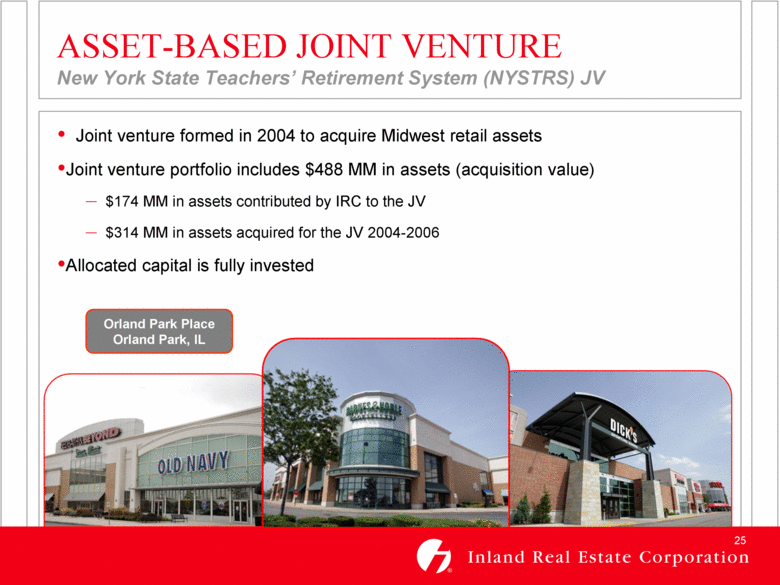
ASSET-BASED JOINT VENTURE New York State Teachers’ Retirement System (NYSTRS) JV Joint venture formed in 2004 to acquire Midwest retail assets Joint venture portfolio includes $488 MM in assets (acquisition value) $174 MM in assets contributed by IRC to the JV $314 MM in assets acquired for the JV 2004-2006 Allocated capital is fully invested Orland Park Place Orland Park, IL |
|
|
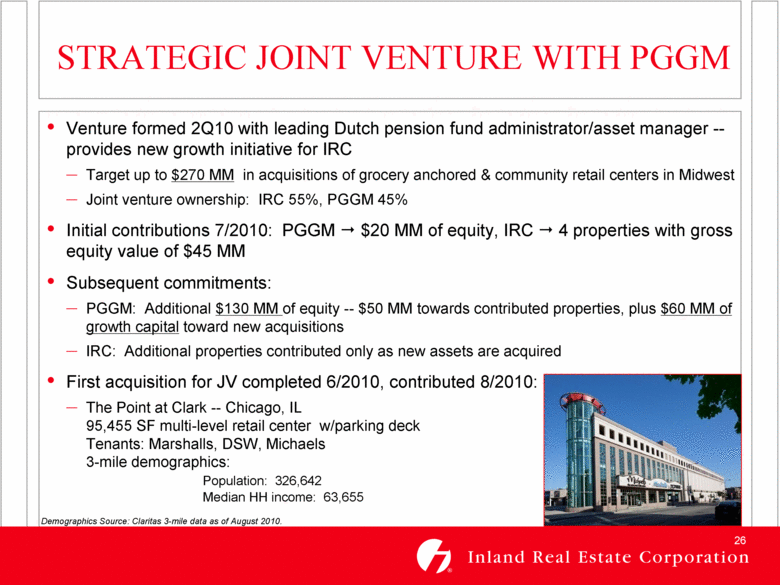
STRATEGIC JOINT VENTURE WITH PGGM Venture formed 2010 with leading Dutch pension fund administrator/asset manager -- provides new growth initiative for IRC Target up to $270 MM in acquisitions of grocery anchored & community retail centers in Midwest Joint venture ownership: IRC 55%, PGGM 45% Initial contributions 7/2010: PGGM $20 MM of equity, IRC 4 properties with gross equity value of $45 MM Subsequent commitments: PGGM: Additional $130 MM of equity -- $50 MM towards contributed properties, plus $60 MM of growth capital toward new acquisitions IRC: Additional properties contributed only as new assets are acquired First acquisition for JV completed 6/2010, contributed 8/2010: The Point at Clark -- Chicago, IL 95,455 SF multi-level retail center w/parking deck Tenants: Marshalls, DSW, Michaels 3-mile demographics: Population: 326,642 Median HH income: 63,655 Demographics Source: Claritas 3-mile data as of August 2010. |
|
|
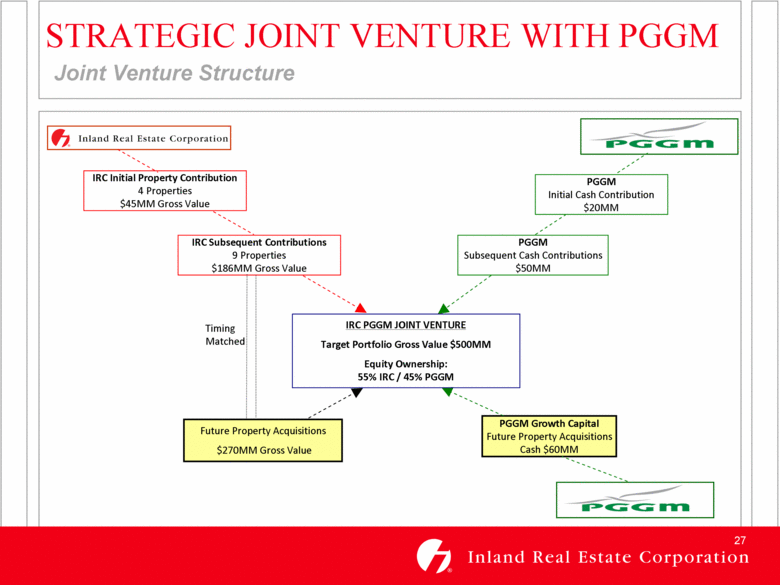
STRATEGIC JOINT VENTURE WITH PGGM Joint Venture Structure IRC Subsequent Contributions 9 Properties $186MM Gross Value PGGM Subsequent Cash Contributions $50MM PGGM Growth Capital Future Property Acquisitions Cash $60MM Future Property Acquisitions $270MM Gross Value IRC PGGM JOINT VENTURE Target Portfolio Gross Value $500MM Equity Ownership: 55% IRC / 45% PGGM Timing Matched IRC Initial Property Contribution 4 Properties $45MM Gross Value PGGM Initial Cash Contribution $20MM |
|
|
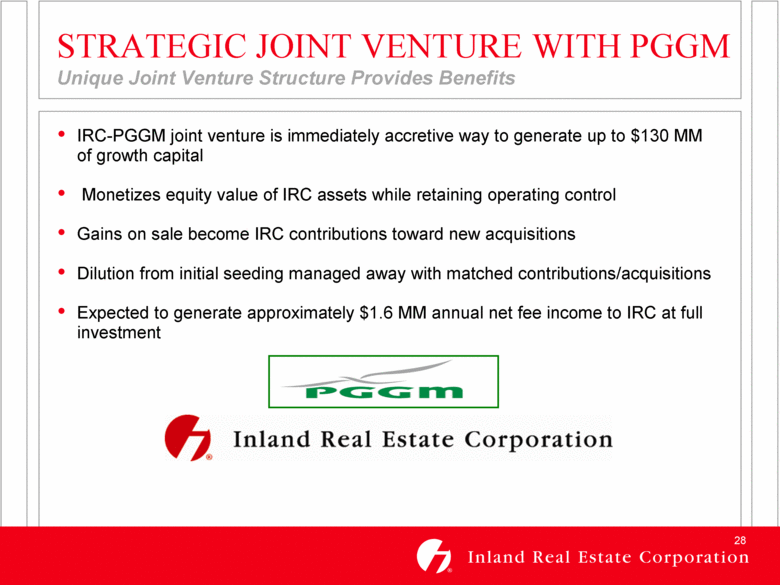
STRATEGIC JOINT VENTURE WITH PGGM Unique Joint Venture Structure Provides Benefits IRC-PGGM joint venture is immediately accretive way to generate up to $130 MM of growth capital Monetizes equity value of IRC assets while retaining operating control Gains on sale become IRC contributions toward new acquisitions Dilution from initial seeding managed away with matched contributions/acquisitions Expected to generate approximately $1.6 MM annual net fee income to IRC at full investment |
|
|
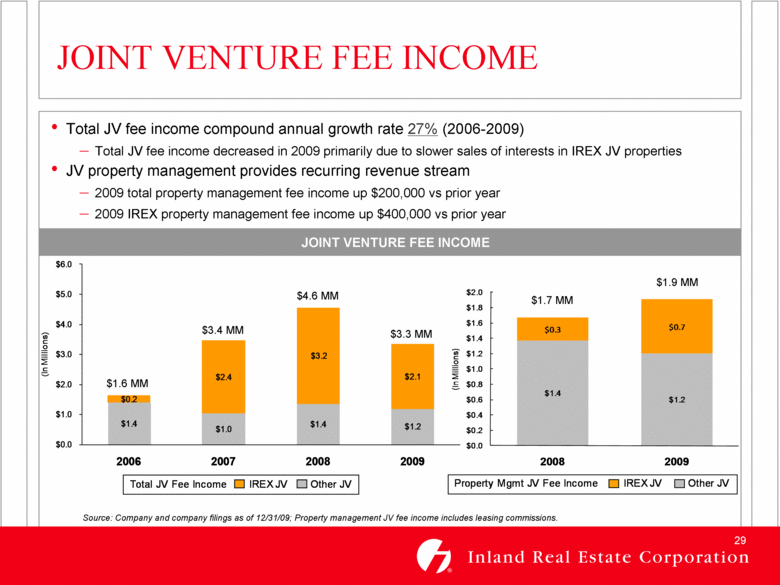
JOINT VENTURE FEE INCOME JOINT VENTURE FEE INCOME $1.6 MM $3.4 MM $4.6 MM Total JV fee income compound annual growth rate 27% (2006-2009) Total JV fee income decreased in 2009 primarily due to slower sales of interests in IREX JV properties JV property management provides recurring revenue stream 2009 total property management fee income up $200,000 vs prior year 2009 IREX property management fee income up $400,000 vs prior year Source: Company and company filings as of 12/31/09; Property management JV fee income includes leasing commissions. $1.7 MM $1.9 MM $3.3 MM $1.4 $1.0 $1.4 $1.2 $0.2 $2.4 $3.2 $2.1 $0.0 $1.0 $2.0 $3.0 $4.0 $5.0 $6.0 2006 2007 2008 2009 ( I n M i l l i o n s ) Total JV Fee Income IREX JV Other JV $1.4 $1.2 $0.3 $0.7 $0.0 $0.2 $0.4 $0.6 $0.8 $1.0 $1.2 $1.4 $1.6 $1.8 $2.0 2008 2009 ( I n M i l l i o n s ) Property Mgmt JV Fee Income IREX JV Other JV |
|
|
IRC is well positioned to weather current economic and credit market conditions Necessity and value-based retail in high barrier to entry markets should outperform other retail real estate Consolidated debt to gross properties is 54% vs. peer average of 55% (1) IRC is building a solid foundation for future growth Re-tenanting centers impacted by big-box vacancies with high credit quality, best-in-class retailers that drive additional traffic, attract other retailers and strengthen our centers Developments are flexible and have the potential to add growth Senior management team has experience successfully managing through economic downturns Senior management averages 20+ years real estate experience Independent board members include two well-respected former CEOs of public shopping center companies IRC is executing a capital plan that will further strengthen its balance sheet Working with strong banking relationships to refinance upcoming maturities SNL-provided ratios are based on 2Q10 results. Peer group includes: CDR, DDR, EQY, FRT, KIM, KRG, REG, RPT and WRI. SUMMARY |
|
|
FORWARD-LOOKING STATEMENTS Certain statements in this presentation constitute "forward-looking statements" within the meaning of the Federal Private Securities Litigation Reform Act of 1995. These forward-looking statements are not historical facts but are the intent, belief or current expectations of our management based on their knowledge and understanding of the business and industry, the economy and other future conditions. These statements are not guarantees of future performance, and investors should not place undue reliance on forward-looking statements. Actual results may differ materially from those expressed or forecasted in the forward-looking statements due to a variety of risks, uncertainties and other factors, including but not limited to the factors listed and described under “Risk Factors” in our Annual Report on Form 10-K for the year ended December 31, 2009, as may be updated or supplemented by our Form 10-Q filings. These factors include, but are not limited to: market and economic challenges experienced by the U.S. economy or real estate industry as a whole, including dislocations and liquidity disruptions in the credit markets; the inability of tenants to continue paying their rent obligations due to bankruptcy, insolvency or a general downturn in their business; competition for real estate assets and tenants; impairment charges; the availability of cash flow from operating activities for distributions and capital expenditures; our ability to refinance maturing debt or to obtain new financing on attractive terms; future increases in interest rates; actions or failures by our joint venture partners, including development partners; and other factors that could affect our ability to qualify as a real estate investment trust. We undertake no obligation to update or revise forward-looking statements to reflect changed assumptions, the occurrence of unanticipated events or changes to future operating results. |


