Attached files
| file | filename |
|---|---|
| 8-K - CURRENT REPORT - FIFTH THIRD BANCORP | d8k.htm |
 Fifth Third Bank | All Rights Reserved
Exhibit 99.1
Investor Update
September 15, 2010
Please refer to earnings release dated July 22, 2010 and 10-Q dated
August 9, 2010 for further information, including full results reported on a U.S.
GAAP basis |
 2
Fifth Third Bank | All Rights Reserved
2Q10 in review
Significant improvement in credit trends
•
Net charge-offs declined 25% sequentially (lowest level since
2Q08)
–
At $434M, down 43% from $756M peak
•
Nonperforming assets declined 5% and nonperforming loans
declined 8% sequentially (lowest levels since the first half of
2009)
–
Total delinquencies declined 17% sequentially (lowest
level since 2Q07)
•
Loan loss allowance of 4.85%, 146% of nonperforming loans and
leases and more than two times annualized 2Q10 net charge-offs
•
Realized credit losses have been significantly below SCAP
scenarios
Actions driving progress
•
Focusing on credit quality, portfolio management and loss
mitigation strategies
•
Executing on customer satisfaction initiatives and improving
customer loyalty
•
Enhancing breadth and profitability of offerings and
relationships
•
Becoming an employer of choice in the industry by continuing to
enhance employee engagement
Continued strong operating results
•
Net income of $192 million versus 1Q10 net loss of $10 million
•
Pre-provision net revenue of $567 million consistent with 1Q10
•
Average core deposits up $582 million, or 1% sequentially;
Average transaction deposits up $1.3 billion, or 2% sequentially
•
Strong capital ratios: Tier 1 common 7.2%, Leverage ratio 12.2%,
Tier 1 ratio 13.7%, Total capital ratio 18.0%
•
Extended $20 billion of new and renewed credit |
   3
Fifth Third Bank | All Rights Reserved
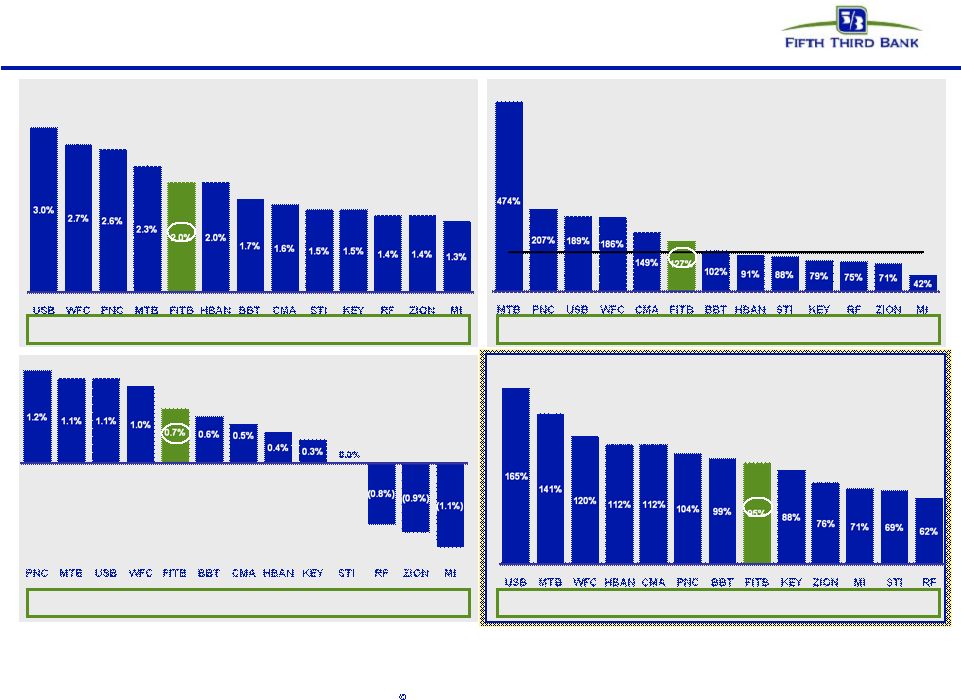
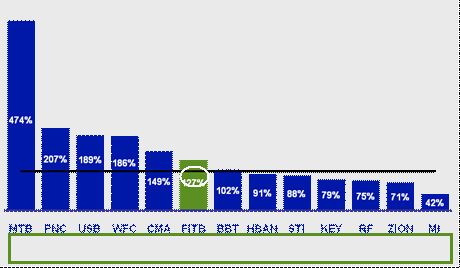
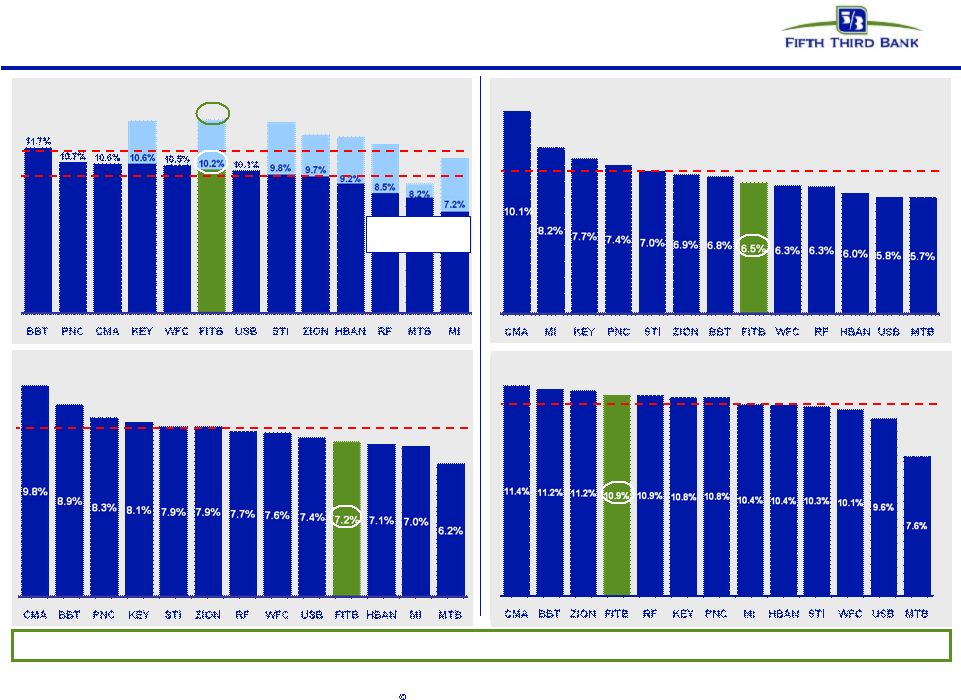
Strong profitability results
Strong profitability results
Core PPNR / Average assets (Annualized)
Core PPNR / NCOs
Price to Book Value
Strong relative profitability not yet reflected in valuation.
Source: SNL Financial and company reports. Data as of 2Q10. Price to Book as of
9/9/10. * Core pre-tax pre-provision earnings excludes the following
items: securities gains/losses, gains/losses from debt extinguishments, leveraged lease gains/losses, gains
from asset sales, and other non-recurring items.
ROAA
…driving above average profitability.
…more than sufficient to absorb credit losses…
Strong pre-provision profitability… |
 4
Fifth Third Bank | All Rights Reserved
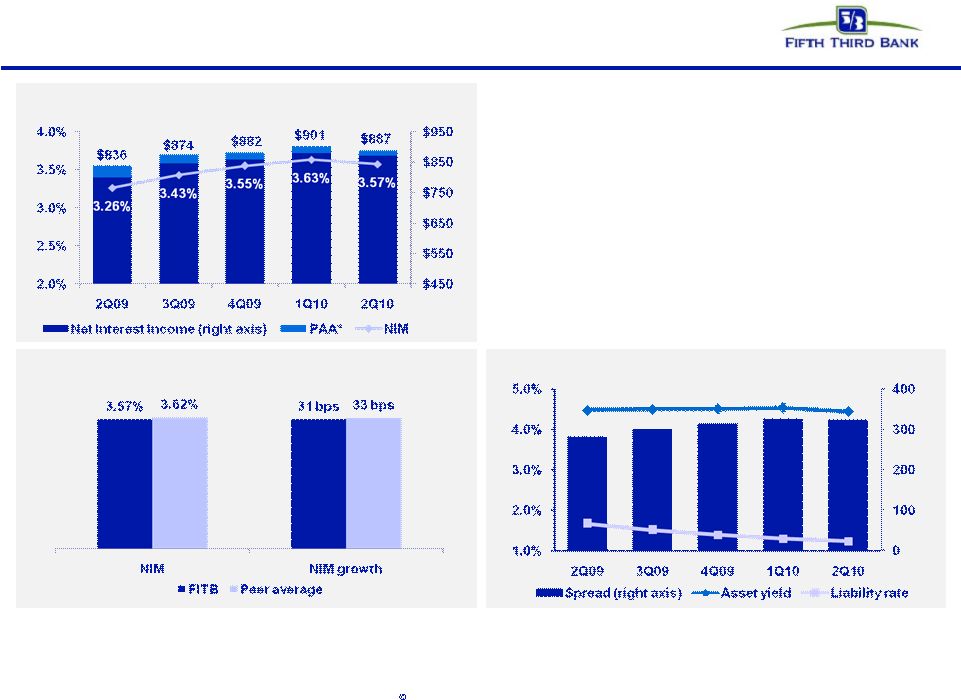
Net interest income
NII and NIM (FTE)
•
Sequential trends in net interest income and
net interest margin reflect weak loan demand
and impact of excess liquidity held in cash
equivalents
–
NII down $14M and NIM down 6 bps in
2Q10 over prior quarter
•
Expect improved NII and NIM in 3Q10 from
CD maturities, stable loan spreads, and
public funds deposit runoff
(bps)
Reported NIM and YOY growth versus peers
Peers include: BBT, CMA, HBAN, KEY, MI, MTB, PNC, RF, STI, USB, WFC, ZION
Source: SNL Financial and company reports
*
Reflects purchase accounting adjustments from the First Charter acquisition of
$37M, $29M, $25M, $21M, and $17M in 2Q09, 3Q09, 4Q09, 1Q10, and 2Q10, respectively.
** Excludes purchase accounting adjustments
Yields and rates**
($Ms) |
 5
Fifth Third Bank | All Rights Reserved
Balance sheet:
Continued growth in core funding
•
CRE loans down 4% sequentially and 14% from the previous year
•
C&I loans were flat sequentially and down 7% from the previous year largely
due to customer pay-downs and deleveraging despite strong
originations –
C&I balance trends more positive thus far in 3Q10
•
Consumer loans down 2% sequentially and 1% from the previous year
–
3Q10 balances likely to increase due to retention of higher quality,
shorter term mortgages
•
Currently expect period end loans to be flat to up modestly in 3Q10
•
Loan to core deposit ratio of 100%, down from 119% in 2Q09
•
Everyday Great Rates strategy continues to drive core deposit growth
–
DDAs
up 3% sequentially and 16% year-over-year
–
Retail transaction deposits up 5% sequentially and 12% from 2Q09
–
Commercial transaction deposits down 2% from 1Q10, up 41% from 2Q09
•
Expect modest period end core deposit growth in 3Q10, despite public
funds and CD runoff
Average loan growth ($B)^
Average core deposit growth ($B)
82
80
78
78
69
70
72
76
Average wholesale funding ($B)
31
26
20
22
•
Reduced
wholesale
funding
by
$1.2
billion
sequentially
and
$12.4
billion
from
the
previous
year
–
Non-core deposits down 10% sequentially and 45% from the previous year
–
Short term borrowings up 4% sequentially and down 80% from the
previous year
–
Long-term debt down 5% sequentially and 2% from the previous year
^ Excludes loans held-for-sale
Note: Numbers may not sum due to rounding
77
77
19 |
 6
Fifth Third Bank | All Rights Reserved
Stable income and expense in difficult environment
Core fee income ($M)
Core expenses ($M)
•
Core noninterest income of $601M declined $23M, or 4%, compared with
prior quarter, impacted by lower mortgage banking net revenue
•
Sequential strength in card and processing revenue (+15%), corporate
banking revenue (+14%), and deposit service charges (+5%)
•
Credit-related costs affected fee income by $14M in 2Q10 compared with
$1M in 1Q10 and $8M in 2Q09
•
3Q mortgage revenue results likely to be stronger than originally
expected, reflecting continued strong originations and current MSR
hedge gain positions
•
Reg
E impact tracking to be in-line or modestly better than initial $80
million annualized estimate (unmitigated)
•
3Q10 pretax gain on BOLI settlement of $125 million (net of expenses)
•
Expense trends reflect elevated credit costs, higher compensation due
to increased production levels, and investment in sales force expansion
•
Core efficiency ratio of 62.6% in 2Q10, compared with 62.4% in 1Q10 and
61.6% in 2Q09
•
Credit-related costs affected noninterest expenses by $55M in 2Q10
($91M in 1Q10 and $57M in 2Q09)
•
Total expense related to mortgage repurchases ~$18M in 2Q10
compared with $39M in 1Q10 and $10M in 2Q09
–
Mortgage repurchase expense expected to increase in 3Q10;
increased claims, file requests and losses likely to result in higher
modeled 3Q mortgage repurchase reserves
* Refer to slide 20 for itemized effects of non-core fees and expenses
|
 7
Fifth Third Bank | All Rights Reserved
Strong credit metrics compared with peers
Source: SNL Financial and company reports. Data as of 2Q10.
HFI NPA Ratio
Peer average: 2.5%
Peer average: 4.0%
Net Charge-off Ratio (Annualized)
“Texas Ratio”
(HFI NPAs + Over 90s) / (Reserves + TCE)
HFI NPAs + Over 90s -
Reserves / TCE
Peer average: 11%
FITB credit metrics lower than peer average and represent position of relative
strength |
 8
Fifth Third Bank | All Rights Reserved
Recent credit trends better than peers
Source: SNL and company reports. NPA and NCO ratios exclude loans
held-for-sale and covered assets for peers where appropriate. * 4Q08
net charge-offs included $800M in NCOs related to commercial losses moved to held-for-sale
FITB
credit
metrics
were
higher
than
peers
but
are
now
generally
better
than
peers
NPA ratio vs. peers
Net charge-off ratio vs. peers*
Loans over 90 days delinquent % vs. peers
Loans 30-89 days delinquent % vs. peers
(7.5%)
(HFS transfer) |
 9
Fifth Third Bank | All Rights Reserved
Non-performing loans
Non-performing loans ($M)
$2.6B
$2.9B
$2.9B
$2.7B
Non-performing loans improving with lower
severity mix
$2.5B
Non-performing loan inflows have been lower than peers since early 2009.
FITB NPL inflows (relative to loans) vs. Peers
FITB
Source: SNL Financial
Peers include: BAC, BBT, C, CMA, HBAN, JPM, KEY, MI, MTB, PNC, RF, STI, USB, and
WFC New non-performing loan flows ($M)
NPL flows have declined significantly |
 10
Fifth Third Bank | All Rights Reserved
Strong reserve position
Source: SNL Financial and company reports. NPAs/NPLs exclude held-for-sale
portion for all banks and covered assets for BBT, USB, and ZION. Coverage
ratios are strong relative to peers Industry leading reserve level
1.
FITB
4.85%
2.
KEY
4.16%
3.
ZION
4.11%
4.
HBAN
3.79%
5.
RF
3.71%
6.
MI
3.69%
7.
PNC
3.46%
8.
WFC
3.21%
9.
USB
2.83%
10.
STI
2.79%
11.
BBT
2.66%
12.
CMA
2.38%
13.
MTB
1.77%
Peer Average
3.21%
Reserves / Loans |
 11
Fifth Third Bank | All Rights Reserved
Robust capital position
Source: SNL Financial and company reports.
Strong capital ratios relative to peers, particularly considering reserve
levels Peer average w/
TARP: 11.5%
Peer average
w/o TARP: 9.7%
Tier 1 capital ratio (with and without TARP)
9.2%
11.0%
13.5%
12.6%
12.5%
13.6%
13.7%
12.0%
Tangible common equity ratio
Peer average: 7.0%
Tier 1 common ratio
Peer average: 7.8%
(Tier 1 common + reserves) / RWA
Peer average: 10.4% |
 12
Fifth Third Bank | All Rights Reserved
Strong liquidity profile
Retail Brokered CD maturities: $328M in 2010; $31M in 2011
FHLB borrowings $2.6B
6/30 unused avail. capacity $22B ($18.1B in Fed and $3.6B in FHLB)
Holding Company cash at 6/30/10: $1.4B
—
Total Fed deposits ~$4.0B
Expected cash obligations over the next 12 months (assuming no
TARP repayment)
—
$0 debt maturities
—
~$39M common dividends
—
~$205M preferred dividends (~$35M Series G, ~$170M TARP)
—
~$281M interest and other expenses
Cash currently sufficient to more than satisfy all fixed obligations*
over the next
24 months without accessing capital
markets/subsidiary dividends
Bank
unsecured
debt
maturities
($M
–
excl.
Brokered
CDs)
Heavily core funded
Holding company unsecured debt maturities ($M)
* Debt maturities, common and preferred dividends, interest and other expenses
|
 13
Fifth Third Bank | All Rights Reserved
Liquidity management
Over
the
past
two
years,
Fifth
Third
has
taken
a
number
of
steps
to
strengthen
the
overall
liquidity
position
of
the
bank
and
to
strengthen
overall
liquidity
risk
management.
These
items
include:
—
A shift to a more core-funded balance sheet, with a focus on relationship
deposits —
Decreased reliance on unsecured short-term funding and less stable funding
sources —
Increased efficiency in mobilizing assets for funding and contingent liquidity
purposes –
Better
recognition
of
the
liquidity
value
of
various
assets,
and
the
ease
with
which
those
assets
can
be
utilized
for
funding
—
The implementation of additional liquidity metrics to enhance liquidity and funding
management Liquidity measures are significantly improved relative to
pre-crisis levels: Liquidity Comparison
June 30th, 2008
June 30th, 2010
Total Wholesale Funding Portfolio
$28 Billion
$11 Billion
% Maturing within 1 Year
61%
3%
Total FHLB Borrowings
$6 Billion
$3 Billion
Brokered CDs
$6 Billion
$358 Million
Overnight Borrowings
$3 Billion
$0
Total Secured Borrowing Capacity
$13 Billion
$24 Billion
Non-Core Funding / Total Assets
32%
17%
Net Loans & Leases / Core Deposits
133%
102%
Core Deposits
$64 Billion
$76 Billion
Fifth
Third
will
continue
to
focus
on
core
funding,
asset
liquidity,
and
contingent
funding
sources,
while
maintaining
a
low
reliance
on
unsecured
short-term
funding
and
more
volatile
funding
sources. |
 14
Fifth Third Bank | All Rights Reserved
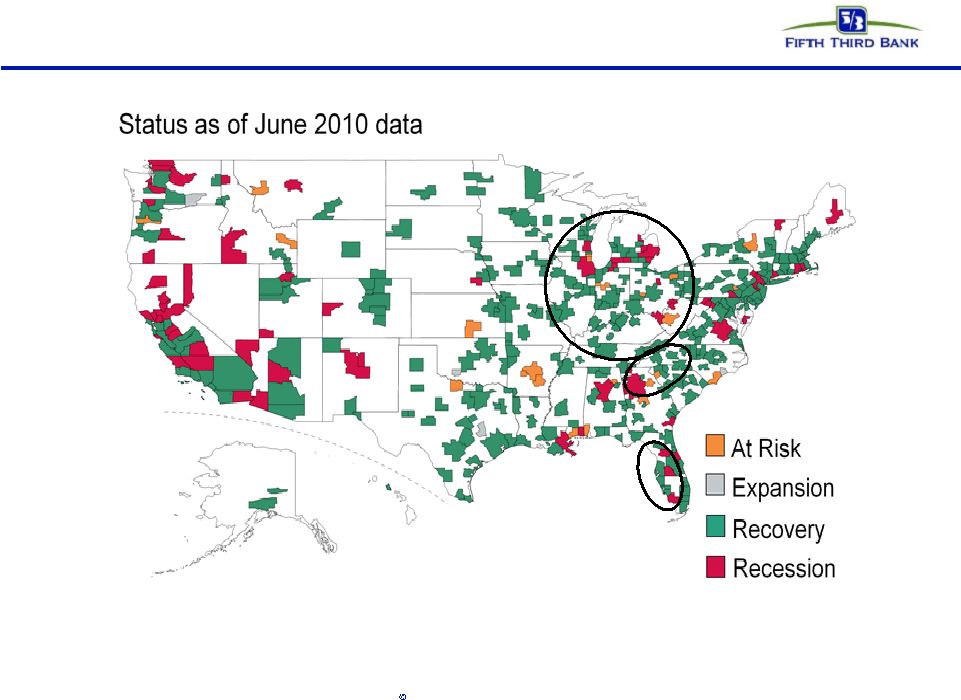
Majority of footprint beginning to recover
(Early cycle impact; strong industrial base)
Source: Map from Moody’s Analytics, deposit market share data from SNL Financial and FDIC
Categories based on Moody’s Analytics’ Adversity Index, which is a composite index of
unemployment, industrial production, home prices and housing starts. Declining
values lead to labeling as Recession, rising indicators are labeled as Recovery, rising indicators past previous growth
peaks are labeled as Expansion, and mixed indicators are labeled as At Risk
|
 15
Fifth Third Bank | All Rights Reserved
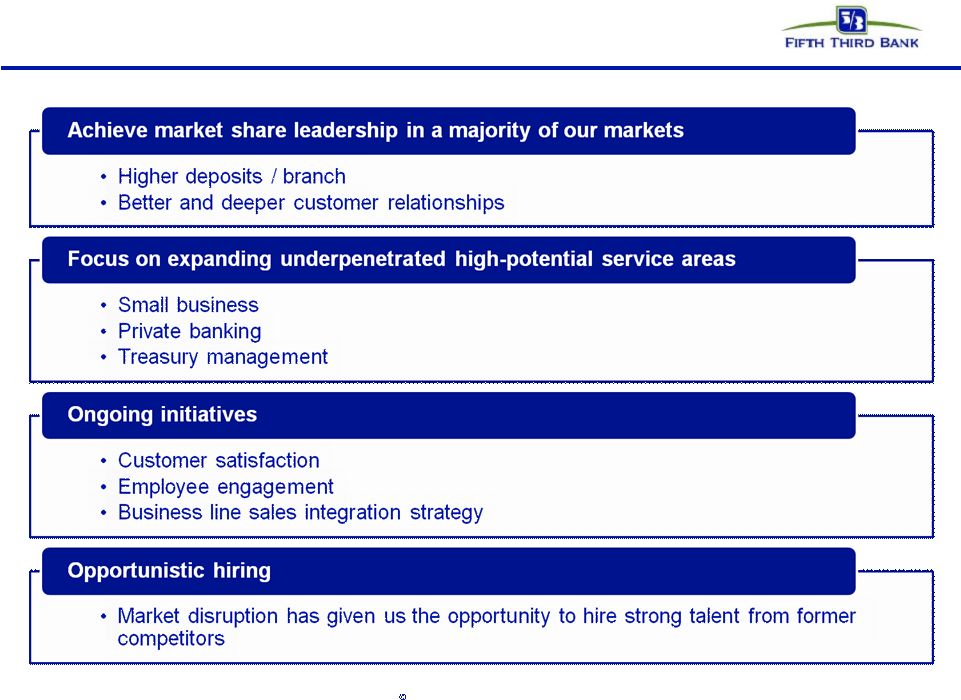
Continuing to invest for the future |
 16
Fifth Third Bank | All Rights Reserved
Well-positioned for changed financial landscape
Fifth Third’s business model is driven by traditional banking activities
—
Making loans, taking deposits, treasury management
—
Largest bank headquartered within core Midwest footprint
No significant business at Fifth Third impaired during crisis; core business
activities not generally limited by financial reform
—
Didn’t/don’t originate/sell CDOs
—
Didn’t/don’t originate/sell subprime mortgages or Option ARMs
—
De minimis market making in derivatives
—
De minimis proprietary trading
—
Small private equity portfolio <$100M (holding company subsidiary)
—
Low level of financial system “interconnectedness”
(e.g., Fifth Third loss in Lehman
bankruptcy should be less than $2 million)
—
Daily VaR less than $500 thousand
While financial reform will be costly, expect financial reform to create new
opportunities for banking industry through re-intermediation
Expect to continue capitalizing on strong competitive position
as the landscape evolves further toward Fifth Third’s traditional
strengths |
 17
Fifth Third Bank | All Rights Reserved
Peer performance summary –
YoY
Comparison
Continued relative outperformance on key value drivers
FITB
2Q10
Regional
bank peer
average
(1)
2Q10
Performance
vs. peers
Core pre-tax pre-provision earnings* /
average assets (annualized)
2.0%
1.9%
Better
Average core deposits growth
+12%
+7%
Better
Net charge-off ratio /
(bps)
2.26% (-82)
2.50% (-3)
Better
NPA ratio* /
(bps)
3.87% (+39)
4.01% (+50)
Better
Operating efficiency ratio*
63%
64%
Better
Average loan growth*
-6%
-7%
Better
Net interest margin /
(bps)
3.57% (+31)
3.62% (+33)
In-line
Source: SNL Financial and company reports.
(1)
Regional bank peer average consists of BBT, CMA, HBAN, KEY, MTB, MI, PNC, RF, STI, USB, WFC, and ZION.
*
Operating fee growth, core pre-tax pre-provision earnings, and operating efficiency ratio
exclude the following items: securities gains/losses, gains/losses from debt extinguishments,
leveraged lease gains/losses, gains from asset sales, goodwill impairment charges, FDIC special assessment, the pro forma effect of the 2Q09
processing business sale, and other non-recurring items. Average loans include only loans
held-for-investment. NPAs exclude loans held-for-sale and covered assets. |
 18
Fifth Third Bank | All Rights Reserved
Cautionary statement
This report may contain statements that we believe are “forward-looking statements”
within the meaning of Section 27A of the Securities Act of 1933, as amended, and Rule 175
promulgated thereunder, and Section 21E of the Securities Exchange Act of 1934, as amended, and
Rule 3b-6 promulgated thereunder. These statements relate to our financial condition, results of
operations, plans, objectives, future performance or business. They usually can be identified
by the use of forward-looking language such as “will likely result,” “may,” “are
expected to,” “is anticipated,” “estimate,” “forecast,”
“projected,” “intends to,” or may include other similar words or phrases such as
“believes,” “plans,” “trend,” “objective,”
“continue,” “remain,” or similar expressions, or future or conditional verbs such as “will,” “would,”
“should,” “could,” “might,” “can,” or similar verbs. You
should not place undue reliance on these statements, as they are subject to risks and
uncertainties, including but not limited to the risk factors set forth in our most recent Annual
Report on Form 10-K and our most recent quarterly report on Form 10-Q. When considering
these forward-looking statements, you should keep in mind these risks and uncertainties, as
well as any cautionary statements we may make. Moreover, you should treat these statements as speaking only as of the date they are
made and based only on information then actually known to us.
There are a number of important factors that could cause future results to differ materially from
historical performance and these forward- looking statements. Factors that might cause such
a difference include, but are not limited to: (1) general economic conditions and weakening in
the economy, specifically the real estate market, either nationally or in the states in which Fifth Third, one or more acquired
entities and/or the combined company do business, are less favorable than expected; (2) deteriorating
credit quality; (3) political developments, wars or other hostilities may disrupt or increase
volatility in securities markets or other economic conditions; (4) changes in the interest rate
environment reduce interest margins; (5) prepayment speeds, loan origination and sale volumes, charge-offs and loan loss
provisions; (6) Fifth Third’s ability to maintain required capital levels and adequate sources of
funding and liquidity; (7) maintaining capital requirements may limit Fifth Third’s
operations and potential growth; (8) changes and trends in capital markets; (9) problems encountered by
larger or similar financial institutions may adversely affect the banking industry and/or Fifth Third
(10) competitive pressures among depository institutions increase significantly; (11) effects
of critical accounting policies and judgments; (12) changes in accounting policies or
procedures as may be required by the Financial Accounting Standards Board (FASB) or other regulatory
agencies; (13) legislative or regulatory changes or actions, or significant litigation,
adversely affect Fifth Third, one or more acquired entities and/or the combined company or the
businesses in which Fifth Third, one or more acquired entities and/or the combined company are engaged; (14) ability to
maintain favorable ratings from rating agencies; (15) fluctuation of Fifth Third’s stock price;
(16) ability to attract and retain key personnel; (17) ability to receive dividends from its
subsidiaries; (18) potentially dilutive effect of future acquisitions on current shareholders’ ownership
of Fifth Third; (19) effects of accounting or financial results of one or more acquired entities; (20)
difficulties in separating Fifth Third Processing Solutions from Fifth Third; (21) loss of
income from any sale or potential sale of businesses that could have an adverse effect on Fifth
Third’s earnings and future growth; (22) ability to secure confidential information through the use of computer systems and
telecommunications networks; and (23) the impact of reputational risk created by these developments on
such matters as business generation and retention, funding and liquidity.
You should refer to our periodic and current reports filed with the Securities and Exchange
Commission, or “SEC,” for further information on other factors, which could cause
actual results to be significantly different from those expressed or implied by these forward-looking
statements.
|
 19
Fifth Third Bank | All Rights Reserved
Liability mix and pricing discipline drive
strong net interest income/NIM results
•
Strong, deposit rich core funding mix
supports relatively low cost of funds
–
Low reliance on wholesale funding
•
Continued pricing discipline on
commercial loans, consistent with market
trends toward better risk-adjusted spreads
–
C&I spreads over 1-month LIBOR
have increased more than 150 bps in
the past two years
Source: SNL Financial and company reports.
Deposits / Assets
C&I Spread to 1-month LIBOR
2Q10 Cost of Funds Peer Comparison
Peer average 1.06%
Peer average 69% |
 20
Fifth Third Bank | All Rights Reserved
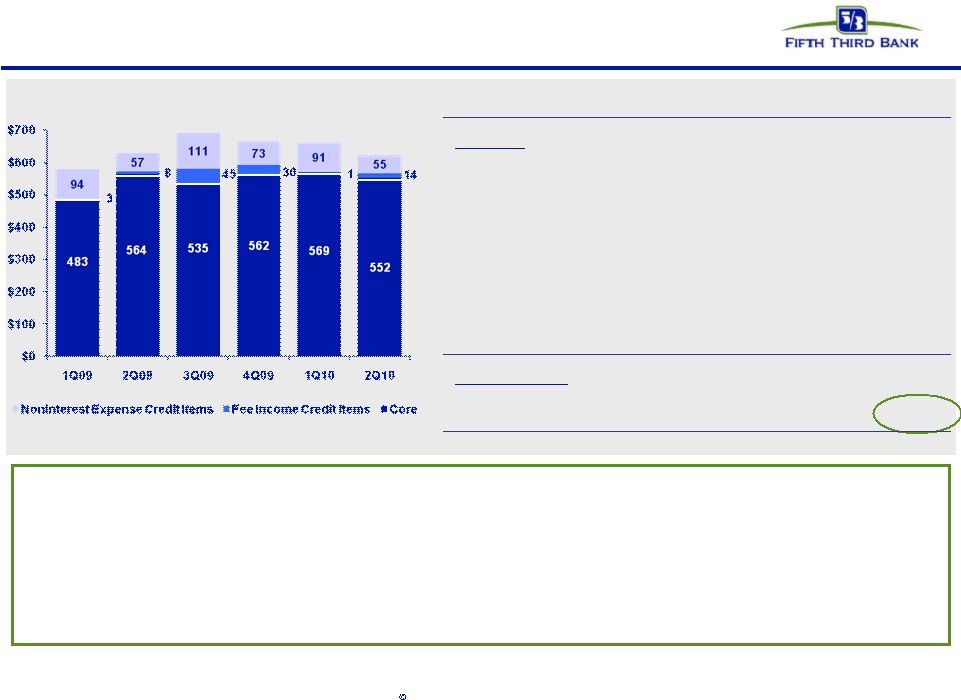
Pre-tax pre-provision earnings
•
Reported PPNR of $567M consistent with strong 1Q10 levels, reflecting fee income
results and lower expenses, partially offset by lower net interest
income •
Core PPNR of $552M, due to negative adjustments totaling $15M, resulting in
sequential and year-over-year declines of 3% and 2%,
respectively •
Excluding the impact of credit-related adjustments ($69M in 2Q10), PPNR down 6%
versus 1Q10; down 2% versus 2Q09
Core PPNR
Core PPNR reconciliation
* Pre-provision net revenue (PPNR): net interest income plus noninterest income
minus noninterest expense 1Q09
2Q09
3Q09
4Q09
1Q10
2Q10
Reported PPNR
$511
$2,393
$844
$562
$568
$567
Adjustments:
Gain on sale of Visa shares
-
-
(244)
-
-
-
BOLI charge
54
-
-
-
-
-
Gain from sale of processing interest
-
(1,764)
6
-
-
-
Divested merchant and EFT revenue
(155)
(169)
-
-
-
-
Class B Visa swap fair value adjustment
-
-
-
-
9
-
Securities gains/losses
24
(5)
(8)
(2)
(14)
(8)
Visa litigation reserve expense
-
-
(73)
-
-
-
Other litigation reserve expense
-
-
-
22
4
3
FTPS warrants and puts
-
-
-
(20)
2
(10)
Seasonal pension expense
-
-
10
-
-
-
FDIC special assessment
-
55
-
-
-
-
Divested merchant & EFT expense
(est.)
49
54
-
-
-
-
Core PPNR
$483
$564
$535
$562
$569
$552
Credit Related Items:
OREO write-downs, FV adjs, & G/L on
loan sales
3
8
45
30
1
14
Problem asset work-out expenses
94
57
111
73
91
55
Credit adjusted PPNR
$580
$630
$690
$665
$661
$621 |
 21
Fifth Third Bank | All Rights Reserved
Manageable commercial real estate exposure
CRE / Assets
Source: SNL Financial and company reports.
CRE / (TCE + Reserves)
Peer average: 256%
Peer average: 22%
CRE
exposure
lower
than
peer
average;
problems
relatively
more
manageable
given
capital
and
reserves |
 22
Fifth Third Bank | All Rights Reserved
Troubled debt restructurings (TDR) overview
Successive improvement in vintage performance during 2008
and 2009, even as volume of modification increased
Fifth
Third’s
mortgage
portfolio
TDRs
have
redefaulted
at
a
lower rate than other bank held portfolio modifications
—
Fifth Third’s TDRs
are about a third less likely to
redefault
than modifications on GSE mortgages
Of $1.8B in consumer TDRs, over $1.6B were on accrual
status and $246M were nonaccruals
—
$1.0B
of
TDRs
are
current
and
have
been
on
the
books
6
or
more
months;
within
that,
$600M
of
TDRs
are
current and have been on the books for more than a
year
TDR default propensity declines significantly with seasonality
—
We do not typically see significant defaults on current
loans once a vintage approaches 12 months since
modification
TDR performance has improved in newer vintages
Outperforming redefault
benchmarks
Source: Fifth Third and OCC/OTS data; data through 4Q09; industry data
cumulative through 4Q09 Mortgage TDR 60+ redefault
trend by vintage
1Q08 $69M
2Q08 $135M
3Q08 $146M
4Q08 $176M
1Q09 $221M
2Q09 $257M
Months since modification
Mortgage TDR 60+ redefault
rate: Fifth Third comparison
(through December 2009)
Fannie Mae
Industry
portfolio loans
Fifth Third
Volume by
vintage
Freddie Mac
3Q09 $386M
Current consumer TDRs
($Ms)
4Q09 $153M
$1.0
billion
2008
2009
Time since restructuring |
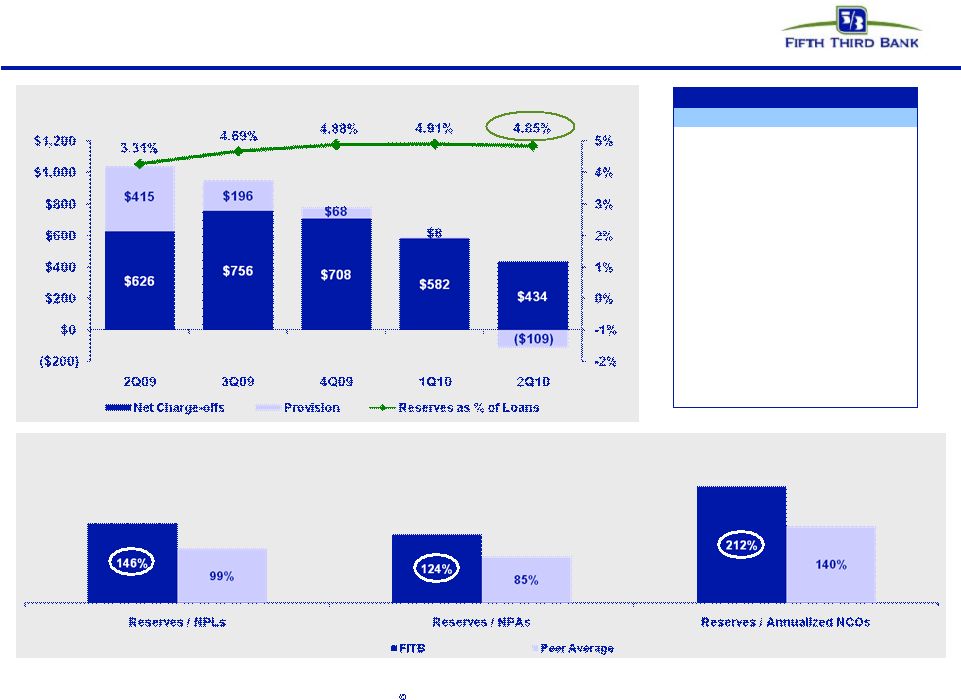
 23
Fifth Third Bank | All Rights Reserved
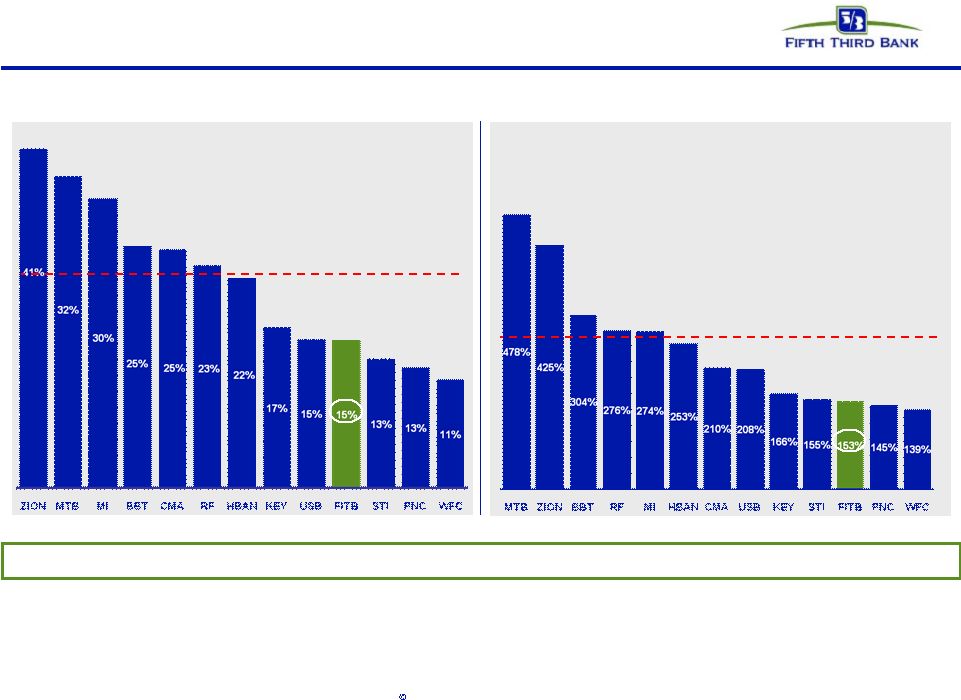
Industry leading reserve levels
Reserves / NPAs
Reserves / Loans
Source: SNL Financial and company reports. Data as of 2Q10.
NPLs and NPAs exclude loans held-for-sale.
Reserves / Net Charge-offs (Annualized)
Reserves / NPLs
Peer average: 3.2%
Peer average: 140%
Fifth Third is the only bank with both Reserve/NPAs above 1 and Reserves/NCOs
>150% Peer average: 85%
Peer average: 99% |
 24
Fifth Third Bank | All Rights Reserved
Potential impact of key elements of Dodd-Frank Act
and other recent financial legislation*
Scope of activity
Potential impact**
Volcker Rule /
Derivatives
•
Vast majority of derivatives activities are exempted
(FITB generally not a market maker)
•
Any proprietary trading de minimis
•
“P/E”
fund investments <$100M (<1% of Tier 1 capital)
•
Expect minimal financial impact from loss of existing
revenue
•
Potentially higher compliance costs despite small levels
of non-exempt activities
Debit
Interchange
(Durbin
Amendment)
•
LTM^ debit interchange revenue $190M
–
Signature $171M, PIN $19M
•
LTM debit interchange $ volume: $15B
–
Signature $11.6B, PIN $3.4B
•
LTM debit interchange transaction volume: 412M
–
Signature 328M, PIN 84M
•
Will
not
know
what
“reasonable”
and
“proportional”
mean
until after Fed study
•
Each 10 bps reduction in overall interchange rates would
represent ~$15M revenue impact annually, before effect
of mitigation
•
Additional follow-on effects on industry debit card
payments business could result from changes
Deposit
Insurance
•
Current assessed base (Deposits): $80B
•
Proposed assessed base (Assets-TE): $97B
•
FITB percentage share of new industry assessment
base lower than its percentage share of old base (due
to lower reliance on wholesale funding)
•
Don’t know assessment rates on new base
•
DIF reserve target increase to 1.35% from 1.15%
–
May be achieved from banks >$50B through higher
annual assessments or longer period of elevated
assessments
Reg. E
•
Requires
customers
to
“opt-in”
to
allow
non-recurring
electronic overdrafts (e.g. debit, ATM) from accounts
•
Estimated ~$20M per quarter ($80M annualized)
reduction to deposit service charges, before effect of
mitigation
Potential impact of these and other elements of financial regulatory reform, such as
CFPA activities and many other aspects, are unknown at this time
TRUPs
exclusion
(Collins
Amendment)
•
280 bps of non-common Tier 1 capital in capital
structure
•
>300 bps of non-common Tier 1 currently
–
Potentially more than may be needed post-Basel III
•
3-year transition period begins 2013
•
Will manage capital structure to desired composition
* Based on current understanding of legislation. ** Potential impact, as noted
above, is not intended to be inclusive of all potential impacts that may result from implementation
of legislation. Please refer also to cautionary statement.
^ LTM = last twelve months |
 25
Fifth Third Bank | All Rights Reserved
Fifth Third Debt Ratings
As of
9/13/10
Fifth Third Bancorp
Moody's
Standard & Poor's
Fitch
DBRS
Short Term Debt
P-2
Short Term Issuer
A-2
Short Term Issuer
F1
Short Term
R-1L
Senior Unsecured
Baa1
Long Term Issuer
BBB
Long Term Issuer
A-
Long Term Issuer
AL
Outlook
Negative
Outlook
Stable
Individual Rating
C *+
Outlook
Stable
Outlook Date
4/14/2009
Outlook Date
7/23/2010
Outlook
Stable
Outlook Date
11/24/2009
Outlook Date
5/24/2010
Fifth Third Bank (OH)
Moody's
Standard & Poor's
Fitch
DBRS
Short Term Debt
P-1 *-
Short Term Issuer
A-2
ST Issuer Default
F1
Short Term
R-1L
Long Term Issuer
A2 *-
Long Term Issuer
BBB+
Long Term Issuer
A-
Long Term Deposit
A
Long Term Deposit
A2 *-
Long Term Deposit
A
Senior Unsecured
A
*-
Indicates Negative Watch
*+ Indicates Positive Watch |