Attached files
| file | filename |
|---|---|
| 8-K - 8-K - CF Industries Holdings, Inc. | a10-17967_18k.htm |
Exhibit 99.1
|
|
Corporate Development Supply Chain Sales Finance Legal Operations Human Resources Dv Sc Sa Fi Le Op Hr CF Industries NYSE: CF Credit Suisse 23rd Annual Chemical & Ag Science Conference September 15, 2010 |
|
|
Safe Harbor Statement Certain statements contained in this communication may constitute "forward-looking statements." All statements in this communication, other than those relating to historical information or current condition, are forward-looking statements. These forward-looking statements are subject to a number of risks and uncertainties, many of which are beyond our control, which could cause actual results to differ materially from such statements. Important factors that could cause actual results to differ materially from our expectations include, among others: our ability to integrate the businesses of CF Industries and Terra promptly and effectively and to achieve the cost savings and synergies we anticipate from the Terra acquisition within the expected time frame or at all; the potential for disruption from the Terra acquisition to make it more difficult for us to maintain relationships with customers, employees or suppliers; the volatile cost of natural gas in the areas where our production facilities are principally located; the cyclical nature of our business and the agricultural sector; the global commodity nature of our fertilizer products, the impact of global supply and demand on our selling prices, and the intense global competition in the consolidating markets in which we operate; conditions in the U.S. agricultural industry; weather conditions; our inability to accurately predict seasonal demand for our products; the concentration of our sales with certain large customers; the impact of changing market conditions on our FPP; risks involving derivatives and the effectiveness of our risk measurement and hedging activities; the reliance of our operations on a limited number of key facilities and the significant risks and hazards against which we may not be fully insured; reliance on third party transportation providers; risks associated with joint ventures; risks associated with expansion of our business, including unanticipated adverse consequences and the significant resources that could be required; potential liabilities and expenditures related to environmental and health and safety laws and regulations; our potential inability to obtain or maintain required permits and governmental approvals or to meet financial assurance requirements; future regulatory restrictions and requirements related to GHG emissions, climate change or other environmental requirements; acts of terrorism and regulations to combat terrorism; difficulties in securing the supply and delivery of raw materials we use and increases in their costs; risks associated with international operations; losses on our investments in securities; deterioration of global market and economic conditions; our substantial indebtedness and the limitations on our operations imposed by the terms of our indebtedness; our ability to comply with the covenants under our indebtedness and to make payments under such indebtedness when due; potential inability to refinance our indebtedness in connection with any change of control affecting us; and loss of key members of management and professional staff. Forward-looking statements are given only as of the date of this release and we disclaim any obligation to update or revise the forward-looking statements, whether as a result of new information, future events or otherwise, except as required by law. |
|
|
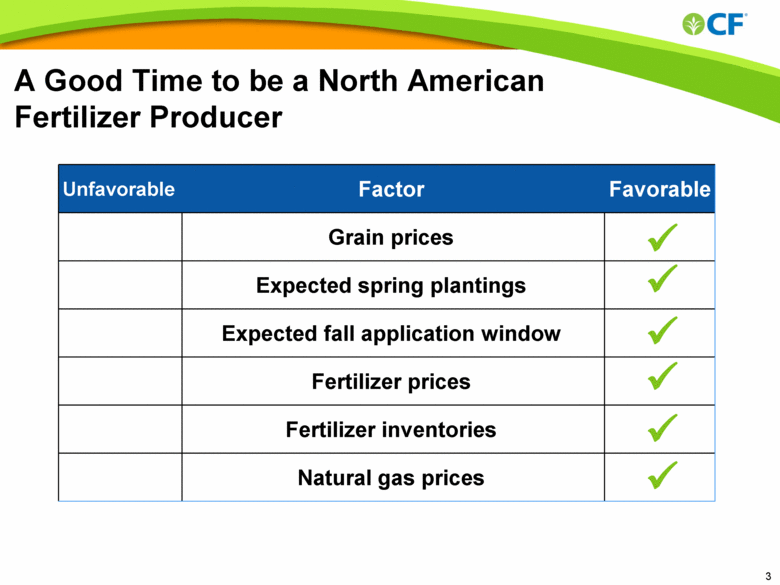
A Good Time to be a North American Fertilizer Producer Unfavorable Factor Favorable Grain prices Expected spring plantings Expected fall application window Fertilizer prices Fertilizer inventories Natural gas prices ü ü ü ü ü ü |
|
|
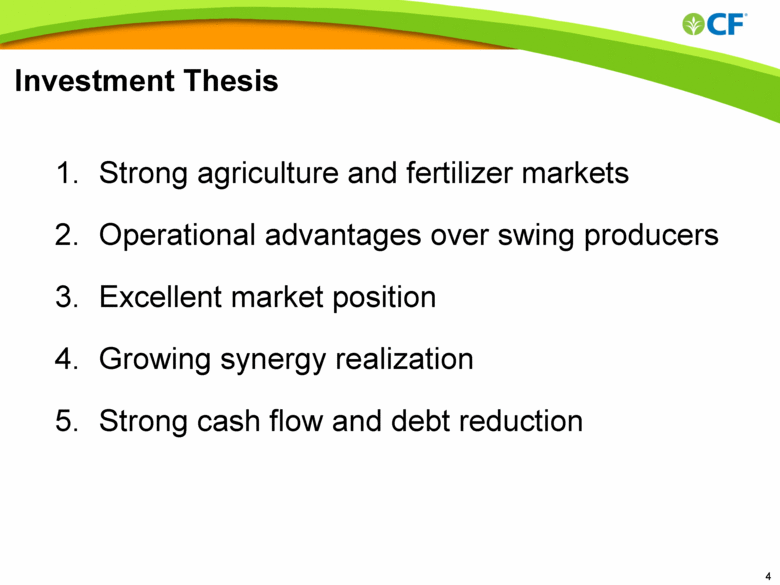
Investment Thesis Strong agriculture and fertilizer markets Operational advantages over swing producers Excellent market position Growing synergy realization Strong cash flow and debt reduction 1. 2. 3. 4. 5. |
|
|
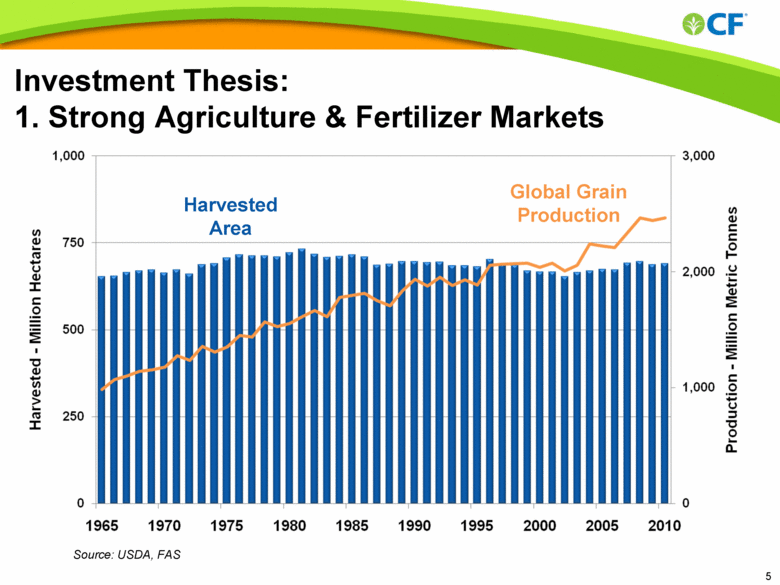
Investment Thesis: 1. Strong Agriculture & Fertilizer Markets Global Grain Production Source: USDA, FAS Harvested Area Harvested - Million Hectares 1,000 750 500 250 0 1965 1970 1975 1980 1985 1990 1995 2000 2005 2010 3,000 2,000 1,000 Production - Million Metric Tonnes |
|
|
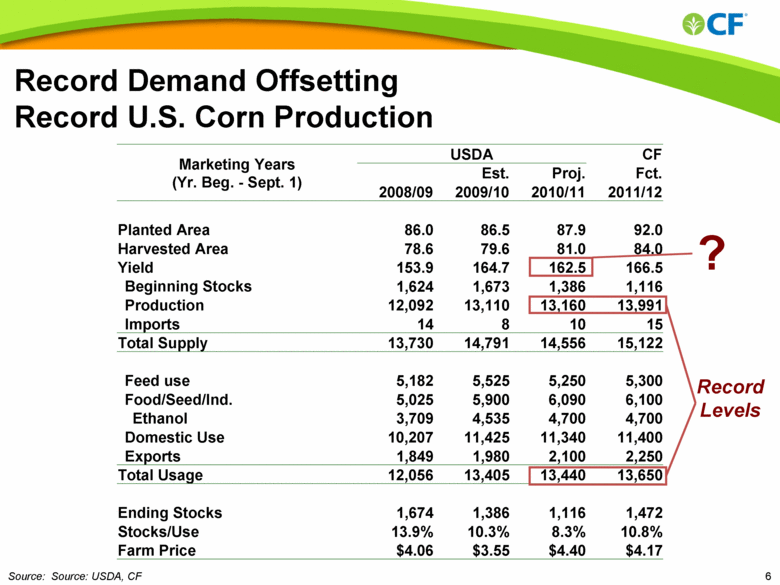
Source: Source: USDA, CF Record Demand Offsetting Record U.S. Corn Production Marketing Years (Yr. Beg. - Sept. 1) USDA CF Est. Proj. Fct. 2008/09 2009/10 2010/11 2011/12 Planted Area 86.0 86.5 87.9 92.0 Harvested Area 78.6 79.6 81.0 84.0 Yield 153.9 164.7 162.5 166.5 Beginning Stocks 1,624 1,673 1,386 1,116 Production 12,092 13,110 13,160 13,991 Imports 14 8 10 15 Total Supply 13,730 14,791 14,556 15,122 Feed use 5,182 5,525 5,250 5,300 Food/Seed/Ind. 5,025 5,900 6,090 6,100 Ethanol 3,709 4,535 4,700 4,700 Domestic Use 10,207 11,425 11,340 11,400 Exports 1,849 1,980 2,100 2,250 Total Usage 12,056 13,405 13,440 13,650 Ending Stocks 1,674 1,386 1,116 1,472 Stocks/Use 13.9% 10.3% 8.3% 10.8% Farm Price $4.06 $3.55 $4.40 $4.17 Record Levels ? |
|
|
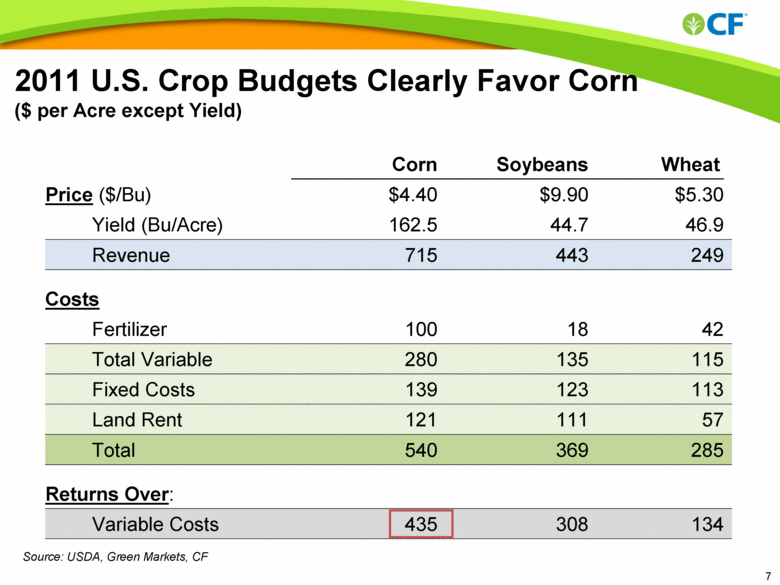
Corn Soybeans Wheat Price ($/Bu) $4.40 $9.90 $5.30 Yield (Bu/Acre) 162.5 44.7 46.9 Revenue 715 443 249 Costs Fertilizer 100 18 42 Total Variable 280 135 115 Fixed Costs 139 123 113 Land Rent 121 111 57 Total 540 369 285 Returns Over: Variable Costs 435 308 134 Source: USDA, Green Markets, CF 2011 U.S. Crop Budgets Clearly Favor Corn ($ per Acre except Yield) |
|
|
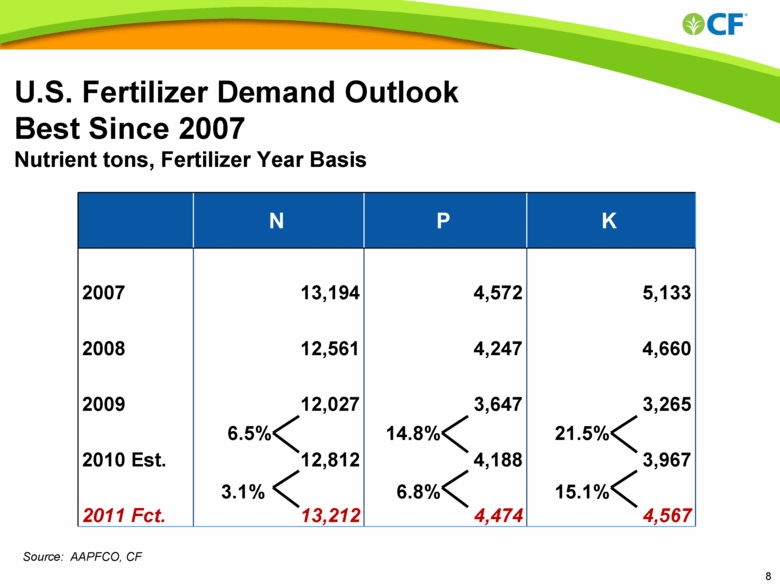
Source: AAPFCO, CF U.S. Fertilizer Demand Outlook Best Since 2007 Nutrient tons, Fertilizer Year Basis Source: AAPFCO, CF N P K 2007 13,194 4,572 5,133 2008 12,561 4,247 4,660 2009 12,027 3,647 3,265 2010 Est. 12,812 4,188 3,967 2011 Fct. 13,212 4,474 4,567 3.1% 15.1% 21.5% 6.8% 14.8% 6.5% |
|
|
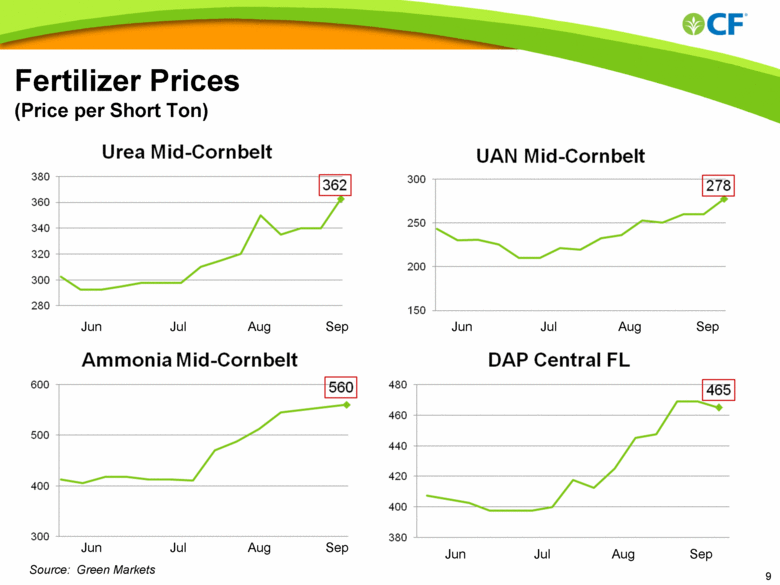
Fertilizer Prices (Price per Short Ton) Jun Jul Aug Sep Source: Green Markets Jun Jul Aug Sep Jun Jul Aug Sep Jun Jul Aug Sep |
|
|
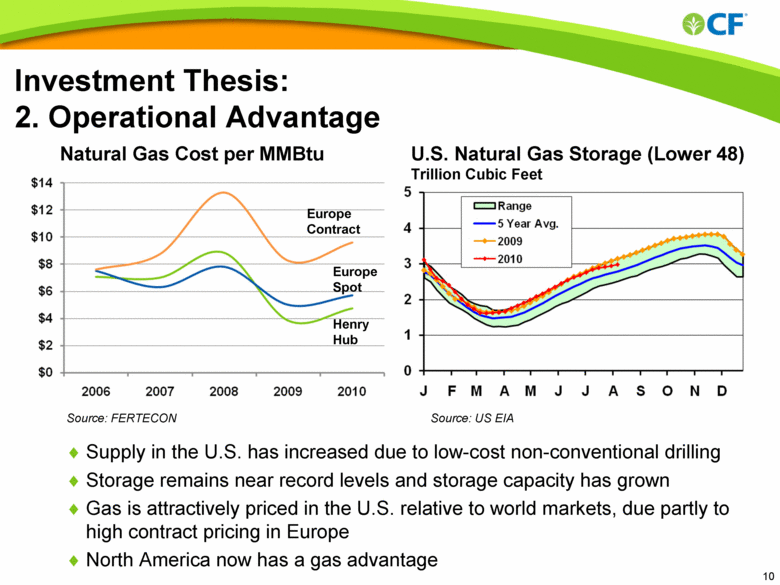
Supply in the U.S. has increased due to low-cost non-conventional drilling Storage remains near record levels and storage capacity has grown Gas is attractively priced in the U.S. relative to world markets, due partly to high contract pricing in Europe North America now has a gas advantage Source: US EIA U.S. Natural Gas Storage (Lower 48) Trillion Cubic Feet Europe Contract Europe Spot Henry Hub Natural Gas Cost per MMBtu Investment Thesis: 2. Operational Advantage Source: FERTECON |
|
|
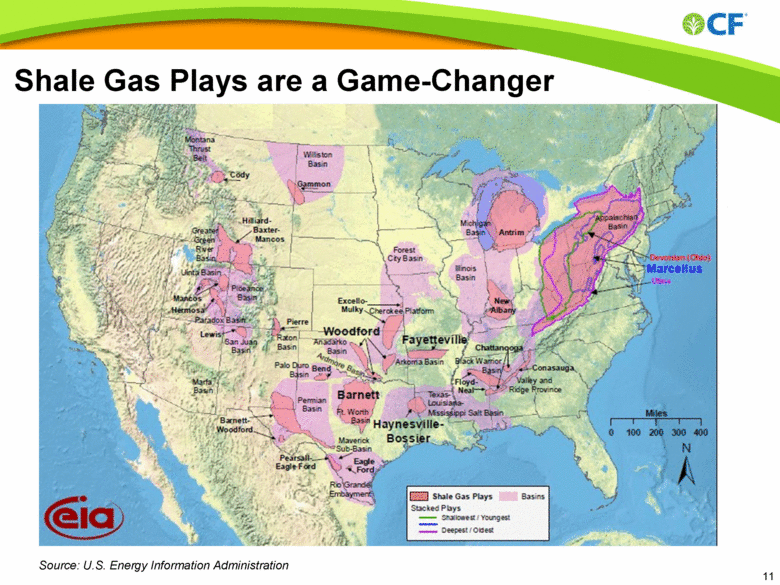
Shale Gas Plays are a Game-Changer Source: U.S. Energy Information Administration |
|
|
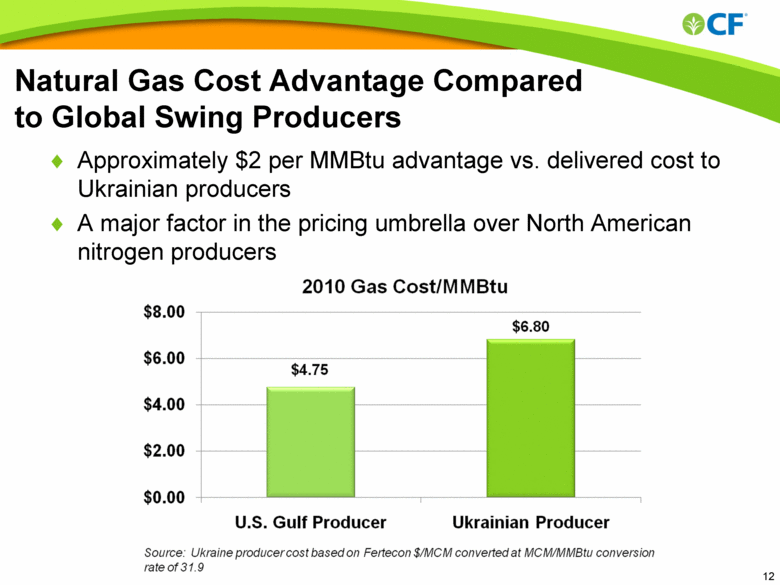
Natural Gas Cost Advantage Compared to Global Swing Producers Approximately $2 per MMBtu advantage vs. delivered cost to Ukrainian producers A major factor in the pricing umbrella over North American nitrogen producers |
|
|
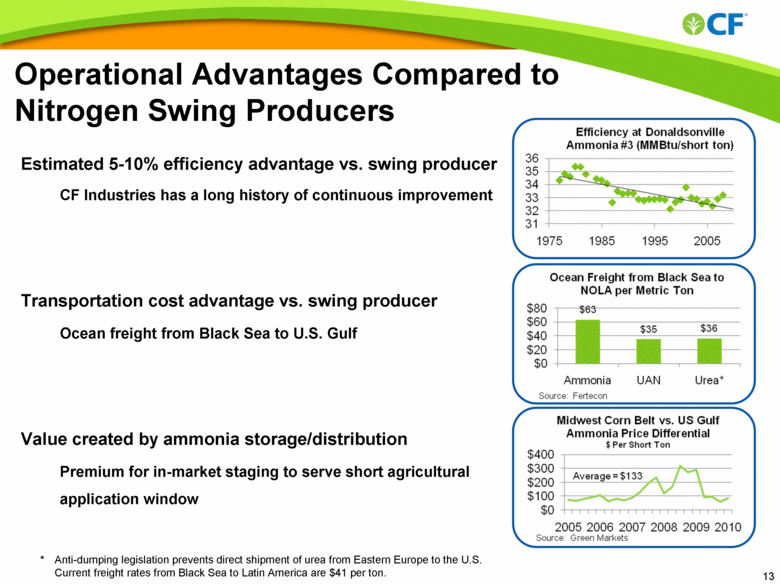
Operational Advantages Compared to Nitrogen Swing Producers Estimated 5-10% efficiency advantage vs. swing producer CF Industries has a long history of continuous improvement Transportation cost advantage vs. swing producer Ocean freight from Black Sea to U.S. Gulf Value created by ammonia storage/distribution Premium for in-market staging to serve short agricultural application window * Anti-dumping legislation prevents direct shipment of urea from Eastern Europe to the U.S. Current freight rates from Black Sea to Latin America are $41 per ton. |
|
|
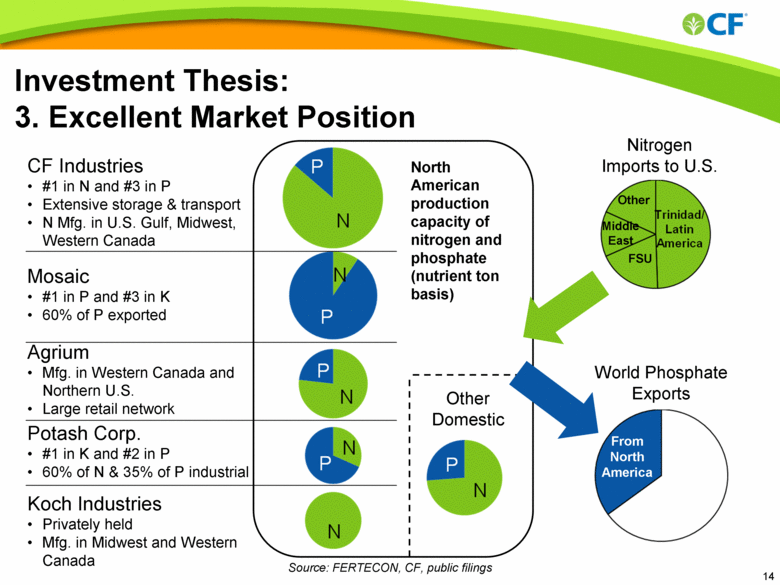
Investment Thesis: 3. Excellent Market Position CF Industries #1 in N and #3 in P Extensive storage & transport N Mfg. in U.S. Gulf, Midwest, Western Canada Agrium Mfg. in Western Canada and Northern U.S. Large retail network Potash Corp. #1 in K and #2 in P 60% of N & 35% of P industrial Koch Industries Privately held Mfg. in Midwest and Western Canada Mosaic #1 in P and #3 in K 60% of P exported Other Domestic North American production capacity of nitrogen and phosphate (nutrient ton basis) Nitrogen Imports to U.S. World Phosphate Exports FSU Middle East Other From North America Source: FERTECON, CF, public filings |
|
|
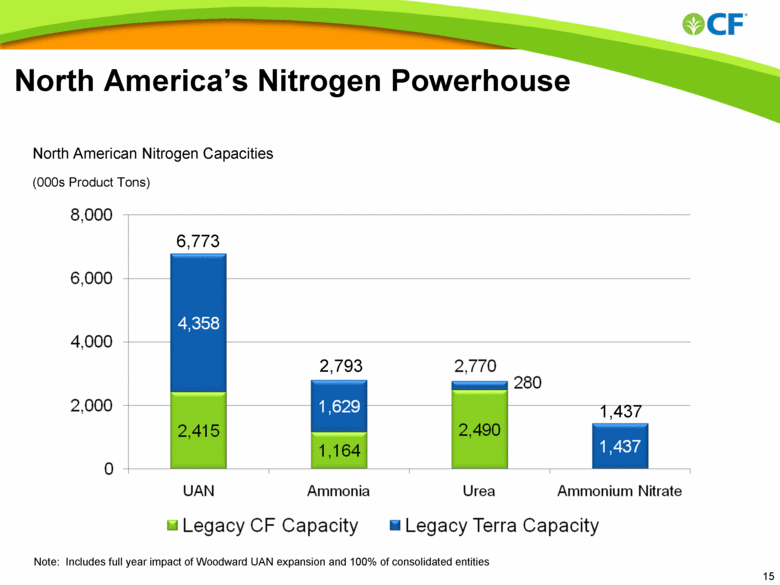
North America’s Nitrogen Powerhouse North American Nitrogen Capacities (000s Product Tons) 6,773 2,793 1,437 Note: Includes full year impact of Woodward UAN expansion and 100% of consolidated entities |
|
|
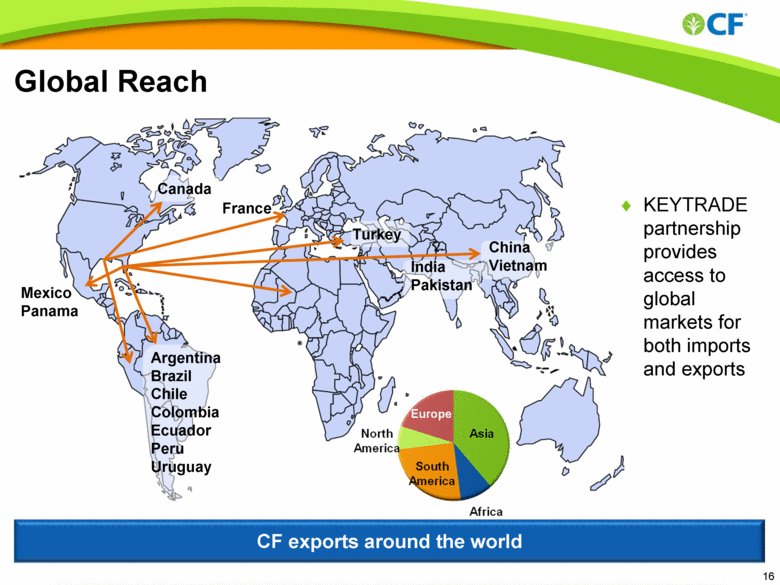
Global Reach KEYTRADE partnership provides access to global markets for both imports and exports CF exports around the world Mexico Panama France Turkey Canada Argentina Brazil Chile Colombia Ecuador Peru Uruguay India Pakistan China Vietnam |
|
|
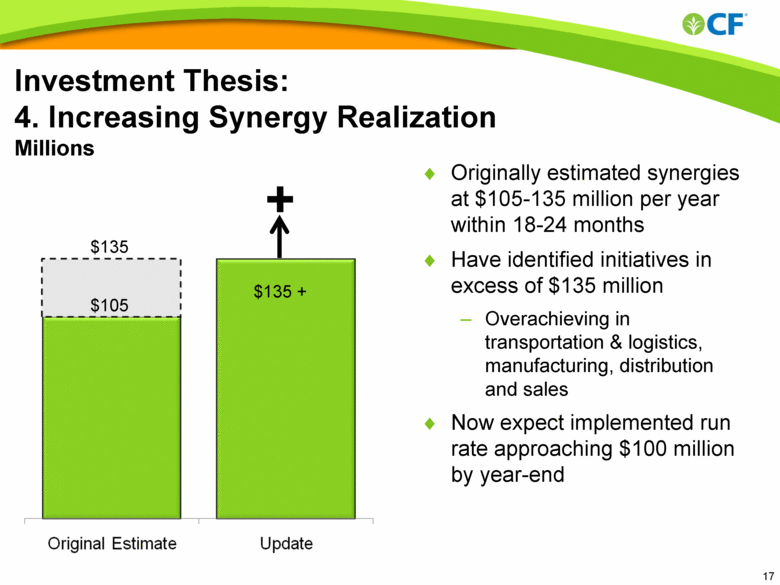
Investment Thesis: 4. Increasing Synergy Realization Millions $135 $105 Originally estimated synergies at $105-135 million per year within 18-24 months Have identified initiatives in excess of $135 million Overachieving in transportation & logistics, manufacturing, distribution and sales Now expect implemented run rate approaching $100 million by year-end $135 + + |
|
|
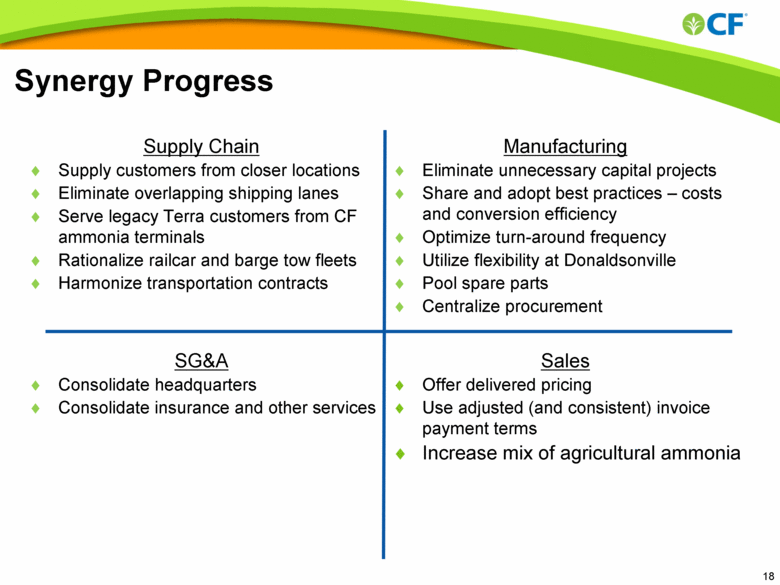
Synergy Progress Supply Chain Supply customers from closer locations Eliminate overlapping shipping lanes Serve legacy Terra customers from CF ammonia terminals Rationalize railcar and barge tow fleets Harmonize transportation contracts Manufacturing Eliminate unnecessary capital projects Share and adopt best practices – costs and conversion efficiency Optimize turn-around frequency Utilize flexibility at Donaldsonville Pool spare parts Centralize procurement SG&A Consolidate headquarters Consolidate insurance and other services Offer delivered pricing Use adjusted (and consistent) invoice payment terms Increase mix of agricultural ammonia Sales |
|
|
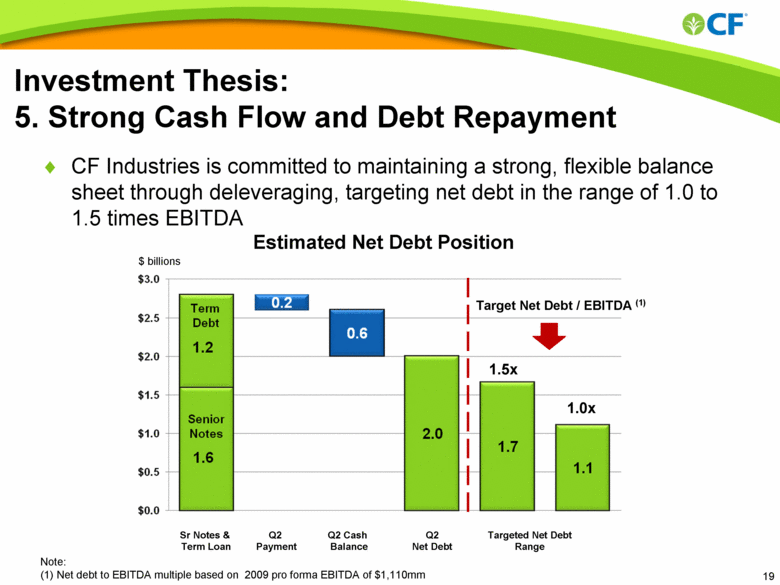
CF Industries is committed to maintaining a strong, flexible balance sheet through deleveraging, targeting net debt in the range of 1.0 to 1.5 times EBITDA Investment Thesis: 5. Strong Cash Flow and Debt Repayment $ billions Estimated Net Debt Position Sr Notes & Term Loan Q2 Payment Q2 Cash Balance Q2 Net Debt Note: (1) Net debt to EBITDA multiple based on 2009 pro forma EBITDA of $1,110mm Targeted Net Debt Range Target Net Debt / EBITDA (1) 1.5x 1.0x |
|
|
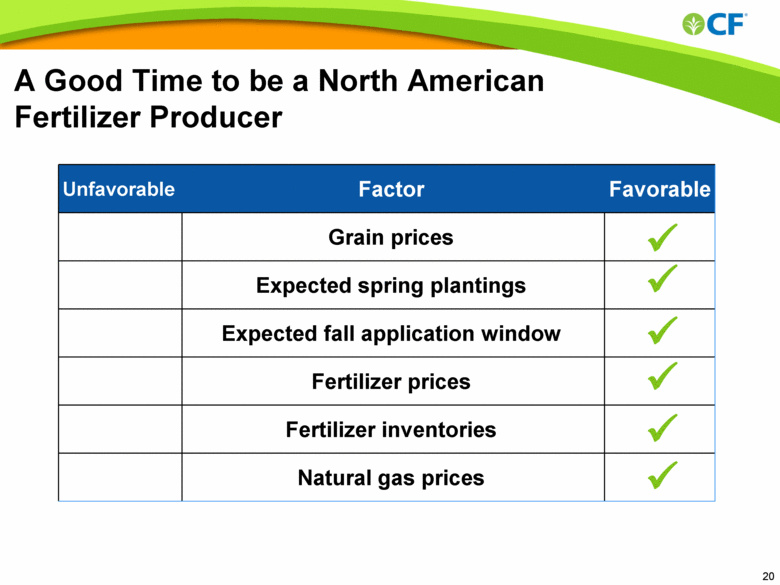
A Good Time to be a North American Fertilizer Producer Unfavorable Factor Favorable Grain prices Expected spring plantings Expected fall application window Fertilizer prices Fertilizer inventories Natural gas prices ü ü ü ü ü ü |
|
|
Appendix For more information, please visit www.cfindustries.com |
|
|
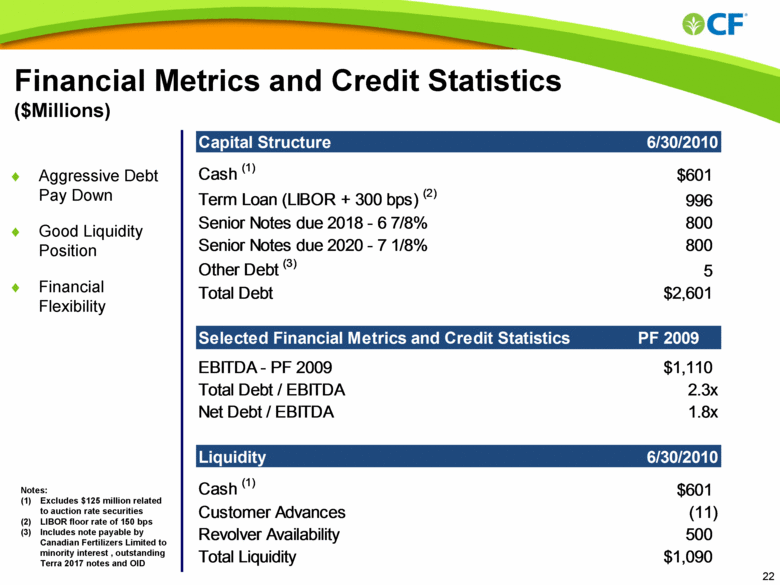
Financial Metrics and Credit Statistics ($Millions) Notes: Excludes $125 million related to auction rate securities LIBOR floor rate of 150 bps Includes note payable by Canadian Fertilizers Limited to minority interest , outstanding Terra 2017 notes and OID Aggressive Debt Pay Down Good Liquidity Position Financial Flexibility Capital Structure 6/30/2010 Cash (1) $601 Term Loan (LIBOR + 300 bps) (2) 996 Senior Notes due 2018 - 6 7/8% 800 Senior Notes due 2020 - 7 1/8% 800 Other Debt (3) 5 Total Debt $2,601 Selected Financial Metrics and Credit Statistics PF 2009 EBITDA - PF 2009 $1,110 Total Debt / EBITDA 2.3x Net Debt / EBITDA 1.8x Liquidity 6/30/2010 Cash (1) $601 Customer Advances (11) Revolver Availability 500 Total Liquidity $1,090 (1) (2) (3) |
|
|
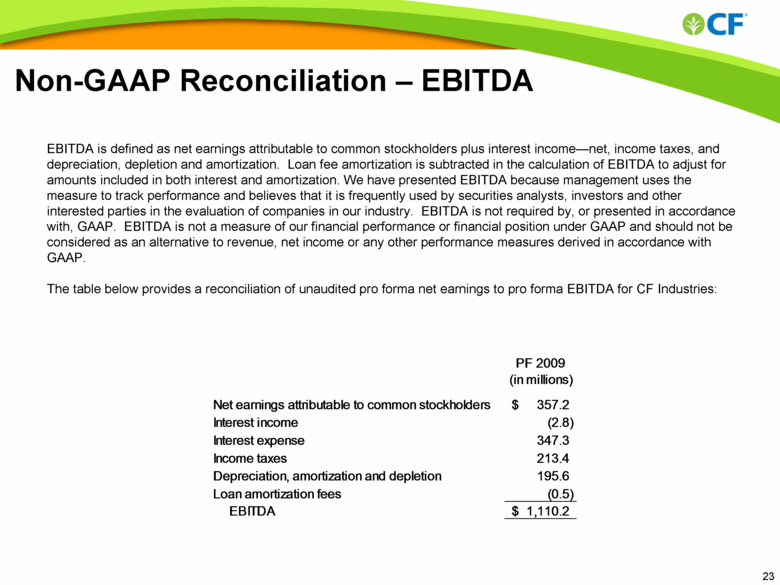
Non-GAAP Reconciliation – EBITDA EBITDA is defined as net earnings attributable to common stockholders plus interest income—net, income taxes, and depreciation, depletion and amortization. Loan fee amortization is subtracted in the calculation of EBITDA to adjust for amounts included in both interest and amortization. We have presented EBITDA because management uses the measure to track performance and believes that it is frequently used by securities analysts, investors and other interested parties in the evaluation of companies in our industry. EBITDA is not required by, or presented in accordance with, GAAP. EBITDA is not a measure of our financial performance or financial position under GAAP and should not be considered as an alternative to revenue, net income or any other performance measures derived in accordance with GAAP. The table below provides a reconciliation of unaudited pro forma net earnings to pro forma EBITDA for CF Industries: PF 2009 (in millions) Net earnings attributable to common stockholders 357.2 $ Interest income (2.8) Interest expense 347.3 Income taxes 213.4 Depreciation, amortization and depletion 195.6 Loan amortization fees (0.5) EBITDA 1,110.2 $ |
|
|
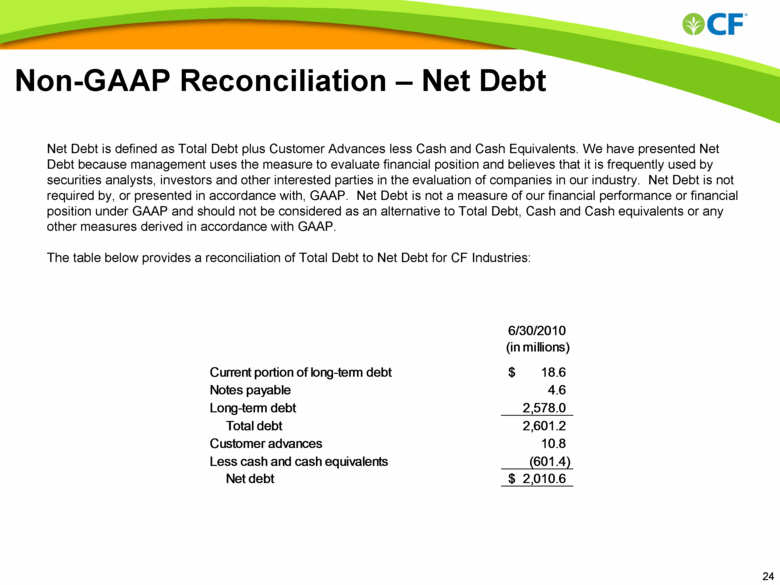
Non-GAAP Reconciliation – Net Debt Net Debt is defined as Total Debt plus Customer Advances less Cash and Cash Equivalents. We have presented Net Debt because management uses the measure to evaluate financial position and believes that it is frequently used by securities analysts, investors and other interested parties in the evaluation of companies in our industry. Net Debt is not required by, or presented in accordance with, GAAP. Net Debt is not a measure of our financial performance or financial position under GAAP and should not be considered as an alternative to Total Debt, Cash and Cash equivalents or any other measures derived in accordance with GAAP. The table below provides a reconciliation of Total Debt to Net Debt for CF Industries: 6/30/2010 (in millions) Current portion of long-term debt 18.6 $ Notes payable 4.6 Long-term debt 2,578.0 Total debt 2,601.2 Customer advances 10.8 Less cash and cash equivalents (601.4) Net debt 2,010.6 $ |

