Attached files
| file | filename |
|---|---|
| 8-K - FORM 8-K - UIL HOLDINGS CORP | y03946e8vk.htm |
Exhibit 99
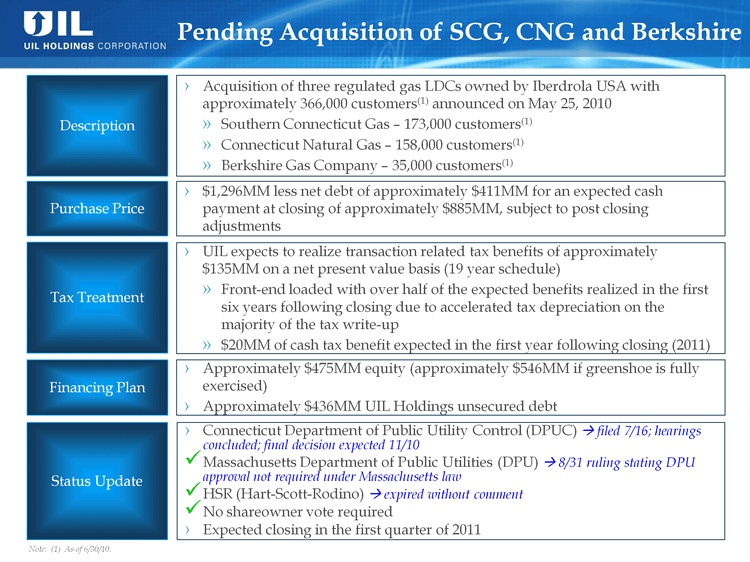
| Pending Acquisition of SCG, CNG and Berkshire Description Acquisition of three regulated gas LDCs owned by Iberdrola USA with approximately 366,000 customers(1) announced on May 25, 2010 Southern Connecticut Gas - 173,000 customers(1) Connecticut Natural Gas - 158,000 customers(1) Berkshire Gas Company - 35,000 customers(1) Purchase Price $1,296MM less net debt of approximately $411MM for an expected cash payment at closing of approximately $885MM, subject to post closing adjustments Tax Treatment Financing Plan Approximately $475MM equity (approximately $546MM if greenshoe is fully exercised) Approximately $436MM UIL Holdings unsecured debt Note: (1) As of 6/30/10. UIL expects to realize transaction related tax benefits of approximately $135MM on a net present value basis (19 year schedule) Front-end loaded with over half of the expected benefits realized in the first six years following closing due to accelerated tax depreciation on the majority of the tax write-up $20MM of cash tax benefit expected in the first year following closing (2011) Status Update Connecticut Department of Public Utility Control (DPUC) ? filed 7/16; hearings concluded; final decision expected 11/10 Massachusetts Department of Public Utilities (DPU) ? 8/31 ruling stating DPU approval not required under Massachusetts law HSR (Hart-Scott-Rodino) ? expired without comment No shareowner vote required Expected closing in the first quarter of 2011 |
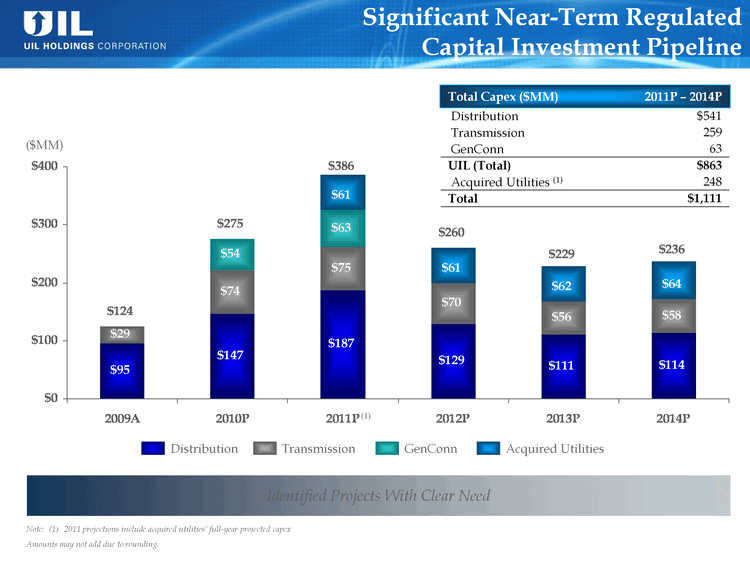
| Total Capex ($MM) 2011P - 2014P Distribution $541 Transmission 259 GenConn 63 UIL (Total) $863 Acquired Utilities (1) 248 Total $1,111 Significant Near-Term Regulated Capital Investment Pipeline ($MM) 2009A 2010P 2011P 2012P 2013P 2014P Distribution 95 147 187 129 111 114 Transmission 29 74 75 70 56 58 GenConn 54 63 Target 61 61 62 64 124 275 386 260 229 236 Identified Projects With Clear Need GenConn Transmission Acquired Utilities (1) Note: (1) 2011 projections include acquired utilities' full-year projected capex Amounts may not add due to rounding. |
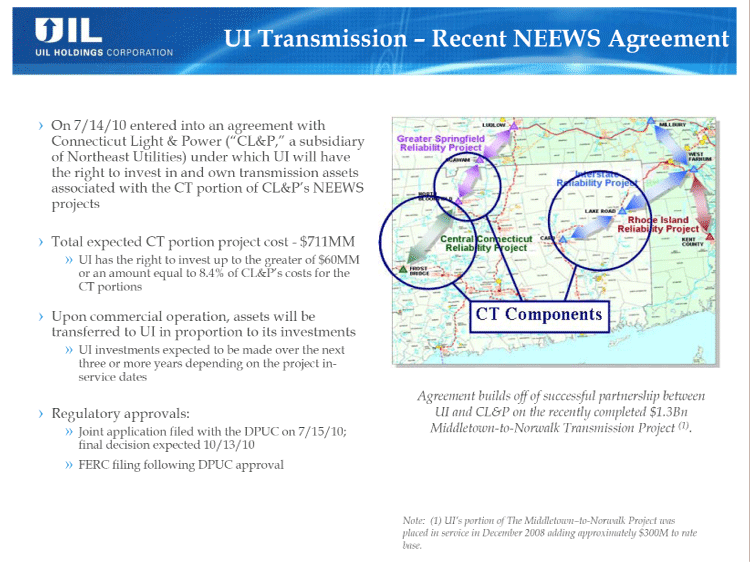
| UI Transmission - Recent NEEWS Agreement On 7/14/10 entered into an agreement with Connecticut Light & Power ("CL&P," a subsidiary of Northeast Utilities) under which UI will have the right to invest in and own transmission assets associated with the CT portion of CL&P's NEEWS projects Total expected CT portion project cost - $711MM UI has the right to invest up to the greater of $60MM or an amount equal to 8.4% of CL&P's costs for the CT portions Upon commercial operation, assets will be transferred to UI in proportion to its investments UI investments expected to be made over the next three or more years depending on the project in- service dates Regulatory approvals: Joint application filed with the DPUC on 7/15/10; final decision expected 10/13/10 FERC filing following DPUC approval Agreement builds off of successful partnership between UI and CL&P on the recently completed $1.3Bn Middletown-to-Norwalk Transmission Project (1). Note: (1) UI's portion of The Middletown-to-Norwalk Project was placed in service in December 2008 adding approximately $300M to rate base. |
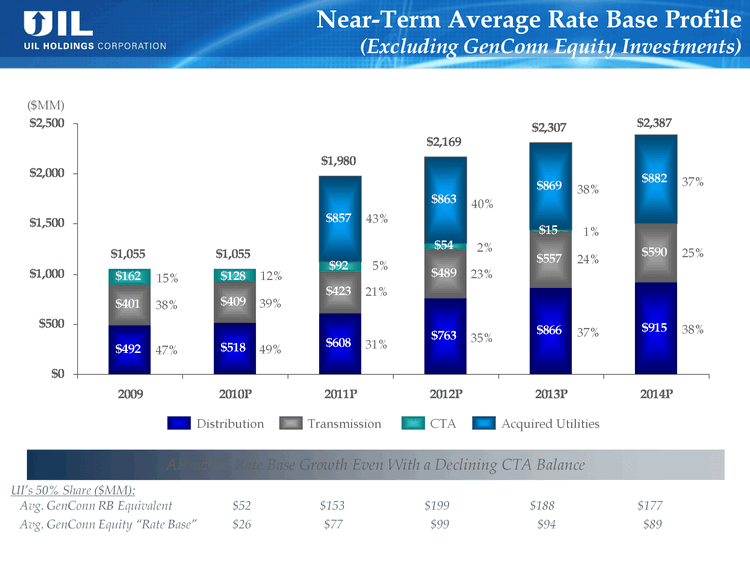
| 2009 2010P 2011P 2012P 2013P 2014P Distribution 492 518 608 763 866 915 Transmission 401 409 423 489 557 590 GenConn 162 128 92 54 15 Target 857.3558012 862.9645194 869.2578438 882.1170454 1055 1055 1980.355801 2168.964519 2307.257844 2387.117045 Near-Term Average Rate Base Profile (Excluding GenConn Equity Investments) ($MM) 47% 38% 15% 49% 39% 12% 31% 21% 5% 35% 2% 40% Attractive Rate Base Growth Even With a Declining CTA Balance 1% 24% 37% 37% 38% Acquired Utilities 43% 23% 38% 25% Avg. GenConn RB Equivalent $153 $199 $188 $177 Avg. GenConn Equity "Rate Base" $77 $94 $89 $99 UI's 50% Share ($MM): $52 $26 |
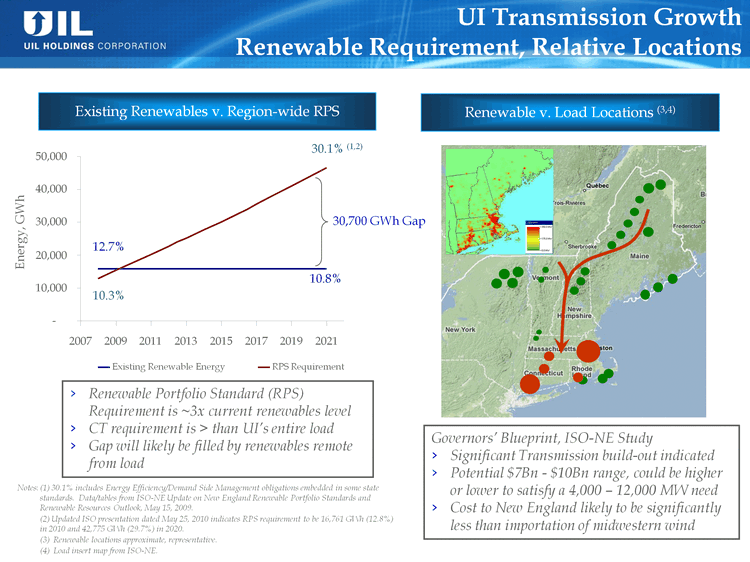
| UI Transmission Growth Renewable Requirement, Relative Locations Existing Renewables v. Region-wide RPS Governors' Blueprint, ISO-NE Study Significant Transmission build-out indicated Potential $7Bn - $10Bn range, could be higher or lower to satisfy a 4,000 - 12,000 MW need Cost to New England likely to be significantly less than importation of midwestern wind Renewable v. Load Locations (3,4) Renewable Portfolio Standard (RPS) Requirement is ~3x current renewables level CT requirement is > than UI's entire load Gap will likely be filled by renewables remote from load Notes: (1) 30.1% includes Energy Efficiency/Demand Side Management obligations embedded in some state standards. Data/tables from ISO-NE Update on New England Renewable Portfolio Standards and Renewable Resources Outlook, May 15, 2009. (2) Updated ISO presentation dated May 25, 2010 indicates RPS requirement to be 16,761 GWh (12.8%) in 2010 and 42,775 GWh (29.7%) in 2020. (3) Renewable locations approximate, representative. (4) Load insert map from ISO-NE. 30,700 GWh Gap 30.1% (1,2) |

| Pro Forma Near-Term Debt Maturities (1) Standalone Liquidity Overview (6/30/10)* Strong Liquidity Position and Manageable Near-Term Debt Maturities *UIL Plans to Increase Size of Credit Facilities to Provide Adequate Liquidity for Larger Business Note: (1) 2010 amounts do not include $31.8MM used for refunding and sinking fund payments in February 2010 Amounts may not add due to rounding. ($MM) 2010 2011 2012 2013 PCBs 104 Debt 49 UI Equity Bridge Loan 54 65 Acqured utilities 40 30 5 40 Total 94 144 109 40 ($MM) UI Equity Bridge Loan UIL Debt Acquired Utilities Credit Facilities Unrestricted Cash Utilization Total Liquidity 175 162 Invisible 175 162 18 Stack 11 31 ( ) |
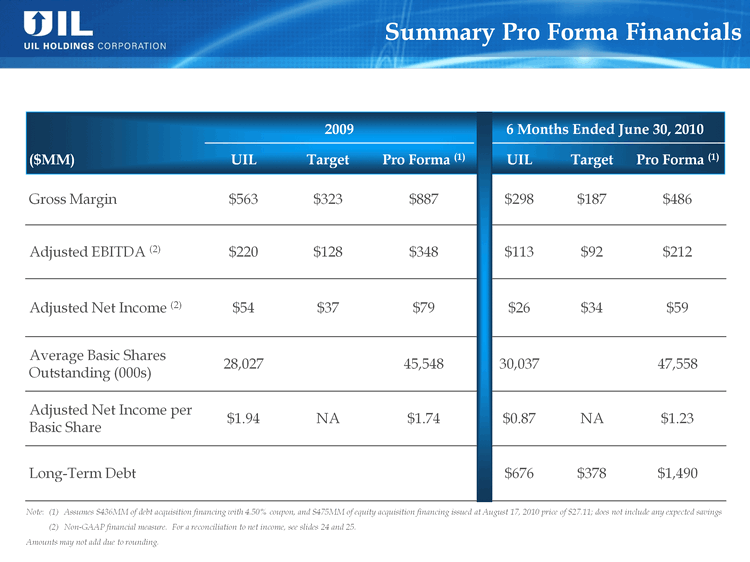
| 2009 2009 2009 6 Months Ended June 30, 2010 6 Months Ended June 30, 2010 6 Months Ended June 30, 2010 ($MM) UIL Target Pro Forma (1) UIL Target Pro Forma (1) Gross Margin $563 $323 $887 $298 $187 $486 Adjusted EBITDA (2) $220 $128 $348 $113 $92 $212 Adjusted Net Income (2) $54 $37 $79 $26 $34 $59 Average Basic Shares Outstanding (000s) 28,027 45,548 30,037 47,558 Adjusted Net Income per Basic Share $1.94 NA $1.74 $0.87 NA $1.23 Long-Term Debt $676 $378 $1,490 Summary Pro Forma Financials Note: (1) Assumes $436MM of debt acquisition financing with 4.50% coupon, and $475MM of equity acquisition financing issued at August 17, 2010 price of $27.11; does not include any expected savings (2) Non-GAAP financial measure. For a reconciliation to net income, see slides 24 and 25. Amounts may not add due to rounding. |
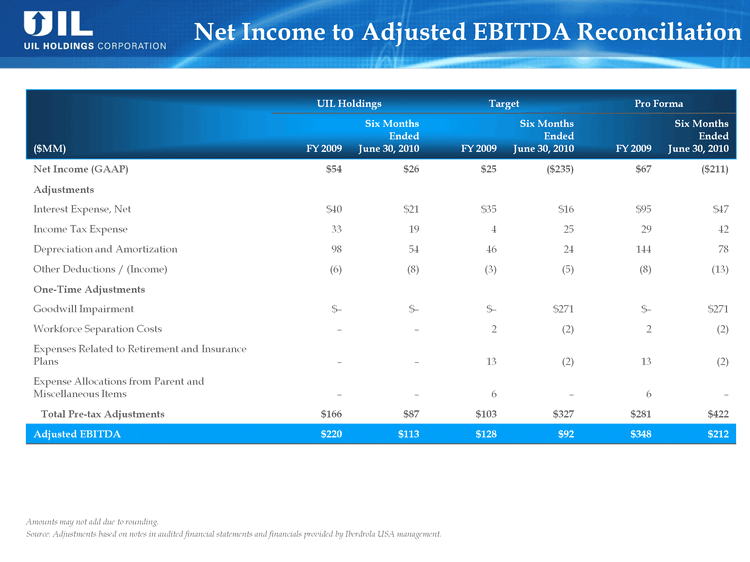
| Net Income to Adjusted EBITDA Reconciliation UIL Holdings UIL Holdings Target Target Pro Forma Pro Forma ($MM) FY 2009 Six Months Ended June 30, 2010 FY 2009 Six Months Ended June 30, 2010 FY 2009 Six Months EndedJune 30, 2010 Net Income (GAAP) $54 $26 $25 ($235) $67 ($211) Adjustments Interest Expense, Net $40 $21 $35 $16 $95 $47 Income Tax Expense 33 19 4 25 29 42 Depreciation and Amortization 98 54 46 24 144 78 Other Deductions / (Income) (6) (8) (3) (5) (8) (13) One-Time Adjustments Goodwill Impairment $- $- $- $271 $- $271 Workforce Separation Costs - - 2 (2) 2 (2) Expenses Related to Retirement and Insurance Plans - - 13 (2) 13 (2) Expense Allocations from Parent and Miscellaneous Items - - 6 - 6 - Total Pre-tax Adjustments $166 $87 $103 $327 $281 $422 Adjusted EBITDA $220 $113 $128 $92 $348 $212 Amounts may not add due to rounding. Source: Adjustments based on notes in audited financial statements and financials provided by Iberdrola USA management. |

| Adjusted Net Income Reconciliation UIL Holdings UIL Holdings Target Target Pro Forma Pro Forma ($MM) FY 2009 Six Months Ended June 30, 2010 FY 2009 Six Months Ended June 30, 2010 FY 2009 Six Months EndedJune 30, 2010 Net Income (GAAP) $54 $26 $25 ($235) $67 ($211) One-Time Adjustments Goodwill Impairment $- $- $- $271 $- $271 Workforce Separation Costs - - 1 (1) 1 (1) Expenses Related to Retirement and Insurance Plans - - 7 (1) 7 (1) Expense Allocations from Parent and Miscellaneous Items - - 4 - 4 - Total After-tax Adjustments $- $- $12 $269 $12 $269 Adjusted Net Income $54 $26 $37 $34 $79 $59 Amounts may not add due to rounding. Source: Adjustments based on notes in audited financial statements and financials provided by Iberdrola USA management. |
