Attached files
| file | filename |
|---|---|
| 8-K - 8-K - Solera National Bancorp, Inc. | a10-17103_18k.htm |
| EX-99.1 - EX-99.1 - Solera National Bancorp, Inc. | a10-17103_1ex99d1.htm |
Exhibit 99.2
|
|
Rodman & Renshaw Annual Global Investment Conference Community & Regional Bank Track September 12-15, 2010 New York Palace Hotel New York, NY |
|
|
Safe Harbor Statement This presentation contains forward-looking statements within the meaning of the Private Securities Litigation Reform Act of 1995. The statements contained in this presentation, which are not historical facts and that relate to future plans or projected results of Solera National Bancorp, Inc. (“Company”) and its wholly-owned subsidiary, Solera National Bank (“Bank”), are forward-looking statements within the meaning of Section 27A of the Securities Act of 1933 and Section 21E of the Securities Exchange Act of 1934. These forward-looking statements are subject to risks and uncertainties that could cause actual results to differ materially from those projected, anticipated or implied. These risks and uncertainties can include the risks associated with the ability to grow the Bank and the services it provides, the ability to successfully integrate new business lines and expand into new markets, competition in the marketplace, general economic conditions and many other risks described in the Company’s Securities and Exchange Commission filings. The most significant of these uncertainties are described in our 2009 Annual Report on Form 10-K and Quarterly Reports on Form 10-Q all of which any reader is encouraged to study (including all amendments to those reports) and exhibits to those reports. We undertake no obligation to update or revise any forward-looking statement. |
|
|
Who are we? De novo opened September 2007 – 3 years old! Nationally-chartered OCC bank Niche market focus – Hispanic demographic $25 million community capital raise Small Business focus Relationship-driven |
|
|
Our Commitment to Corporate Citizenship We have always been passionately devoted to being good corporate citizens. Reinvesting in our community is a founding cornerstone for Solera. Established partnerships with leading organizations that share similar vision Focus on education and financial literacy training On-going and extending community outreach efforts (e.g., recently formed Community Advisory Council) |
|
|
Our Competitive Advantage: Human Capital By valuing human capital on par with monetary capital, we believe we are uniquely positioned to create long-term shareholder value Experienced Management Team 100 years of combined banking experience Experienced in all banking cycles Extensive experience working with bank regulators Track record of enhancing organic growth with M&A and branch expansion initiatives Public company experience |
|
|
Our Competitive Advantage: Human Capital (contd.) Bi-lingual, experienced, talented employees Well-trained team Committed to exceeding customers’ expectations |
|
|
Key Highlights Agreement to acquire business of nearby competitor bank branch First Quarterly profits – 1st and 2nd Quarters 2010 Well-capitalized; ample liquidity Experienced management team New products & services to drive growth and profitability Leveraged capital with Investment Portfolio Pre-funded loan growth Market opportunities |
|
|
Solera is: Executing on plan despite unprecedented economic environment Rapidly adding new customers |
|
|
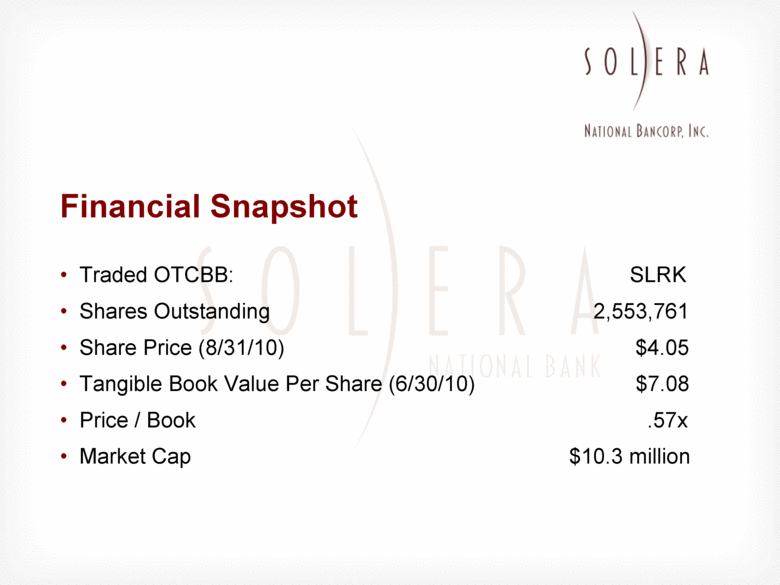
Financial Snapshot Traded OTCBB: SLRK Shares Outstanding 2,553,761 Share Price (8/31/10) $4.05 Tangible Book Value Per Share (6/30/10) $7.08 Price / Book .57x Market Cap $10.3 million |
|
|
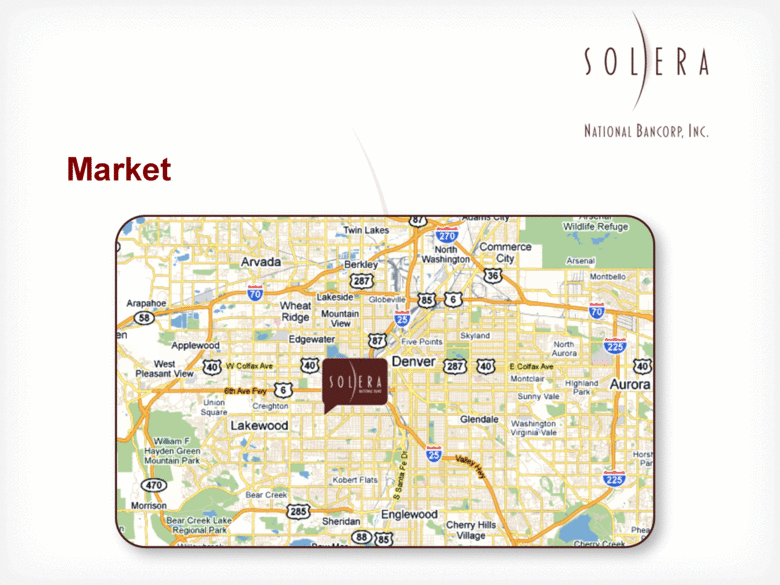
Market |
|
|
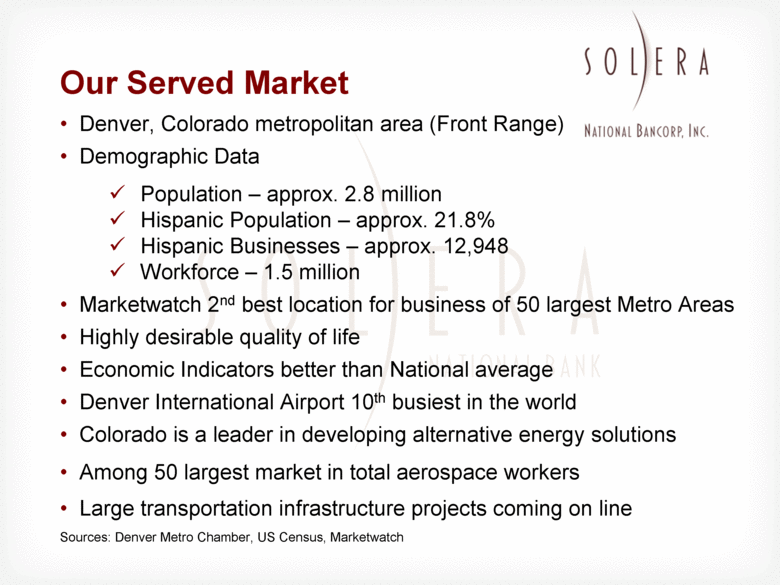
Our Served Market Denver, Colorado metropolitan area (Front Range) Demographic Data Population – approx. 2.8 million Hispanic Population – approx. 21.8% Hispanic Businesses – approx. 12,948 Workforce – 1.5 million Marketwatch 2nd best location for business of 50 largest Metro Areas Highly desirable quality of life Economic Indicators better than National average Denver International Airport 10th busiest in the world Colorado is a leader in developing alternative energy solutions Among 50 largest market in total aerospace workers Large transportation infrastructure projects coming on line Sources: Denver Metro Chamber, US Census, Marketwatch |
|
|
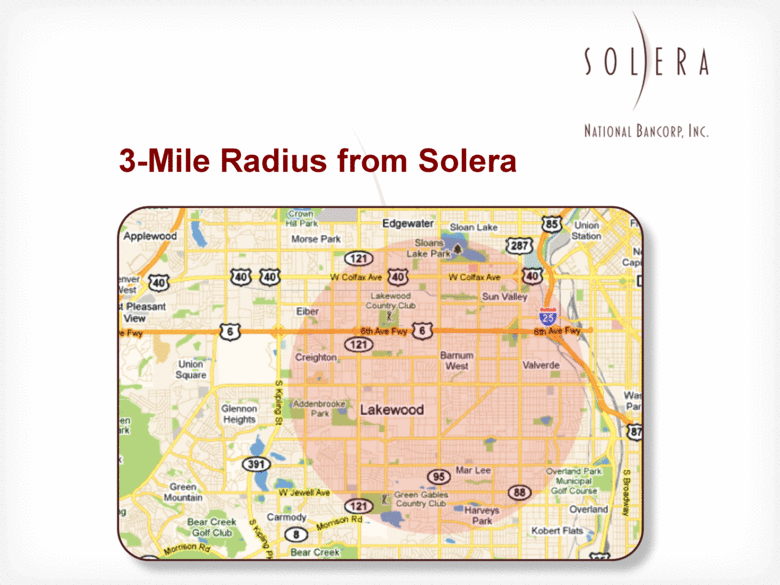
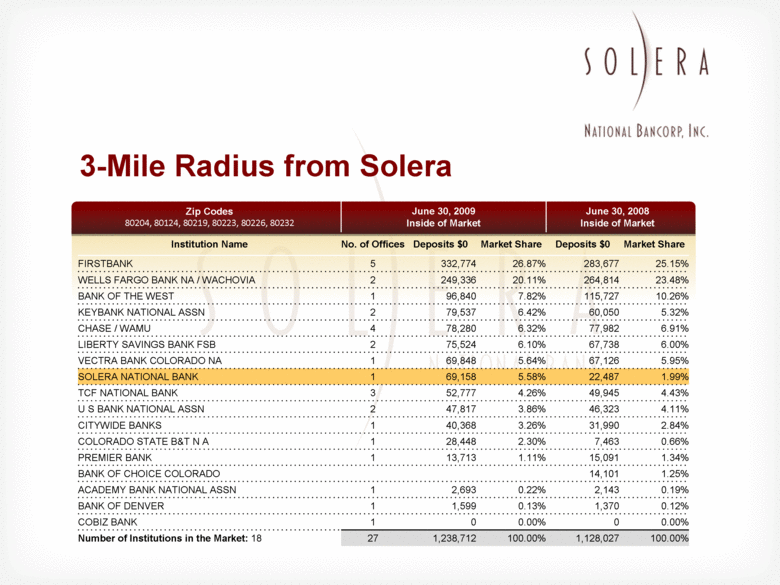
3-Mile Radius from Solera |
|
|
Our Served Market – Three Mile Radius 5,200 Businesses 52,000 Employees 52% Hispanic Households 165,000 Residents 140,000 vehicles per day at branch intersection Sources: Environmental Systems Research Institute and City and County of Denver |
|
|
3-Mile Radius from Solera Zip Codes 80204, 80124, 80219, 80223, 80226, 80232 June 30, 2009 Inside of Market June 30, 2008 Inside of Market Institution Name No. of Offices Deposits $0 Market Share Deposits $0 Market Share FIRSTBANK 5 332,774 26.87% 283,677 25.15% WELLS FARGO BANK NA / WACHOVIA 2 249,336 20.11% 264,814 23.48% BANK OF THE WEST 1 96,840 7.82% 115,727 10.26% KEYBANK NATIONAL ASSN 2 79,537 6.42% 60,050 5.32% CHASE / WAMU 4 78,280 6.32% 77,982 6.91% LIBERTY SAVINGS BANK FSB 2 75,524 6.10% 67,738 6.00% VECTRA BANK COLORADO NA 1 69,848 5.64% 67,126 5.95% SOLERA NATIONAL BANK 1 69,158 5.58% 22,487 1.99% TCF NATIONAL BANK 3 52,777 4.26% 49,945 4.43% U S BANK NATIONAL ASSN 2 47,817 3.86% 46,323 4.11% CITYWIDE BANKS 1 40,368 3.26% 31,990 2.84% COLORADO STATE B&T N A 1 28,448 2.30% 7,463 0.66% PREMIER BANK 1 13,713 1.11% 15,091 1.34% BANK OF CHOICE COLORADO 14,101 1.25% ACADEMY BANK NATIONAL ASSN 1 2,693 0.22% 2,143 0.19% BANK OF DENVER 1 1,599 0.13% 1,370 0.12% COBIZ BANK 1 0 0.00% 0 0.00% Number of Institutions in the Market: 18 27 1,238,712 100.00% 1,128,027 100.00% |
|
|
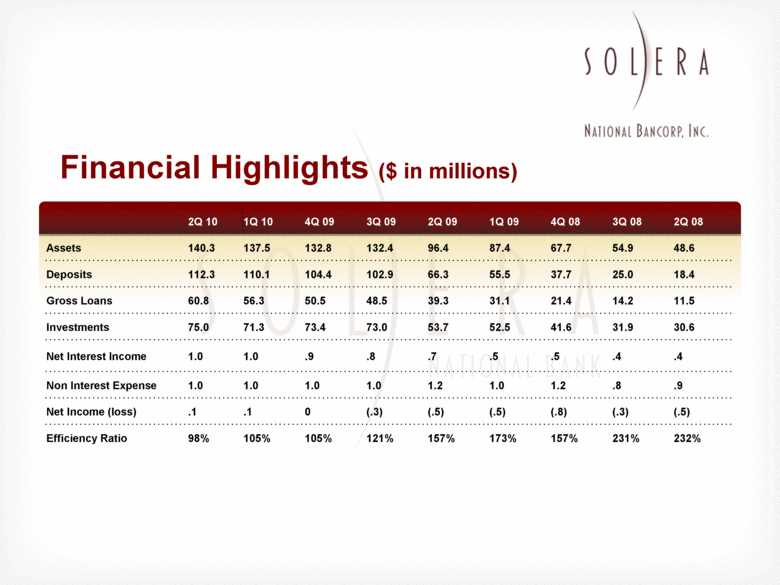
Financial Highlights ($ in millions) 2Q 10 1Q 10 4Q 09 3Q 09 2Q 09 1Q 09 4Q 08 3Q 08 2Q 08 Assets 140.3 137.5 132.8 132.4 96.4 87.4 67.7 54.9 48.6 Deposits 112.3 110.1 104.4 102.9 66.3 55.5 37.7 25.0 18.4 Gross Loans 60.8 56.3 50.5 48.5 39.3 31.1 21.4 14.2 11.5 Investments 75.0 71.3 73.4 73.0 53.7 52.5 41.6 31.9 30.6 Net Interest Income 1.0 1.0 .9 .8 .7 .5 .5 .4 .4 Non Interest Expense 1.0 1.0 1.0 1.0 1.2 1.0 1.2 .8 .9 Net Income (loss) .1 .1 0 (.3) (.5) (.5) (.8) (.3) (.5) Efficiency Ratio 98% 105% 105% 121% 157% 173% 157% 231% 232% |
|
|
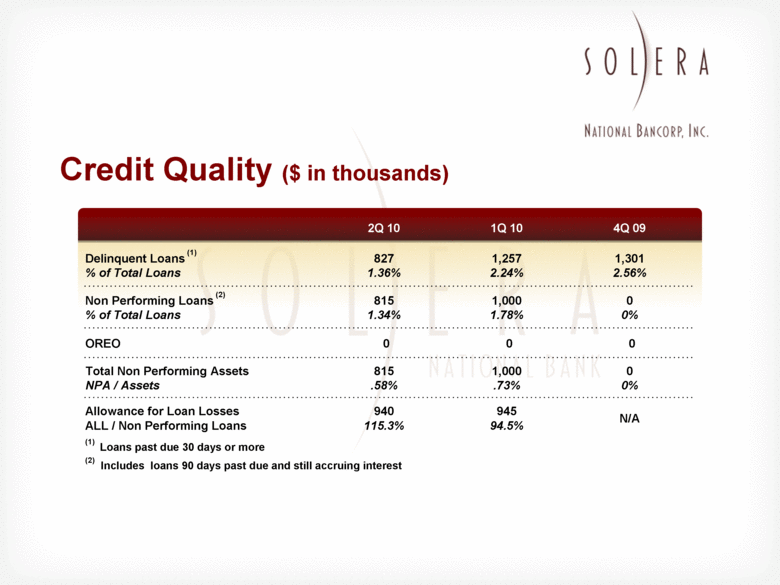
Credit Quality ($ in thousands) 2Q 10 1Q 10 4Q 09 Delinquent Loans (1) % of Total Loans 827 1.36% 1,257 2.24% 1,301 2.56% Non Performing Loans (2) % of Total Loans 815 1.34% 1,000 1.78% 0 0% OREO 0 0 0 Total Non Performing Assets NPA / Assets 815 .58% 1,000 .73% 0 0% Allowance for Loan Losses ALL / Non Performing Loans 940 115.3% 945 94.5% N/A (1) Loans past due 30 days or more (2) Includes loans 90 days past due and still accruing interest |
|
|
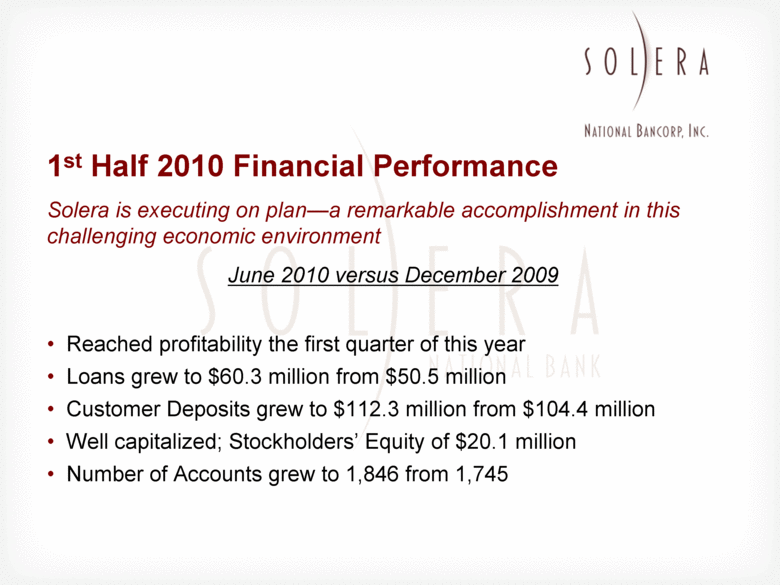
1st Half 2010 Financial Performance Solera is executing on plan—a remarkable accomplishment in this challenging economic environment June 2010 versus December 2009 Reached profitability the first quarter of this year Loans grew to $60.3 million from $50.5 million Customer Deposits grew to $112.3 million from $104.4 million Well capitalized; Stockholders’ Equity of $20.1 million Number of Accounts grew to 1,846 from 1,745 |
|
|
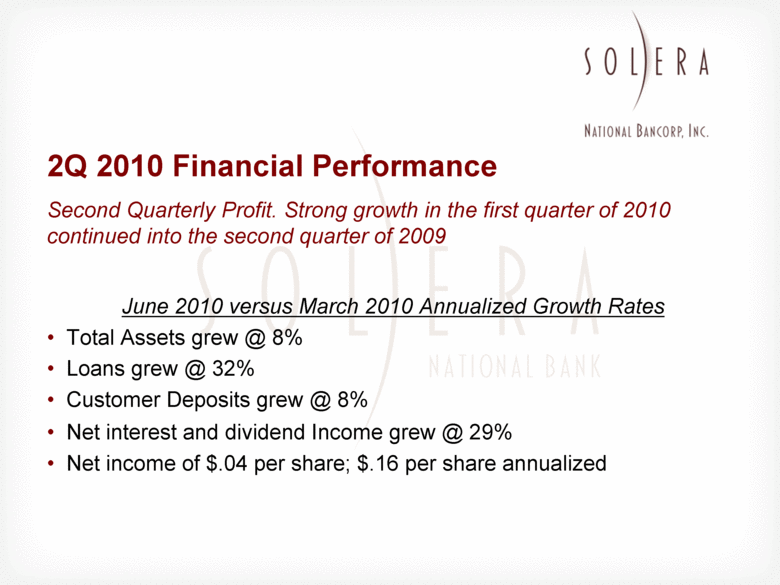
2Q 2010 Financial Performance Second Quarterly Profit. Strong growth in the first quarter of 2010 continued into the second quarter of 2009 June 2010 versus March 2010 Annualized Growth Rates Total Assets grew @ 8% Loans grew @ 32% Customer Deposits grew @ 8% Net interest and dividend Income grew @ 29% Net income of $.04 per share; $.16 per share annualized |
|
|
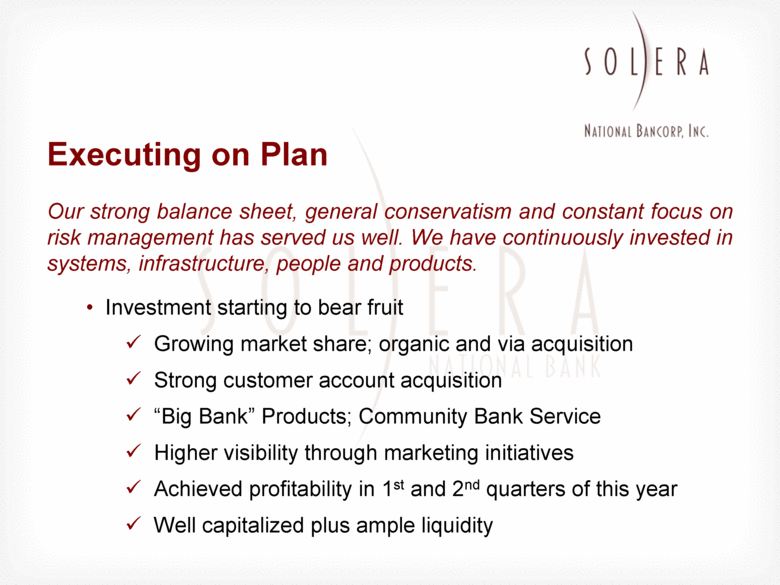
Executing on Plan Our strong balance sheet, general conservatism and constant focus on risk management has served us well. We have continuously invested in systems, infrastructure, people and products. Investment starting to bear fruit Growing market share; organic and via acquisition Strong customer account acquisition “Big Bank” Products; Community Bank Service Higher visibility through marketing initiatives Achieved profitability in 1st and 2nd quarters of this year Well capitalized plus ample liquidity |
|
|
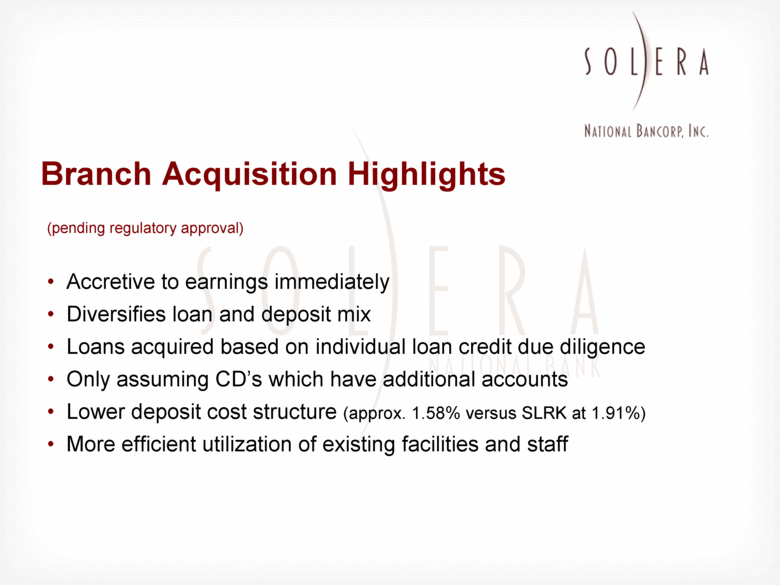
Branch Acquisition Highlights (pending regulatory approval) Accretive to earnings immediately Diversifies loan and deposit mix Loans acquired based on individual loan credit due diligence Only assuming CD’s which have additional accounts Lower deposit cost structure (approx. 1.58% versus SLRK at 1.91%) More efficient utilization of existing facilities and staff |
|
|
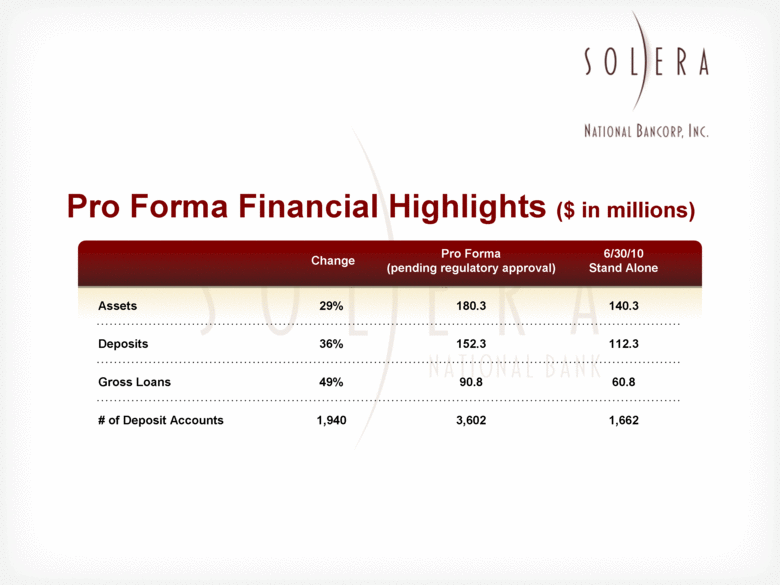
Pro Forma Financial Highlights ($ in millions) Change Pro Forma (pending regulatory approval) 6/30/10 Stand Alone Assets 29% 180.3 140.3 Deposits 36% 152.3 112.3 Gross Loans 49% 90.8 60.8 # of Deposit Accounts 1,940 3,602 1,662 |
|
|
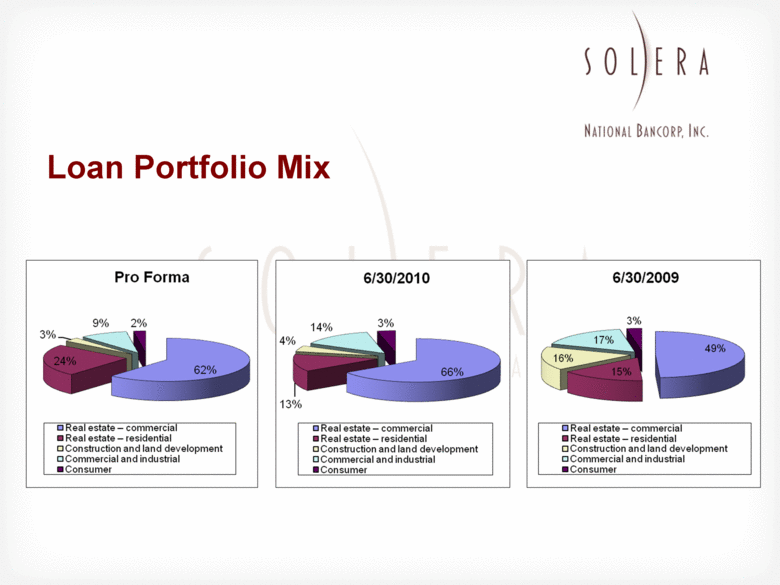
Loan Portfolio Mix |
|
|
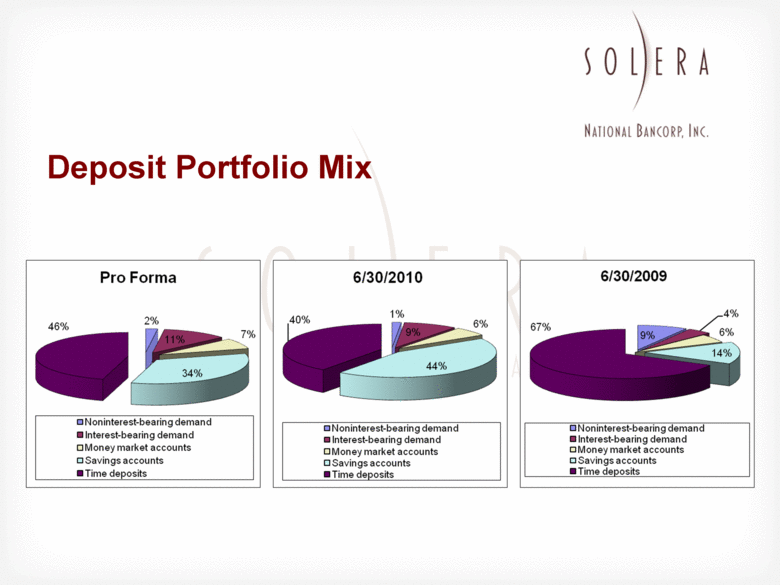
Deposit Portfolio Mix |
|
|
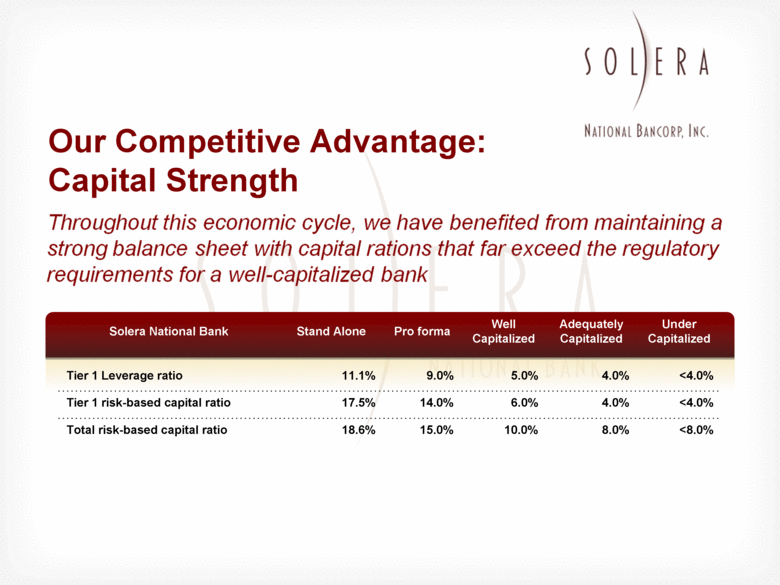
Our Competitive Advantage: Capital Strength Solera National Bank Stand Alone Pro forma Well Capitalized Adequately Capitalized Under Capitalized Tier 1 Leverage ratio 11.1% 9.0% 5.0% 4.0% <4.0% Tier 1 risk-based capital ratio 17.5% 14.0% 6.0% 4.0% <4.0% Total risk-based capital ratio 18.6% 15.0% 10.0% 8.0% <8.0% |
|
|
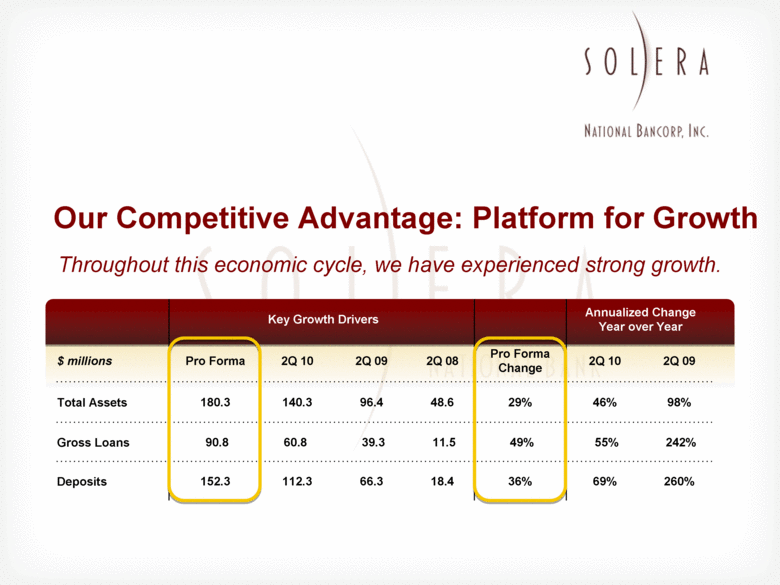
Our Competitive Advantage: Platform for Growth Throughout this economic cycle, we have experienced strong growth. Key Growth Drivers Annualized Change Year over Year $ millions Pro Forma 2Q 10 2Q 09 2Q 08 Pro Forma Change 2Q 10 2Q 09 Total Assets 180.3 140.3 96.4 48.6 29% 46% 98% Gross Loans 90.8 60.8 39.3 11.5 49% 55% 242% Deposits 152.3 112.3 66.3 18.4 36% 69% 260% |
|
|
Initiatives to Enhance Shareholder Value The management team is proactively pressing ahead with new business initiatives to drive top line growth, control expenses and grow long term profitability New Products A comprehensive banking package for the healthcare industry STEP – a new program to serve the needs of small businesses and contractors in the transportation sector Initiating expanded residential mortgage loan offerings CDARS® for investors seeking access to full FDIC insurance on deposits up to $50 million The addition of financial planning and wealth management services Accounts receivable financing for small to medium sized businesses |
|
|
Initiatives to Enhance Shareholder Value (contd.) Growing Interest Earning Assets of the Company Focus on growing our loan portfolio while maintaining prudent credit quality standards Will not compromise credit quality to grow loan portfolio Remain Diligent with Expense Control Our efficiency ratio has dramatically improved over the last year Our goal in the years ahead is to operate with an efficiency ratio at or better than industry standards |
|
|
Committed to the Fundamental Tenets of Banking Solera is benefiting from an increasing number of customers who embrace the “Back to Basics of Banking.” We have gained many new customers who seek the personalized services and localized decision making that a community bank like ours consistently provides Human Capital Strong Capital Ratios Ample Liquidity Prudent Risk Management Exceptional Client Service Quality Products and Services Effective Pricing Measured Growth Operational Efficiency Profitability |
|
|
Key Strengths: Investment Highlights Rapid growth in assets, deposits and the Bank’s loan portfolio under- score the extensive market opportunity and demonstrate the Bank’s ability to effectively win customers – validates Solera’s business model of inclusiveness Well-capitalized status Strong credit quality metrics Experienced senior management and an active, highly visible Board of Directors and Community Advisory Council Prudent growth and substitution of investment portfolio growth for loan growth as market conditions afford |
|
|
Key Strengths: Investment Highlights (contd.) Adequate loan loss allowance of 1.55% of gross loans with limited non-performing assets in 2Q 2010 Participating in one of the most vibrant and largest metro markets in the United States Focus on Denver-area Hispanic market, growing rapidly and increasingly affluent and successful |
|
|
What is Next for Solera: Integrate Branch Acquisition Focus on Profitability Commitment to growth balanced by sound underwriting, risk management practices |
|
|
The Light of a New Banking Era® Thank you for your time and interest |

