Attached files
| file | filename |
|---|---|
| 8-K - FORM 8-K - SUNTRUST BANKS INC | d8k.htm |
 SunTrust Banks, Inc.
Barclays Capital Global Financial Services Conference
September 14, 2010
Mark Chancy
Chief Financial Officer
Exhibit 99.1 |
 1
Important Cautionary Statement About Forward-Looking Statements
The following should be read in conjunction with the financial statements, notes and other information
contained in the Company’s 2009 Annual Report on Form 10-K, Quarterly Reports on Form10-Q, and
Current Reports on Form 8-K.
This presentation includes non-GAAP financial measures to describe SunTrust’s performance. The
reconciliations of those measures to GAAP measures are provided within or in the appendix of this
presentation. In this presentation, net interest income and net interest margin are presented on a
fully taxable-equivalent (“FTE”) basis, and ratios are presented on an annualized basis. The FTE basis
adjusts for the tax-favored status of income from certain loans and investments. The Company
believes this measure to be the preferred industry measurement of net interest income and provides
relevant comparison between taxable and non-taxable amounts.
This presentation contains forward-looking statements. Any statement that does not describe
historical or current facts, is a forward-looking statement. These statements often include the words
“believes,” “expects,” “anticipates,” “estimates,”
“intends,” “plans,” “goals,” “targets,” “initiatives,” “potentially,” “probably,” “projects,” “outlook” or similar expressions or future conditional verbs such
as “may,” “will,” “should,” “would,” and
“could.” Forward-looking statements are based upon the current beliefs and expectations of management and on information currently available to management. Our
statements speak as of the date hereof, and we do not assume any obligation to update these statements
or to update the reasons why actual results could differ from those contained in such statements
in light of new information or future events.
Forward-looking statements are subject to significant risks and uncertainties. Investors are
cautioned against placing undue reliance on such statements. Actual results may differ materially from those set
forth in the forward-looking statements. Factors that could cause actual results to differ
materially from those described in the forward-looking statements can be found in Item 1A of Part I of our 10-K and
in other periodic reports that we file with the SEC. Those factors include: our expense for regulatory
assessment may increase as a result of the passage of the Dodd-Frank Reform Act; difficult market
conditions have adversely affected our industry; recent levels of market volatility are unprecedented;
we are subject to capital adequacy guidelines and, if we fail to meet these guidelines, our financial
condition would be adversely affected; recently enacted legislation, or legislation enacted in the
future, or any proposed federal programs subject us to increased regulation and may adversely affect us;
we have not yet received permission to repay TARP funds; emergency measures designed to stabilize the
U.S. banking system are beginning to wind down; we are subject to credit risk; weakness in the
economy and in the real estate market, including specific weakness within our geographic footprint, has
adversely affected us and may continue to adversely affect us; weakness in the real estate market,
including the secondary residential mortgage loan markets, has adversely affected us and may continue
to adversely affect us; as a financial services company, adverse changes in general business or
economic conditions could have a material adverse effect on our financial condition and results of
operations; changes in market interest rates or capital markets could adversely affect our revenue and
expense, the value of assets and obligations, and the availability and cost of capital or liquidity;
the fiscal and monetary policies of the federal government and its agencies could have a material adverse
effect on our earnings; we may be required to repurchase mortgage loans or indemnify mortgage loan
purchasers as a result of breaches of representations and warranties, borrower fraud, or certain
borrower defaults, which could harm our liquidity, results of operations, and financial condition; we
may continue to suffer increased losses in our loan portfolio despite enhancement of our underwriting
policies; depressed market values for our stock may require us to write down goodwill; clients could
pursue alternatives to bank deposits, causing us to lose a relatively inexpensive source of funding;
consumers may decide not to use banks to complete their financial transactions, which could affect net
income; we have businesses other than banking which subject us to a variety of risks; hurricanes
and other natural disasters may adversely affect loan portfolios and operations and increase the cost
of doing business; negative public opinion could damage our reputation and adversely impact
business and revenues; we rely on other companies to provide key components of our business
infrastructure; the soundness of other financial institutions could adversely affect us; we rely on our
systems, employees, and certain counterparties, and certain failures could materially adversely affect
our operations; we depend on the accuracy and completeness of information about clients and
counterparties; we are subject to certain litigation, and our expenses related to this litigation may
adversely affect our results; regulation by federal and state agencies could adversely affect the business,
revenue, and profit margins; competition in the financial services industry is intense and could result
in losing business or reducing margins; future legislation could harm our competitive position;
maintaining or increasing market share depends on market acceptance and regulatory approval of new
products and services; we may not pay dividends on your common stock; our ability to receive
dividends from our subsidiaries accounts for most of our revenue and could affect our liquidity and
ability to pay dividends; significant legal actions could subject us to substantial uninsured liabilities;
recently declining values of real estate, increases in unemployment, and the related effects on local
economies may increase our credit losses, which would negatively affect our financial results;
deteriorating credit quality, particularly in real estate loans, has adversely impacted us and may
continue to adversely impact us; our allowance for loan losses may not be adequate to cover our eventual
losses; we will realize future losses if the proceeds we receive upon liquidation of nonperforming
assets are less than the carrying value of such assets; disruptions in our ability to access global capital
markets may negatively affect our capital resources and liquidity; in 2009 and 2010, credit rating
agencies downgraded the credit ratings of SunTrust Bank and SunTrust Banks, Inc., and these
downgrades and any subsequent downgrades could adversely impact the price and liquidity of our
securities and could have an impact on our businesses and results of operations; we have in the past
and may in the future pursue acquisitions, which could affect costs and from which we may not be able
to realize anticipated benefits; we depend on the expertise of key personnel, and if these individuals
leave or change their roles without effective replacements, operations may suffer; we may not be able
to hire or retain additional qualified personnel and recruiting and compensation costs may increase
as a result of turnover, both of which may increase costs and reduce profitability and may adversely
impact our ability to implement our business strategy; our accounting policies and processes are critical
to how we report our financial condition and results of operations, and require management to make
estimates about matters that are uncertain; changes in our accounting policies or in accounting
standards could materially affect how we report our financial results and condition; our stock price
can be volatile; our disclosure controls and procedures may not prevent or detect all errors or acts of
fraud; our financial instruments carried at fair value expose us to certain market risks; our revenues
derived from our investment securities may be volatile and subject to a variety of risks; and we may
enter into transactions with off-balance sheet affiliates or our subsidiaries.
|
 2
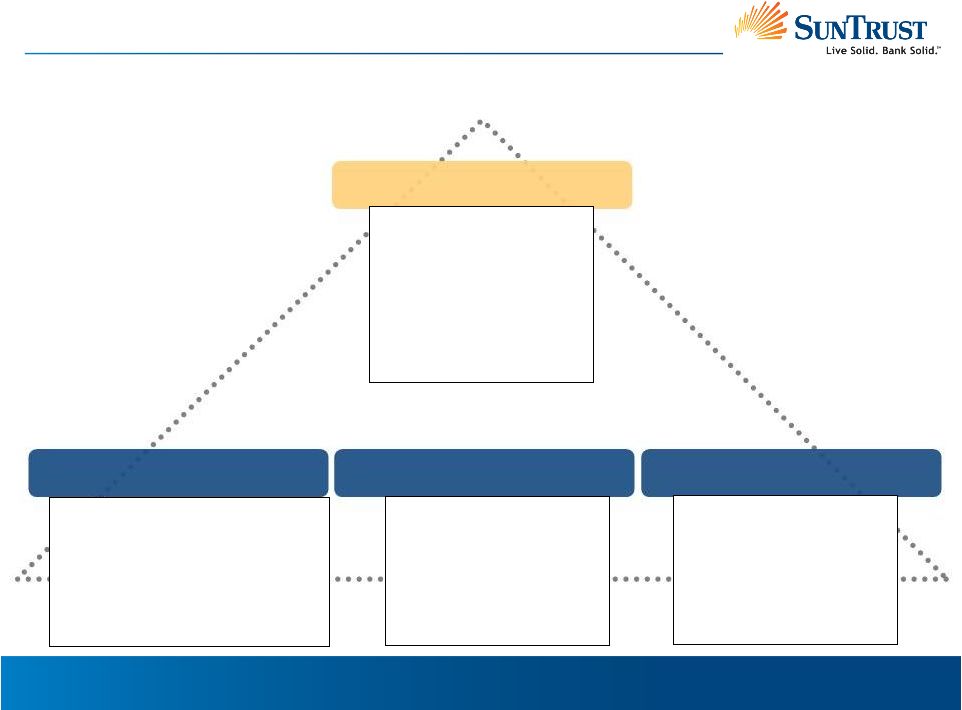
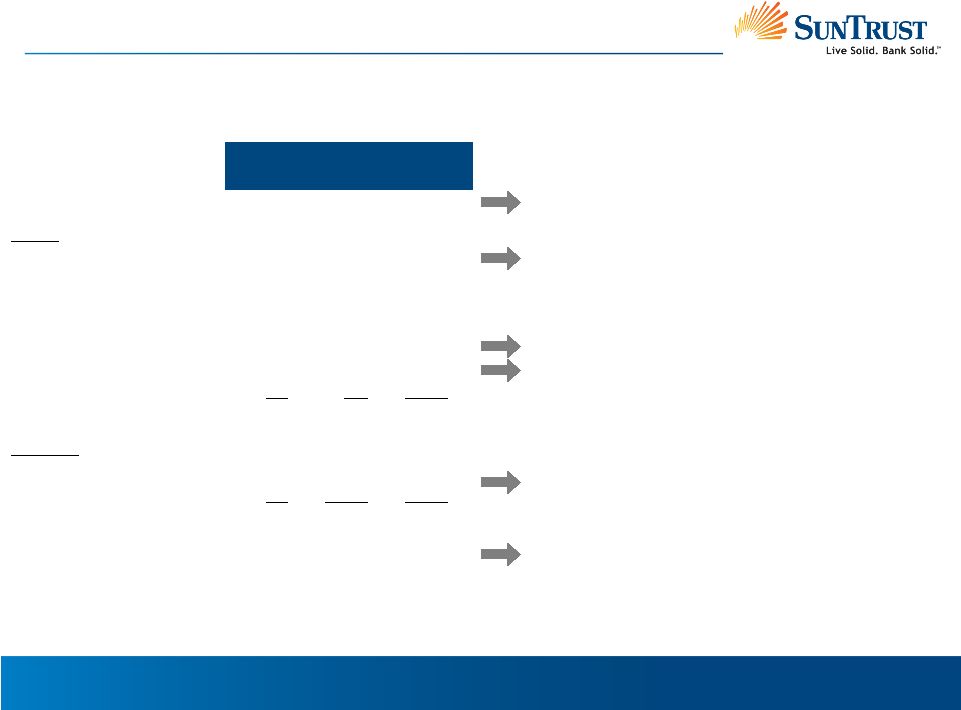
Investment Thesis
Stable Base Provides Solid Foundation for Future Growth
Large Diversified Franchise
Improved Results and Capital
Structure
Strengthened Credit and Risk
Profile
Growth Strategies
•
Diversify the balance
sheet
•
Optimize business mix
•
Improve expense
efficiency
•
Grow market share
•
High market share in attractive
growth markets
•
Diversified business and product
mix
•
Diversified credit profile
•
Improved credit trends
•
Enhanced risk profile
•
Improved core results
•
Funding mix improved
with large, stable deposit
base
•
Solid capital ratios |
 3
Projected
Population
Growth
4
1.
Source: SNL Financial, as of June 30, 2010 based on MSAs
2.
As of 6/30/2010
3.
Source: SNL Financial---projected household income change,
2010-2015, MSA + counties not in any MSA 4.
Source: SNL Financial---five-year population growth, 2010-2015,
MSA + counties not in any MSA SunTrust Footprint
Attractive Geographic Profile In Higher Growth Markets
•
Ranked top 3 in 20 of the top 25 SunTrust markets
1
–
Top 25 represents 86% of total MSA deposits
–
Top 25 average deposit market share is 14%
•
1,675 branches serving communities with attractive overall growth
prospects
2
•
Projected household income growth is above the U.S. average
3
Superior Banking Footprint
0.6%
0.9%
1.5%
2.2%
2.9%
3.5%
3.7%
3.8%
4.5%
5.6%
6.4%
MTB
PNC
CMA
KEY
FITB
MI
COF
USB
RF
BBT
STI
WFC
6.2% |
 4
Diversified Business Mix
Retail Banking
Scope
of
Operations
Market
Focus
1.
As of 6/30/10
•
Footprint
•
1,675 branches
1
•
2,902 ATMs
1
•
Consumer lending
•
Retail clients in
SunTrust footprint
•
Business clients
with <$5MM in
revenue (<$10MM
in major markets)
Well Diversified Business Mix
•
National with focus
on selected industry
sectors
•
Full line of traditional
banking and
investment banking
services
•
Large Corporate:
>$750MM in
revenue
•
Capital markets
services for
Commercial,
Middle Market and
CRE clients
•
Primarily footprint
•
Full array of wealth
management
products and
professional
services to national,
individual and
institutional clients
•
AUA = $201B
1
•
Individuals and
families in need of
private wealth
management
•
Organizations in
need of
administrative and
investment
solutions
Wealth and
Investment
Management
Corporate and
Investment Banking |
 5
Diversified Business Mix
Commercial Real
Estate
Scope
of
Operations
Market
Focus
•
National
•
Residential
mortgages
•
Mortgage servicing
portfolio of $178B
•
Prime-based
platform; ~100% of
2Q 2010
originations for sale
were agency
•
54% of production in
2Q 2010 was retail
originated
•
Footprint
•
Full line of banking
and investment
banking services
•
Commercial real
estate developers
and investors
•
Class A,
institutional grade
properties
Well Diversified Business Mix
•
Primarily footprint
•
Full line of lending,
capital markets,
commercial card,
treasury and payment
solutions
•
Commercial: $5MM-
$100MM in revenue
•
Middle
Market:
$100MM-$750MM in
revenue
•
Not-for-Profit &
Government Entities
•
Asset Based
Lending and
Leasing
1.
As of 6/30/10
Mortgage
Diversified
Commercial Banking
1 |
 6
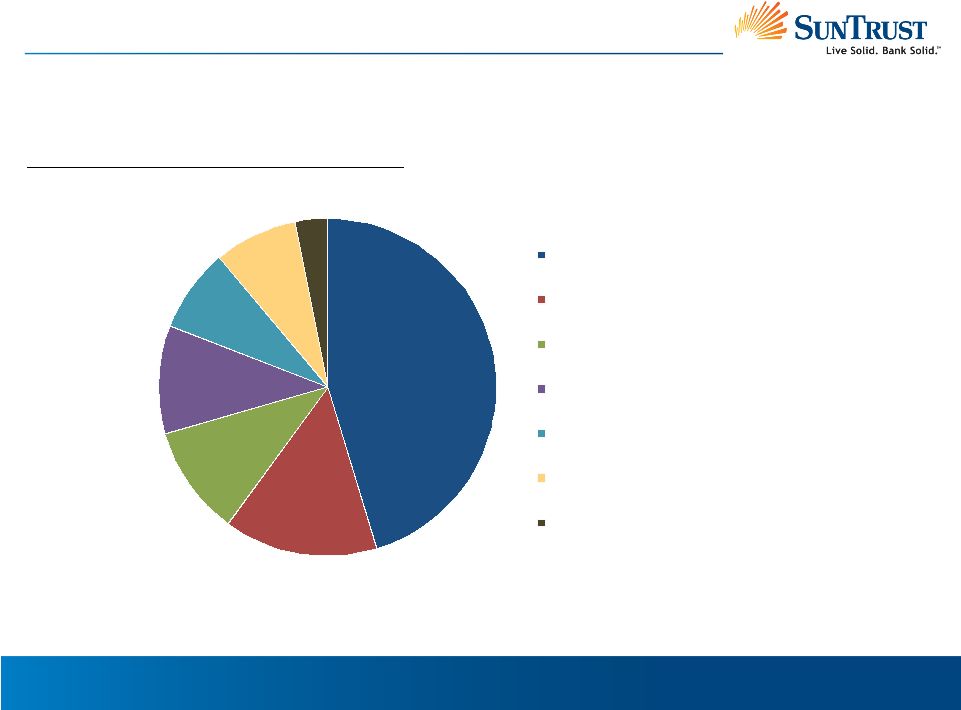
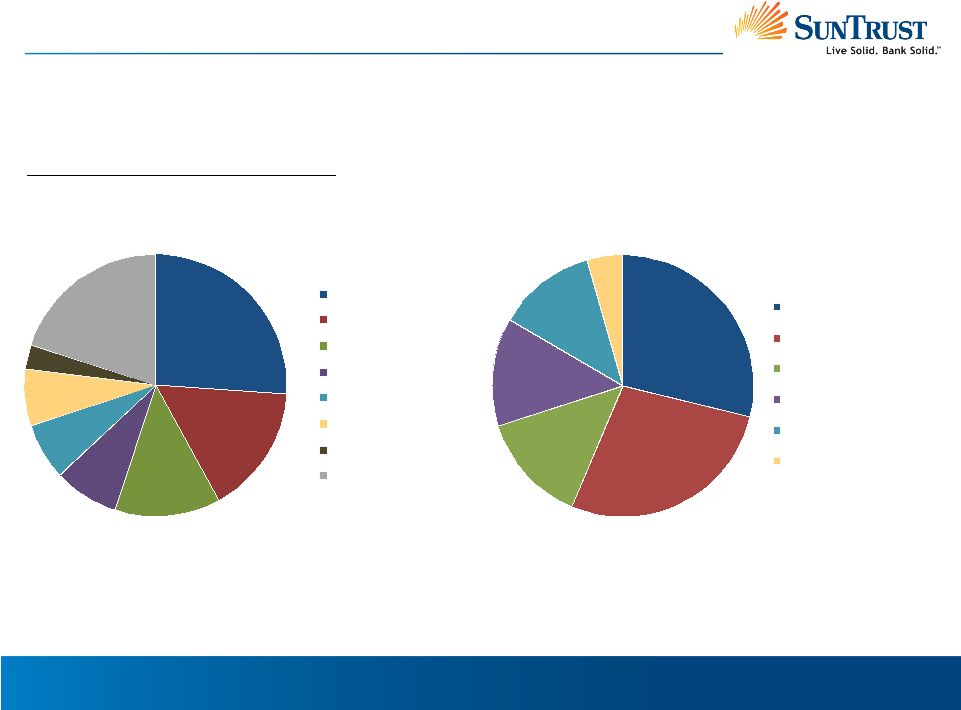
Diversified Business and Product Mix
Well Diversified Business and Product Mix
Total Revenue, Six Months Ended 6/30/10
45%
15%
11%
10%
8%
8%
3%
Retail Banking
Wealth and Investment Management
Corporate and Investment Banking
Diversified Commercial Banking
Mortgage
Corporate Other and Treasury
Commercial Real Estate |
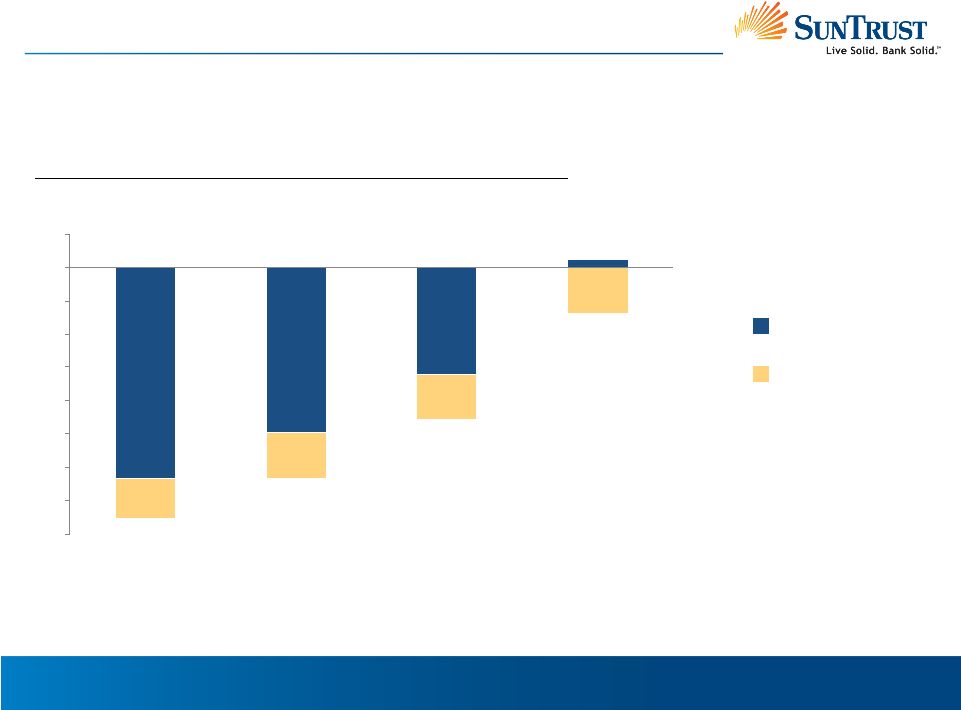 7
$(400)
$(350)
$(300)
$(250)
$(200)
$(150)
$(100)
$(50)
$-
$50
3Q 2009
4Q 2009
1Q 2010
2Q 2010
Preferred Dividends
Improved Results
Losses Improved Significantly, Operating Trends Are Encouraging
Net Loss Available to Common Shareholders ($ in Millions)
Net Income/Loss
$(377)
$(316)
$(229)
$(56) |
 8
$163 Billion
June 30, 2010
Large, Stable Deposit Base Primary Source of Liquidity
1. Includes Fed Funds, Repos, and other short-term borrowings
Diversified Sources of Funding
$172 Billion
December 31, 2008
Core Deposits 61%
Other Deposits 5%
Short-Term Borrowings
5%
Long-Term Borrowings 16%
Capital 13%
Core Deposits 71%
Other Deposits 1%
Short-Term Borrowings
4%
Long-Term Borrowings 10%
Capital 14%
1
1 |
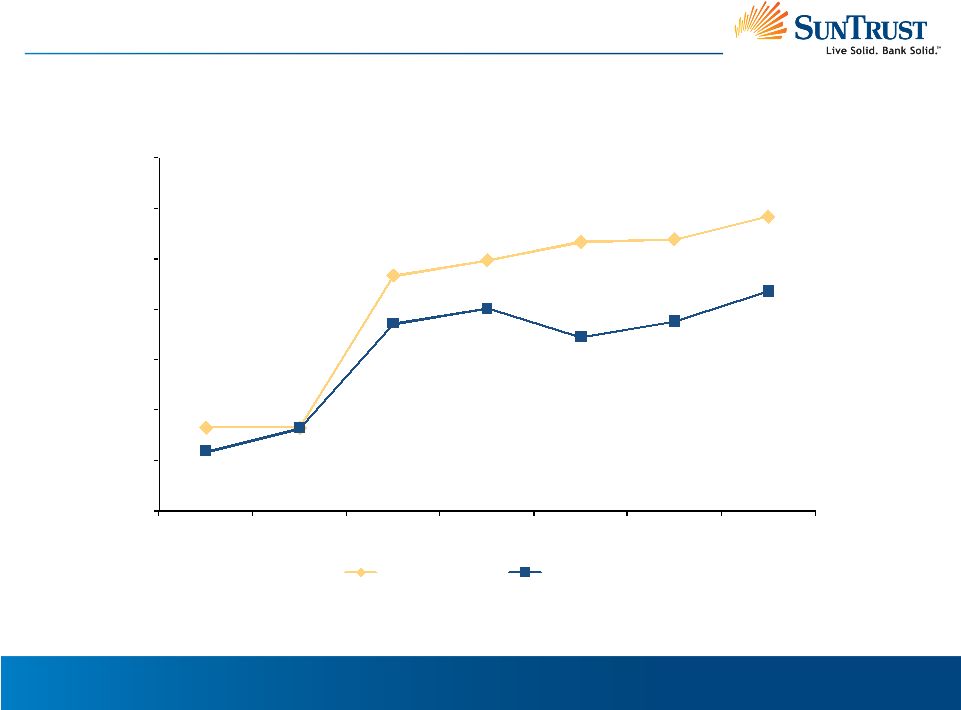 9
5.83%
5.83%
7.34%
7.49%
7.67%
7.70%
7.92%
5.59%
5.82%
6.86%
7.01%
6.73%
6.88%
7.18%
5.00%
5.50%
6.00%
6.50%
7.00%
7.50%
8.00%
8.50%
4Q 2008
1Q 2009
2Q 2009
3Q 2009
4Q 2009
1Q 2010
2Q 2010
Tier 1 Common
TCE
Improved Capital Ratios
Capital Ratios
1.
Tangible common equity to tangible assets; please refer to the appendix to this
presentation for a reconcilement to the most directly comparable GAAP financial
measure
1 |
 10
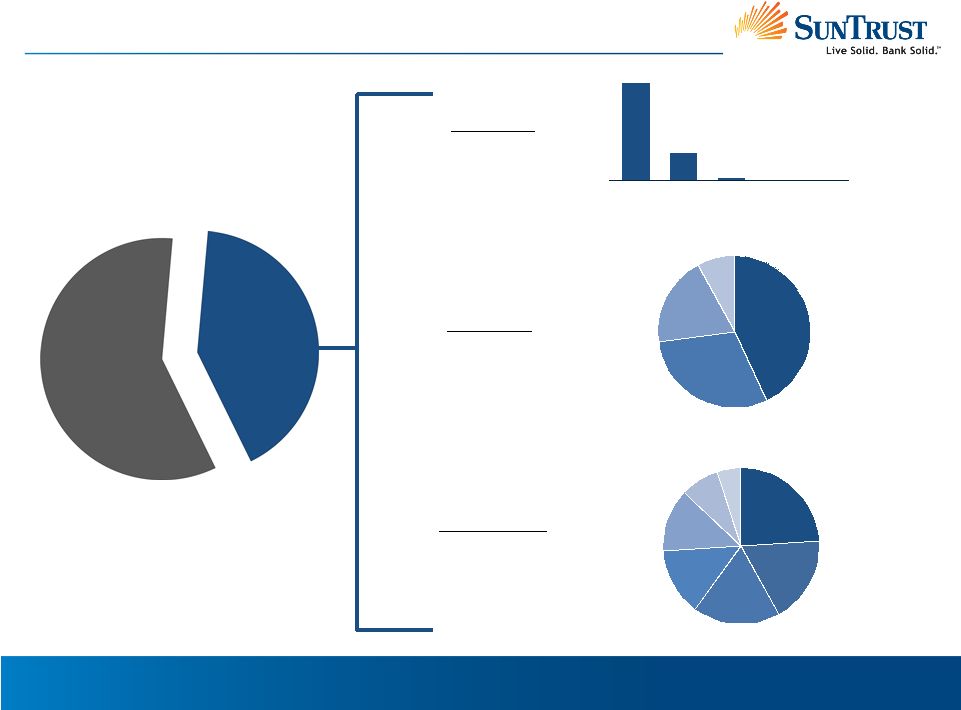
Diversified Portfolio
Loan
Portfolio
6/30/2010:
$112,925
Loan Portfolio is Well Diversified by Geography and Product Type
1
($ in millions)
26%
16%
13%
8%
7%
7%
3%
20%
Florida
Georgia
Virginia
North Carolina
Maryland
Tennessee
South Carolina
Outside of Footprint
29%
28%
14%
13%
12%
4%
Commercial
Residential Mortgage
Home Equity Lines
Commercial Real Estate
Consumer
Construction
Note: Geographic distribution excludes $1.0 billion credit card portfolio and $3.7 billion
student loan portfolio 1. Includes credit card portfolio of $1.0 billion
|
 11
Geography
Property Type
Granularity
4,438
1,252
71
19
13
$<1MM
$1MM-
$10MM
$10MM-
$20MM
$20MM-
$30MM
$30MM+
41% Investor Owned Portfolio is Well Diversified
Commercial Real Estate Portfolio
$1MM Average Loan Size
($ in millions)
Mid-Atlantic
43%
Central
30%
Florida
19%
National
8%
Retail
24%
Office
18%
Multifamily
18%
Special
Purpose Real
Estate
14%
Warehouse/
Industrial
13%
Hotels/
Motels
8%
Other
5%
Note: Data as of 2Q 2010
Investor
Owned
$6,257
41%
Owner
Occupied
$8,877
59% |
 12
Diversified Portfolio
Net
Charge-Offs
2Q
2010:
$722
Asset Quality Issues Remain Concentrated in Residential Real Estate Related
Portfolios 1. Includes credit card portfolio which had net charge-offs of
$21 million Nonaccrual
Loans
2Q
2010:
$4,699
1
($ in millions)
40%
21%
19%
12%
6%
2%
Residential Mortgage
Construction
Home Equity Lines
Commercial
Consumer
Commercial Real Estate
45%
29%
6%
8%
1%
11%
Residential Mortgage
Construction
Home Equity Lines
Commercial
Consumer
Commercial Real Estate |
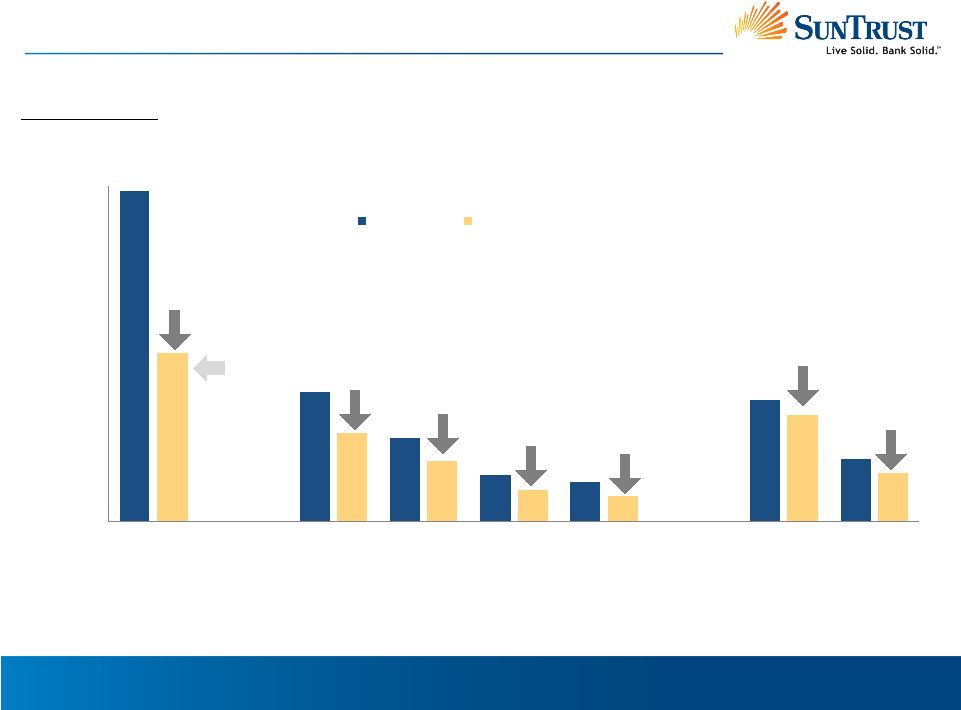 13
Higher
Risk
Portfolio
Segments
Significantly
Reduced
Higher Risk Segment Loan Balances Reduced 35%
$0
$2,000
$4,000
$6,000
$8,000
$10,000
Construction
Prime 2nd
Home Equity
Loans
Lot Loans
Alt-A
High LTV
Broker
Originated
12/31/2008
06/30/2010
49%
Residential Mortgage
Home Equity Lines
Loan Balances
31%
28%
33%
36%
12%
22%
Construction
43% Commercial
57% Residential
($ in millions, period end balances) |
 14
$2,839
$2,942
$2,587
$2,415
$2,074
$1,876
$1,992
Delinquencies
Delinquencies Have Been Trending Down
$539
$756
$690
$644
$521
$532
$588
$2,300
$2,186
$1,897
$1,771
$1,553
$1,344
$1,404
4Q 2008
1Q 2009
2Q 2009
3Q 2009
4Q 2009
1Q 2010
2Q 2010
90 DPD Loans
30-
89 DPD Loans |
 15
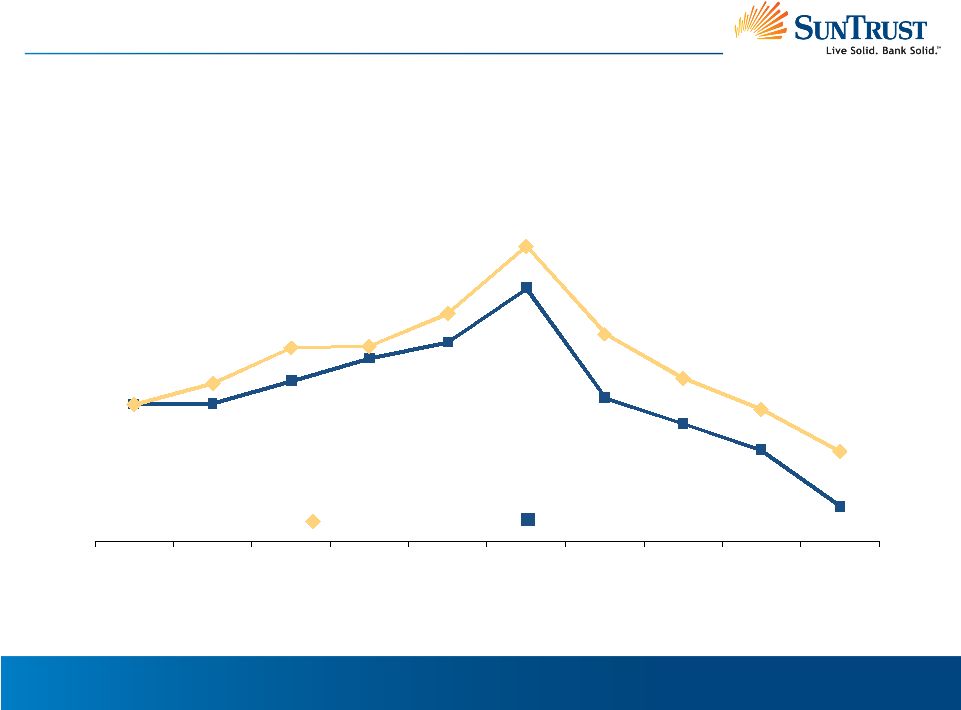
Nonperforming Loan Trends
1. NPL formation is current quarter charge-offs plus sequential quarter change
in NPL’s, and NPL plus TDR formation is the same calculation plus the sequential
quarter change in accruing restructured loans (TDR’s)
($ in millions)
$905
$910
$1,056
$1,203
$1,311
$1,664
$946
$779
$603
$236
$906
$1,043
$1,274
$1,285
$1,500
$1,938
$1,365
$1,076
$870
$597
1Q 2008
2Q 2008
3Q 2008
4Q 2008
1Q 2009
2Q 2009
3Q 2009
4Q 2009
1Q 2010
2Q 2010
NPL Formation
NPL + TDR Formation
Four
Quarter
Trend
of
Declining
Problem
Loan
Formation
1 |
 16
Accruing Troubled Debt Restructures Trends
87% of Accruing TDRs are Current and 98% are Consumer Loans
($ in millions, period end balances)
Accruing TDRs
$1,641
$1,909
$2,269
$1,390
$1,682
$1,980
$125
$125
$155
$126
$102
$134
4Q 2009
1Q 2010
2Q 2010
Current
30 DPD
60+ DPD |
 17
Allowance for Loan and Lease Losses
Increased Reserve Levels
0.00%
0.50%
1.00%
1.50%
2.00%
2.50%
3.00%
$-
$500
$1,000
$1,500
$2,000
$2,500
$3,000
$3,500
1Q 2008
2Q 2008
3Q 2008
4Q 2008
1Q 2009
2Q 2009
3Q 2009
4Q 2009
1Q 2010
2Q 2010
ALLL
Loan Coverage Ratio |
 18
Net Charge-Offs and Loan Coverage Ratios
The Loan Coverage Ratio Continued to Increase and Exceeded the Net Charge-Off
Ratio in 2Q 2010 0.00%
0.50%
1.00%
1.50%
2.00%
2.50%
3.00%
3.50%
1Q 2008
2Q 2008
3Q 2008
4Q 2008
1Q 2009
2Q 2009
3Q 2009
4Q 2009
1Q 2010
2Q 2010
NCO Ratio
Loan Coverage Ratio |
 19
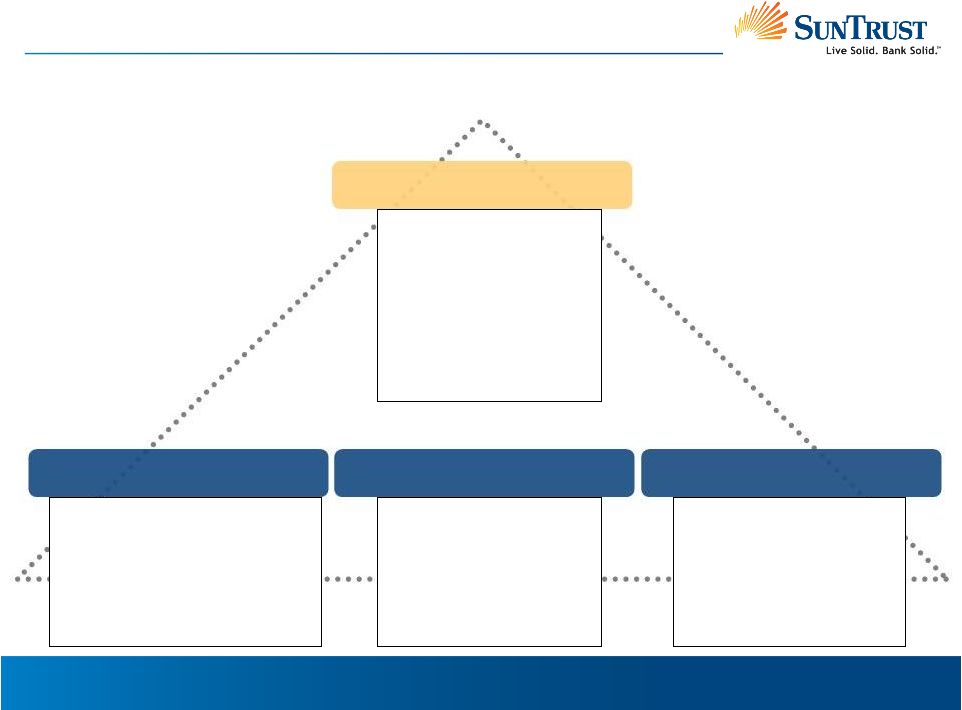
Mission and Values
SunTrust’s Mission is Supported by a Core Set of Values Which Underlie the
Corporate Strategies Values |
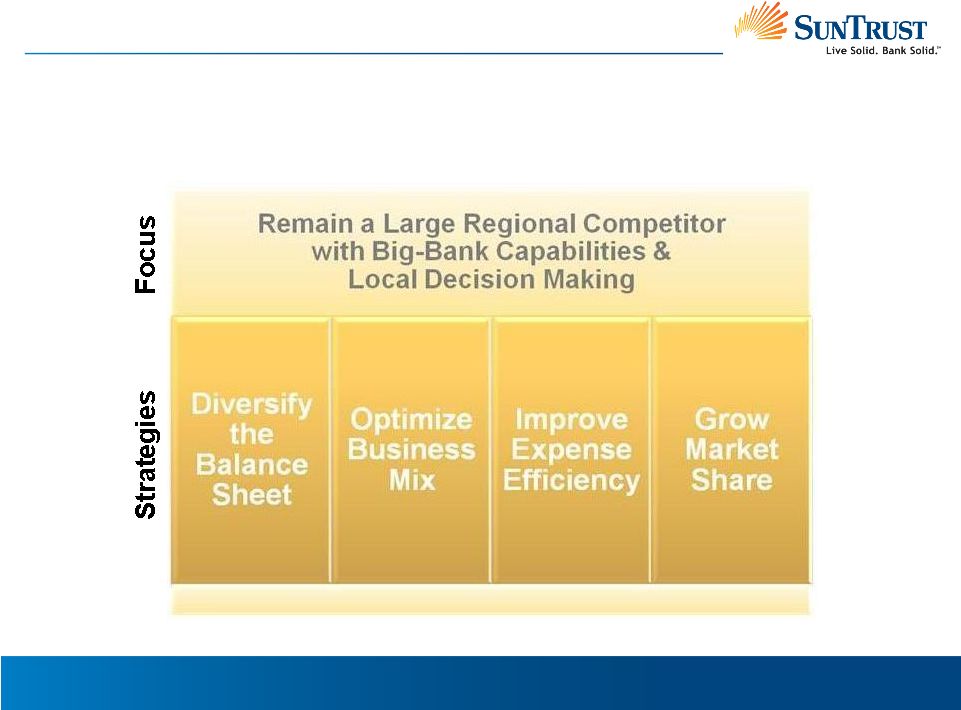 20
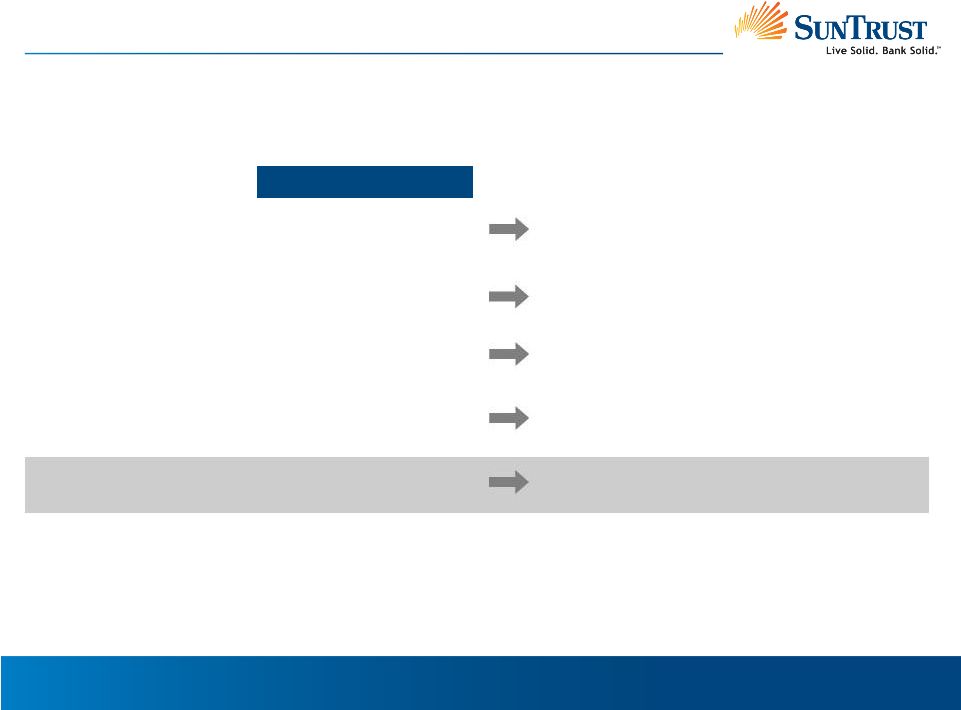
Strategies
SunTrust Has a Set of Strategies That Will Drive Future Performance
|
 21
Used Increased Liquidity to Reduce Higher Cost Funding and Increase Securities
Portfolio Balance
Sheet
Diversity
and
Business
Mix
Optimization
1.
Includes credit card portfolio comprised of consumer and commercial card
balances •
High quality securities portfolio increased due to strong
liquidity
and 4Q 2009 addition of $5 billion U.S.
Treasury securities held for TARP repayment
Securities Available for Sale
Loans
Commercial
Mortgage
Home Equity
Commercial Real Estate
Construction
Consumer Direct
1
Consumer Indirect
Loans
Deposits
Client Deposits
Brokered and Foreign
Total Deposits
Long-Term Debt
$27.6
32.5
31.1
15.4
15.2
5.0
6.7
7.0
$112.9
$116.3
2.4
$118.7
$15.7
40%
(21)%
(3)%
(6)%
2%
(49)%
10%
8%
(11)%
10%
(70)%
5%
(41)%
10%
(6)%
(8)%
9%
21%
(64)%
49%
(12)%
(7)%
17%
(90)%
(4)%
(17)%
($ in billions, period end balances)
•
Commercial
portfolio
targeted
for
growth;
however,
lower client line utilization drove a decrease in
outstanding balances
•
Construction loans decreased over 60%
since 2006
•
Increase in client deposits
enabled a significant
reduction in brokered and foreign deposits
•
Repayment of over $7 billion in FHLB advances
in
2009 and $900 million in the first half of 2010
•
Consumer direct increased nearly 50%
since 2006
2Q 2010
4Q 2008
% Change
4Q 2006
% Change |
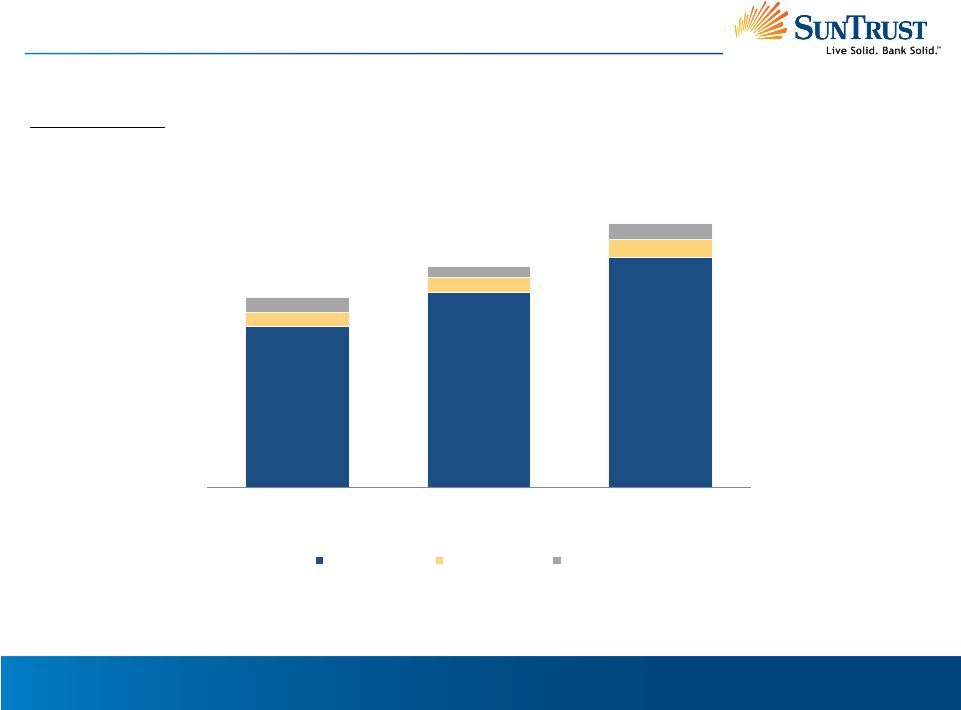
 22
Expense Efficiency Focus
Improving Efficiency and Productivity
1.
Includes approximately 1,500 positions transitioned to a third party provider
contracted for certain check and related processing operations 2.
Appendix includes reconciliation of non-GAAP numbers and details of adjustments
and cyclical expenses 2009
2008 2006 Delivered Over $600MM in
Run-Rate Expense Savings, or 12% of 2006 Noninterest Expense Base ($ in
millions) Employees
Total Expenses
Expenses Excl. Adjustments
2
Cyclical Expenses
2
Expenses Excl. Adjustments
and Cyclical
2
28,001
$6,562
$5,687
$1,083
$4,605
29,333
$5,879
$5,659
$966
$4,693
33,599
$4,867
$4,855
$247
$4,609
•
Reduced
FTEs by nearly
5,600, or 17%,
since 2006
•
Cyclical expenses
up over $800MM
in 2009 vs. 2006
•
Expenses
flat
vs. 2006 and
down 2%
vs. 2008
•
Nonrecurring and cyclical expenses are masking
decreased operating expenses
•
2009 expenses impacted by
$751MM noncash
goodwill impairment
1 |
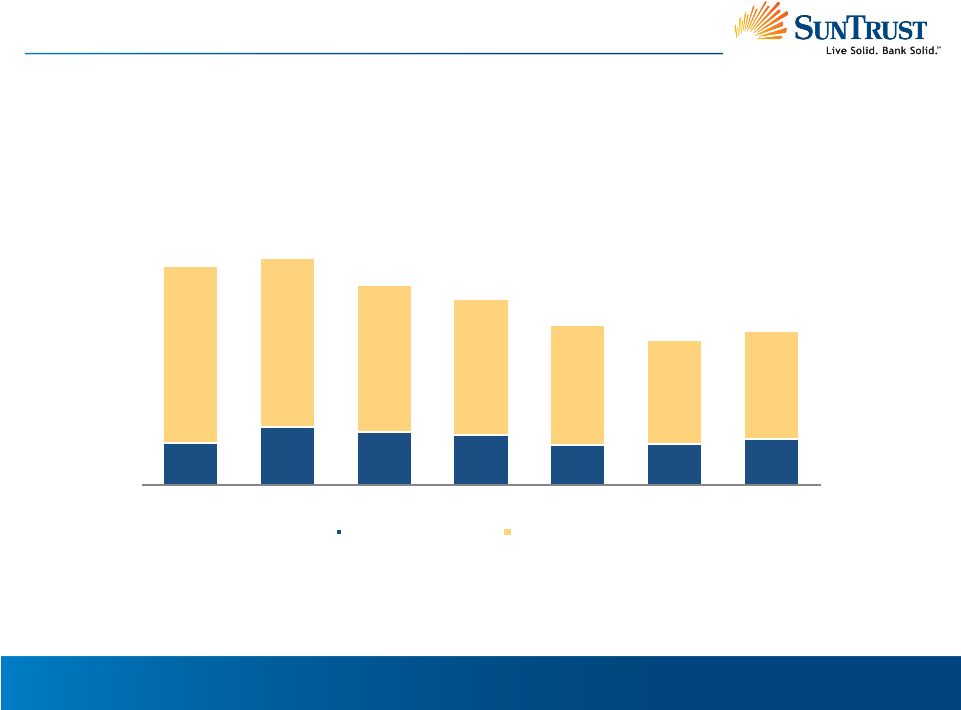
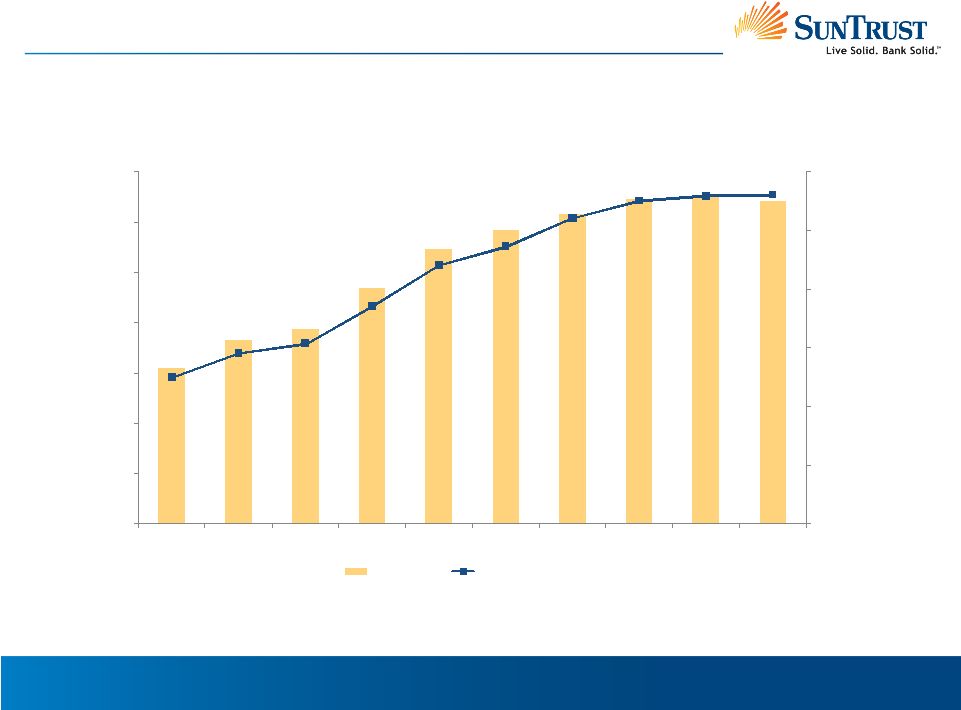
 23
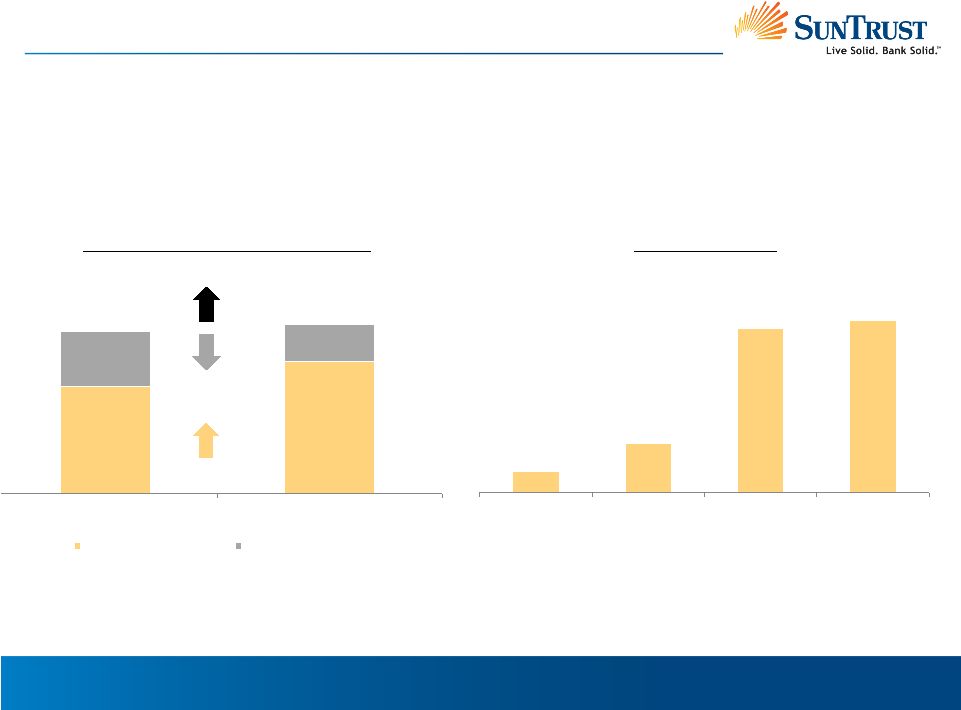
$74,961
$92,420
$38,367
$26,248
Q4 2008
Q2 2010
Low Cost Deposits
High Cost Deposits
$113,328
23%
Deposit Growth
Efforts to Grow Low Cost Deposits and Households Is Yielding Results
($ in millions)
Deposit Growth and Mix Improvement
32%
$118,668
5%
Household Growth
0.5%
1.2%
4.1%
4.3%
2009 US HH
Growth
2009 STI
Footprint HH
Growth
2009 STI Net HH
Growth
2010 STI
Annualized Net
HH Growth
1.
Source: 2008 & 2009 Nielsen Claritas Demographic Update
2.
Retail Banking line of business checking households
1
1
2
2 |
 24
Investment Thesis
Stable Base Provides Solid Foundation for Future Growth
Large Diversified Franchise
Growth Strategies
Improved Results and Capital
Structure
Strengthened Credit and Risk
Profile
•
Diversify the balance
sheet
•
Optimize business mix
•
Improve expense
efficiency
•
Grow market share
•
High market share in attractive
growth markets
•
Diversified business and product
mix
•
Improved core results
•
Funding mix improved
with large, stable deposit
base
•
Solid capital ratios
•
Diversified credit profile
•
Improved credit trends
•
Enhanced risk profile |
 SunTrust Banks, Inc.
Barclays Capital Global Financial Services Conference
September 14, 2010
Mark Chancy
Chief Financial Officer |
 26
Appendix |
 27
($ in millions, except per share data)
Reconciliation of Non GAAP Measures
June 30
March 31
December 31
September 30
June 30
March 31
December 31
2010
2010
2009
2009
2009
2009
2008
Total shareholders'
equity
$23,024
$22,620
$22,531
$22,908
$22,953
$21,646
$22,501
Goodwill, net of deferred
taxes
(6,197)
(6,202)
(6,204)
(6,205)
(6,213)
(6,225)
(6,941)
Other intangible assets including MSRs, net of deferred taxes
(1,409)
(1,761)
(1,671)
(1,560)
(1,468)
(1,049)
(978)
MSRs
1,298
1,641
1,539
1,423
1,322
895
810
Tangible
equity
16,716
16,298
16,195
16,566
16,594
15,267
15,392
Preferred stock
(4,929)
(4,923)
(4,917)
(4,911)
(4,919)
(5,227)
(5,222)
Tangible common equity
$11,787
$11,375
$11,278
$11,655
$11,675
$10,039
$10,170
Total
assets
$170,668
$171,796
$174,165
$172,718
$176,735
$179,116
$189,138
Goodwill
(6,323)
(6,323)
(6,319)
(6,314)
(6,314)
(6,309)
(7,044)
Other intangible assets including
MSRs
(1,443)
(1,800)
(1,711)
(1,604)
(1,517)
(1,103)
(1,035)
MSRs
1,298
1,641
1,539
1,423
1,322
895
810
Tangible
assets
$164,200
$165,314
$167,674
$166,223
$170,226
$172,598
$181,870
Tangible equity to tangible assets
¹
10.18
%
9.86
%
9.66
%
9.96
%
9.75
%
8.85
%
8.46
Tangible common equity to tangible
assets² 7.18
%
6.88
%
6.73
%
7.01
%
6.86
%
5.82
%
5.59
%
Tangible book value per common
share³ $23.58
$22.76
$22.59
$23.35
$23.41
$28.15
$28.69
Three Months Ended
%
1. SunTrust presents a tangible equity to tangible assets ratio that excludes the after-tax
impact of purchase accounting intangible assets. The Company believes this measure is
useful to investors because, by removing the effect of intangible assets that result from merger and
acquisition activity (the level of which may vary from company to company), it allows investors
to more easily compare the Company's capital adequacy to other companies in the industry. This measure is used by management to analyze capital adequacy.
2. SunTrust presents a tangible common equity to tangible assets ratio that excludes preferred
stock from tangible equity. The Company believes this measure is useful to investors
because, by removing the preferred stock (the level of which may vary from company to company), it
allows investors to more easily compare the Company's capital adequacy to other companies in
the industry who also use this measure. This measure is also used by management to analyze capital adequacy.
3. SunTrust presents a tangible book value per common share that excludes the after-tax
impact of purchase accounting intangible assets and also excludes preferred stock from tangible
equity. The Company believes this measure is useful to investors because, by removing the effect of intangible assets that result from merger and acquisition activity as
well as preferred stock (the level of which may vary from company to company), it allows investors to
more easily compare the Company's book value on common stock to other companies in the
industry. |
 28
($ in millions)
Reconciliation of Non GAAP Measures
1.
Adjusted expense is provided as the removal of certain items that are material and
potentially non-recurring is useful to investors and management in comparing among institutions and in
evaluating expense trends
2.
Expense excluding adjustments and cyclical is provided as it removes expenses that
are cyclical in nature and is useful to investors and management in assessing the impact of the
recession on non-interest expenses and earnings, and facilitates analysis of
the effectiveness of management in controlling expense growth $
%
$
%
2009
2008
2006
2009 vs 2008
2009 vs 2008
2009 vs 2006
2009 vs 2006
Employees
28,001
29,333
33,599
(1,332)
(5)%
(5,598)
(17)%
Total Expenses
6,562
$
5,879
$
4,867
$
683
$
12%
1,695
$
35%
Adjustment Items:
Impairment
751
45
-
(Gain)/Loss on Debt Retirement
39
12
12
Coke Charitable Contribution
-
183
-
Visa Litigation
7
(34)
-
Merger Expense
-
13
-
FDIC Special Assessment
78
-
-
Total Adjustments
875
220
12
Adjusted Expenses
5,687
$
5,659
$
4,855
$
28
$
1%
832
$
17%
Cyclical Items:
Regulatory Assessments
224
55
23
Credit & Collection Services
259
156
102
Other Real Estate
244
105
-
Mortgage Reinsurance
115
180
-
Operating Losses
100
446
45
Pension Expense
141
24
78
Total Cyclical Expenses
1,083
966
247
117
12%
836
339%
Expenses Excl Adjustments & Cyclical
4,605
$
4,693
$
4,609
$
(88)
$
(2)%
(4)
$
0% |