Attached files
Use these links to rapidly review the document
K-SEA TRANSPORTATION PARTNERS L.P. 2010 ANNUAL REPORT ON FORM 10-K TABLE OF CONTENTS
Table of Contents
UNITED STATES
SECURITIES AND EXCHANGE COMMISSION
Washington, D.C. 20549
FORM 10-K
ý |
ANNUAL REPORT PURSUANT TO SECTION 13 OR 15(d) OF THE SECURITIES EXCHANGE ACT OF 1934 |
|
For the fiscal year ended June 30, 2010 |
||
OR |
||
o |
TRANSITION REPORT PURSUANT TO SECTION 13 OR 15(d) OF THE SECURITIES EXCHANGE ACT OF 1934 |
|
Commission file number 001-31920
K-SEA TRANSPORTATION PARTNERS L.P.
(Exact name of registrant as specified in its charter)
| Delaware (State or other jurisdiction of incorporation or organization) |
20-0194477 (I.R.S. Employer Identification No.) |
One Tower Center Boulevard, 17th Floor
East Brunswick, New Jersey 08816
(Address of principal executive offices and zip code)
(732) 565-3818
(Registrant's telephone number, including area code)
Securities registered pursuant to Section 12(b) of the Act:
| Title of each class | Name of each exchange on which registered | |
|---|---|---|
| Common Units | New York Stock Exchange |
Securities registered pursuant to section 12(g) of the Act: None
Indicate by check mark if the registrant is a well-known seasoned issuer, as defined in Rule 405 of the Securities Act. Yes o No ý
Indicate by check mark if the registrant is not required to file reports pursuant to Section 13 or Section 15(d) of the Exchange Act. Yes o No ý
Indicate by check mark whether the registrant (1) has filed all reports required to be filed by Section 13 or 15(d) of the Securities Exchange Act of 1934 during the preceding 12 months (or for such shorter period that the registrant was required to file such reports) and (2) has been subject to such filing requirements for the past 90 days. Yes ý No o
Indicate by check mark whether the registrant has submitted electronically and posted on its corporate Web site, if any, every Interactive Data File required to be submitted and posted pursuant to Rule 405 of Regulation S-T (§ 232.405 of this chapter) during the preceding 12 months (or for such shorter period that the registrant was required to submit and post such files). Yes o No o
Indicate by check mark if disclosure of delinquent filers pursuant to Item 405 of Regulation S-K is not contained herein, and will not be contained, to the best of registrant's knowledge, in definitive proxy or information statements incorporated by reference in Part III of this Form 10-K or any amendment to this Form 10-K. o
Indicate by check mark whether the registrant is a large accelerated filer, an accelerated filer, a non-accelerated filer, or a smaller reporting company. See definitions of "large accelerated filer", "accelerated filer" and "smaller reporting company" in Rule 12b-2 of the Exchange Act.
| Large accelerated filer o | Accelerated filer ý | Non-accelerated filer o (Do not check if a smaller reporting company) |
Smaller reporting company o |
Indicate by check mark whether the registrant is a shell company (as defined in Rule 12b-2 of the Exchange Act). Yes o No ý
The aggregate market value of the registrant's Common Units held by non-affiliates of the registrant was approximately $170.8 million as of December 31, 2009 based on $11.58 per Common Unit, the closing price of the Common Units on the New York Stock Exchange on such date.
At September 13, 2010, 19,127,411 Common Units were outstanding.
Documents Incorporated by Reference: None
K-SEA TRANSPORTATION PARTNERS L.P.
2010 ANNUAL REPORT ON FORM 10-K
TABLE OF CONTENTS
i
Statements included in this report that are not historical facts are forward-looking statements. In addition, we may from time to time make other oral or written statements that are also forward-looking statements. Forward-looking statements may include words such as "anticipate," "estimate," "expect," "project," "intend," "plan," "believe," "should" and other words and terms of similar meaning.
Forward-looking statements appear in a number of places in this report and include statements with respect to, among other things:
- •
- our business strategies and other plans and objectives for future operations;
- •
- our future revenues and expenses;
- •
- expected demand in the domestic tank vessel market in general and the demand for our tank vessels in particular;
- •
- expected decreases in the supply of domestic tank vessels;
- •
- planned capital expenditures and availability of capital resources to fund capital expenditures;
- •
- our expected cost of complying with the Oil Pollution Act of 1990 and other laws;
- •
- our plans for the retirement of tank vessels and the expected delivery and cost of newbuild vessels;
- •
- estimated future expenditures for drydocking and maintenance of our tank vessels' operating capacity;
- •
- the integration of acquisitions of tank barges and tugboats, including the timing, effects, benefits and costs thereof;
- •
- the likelihood that pipelines will be built that compete with us;
- •
- the effect of new or existing regulations or requirements on our financial position;
- •
- expectations regarding litigation;
- •
- the adequacy and availability of our insurance and the amount of any capital calls;
- •
- our future financial condition or results of operations;
- •
- our future compliance with financial covenants;
- •
- our ability to pay distributions; and
- •
- any other statements that are not historical facts.
These forward-looking statements are made based upon management's current plans, expectations, estimates, assumptions and beliefs concerning future events and, therefore, involve a number of risks and uncertainties. Forward-looking statements are not guarantees, and actual results could differ materially from those expressed or implied in the forward-looking statements. Please read "Item 1A. Risk Factors" for a list of important factors that could cause our actual results of operations or financial condition to differ from our expectations.
ii
ITEMS 1 and 2. BUSINESS and PROPERTIES.
Our Partnership
K-Sea Transportation Partners LP is a publicly traded Delaware limited partnership. Our business activities are conducted through our subsidiary, K-Sea Operating Partnership L.P.; a Delaware limited partnership which we refer to as the operating partnership, and the subsidiaries of the operating partnership. Our general partner, K-Sea General Partner L.P., is a Delaware limited partnership whose general partner is K-Sea General Partner GP LLC, a Delaware limited liability company. K-Sea General Partner GP LLC has ultimate responsibility for managing our business. Our principal executive office is located at One Tower Center Boulevard, 17th Floor, East Brunswick, New Jersey 08816, and our telephone number at that address is (732) 565-3818.
We are a leading provider of marine transportation, distribution and logistics services for refined petroleum products in the United States. As of September 1, 2010, we operated a fleet of 65 tank barges and 66 tugboats that serves a wide range of customers, including major oil companies, oil traders and refiners. With approximately 4.2 million barrels of capacity, we believe we operate the largest coastwise tank barge fleet in the United States. As of September 1, 2010, approximately 90% of our barrel carrying capacity was double hulled. As of September 1, 2010, all of our tank vessels, except two, operated under the U.S. flag, and all but three were qualified to transport cargo between U.S. ports under the Jones Act, the federal statutes that restrict foreign owners from operating in the U.S. maritime transportation industry.
For the fiscal year ended June 30, 2010, our fleet transported approximately 129 million barrels of refined petroleum products for our customers, including BP, ConocoPhillips, ExxonMobil and Tesoro. These four customers have been doing business with us for approximately 19 years on average. We do not assume ownership of any of the products we transport. During fiscal 2010, we derived approximately 70% of our revenue from longer-term contracts that are generally for periods of one year or more.
Our Business Strategy
From our inception in 2003 through the third quarter of 2009, one of our primary strategies for increasing distributable cash flow to unitholders was the expansion of our fleet through strategic acquisitions and purchases of newly constructed vessels. From our initial public offering in January 2004 through September 30, 2009, we grew our fleet barrel-carrying capacity from 2.3 million barrels to 4.2 million barrels. As a result of the decline in refined product demand in the U.S. over the past 18 months and the resultant shift in the supply/demand balance of the tank vessels in our markets, we adjusted our business strategy to focus on improving our liquidity, reducing our outstanding debt and increasing our profitability of existing assets. We have improved our profitability by increasing utilization of our assets while controlling costs. We have improved our liquidity and reduced our outstanding debt by (i) reducing our capital expenditures, (ii) selling of non-core assets and (iii) raising equity from outside investors. During fiscal 2011, the key elements of our strategy will include the following:
- •
- Improve profitability. We intend to operate our fleet to enhance profitability by continuing our initiatives to maximize utilization by extending or expanding our revenue contract portfolio. We expect to continue this strategy by surveying the marketplace to identify and pursue new opportunities that extend our current customer commitments and expand our geographic presence and customer base and increase the end markets we serve. For example, we recently extended a contract to move ethanol on the West Coast and in September 2010 we chartered an 80,000-barrel barge for two years in the Caribbean.
1
- •
- Continue to improve our balance sheet and financial flexibility with a goal of reinstating distributions on our common
units as soon as prudently advisable. We intend to continue to improve our balance sheet and financial flexibility. As of
June 30, 2010, we had approximately $382.9 million of indebtedness outstanding. As of September 10, 2010, after repayment of existing debt with the proceeds from the sale of
preferred units, net of estimated transaction related costs, and the proceeds from the sale of two tug boats and two double-hull barges, we had approximately $286.6 million of
indebtedness outstanding, and approximately $62.2 million of available capacity for additional borrowings and potential letters of credit under our revolving loan agreement. We intend to use
the proceeds from a sale of additional preferred units to further reduce indebtedness. In addition, we intend to continue to dispose of single hull and older double hull barges and excess tug boats in
an effort to decrease outstanding indebtedness and increase liquidity. We believe that availability under our revolving loan agreement and our ability to issue additional partnership units should
provide us with the financial flexibility to facilitate the execution of our business strategy. Any decision to resume cash distributions on our units and the amount of any such distributions will be
based on our determination that such distributions are sustainable based on current and expected distributable cash flow as well as our current and expected liquidity position. We will also consider
general economic conditions and our outlook for our business as we determine whether or not to pay any distributions. Recent amendments to our revolving loan agreement and a term loan facility
(collectively, the "Revolver and ATB Amendments") prohibit cash distributions prior to the end of the March 31, 2011 quarter and thereafter limit cash distributions to our unitholders to $0.45
per unit per quarter, provided that we maintain a minimum liquidity of $17.5 million. If these conditions are satisfied, we will be permitted to pay distributions if (a) the fixed charge
coverage ratio is at least 1.0 to 1.0 for two consecutive fiscal quarters prior to and after giving effect to such distributions; (b) the projected fixed charge coverage ratio is equal to or
greater than 1.0 to 1.0 for the next twelve months and is equal to or greater than 1.0 to 1.0 in three of four of those quarters; and (c) the total funded debt to EBITDA ratio is less than 5.0
to 1.0.
- •
- Maximize fleet utilization and improve productivity. The
interchangeability of our tank vessels and the critical mass of our fleet give us the flexibility to allocate the right vessel for the right cargo assignment on a timely basis. We intend to continue
improving our operational efficiency through the use of new technology and comprehensive training programs for new and existing employees. We also intend to minimize downtime by emphasizing efficient
scheduling and timely completion of planned and preventative maintenance.
- •
- Maintain safe, low-cost and efficient
operations. We believe we are a cost-efficient and reliable tank vessel operator. We intend to continue to reduce operating
costs through constant evaluation of each vessel's performance and concurrent adjustment of operating and chartering procedures to maximize each vessel's safety, availability and profitability.
Effective July 1, 2010, we implemented a new electronic management system, which we expect will improve operational efficiency. We also intend to continue to minimize costs through an active
preventative maintenance program both on-shore and at sea, employing qualified officers and crew and continually training our personnel to ensure safe and reliable vessel operations.
- •
- Balance our fleet deployment between longer-term contracts and shorter-term business in an effort to provide stable cash flows through business cycles, while preserving flexibility to respond to changing market conditions. During fiscal 2010, we derived approximately 70% of our revenue from time charters, consecutive voyage charters, contracts of affreightment, and bareboat charters, all of which are generally for periods of one year or more. We derived the remaining 30% of our revenue for fiscal 2010 from single voyage charters, which are generally priced at prevailing market rates. Vessels operating under voyage charters have the potential to generate decreased profit margins during periods of economic downturn and increased profit margins during periods
2
- •
- Attract and maintain customers by adhering to high standards of performance, reliability and safety. Customers place particular emphasis on efficient operations and strong environmental and safety records. We intend to continue building on our reputation for maintaining high standards of performance, reliability and safety, which we believe will enable us to attract increasingly selective customers.
of improved charter rates, while vessels operating on time charters or other longer term charters generally provide more predictable cash flow. Although we expect the percentage of our contracts with terms of one year or more to continue to decrease in the near future due to the economic downturn, we intend to pursue a strategy of emphasizing longer-term contracts, while preserving operational flexibility to take advantage of changing market conditions.
Recent Developments
During fiscal 2010, we adjusted our business strategy to focus on improving our liquidity, reducing debt and improving the profitability of our assets. We are successfully executing our plan as highlighted by the following accomplishments:
- •
- Sale of Preferred Units. On September 10, 2010, we
issued 15,653,775 Series A Preferred Units to KA First Reserve, LLC in exchange for approximately $85.0 million. In addition, KA First Reserve has agreed to purchase an additional
2,762,431 preferred units for approximately $15.0 million upon clearance of a Hart-Scott-Rodino review. The preferred units are convertible at any time into common units on a
one-for-one basis, subject to certain adjustments in the event of certain dilutive issuances of common units. The preferred units have a coupon of 13.5%, with
payment-in-kind distributions through the quarter ended June 30, 2012 or, if earlier, when we resume cash distributions on our common units. We have an option to force
the conversion of the preferred units after three years if (1) the price of our common units is 150% of the conversion price on average for 20 consecutive days on a volume-weighted basis, and
(2) the average daily trading volume of our common units for such 20 day period exceeds 50,000 common units. The preferred units were priced at $5.43 per unit, which represents a 10%
premium to the 5-day volume weighted average price of our common units as of August 26, 2010. We used the net proceeds from the sale of the preferred units to reduce outstanding
indebtedness and pay fees and expenses related to the transaction. Proceeds from the sale of the additional preferred units will also be used to reduce outstanding indebtedness.
- •
- Amended Credit Facility. On August 31, 2010, we amended ("Revolver Amendment") our revolving loan agreement (as amended, "Revolving Loan Agreement") to, among other things, (1) reduce the revolving lenders' commitments from $175.0 million to $115.0 million (subject to a maximum borrowing base equal to two-thirds of the orderly liquidation value of the vessel collateral), (2) amend the fixed charge coverage, total funded debt to EBITDA and asset coverage covenants, (3) maintain a July 1, 2012 maturity date, and (4) allow the payment of cash distributions subject to liquidity requirements and certain minimum financial ratios starting with the fiscal quarter ending March 31, 2011. The obligations under the Revolving Loan Agreement are collateralized by a first priority security interest, subject to permitted liens, on certain vessels having an orderly liquidation value equal to at least 1.50 times the amount of the aggregate obligations (including letters of credit) outstanding under the Revolving Loan Agreement. Borrowings under the Revolving Loan Agreement bear interest at a rate per annum equal, at our option, to (a) the greater of the prime rate, the federal funds rate plus 0.5% or the 30-day London Interbank Offered Rate ("LIBOR") plus 1%, plus a margin based upon the ratio of total funded debt to EBITDA of between 1.75% and 4.75%, or (b) the 30-day LIBOR, plus a margin based upon the ratio of total funded debt to EBITDA ranging from 2.75% to 5.75%.
3
- •
- Amended Term Loan Facility. Also on August 31,
2010, we entered into an amendment ("ATB Amendment") to a secured term loan credit facility ("Term Loan Agreement") in the amount of $57.6 million dated June 4, 2008, as amended ("ATB
Agreement"). The ATB Amendment, among other things, amended the financial covenants, LIBOR margins and limitations on distributions to conform to the financial covenants, LIBOR margins and limitations
on distributions in the Revolving Loan Agreement, as amended by the Revolver Amendment.
- •
- Sold Non-Core Assets. We sold
non-core assets with a carrying value of $7.0 million comprised primarily of single hull barges in the period January 1, 2009 through June 30, 2010 for
$9.0 million. In August 2010, we sold a recently completed 30,000-barrel new build double hull barge for $2.3 million. On September 10, 2010 we sold two tug boats and
two of our oldest double hull barges to an international buyer for $12.0 million. We have definitive agreements for the sale of (1) our waste water treatment facility in Virginia for
$5.1 million and (2) a single hull barge for $1.3 million. These transactions should close by the end of September 2010.
- •
- Reduced Vessel Operating and General and Administrative
Expenses. We reduced our vessel operating expenses to $138.1 million for the year ended June 30, 2010 from
$144.3 million for the year ended June 30, 2009 by reducing vessel crewing due to decreased utilization levels; and we reduced general and administrative expenses to $27.2 million
for the year ended June 30, 2010 from $29.8 million for the year ended June 30, 2009 by reducing staffing and controlling costs.
- •
- Reduced Capital Expenditures. We concluded our new building program in August 2010 with payments for two 30,000-barrel double hull tank barges aggregating approximately $5.5 million. Fiscal years 2010, 2009 and 2008 included capital expenditures for tank vessel construction of $37.7 million, $65.2 million and $52.0 million, respectively.
Our Industry
Introduction
Tank vessels, which include tank barges and tankers, are a critical link in the refined petroleum product distribution chain. Tank vessels transport gasoline, diesel fuel, heating oil, asphalt and other products from refineries and storage facilities to a variety of destinations, including other refineries, distribution terminals, power plants and ships.
Among the laws governing the domestic tank vessel industry is the one commonly referred to as the Jones Act, the federal statute that restricts foreign competition in the U.S. maritime transportation industry. Under the Jones Act, marine transportation of cargo between points in the United States, generally known as U.S. coastwise trade, is limited to U.S.-flag vessels that were built in the United States and are owned, manned and operated by U.S. citizens. As of September 1, 2010, all of our tank vessels, except two, operated under the U.S. flag, and all but three were qualified to transport cargo between U.S. ports under the Jones Act.
OPA 90 mandates, among other things, the phase-out of all single-hull tank vessels transporting petroleum and petroleum products in U.S. waters at varying times by January 1, 2015. The effect of this legislation has been, and is expected to continue to be, the replacement of domestic single-hulled tank vessel capacity with double-hulled newbuildings and retrofitting of existing single-hulled tank vessels. Weak demand in the market for single-hulled vessels has resulted in their effective obsolescence and early retirement.
The demand for domestic tank vessels is driven primarily by U.S. demand for refined petroleum products, which can be categorized as either clean oil products or black oil products. Clean oil products include motor gasoline, diesel fuel, heating oil, jet fuel and kerosene. Black oil products, which are what remain after clean oil products have been separated from crude oil, include residual fuel oil in the
4
refining process, asphalt, petrochemical feedstocks and bunker fuel. The demand for clean oil products is impacted by vehicle usage, air travel and prevailing weather conditions, while demand for black oil products varies depending on the type of product transported and other factors, such as oil refinery requirements and turnarounds, asphalt use, the use of residual fuel oil by electric utilities and bunker fuel consumption. The demand for residual fuel oil by electric utilities is influenced by the availability and price of alternative sources of energy, such as natural gas.
Transportation of Refined Petroleum Products
Refined petroleum products are transported by pipelines, water carriers, motor carriers and railroads. Tank vessels are used frequently to continue the transportation of refined petroleum products along the distribution chain after these products have first been transported by another method of transportation, such as a pipeline. For example, many areas have access to refined petroleum products only by using marine transportation as the last link in their distribution chain. In addition, tank vessel transportation is generally a more cost-effective and energy-efficient means of transporting bulk commodities such as refined petroleum products than transportation by rail car or truck. The carrying capacity of a 100,000-barrel tank barge is the equivalent of approximately 162 average-size rail tank cars and approximately 439 average-size tractor trailer tank trucks.
Types of Tank Vessels
The domestic tank vessel fleet consists of tankers, which have internal propulsion systems, and tank barges, which do not have internal propulsion systems and are instead pushed or towed by a tugboat. Tank barges generally move at slower speeds than comparably sized tankers, but are less expensive to build and operate. Although tank barge configuration varies, the bow and stern of most tank barges are square or sloped, with the stern of many tank barges having a notch of varying depth to permit pushing by a tugboat. While a larger tank vessel may be able to carry more cargo, some voyages require a tank vessel to go through a lock, bridge opening or narrow waterway, which limit the size of vessels that may be used. In addition, some loading and discharge facilities have physical limitations that prevent larger tank vessels from loading or discharging their cargo. Tank barges are often able to navigate the shallower waters of the inland waterway system and the waters along the coast. Tankers, however, are often confined to the deeper waters offshore due to their size.
Tank vessels can be categorized by:
- •
- Barrel-carrying Capacity—the number of barrels of refined
product that it takes to fill a vessel;
- •
- Gross Tonnage—the total volume capacity of the interior space
of a vessel, including non-cargo space, using a convention of 100 cubic feet per gross ton;
- •
- Net Tonnage—the volume capacity of a vessel determined by
subtracting the engine room, crew quarters, stores and navigation space from the gross tonnage using a convention of 100 cubic feet per net ton;
- •
- Deadweight Tonnage—the number of long-tons (2,240
pounds) of cargo that a vessel can transport. A deadweight ton is equivalent to approximately 6.5 to 7.5 barrels of capacity, depending on the specific gravity of the cargo. In this report, we have
assumed that a deadweight ton is equivalent to 7.0 barrels of capacity;
- •
- Hull Type—the body or framework of a vessel. Vessels can have
more than one hull, which means they have additional compartments between the cargo and the outside of the vessel. Typical vessels are single-hulled or double-hulled; and
- •
- Cargo—the type of commodity transported.
5
Tank vessels can also be categorized into the following fleets based on the primary waterway system typically navigated by the vessel:
- •
- Coastwise Fleet. The term coastwise fleet generally refers
to commercial vessels that transport goods in the following areas:
- •
- along the Atlantic, Gulf and Pacific coasts;
- •
- Alaska, Hawaii and other U.S. Pacific Islands, Venezuela; and
- •
- between the Atlantic or Gulf and Pacific coasts by way of the Panama Canal.
- •
- Inland Waterways Fleet. The term inland waterways fleet
generally refers to commercial vessels that transport goods on the navigable internal waterways of the Atlantic, Gulf and Pacific Coasts, and the Mississippi River System. The main arteries of the
inland waterways network for the mid-continent are the Mississippi and the Ohio Rivers. The inland waterways fleet consists primarily of tugboats and tank barges which typically have a
shallower depth. These tank barges are generally less costly than many tank barges operating in the coastwise fleet. The vessels comprising the inland waterways fleet are generally not built to
standards required for operation in coastal waters.
- •
- Great Lakes Fleet. The term Great Lakes fleet generally refers to commercial vessels normally navigating the waters among the U.S. Great Lakes ports and connecting waterways.
Tugboats
Tugboats are equipped to push, pull or tow tank barges alongside. The amount of horsepower required to handle a barge depends on a number of factors, including the size of the barge, the amount of product loaded, weather conditions and the waterways navigated. A typical tugboat is manned by six people: a captain, a mate, an engineer, an assistant engineer and two deckhands. These individuals perform the duties and tasks required to operate the tugboat, such as standing navigational watches, maintaining and repairing machinery, rigging and line-handling, and painting and other routine maintenance. A standard work schedule for a tugboat crew is 14 days on, 14 days off. While on duty, the crew members generally work two six-hour shifts each day.
Integrated Tug-Barge Units
Tugboats can also be integrated into a barge utilizing a notching system that connects the two vessels. An integrated tug-barge unit, or ITB, has certain advantages over other tug-barge combinations, including higher speed and better maneuverability. In addition, an ITB can operate in certain sea and weather conditions in which conventional tug-barge combinations cannot.
Articulated Tug-Barge Units
An articulated tug barge unit, or ATB, similar to ITBs, consist of a tugboat (which provides propulsion) and a cargo carrying barge using a coupling system that connects the two vessels. Unlike the rigid connection found on ITBs, an ATB uses a hinged connection. ATBs offer the additional advantage of substitutability, because the barge and tug may be decoupled. This offers operational and commercial flexibility, allowing the barge unit to be towed by a third party tug in certain situations.
Our Customers
We provide marine transportation services primarily to major oil companies, oil traders and refiners in the East, West and Gulf Coast regions of the United States, including Alaska and Hawaii. We monitor the supply and distribution patterns of our actual and prospective customers and focus our efforts on providing services that are responsive to the current and future needs of these customers.
6
The following chart sets forth our major customers and the number of years each of them has been a customer:
K-Sea Transportation Partners L.P.
Major Customers
Major Customers
|
Years as Customer |
|||
|---|---|---|---|---|
BP |
37 | |||
ConocoPhillips |
14 | |||
ExxonMobil |
14 | |||
Tesoro |
12 | |||
Our two largest customers in fiscal 2010, based on gross revenue, were ConocoPhillips and Tesoro, each of which accounted for more than 10% of our fiscal 2010 consolidated revenue. If we were to lose either of these customers or if either of them significantly reduced its use of our services, our business and operating results could be adversely affected.
Our Vessels
Tank Vessel Fleet
At September 1, 2010, our fleet consisted of the following tank vessels:
K-Sea Transportation Partners L.P. Tank Vessel Fleet
Vessel(1)
|
Year Built |
Capacity (barrels) |
Gross Tons |
OPA 90 Phase-Out |
|||||||||||
|---|---|---|---|---|---|---|---|---|---|---|---|---|---|---|---|
Double-Hull Barges |
|||||||||||||||
DBL 185 |
2009 | 185,000 | 13,895 | N.A. | |||||||||||
DBL 155(2) |
2004 | 165,882 | 12,152 | N.A. | |||||||||||
DBL 151 |
1981 | 150,000 | 8,710 | N.A. | |||||||||||
DBL 140 |
2000 | 140,000 | 10,303 | N.A. | |||||||||||
DBL 134(3) |
1994 | 134,000 | 9,514 | N.A. | |||||||||||
DBL 105(4)(7) |
2004 | 105,000 | 11,438 | N.A. | |||||||||||
DBL 101 |
2002 | 102,000 | 6,774 | N.A. | |||||||||||
DBL 102 |
2004 | 102,000 | 6,774 | N.A. | |||||||||||
DBL 103 |
2006 | 102,000 | 6,774 | N.A. | |||||||||||
DBL 104 |
2007 | 102,000 | 6,774 | N.A. | |||||||||||
DBL 106 |
2009 | 102,000 | 7,874 | N.A. | |||||||||||
Lemon Creek(5) |
1987 | 89,293 | 5,736 | N.A. | |||||||||||
Spring Creek(5)(8) |
1987 | 89,293 | 5,736 | N.A. | |||||||||||
Nale |
2007 | 86,000 | 6,508 | N.A. | |||||||||||
McCleary's Spirit(6)(8) |
2001 | 85,000 | 6,554 | N.A. | |||||||||||
Antares |
2004 | 84,000 | 5,855 | N.A. | |||||||||||
Deneb |
2006 | 84,000 | 5,855 | N.A. | |||||||||||
DBL 81 |
2003 | 82,000 | 5,667 | N.A. | |||||||||||
DBL 82 |
2003 | 82,000 | 5,667 | N.A. | |||||||||||
Capella(7) |
2002 | 81,751 | 5,159 | N.A. | |||||||||||
Leo |
2003 | 81,540 | 5,954 | N.A. | |||||||||||
Pacific |
1993 | 81,000 | 5,669 | N.A. | |||||||||||
Rigel |
1993 | 80,861 | 5,669 | N.A. | |||||||||||
Sasanoa |
2001 | 81,000 | 5,790 | N.A. | |||||||||||
DBL 78 |
2000 | 80,000 | 5,559 | N.A. | |||||||||||
7
Vessel(1)
|
Year Built |
Capacity (barrels) |
Gross Tons |
OPA 90 Phase-Out |
|||||||||||
|---|---|---|---|---|---|---|---|---|---|---|---|---|---|---|---|
DBL 77(7) |
2008 | 80,000 | 5,235 | N.A. | |||||||||||
DBL 76(7) |
2008 | 80,000 | 5,813 | N.A. | |||||||||||
DBL 79(7) |
2008 | 80,000 | 6,149 | N.A. | |||||||||||
DBL 70(9) |
1972 | 73,024 | 5,248 | N.A. | |||||||||||
Kays Point(7) |
1999 | 67,000 | 4,720 | N.A. | |||||||||||
Noa |
2002 | 67,000 | 4,826 | N.A. | |||||||||||
Cascades(7) |
1993 | 67,000 | 4,721 | N.A. | |||||||||||
Columbia(7) |
1993 | 58,000 | 4,286 | N.A. | |||||||||||
Na-Kao |
2005 | 52,000 | 4,076 | N.A. | |||||||||||
Ne'ena |
2004 | 52,000 | 4,076 | N.A. | |||||||||||
DBL 53(9) |
1965 | 53,000 | 4,543 | N.A. | |||||||||||
DBL 54 |
2009 | 50,000 | 4,276 | N.A. | |||||||||||
DBL 31 |
1999 | 30,000 | 2,146 | N.A. | |||||||||||
DBL 32 |
1999 | 30,000 | 2,146 | N.A. | |||||||||||
DBL 33 |
2010 | 30,000 | 1,754 | N.A. | |||||||||||
DBL 28 |
2006 | 28,000 | 2,146 | N.A. | |||||||||||
DBL 29 |
2006 | 28,000 | 2,146 | N.A. | |||||||||||
DBL 26 |
2006 | 28,000 | 2,146 | N.A. | |||||||||||
DBL 27 |
2007 | 28,000 | 2,146 | N.A. | |||||||||||
DBL 22 |
2007 | 28,000 | 2,146 | N.A. | |||||||||||
DBL 23 |
2007 | 28,000 | 2,146 | N.A. | |||||||||||
DBL 24(7) |
2007 | 28,000 | 2,146 | N.A. | |||||||||||
DBL 25(7) |
2007 | 28,000 | 2,146 | N.A. | |||||||||||
Puget Sounder |
1992 | 25,000 | 1,870 | N.A. | |||||||||||
DBL 20 |
1991 | 20,127 | 1,480 | N.A. | |||||||||||
DBL 16 |
1954 | 20,000 | 1,420 | N.A. | |||||||||||
DBL 17 |
1998 | 18,000 | 1,499 | N.A. | |||||||||||
DBL 18 |
1998 | 18,000 | 1,499 | N.A. | |||||||||||
DBL 19 |
1998 | 18,000 | 1,499 | N.A. | |||||||||||
DBL 10 |
1998 | 10,000 | 806 | N.A. | |||||||||||
Subtotal |
3,779,771 | 273,616 | |||||||||||||
Vessel(1)
|
Year Built |
Capacity (barrels) |
Gross Tons |
OPA 90 Phase-Out |
|||||||||||
|---|---|---|---|---|---|---|---|---|---|---|---|---|---|---|---|
Single-Hull Barges |
|||||||||||||||
KTC 80 |
1981 | 82,878 | 4,576 | 2015 | |||||||||||
KTC 60 |
1980 | 61,638 | 3,824 | 2015 | |||||||||||
KTC 55 |
1972 | 53,012 | 3,113 | 2015 | |||||||||||
KTC 50 |
1974 | 54,716 | 3,367 | 2015 | |||||||||||
SCT 280(7) |
1977 | 48,000 | 3,081 | 2015 | |||||||||||
Washington(7) |
1980 | 32,000 | 2,062 | 2015 | |||||||||||
Wallabout Bay |
1986 | 28,330 | 1,687 | 2015 | |||||||||||
PM 230(7) |
1983 | 25,000 | 1,610 | 2015 | |||||||||||
SCT 180 |
1980 | 16,250 | 1,053 | 2015 | |||||||||||
SEA 76 |
1969 | 13,313 | 830 | 2015 | |||||||||||
Subtotal |
415,137 | 25,203 | |||||||||||||
Total Fleet |
4,194,908 | 298,819 | |||||||||||||
- (1)
- Excludes one potable water barge.
8
- (2)
- Built
in 1974; double-hulling was completed and the vessel redelivered in September 2004.
- (3)
- Built
in 1986 and rebuilt in 1994.
- (4)
- Built
in 1982 and rebuilt for petroleum transportation in 2004.
- (5)
- Vessel
not qualified for Jones Act trade due to foreign construction.
- (6)
- Built
in 1969 and rebuilt in 2001.
- (7)
- Chartered-in
vessel.
- (8)
- Vessel
not qualified for Jones Act trade due to foreign flag.
- (9)
- A definitive agreement has been signed to sell these vessels.
Articulated/Integrated Tug-Barge Units
As of September 1, 2010, we operated 25 ITBs and 1 ATB, which represented approximately 52% of the barrel-carrying capacity of our tank barge fleet.
Newbuildings
We expect to take delivery of a 50,000-barrel tank barge in the third quarter of fiscal 2011 under a lease from the shipyard. We took delivery of one 30,000-barrel tank barge in July 2010, the DBL 33; and one 33,000-barrel tank barge in August 2010, the DBL 34. These tank barges cost in the aggregate and after the addition of certain special equipment, approximately $6.6 million. We have a long term contract with a customer relating to the DBL 33. In August 2010, we sold the DBL 34 for $2.3 million, net of commission and escrow agent fees.
Tugboat Fleet
We use tugboats as the primary means of propelling our tank barge fleet. Therefore, we seek to maintain the proper balance between the number of tugboats and the number of tank barges in our fleet. This balance is influenced by a variety of factors, including the condition of the vessels in our fleet, the mix of our coastwise business and our local business and the level of longer-term contracts versus shorter-term business. We are also able to maintain a proper balance between tugboats and tank barges by analyzing the historical trading patterns of our customers and the nature of their cargoes. While a tank barge is unloading, we often dispatch its tugboat to perform other work.
9
At September 1, 2010, we operated the following tugboats:
K-Sea Transportation Partners L.P. Tugboat Fleet
Name(1)
|
Year Built | Horsepower | Dimensions | |||||||
|---|---|---|---|---|---|---|---|---|---|---|
Dublin Sea |
2009 | 11,800 | 131' × 44' × 22' | |||||||
Lincoln Sea |
2000 | 8,000 | 119' × 40' × 22' | |||||||
Rebel |
1975 | 7,200 | 150' × 46' × 22' | |||||||
Yankee |
1976 | 7,200 | 150' × 46' × 22' | |||||||
Jimmy Smith |
1976 | 7,200 | 150' × 40' × 22' | |||||||
Barents Sea |
1976 | 6,200 | 136' × 40' × 16' | |||||||
McKinley Sea |
1981 | 6,000 | 136' × 37' × 20' | |||||||
Bismarck Sea |
1978 | 5,750 | 136' × 37' × 20' | |||||||
Irish Sea |
1969 | 5,750 | 135' × 35' × 18' | |||||||
Sirius |
1974 | 5,750 | 135' × 38' × 19' | |||||||
Nakolo |
1974 | 5,750 | 125' × 38' × 14' | |||||||
El Lobo Grande |
1978 | 5,750 | 128' × 36' × 19' | |||||||
Nakoa |
1976 | 5,500 | 118' × 34' × 17' | |||||||
Volunteer |
1982 | 4,860 | 120' × 37' × 18' | |||||||
Adriatic Sea(2) |
2004 | 4,800 | 126' × 34' × 15' | |||||||
Java Sea(3) |
2005 | 4,800 | 119' × 34' × 15' | |||||||
Namahoe |
1997 | 4,400 | 105' × 34' × 16' | |||||||
Pacific Freedom(4) |
1998 | 4,500 | 120' × 31' × 15' | |||||||
Viking |
1972 | 4,300 | 133' × 34' × 18' | |||||||
Beaufort Sea |
1971 | 4,300 | 113' × 32' × 16' | |||||||
North Sea |
1982 | 4,200 | 126' × 34' × 16' | |||||||
Greenland Sea |
1990 | 4,200 | 117' × 34' × 17' | |||||||
Pacific Wolf |
1975 | 4,100 | 111' × 24' × 13' | |||||||
William J. Moore |
1970 | 4,000 | 135' × 35' × 20' | |||||||
Niolo |
1982 | 4,000 | 117' × 34' × 17' | |||||||
Nokea |
1975 | 4,000 | 105' × 30' × 14' | |||||||
Nunui |
1978 | 4,000 | 185' × 40' × 12' | |||||||
Tasman Sea |
1976 | 3,900 | 124' × 34' × 16' | |||||||
Norwegian Sea(5) |
2006 | 3,900 | 133' × 34' × 17' | |||||||
Sea Hawk(6) |
2006 | 3,900 | 112' × 32' × 15' | |||||||
John Brix(7) |
1999 | 3,900 | 141' × 35' × 8' | |||||||
Pacific Avenger |
1977 | 3,900 | 140' × 34' × 17' | |||||||
Altair |
1981 | 3,800 | 106' × 33' × 17' | |||||||
Kara Sea |
1974 | 3,520 | 111' × 32' × 14' | |||||||
Ross Sea |
2003 | 3,400 | 95' × 32' × 14' | |||||||
Solomon Sea |
1965 | 3,300 | 105' × 32' × 14' | |||||||
Coral Sea(10) |
1973 | 3,280 | 111' × 32' × 14' | |||||||
Nathan E. Stewart |
2001 | 3,200 | 95' × 32' × 14' | |||||||
Maryland |
1962 | 3,010 | 110' × 28' × 14' | |||||||
Baltic Sea(10) |
1973 | 3,000 | 101' × 30' × 13' | |||||||
Pacific Challenger |
1976 | 3,000 | 118' × 34' × 16' | |||||||
Paragon |
1978 | 3,000 | 99' × 32' × 15' | |||||||
Pacific Raven |
1970 | 3,000 | 112' × 31' × 14' | |||||||
Na Hoku |
1981 | 3,000 | 105' × 34' × 17' | |||||||
Nalani |
1981 | 3,000 | 105' × 34' × 17' | |||||||
Nohea |
1983 | 3,000 | 98' × 30' × 14' | |||||||
10
Name(1)
|
Year Built | Horsepower | Dimensions | |||||||
|---|---|---|---|---|---|---|---|---|---|---|
Pacific Pride(8) |
1989 | 2,500 | 84' × 28' × 13' | |||||||
Aegean Sea |
1978 | 2,400 | 85' × 24' × 10' | |||||||
Labrador Sea |
2002 | 2,400 | 82' × 26' × 12' | |||||||
Siberian Sea |
1980 | 2,400 | 85' × 24' × 10' | |||||||
Caribbean Sea |
1961 | 2,400 | 85' × 24' × 10' | |||||||
Bering Sea |
1975 | 2,250 | 105' × 29' × 13' | |||||||
Caspian Sea |
1981 | 2,000 | 65' × 24' × 9' | |||||||
Inland Sea |
2000 | 2,000 | 76' × 26' × 10' | |||||||
Pacific Patriot |
1981 | 2,000 | 77' × 27' × 12' | |||||||
Davis Sea |
1982 | 2,000 | 77' × 26' × 9' | |||||||
Pacific Eagle(9) |
2001 | 2,000 | 98' × 27' × 13' | |||||||
Tiger |
1966 | 2,000 | 88' × 27' × 12' | |||||||
Chukchi Sea |
1979 | 2,000 | 92' × 26' × 9' | |||||||
Houma |
1970 | 1,950 | 90' × 29' × 11' | |||||||
Timor Sea |
1960 | 1,920 | 80' × 24' × 10' | |||||||
Odin |
1982 | 1,860 | 72' × 28' × 12' | |||||||
Taurus |
1979 | 1,860 | 79' × 25' × 12' | |||||||
Falcon |
1978 | 1,800 | 80' × 25' × 12' | |||||||
Naupaka |
1983 | 1,800 | 75' × 26' × 10' | |||||||
Fidalgo |
1973 | 1,400 | 98' × 25' × 8' | |||||||
- (1)
- Excluding
certain workboats and other small vessels most of which are less than 1,000 HP.
- (2)
- Built
in 1978 and rebuilt in 2004.
- (3)
- Built
in 1981 and rebuilt in 2005.
- (4)
- Built
in 1969 and rebuilt in 1998.
- (5)
- Built
in 1976 and rebuilt in 2006.
- (6)
- Built
in 1978 and rebuilt in 2006.
- (7)
- Built
in 1963 and rebuilt in 1999.
- (8)
- Built
in 1976 and rebuilt in 1989.
- (9)
- Built
in 1966 and rebuilt in 1985 and 2001.
- (10)
- A definitive agreement has been signed to sell these vessels.
Bunkering
For over 30 years, we have specialized in the shipside delivery of fuel, known as bunkering, for the major and independent bunker suppliers in New York Harbor. We also provide bunkering services in Pennsylvania, Virginia and Hawaii. Demand for bunkering services is driven primarily by the number of ship arrivals. A ship's time in port generally is limited, and the cost of delaying sailing due to bunkering or other activities can be significant. Therefore, we continually strive to improve the level of service and on-time deliveries to our customers.
The majority of our bunker delivery tank vessels are equipped with advanced, whole-load sampling devices to provide the supplier and receiver a representative sample. Our bunker delivery tank barges are also equipped with extended booms for hose handling ease alongside ships, remote pump engine shut-offs, spill rails, spill containment equipment and supplies, VHF and UHF radio communication and fendering.
11
Preventative Maintenance
We have a computerized preventative maintenance program that tracks U.S. Coast Guard and American Bureau of Shipping inspection schedules and establishes a system for the reporting and handling of routine maintenance and repair.
Vessel captains submit monthly inspection reports, which are used to note conditions that may require maintenance or repair. Vessel superintendents are responsible for reviewing these reports, inspecting identified discrepancies, assigning a priority classification and generating work orders. Work orders establish job type, assign personnel responsible for the task and record target start and completion dates. Vessel superintendents inspect repairs completed by the crew, supervise outside contractors as needed and conduct quarterly inspections following the same criteria as the captains. Drills and training exercises are conducted in conjunction with these inspections, which are typically more comprehensive in scope. In addition, an operations duty officer is available on a 24-hour basis to handle any operational issues. The operations duty officer is prepared to respond on scene whenever required and is trained in technical repair issues, spill control and emergency response.
The American Bureau of Shipping and the U.S. Coast Guard establish drydocking schedules. Typically, we drydock our vessels twice every five years. Prior to sending a vessel to a shipyard, we develop comprehensive work lists to ensure all required maintenance is completed. Repair facilities bid on these work lists, and jobs are awarded based on quality, price and time to complete. Vessels then report to a cleaning facility to prepare for shipyard. Once the vessel is gas-free a certified marine chemist issues paperwork certifying that no dangerous vapors are present. The vessel proceeds to the shipyard where the vessel superintendent and certain crewmembers assist in performing the maintenance and repair work. The planned maintenance period is considered complete when all work has been tested to the satisfaction of American Bureau of Shipping or U.S. Coast Guard inspectors or both.
Safety
General
We are committed to operating our vessels in a manner that protects the safety and health of our employees, the general public and the environment. Our primary goal is to minimize the number of safety- and health related accidents on our vessels and our property. Our primary concerns are to avoid personal injuries and to reduce occupational health hazards. We want to prevent accidents that may cause damage to our personnel, equipment or the environment, such as fire, collisions, petroleum spills and groundings of our vessels. In addition, we are committed to reducing overall emissions and waste generation from each of our facilities and vessels and to the safe management of associated cargo residues and cleaning wastes.
Our policy is to follow all laws and regulations as required, and we are actively participating with government, trade organizations and the public in creating responsible laws, regulations and standards to safeguard the workplace, the community and the environment. Our Operations Department is responsible for coordinating all facets of our health and safety program and identifying areas that may require special emphasis, including new initiatives that evolve within the industry. Our Human Resources Department is responsible for all training, whether conducted in-house or at a training facility. Supervisors are responsible for carrying out and monitoring compliance with all of the safety and health policies on their vessels.
Tank Barge Characteristics
To protect the environment, today's tank barge hulls are required not only to be leak-proof into the body of water in which they float but also to be vapor-tight to prevent the release of any fumes or
12
vapors into the atmosphere. Our tank barges that carry light products such as gasoline or naphtha have alarms that indicate when the tank is full (95% of capacity) and when it is overfull (98% of capacity). Each tank barge also has a vapor recovery system that connects the cargo tanks to the shore terminal via pipe and hose to return to the plant the vapors generated while loading.
The majority of our bunker delivery tank barges are equipped with advanced, whole-load sampling devices to provide the supplier and receiver a representative sample. Our bunker delivery tank barges are also equipped with extended booms for hose handling ease alongside ships, remote pump engine shut-offs, spill rails, spill containment equipment and supplies, VHF and UHF radio, satellite and internet communication.
Safety Management Systems
We belong and adhere to the recommendations of the American Waterways Operators ("AWO") Responsible Carrier Program. The program is designed as a framework for continuously improving the industry's and member companies' safety performance. The program complements and builds upon existing government regulations, requiring company safety and training standards that in many instances exceed those required by federal law or regulation.
Developed by the AWO, the Responsible Carrier Program incorporates best industry practices in three primary areas:
- •
- management and administration;
- •
- equipment and inspection; and
- •
- human factors.
The Responsible Carriers Program has been recognized by many groups, including the U.S. Coast Guard and shipper organizations. We are periodically audited by an AWO-certified auditor to verify compliance. We were audited in early 2010, and our Responsible Carrier Program certificate remains in effect until March 2013.
We are also certified to the standards of the International Safety Management, or ISM, system. The ISM standards were promulgated by the International Maritime Organization, or IMO, and have been adopted through treaty by many IMO member countries, including the United States. Although ISM is not required for coastal tug and barge operations, we have determined that an integrated safety management system including the ISM and Responsible Carriers Program standards promotes safer operations and provides us with necessary operational flexibility as we continue to grow.
Ship Management, Crewing and Employees
We maintain an experienced and highly qualified work force of shore based and seagoing personnel. As of June 30, 2010, we employed 865 persons, comprising 150 shore staff and 715 fleet personnel. Our tug and tanker captains are non-union management supervisors. Effective July 1, 2010, we renewed our collective bargaining agreement with our maritime union for one year, which covers certain of our seagoing personnel comprising 41% of our workforce. The collective bargaining agreement provides for wage increases, and requires us to make contributions to certain pension and other welfare programs. No unfunded pension liability exists under any of these programs. Our vessel employees are paid on a daily or hourly basis and typically work 14 days on and 14 days off. Our shore based personnel are generally salaried and most are located at our headquarters in East Brunswick, New Jersey or our facilities in Staten Island, New York; Seattle, Washington; Honolulu, Hawaii; Norfolk, Virginia and Philadelphia, Pennsylvania. We believe that our relations with our employees are satisfactory.
13
Our shore staff provides worldwide support for all aspects of our fleet and business operations, including sales and scheduling, crewing and human resources functions, engineering, compliance and technical management, financial, legal and insurance services, and information technology. A staff of dispatchers and schedulers maintain a 24-hour duty rotation to monitor communications and to coordinate fleet operations with our customers and terminals. Communication with our vessels is accomplished by various methods, including wireless data links, cellular telephone, VHF, UHF and HF radio.
Our crews regularly inspect each vessel, both at sea and in port, and perform most of the ordinary course maintenance. Our procedures call for a member of our shore based staff to inspect each vessel at least once each fiscal quarter, making specific notations and recommendations regarding the overall condition of the vessel, maintenance, safety and crew welfare. In addition, selected vessels are inspected each year by independent consultants. Most of the vessels that are on bareboat charters to third parties are managed and operated by the customer.
Classification, Inspection and Certification
Most of our coastwise vessels have been certified as being "in class" by the American Bureau of Shipping and, in the case of one vessel, by Lloyds of London. A vessel certified as being "in class" verifies that the vessel conforms to designated standards at a specified time. Other vessels, primarily in our West Coast operations, have the required "loadline" certification. The purpose of a "loadline" certification is to ensure that a ship is not overloaded and thus has sufficient reserve buoyancy. The American Bureau of Shipping is one of several internationally recognized classification societies that inspect vessels at regularly scheduled intervals to ensure compliance with American Bureau of Shipping classification rules and some applicable federal safety regulations. Most insurance underwriters require at least a "loadline" certification by a classification society before they will extend coverage to a coastwise vessel. The classification society certifies that the pertinent vessel has been built and maintained in accordance with the rules of the society and complies with applicable rules and regulations of the vessel's country of registry and the international conventions of which that country is a member. Inspections are conducted on the pertinent vessel by a surveyor of the classification society in three surveys of varying frequency and thoroughness: annual surveys each year, an intermediate survey every two to three years and a special survey every four to five years. As part of the intermediate survey, a vessel may be required to be drydocked every 24 to 30 months for inspection of its underwater parts and for any necessary repair work related to such inspection.
Our vessels are also inspected at periodic intervals by the U.S. Coast Guard to ensure compliance with Federal safety regulations. All of our tank vessels carry Certificates of Inspection issued by the U.S. Coast Guard.
Our vessels and shore side operations are also inspected and audited periodically by our customers, in some cases as a precondition to chartering our vessels. We maintain all necessary approvals required for our vessels to operate in their normal trades. We believe that the high quality of our vessels, our crews and our shore side staff are advantages when competing against other vessel operators for long-term business.
Insurance Program
We maintain insurance coverage consistent with industry practice that we believe is adequate to protect against the accident related risks involved in the conduct of our business and risks of liability for environmental damage and pollution. Nevertheless, we cannot provide assurance that all risks are adequately insured against, that any particular claims will be paid or that we will be able to procure adequate insurance coverage at commercially reasonable rates in the future.
14
Our hull and machinery insurance covers risks of actual or constructive loss from collision, tower's liabilities, fire, grounding and engine breakdown up to an agreed value per vessel. Our war-risks insurance covers risks of confiscation, seizure, capture, vandalism, sabotage and other war-related risks. While some tanker owners and operators obtain loss-of-hire insurance covering the loss of revenue during extended tanker off-hire periods, we do not have this type of coverage. We believe that this type of coverage is not economical and is of limited value to us. However, we evaluate the need for such coverage on an ongoing basis taking into account insurance market conditions and the employment of our vessels.
Our protection and indemnity insurance covers third-party liabilities and other related expenses from, among other things, injury or death of crew, passengers and other third parties, claims arising from collisions, damage to cargo, damage to third-party property, asbestos exposure and pollution arising from oil or other substances. Our current protection and indemnity insurance coverage for pollution is $1.0 billion per incident and is provided by West of England Ship Owners Insurance Services Ltd. ("West of England"), a mutual insurance association. West of England is a member of the International Group of protection and indemnity mutual assurance associations. The protection and indemnity associations that comprise the International Group insure approximately 90% of the world's commercial tonnage and have entered into a pooling agreement to reinsure each association's liabilities. Each protection and indemnity association has capped its exposure to this pooling agreement at approximately $6.9 billion per non-pollution incident. As a member of West of England, we are subject to calls payable to the association based on our claim records, as well as the claim records of all other members of the individual associations and members of West of England.
We are not currently the subject of any claims alleging exposure to asbestos or second-hand smoke, although such claims have been brought against our predecessors in the past and may be brought against us in the future. Our predecessor company, EW Transportation LLC, has contractually agreed to retain any such liabilities that occurred prior to our initial public offering in January 2004, will indemnify us for up to $10.0 million of such liabilities until January 2014, and will make available to us the benefit of certain indemnities it received in connection with the purchase of certain vessels. If, notwithstanding the foregoing, we are ultimately obligated to pay any asbestos related or similar claims for any reason, we believe that we or EW Transportation LLC would have adequate insurance coverage for periods after March 1986 to pay such claims. However, EW Transportation LLC and its predecessors may not have insurance coverage prior to March 1986. If we were subject to claims related to that period, including claims from current or former employees, EW Transportation LLC may not have insurance to pay the liabilities, if any, that could be imposed on us. If we had to pay claims solely out of our own funds, it could have a material adverse effect on our financial condition. Furthermore, any claims covered by insurance would be subject to deductibles, and because it is possible that a large number of claims could be brought, the aggregate amount of these deductibles could be material. Please read "Legal Proceedings" in Item 3 of this report.
We may not be able to obtain insurance coverage in the future to cover all risks inherent in our business, and insurance, if available, may be at rates that we do not consider commercially reasonable. In addition, as more single-hull vessels are retired from active service, insurers may be less willing to insure, and customers less willing to hire, single-hull vessels.
Competition
The domestic tank vessel industry is highly competitive. The Jones Act restricts U.S. point-to-point maritime shipping to vessels built in the United States, owned and operated by U.S. citizens and manned by U.S. crews. In our market areas, our primary direct competitors are the operators of U.S.-flag ocean-going tank barges and U.S.-flag refined petroleum product tankers, including the captive fleets of major oil companies.
15
In the voyage and short-term charter market, our vessels compete with all other vessels of a size and type required by a charterer that can be available at the date specified. In the voyage market, competition is based primarily on price and availability, although charterers have become more selective with respect to the quality of vessels they hire, with particular emphasis on factors such as age, double-hulls and the reliability and quality of operations. Increasingly, major charterers are demonstrating a preference for modern vessels based on concerns about the environmental risks associated with older vessels. Consequently, we believe that owners of large modern fleets have a competitive advantage over owners of older fleets.
U.S.-flag tank vessels also compete with petroleum product pipelines and are affected by the level of imports on foreign flag products carriers. The Colonial Pipeline system, which originates in Texas and terminates at New York Harbor, the Plantation Pipe Line system, which originates in Louisiana and terminates in Washington D.C., and smaller regional pipelines between Philadelphia and New York, carry refined petroleum products to the major storage and distribution facilities that we currently serve. We believe that high capital costs, tariff regulation and environmental considerations make it unlikely that a new refined product pipeline system will be built in our market areas in the near future. It is possible, however, that new pipeline segments, including pipeline segments that connect with existing pipeline systems, could be built or that existing pipelines could be converted to carry refined petroleum products. Either of these occurrences could have an adverse effect on our ability to compete in particular locations.
Regulation
Our operations are subject to significant federal, state and local regulation, including those described below.
Environmental
General. Government regulation significantly affects the ownership and operation of our tank vessels. Our tank vessels are subject to international conventions, federal, state and local laws and regulations relating to safety and health and environmental protection, including the generation, storage, handling, emission, transportation, and discharge of hazardous and non-hazardous materials. Although we believe that we are in substantial compliance with applicable environmental laws and regulations, we cannot predict the ultimate cost of complying with these requirements, or the impact of these requirements on the resale value or useful lives of our tank vessels. The recent trend in environmental legislation is toward stricter requirements, and this trend will likely continue. In addition, a future serious marine incident occurring in U.S. waters, or internationally, that results in significant oil pollution or causes significant environmental impact could result in additional legislation or regulation that could affect our profitability.
Various governmental and quasi-governmental agencies require us to obtain permits, licenses and certificates for the operation of our tank vessels. While we believe that we are in substantial compliance with applicable environmental laws and regulations and have all permits, licenses and certificates necessary for the conduct of our operations, frequently changing and increasingly stricter requirements, future non-compliance or failure to maintain necessary permits or approvals could require us to incur substantial costs or temporarily suspend operation of one or more of our tank vessels.
We maintain operating standards for all our tank vessels that emphasize operational safety, quality maintenance, continuous training of our crews and officers, care for the environment and compliance with U.S. regulations. Our tank vessels are subject to both scheduled and unscheduled inspections by a variety of governmental and private entities, each of which may have unique requirements. These
16
entities include the local port authorities (U.S. Coast Guard, harbor master or equivalent), classification societies, flag state administration and charterers, particularly terminal operators and oil companies.
Finally, we manage our exposure to losses from potential discharges of pollutants through the use of well maintained and well managed facilities, well maintained and well equipped vessels and safety and environmental programs, including a maritime compliance program and our insurance program. Moreover, we believe we will be able to accommodate reasonably foreseeable environmental regulatory changes. However, the risks of substantial costs, liabilities, and penalties are inherent in marine operations. As a result, there can be no assurance that any new regulations or requirements or any discharge of pollutants by us will not have a material adverse effect on us.
The Oil Pollution Act of 1990. The Oil Pollution Act of 1990, or OPA 90, affects all vessels trading in U.S. waters, including the exclusive economic zone extending 200 miles seaward. OPA 90 sets forth various technical and operating requirements for tank vessels operating in U.S. waters. Existing single-hull, double-sided and double-bottomed tank vessels are to be phased out of service at varying times based on their tonnage and age, with all such vessels being phased out by January 2015. As of September 1, 2010, we had 10 single-hulled tank vessels or approximately 10% of our barrel carrying capacity which will be precluded from transporting petroleum products as of January 1, 2015.
Under OPA 90, owners or operators of tank vessels and certain non-tank vessels operating in U.S. waters must file vessel spill response plans with the U.S. Coast Guard and operate in compliance with the plans. These vessel response plans must, among other things:
- •
- address a "worst case" scenario and identify and ensure, through contract or other approved means, the availability of
necessary private response resources;
- •
- describe crew training and drills; and
- •
- identify a qualified individual with specific authority and responsibility to implement removal actions in the event of an oil spill.
Our vessel response plans have been approved by the U.S. Coast Guard, and all of our tankermen have been trained to comply with OPA 90 requirements. In addition, we conduct regular oil-spill response drills in accordance with the guidelines set out in OPA 90. We believe that all of our vessels are in substantial compliance with OPA 90.
Environmental Spill and Release Liability. OPA 90 and various state laws substantially increased over historic levels the statutory liability of owners and operators of vessels for the discharge or substantial threat of a discharge of oil and the resulting damages, both regarding the limits of liability and the scope of damages. OPA 90 imposes joint and several strict liability on responsible parties, including owners, operators and bareboat charterers, for all oil spill and containment and clean-up costs and other damages arising from spills attributable to their vessels. A complete defense is available only when the responsible party establishes that it exercised due care and took precautions against foreseeable acts or omissions of third parties and when the spill is caused solely by an act of God, act of war (including civil war and insurrection) or a third party other than an employee or agent or party in a contractual relationship with the responsible party. These limited defenses may be lost if the responsible party fails to report the incident or reasonably cooperate with the appropriate authorities or refuses to comply with an order concerning clean-up activities. Even if the spill is caused solely by a third party, the owner or operator must pay removal costs and damage claims and then seek reimbursement from the third party or the trust fund established under OPA 90. Finally, in certain circumstances involving oil spills, OPA 90 and other environmental laws may impose criminal liability and significant crimes and penalties on personnel and/or the corporate entity.
OPA 90 limits the liability of each responsible party for oil pollution from vessels, and these limits were increased substantially in 2006. The limits of liability are subject to periodic increases to account
17
for inflation, and the U.S. Coast Guard completed an adjustment for inflation by interim rule effective July 21, 2009. The limits for a tank vessel without a qualifying double hull are the greater of (1) $3,200 per gross ton or (2) $23,496,000 for a tank vessel of greater than 3,000 tons or $6,408,000 for a tank vessel of 3,000 gross tons or less. The limits for a tank vessel with a qualifying double hull are the greater of (1) $2,000 per gross ton or (2) $17,088,000 for a tank vessel of greater than 3,000 gross tons or $4,272,000 for a tank vessel of 3,000 gross tons or less. The limits for any vessel other than a tank vessel are the greater of $1,000 per gross ton or $854,000. These limits do not apply where, among other things, the spill is caused by gross negligence or willful misconduct of, or a violation of an applicable federal safety, construction or operating regulation by, a responsible party or its agent or employee or any person acting in a contractual relationship with a responsible party. In addition to removal costs, OPA 90 provides for recovery of damages, including:
- •
- natural resource damages and related assessment costs;
- •
- real and personal property damages;
- •
- net loss of taxes, royalties, rents, fees and other lost revenues;
- •
- net costs of public services necessitated by a spill response, such as protection from fire, safety or health hazards;
- •
- loss of profits or impairment of earning capacity due to the injury, destruction or loss of real property, personal
property or natural resources; and
- •
- loss of subsistence use of natural resources.
The Consolidated Land, Energy, and Aquatic Resources Act of 2010, or CLEAR Act, passed by the House of Representatives on July 30, 2010 would amend OPA 90 in various ways but does not materially affect the currently-effective liability caps for non-tank vessels set by the Coast Guard regulations. Legislation introduced by Senator Reid on July 28, 2010 would raise caps on liability for incidents involving vessels significantly. In its current form, Senator Reid's bill sets the limits for a tank vessel without a qualifying double hull at the greater of (1) $3,300 per gross ton or (2) $93,600,000. The proposed limits for a tank vessel with a qualifying double hull are the greater of (1) $1,900 per gross ton or (2) $16,000,000. Senator Reid's bill would also create subclasses of tank vessels with various liability limits within the caps outlined above. Depending on the outcome of these pending bills, or bills to similar effect, our costs of operation and/or potential liability exposure could be increased in the event of a release.
OPA 90 requires owners and operators of vessels operating in U.S. waters to establish and maintain with the U.S. Coast Guard evidence of their financial responsibility sufficient to meet their potential liabilities imposed by OPA 90. Under the regulations, we may provide evidence of insurance, a surety bond, a guarantee, letter of credit, qualification as a self-insurer or other evidence of financial responsibility. We have qualified as a self-insurer under the regulations and have received Certificates of Financial Responsibility from the U.S. Coast Guard for all of our vessels subject to this requirement.
OPA 90 expressly provides that individual states are entitled to enforce their own oil pollution liability laws, even if such laws are inconsistent with or imposing greater liability than OPA 90. There is no uniform liability scheme among the states. Some states have schemes similar to OPA 90 that limit liability to various amounts, some rely on common law fault-based remedies and others impose strict and/or unlimited liability on an owner or operator. Virtually all coastal states have enacted their own pollution prevention, liability and response laws, whether statutory or through court decisions, with many providing for some form of unlimited liability. We believe that the liability provisions of OPA 90 and similar state laws have greatly expanded potential liability in the event of an oil spill, even in instances where we did not cause the spill. Some states have also established their own requirements for financial responsibility. However, at least two states have repealed regulations concerning the
18
operation, manning, construction or design of tank vessels as a result of the U. S. Supreme Court's 2000 ruling in United States v. Locke ("Locke"). In Locke, the Court held that the regulation of maritime commerce is generally a federal responsibility because of the need for national and international uniformity.
Parties affected by oil pollution that do not fully recover from a responsible party may pursue relief from the Oil Spill Liability Trust Fund. Responsible parties may seek reimbursement from the fund for costs incurred that exceed the liability limits of OPA 90. In order to obtain reimbursement of excess costs, the responsible party must establish that it is entitled to a statutory limitation of liability as discussed above. If we are deemed a responsible party for an oil pollution incident and are ineligible for reimbursement of excess costs, the costs of responding to an oil pollution incident could have a material adverse effect on our results of operations, financial condition and cash flows. We presently maintain oil pollution liability insurance in an amount in excess of that required by OPA 90. Through West of England, our current coverage for oil pollution is $1 billion per incident. It is possible, however, that our liability for an oil pollution incident may be in excess of the insurance coverage we maintain.
We are also subject to potential liability arising under the U.S. Comprehensive Environmental Response, Compensation, and Liability Act, or CERCLA, which applies to the discharge of hazardous substances, whether on land or at sea. Specifically, CERCLA provides for liability of owners and operators of vessels for cleanup and removal of hazardous substances. Liability under CERCLA for releases of hazardous substances from vessels is limited to the greater of $300 per gross ton or $5 million per incident unless attributable to willful misconduct or neglect, a violation of applicable standards or rules, or upon failure to provide reasonable cooperation and assistance. CERCLA liability for releases from facilities other than vessels is generally unlimited.
We are required to show proof of insurance, surety bond, self insurance or other evidence of financial responsibility to pay potential liabilities up to specified limits under both OPA 90 and CERCLA. We have satisfied these requirements and obtained a U.S. Coast Guard Certificate of Financial Responsibility for each of our tank vessels. OPA 90 and CERCLA each preserve the right to recover damages under other existing laws, including maritime tort law.
Changes in exposure to, or limits of, liability resulting from a change in law, such as that discussed above relating to the CLEAR Act, could also result in increased insurance cost or industry-wide changes in available insurance, either of which could increase our operating costs or potential liability.
Water. The federal Clean Water Act (CWA) imposes restrictions and strict controls on the discharge of pollutants into navigable waters, and such discharges generally require permits. The CWA provides for civil, criminal and administrative penalties for any unauthorized discharges and imposes substantial liability for the costs of removal, remediation and damages. State laws for the control of water pollution also provide varying civil, criminal and administrative penalties and liabilities in the case of a discharge of petroleum, its derivatives, hazardous substances, wastes and pollutants into state waters.
Other federal water quality statutes also potentially affect our operations. The Coastal Zone Management Act authorizes state implementation and development of programs of management measures for non-point source pollution to restore and protect coastal waters. The Nonindigenous Aquatic Nuisance Prevention and Control Act of 1990 and the National Invasive Species Act of 1996 authorize the U.S. Coast Guard to regulate the ballast water management practices of vessels operating in U.S. waters.
On July 23, 2008, the U.S. Ninth Circuit Court of Appeals affirmed the district court decision in Northwest Environmental Advocates v. EPA that vacated an Environmental Protection Agency's (EPA) regulation that exempted certain discharges of effluent from vessels, including discharges of ballast
19
water, from permitting requirements under the National Pollutant Discharge Elimination System (NPDES) program. In response to the court decision, EPA issued a General Permit for Discharges Incidental to the Normal Operation of a Vessel on December 18, 2008. The General Permit imposes effluent limitations on discharges from vessels and includes best management practice, inspection, reporting, and record-keeping requirements. We believe that any financial impacts resulting from the repeal of the permitting exemption for ballast water discharge and the resulting general permit for such discharges will not be material.
On August 17, 2009, the U.S. Coast Guard proposed to amend its regulations on ballast water management by establishing standards for the allowable concentration of living organisms in ballast water discharged in U.S. waters and requiring the phase-in of Coast Guard-approved ballast water management systems (BWMS). Under the Coast Guard's August 17, 2009 proposal, crude oil tankers would be exempt from requirements to install approved BWMS. The comment period for the proposed rule has closed, however the proposed regulation has not yet been finalized. In March 2010, the Coast Guard, in coordination with the EPA, proposed a draft protocol for verification of ballast water treatment technologies. The comment period for this proposed protocol expired in April 2010. We do not believe that the outcome of the proposed rulemaking or verification protocol will be material us.
Solid Waste. Our operations occasionally generate and require the transportation, treatment and disposal of both hazardous and non-hazardous solid wastes that are subject to the requirements of the federal Resource Conservation and Recovery Act, or RCRA, and comparable state and local requirements. In addition, in the course of our tank vessel operations, we engage contractors to remove and dispose of waste material, including tank residue. In the event that such waste is found to be "hazardous" under either RCRA or the CWA, and is disposed of in violation of applicable law, we could be found jointly and severally liable for the cleanup costs and any resulting damages. Finally, the EPA does not currently classify "used oil" as "hazardous waste," provided certain recycling standards are met. However, some states in which we operate have classified "used oil" as "hazardous" under state laws patterned after RCRA. The cost of managing wastes generated by tank vessel operations has increased in recent years under stricter state and federal standards. Additionally, from time to time we arrange for the disposal of hazardous waste or hazardous substances at offsite disposal facilities. If such materials are improperly disposed of by third parties, we could be liable for cleanup costs under CERCLA or the equivalent state laws. We use only certified haulers for this work.
Air Emissions. The federal Clean Air Act (CAA) authorizes the EPA to promulgate standards applicable to emissions of certain air contaminants that are emitted by our vessels, including volatile organic compounds, oxides of nitrogen, particulate matter, and sulfur dioxide. Our vessels are subject to vapor control and recovery requirements for certain cargoes when loading, unloading, ballasting, cleaning and conducting other operations in regulated port areas. A majority of our tank barges are equipped with vapor control systems that satisfy these requirements. In addition, the EPA has, in recent years, issued a series of rules imposing increasingly stringent emissions standards for various classes of marine diesel engines. While EPA's marine diesel rules do not impose immediate requirements on existing vessels, the new standards are potentially applicable to re-manufactured engines and may therefore impose added compliance costs on our operations.
The CAA also requires states to draft State Implementation Plans (SIPs) designed to attain national health-based air quality standards in primarily major metropolitan and/or industrial areas. Where states fail to present approvable SIPs or SIP revisions by certain statutory deadlines, the federal government is required to draft a Federal Implementation Plan. Several SIPs regulate emissions resulting from barge loading and degassing operations by requiring the installation of vapor control equipment. As stated above, a majority of our tank barges are already equipped with vapor control systems that satisfy these requirements. Although a risk exists that new regulations could require significant capital expenditures and otherwise increase our costs, we believe, based upon the regulations that have been proposed to date, that no material capital expenditures beyond those currently
20
contemplated and no material increase in costs are likely to be required. Certain States are considering, or have already implemented, regulations to control emissions from marine diesel engines on barges and towing vessels when operating in State waters. In the absence of regulatory relief, the most stringent of these regulations will require replacement of engines on existing vessels, which may require significant capital investment or modification of operations in certain geographic areas to remain in compliance.
Greenhouse Gas Regulation. Following adoption of the Kyoto Protocol in 2005, a number of countries adopted various regulations designed to reduce emissions of greenhouse gases as a means to reduce the potential impacts of climate change. The United States has not yet adopted broad requirements controlling greenhouse gas emissions, although there are several pending legislative proposals on the subject. The EPA has adopted regulations requiring monitoring and reporting of greenhouse gases from certain sources, and has proposed regulations for such monitoring and reporting of sources in the upstream and midstream sectors of the oil and gas business. In addition, the EPA has adopted regulations for certain new stationary sources of greenhouse gases. At present, there are no specific greenhouse regulations applicable to our tank vessels, although various governments and standards organizations (including the European Union and the International Maritime Organization) are studying regulating emissions from maritime sources. If and to the extent future greenhouse gas requirements (whether adopted by statute, regulation or treaty) affect our tank vessels, our business might be materially affected. In addition, even without such regulation, our business may be indirectly affected to the extent that such regulation reduces demand for the materials that we carry in our tank vessels, or to the extent that climate change results in sea level changes or more intense weather events.
Coastwise Laws
A substantial portion of our operations are conducted in the U.S. domestic trade, which is governed by the coastwise laws of the United States. The U.S. coastwise laws reserve marine transportation between points in the United States, including harbor tug services, to vessels built in and documented under the laws of the United States (U.S.-flag) and owned and manned by U.S. citizens. Generally, an entity is deemed a U.S. citizen for these purposes so long as:
- •
- it is organized under the laws of the United States or a state;
- •
- each of its chief executive officer (by whatever title) and the chairman of its board of directors is a U.S. citizen;
- •
- no more than a minority of the number of its directors necessary to constitute a quorum for the transaction of business
are non-U.S. citizens;
- •
- at least 75% of the interest and voting power in the entity is held by U.S. citizens free of any trust, fiduciary
arrangement or other agreement, arrangement or understanding whereby voting power may be exercised directly or indirectly by non-U.S. citizens; and
- •
- in the case of a limited partnership, the general partner meets U.S. citizenship requirements for U.S. coastwise trade.
Because we could lose the privilege of operating our vessels in the U.S. coastwise trade if non-U.S. citizens were to own or control in excess of 25% of our outstanding interests, our limited partnership agreement restricts foreign ownership and control of our common units to not more than 15% of our outstanding interests.
There have been repeated efforts aimed at repeal or significant change of the Jones Act. Although we believe it is unlikely that the Jones Act will be substantially modified or repealed, Congress could substantially modify or repeal such laws. Such changes could have a material adverse effect on our operations and financial condition.
21
Other
Our vessels are subject to the jurisdiction of the U.S. Coast Guard, the National Transportation Safety Board, the U.S. Customs and Border Protection (CBP) and the U.S. Maritime Administration, as well as subject to rules of private industry organizations such as the American Bureau of Shipping. These agencies and organizations establish safety standards and are authorized to investigate vessels and accidents and to recommend improved maritime safety standards. Moreover, to ensure compliance with applicable safety regulations, the U.S. Coast Guard is authorized to inspect vessels at will.
Occupational Health Regulations
Our shore side facilities are subject to occupational safety and health regulations issued by the U.S. Occupational Safety and Health Administration, or OSHA, and comparable state programs. These regulations currently require us to maintain a workplace free of recognized hazards, observe safety and health regulations, maintain records, and keep employees informed of safety and health practices and duties. Our vessel operations are also subject to occupational safety and health regulations issued by the U.S. Coast Guard and, to an extent, OSHA. These regulations currently require us to perform monitoring, medical testing and recordkeeping with respect to mariners engaged in the handling of the various cargoes that are transported by our tank vessels.
Vessel Condition
Our vessels are subject to periodic inspection and survey by, and drydocking and maintenance requirements of, the U.S. Coast Guard and/or the American Bureau of Shipping. We believe we are currently in compliance in all material respects with the environmental and other laws and regulations, including health and safety requirements, to which our operations are subject. We are unaware of any pending or threatened litigation or other judicial, administrative or arbitration proceedings against us occasioned by any alleged non-compliance with such laws or regulations. The risks of substantial costs, liabilities and penalties are, however, inherent in marine operations, and there can be no assurance that significant costs, liabilities or penalties will not be incurred by or imposed on us in the future.
Seasonality
We operate our tank vessels in markets that exhibit seasonal variations in demand and, as a result, in charter rates. For example, movements of clean oil products, such as motor fuels, generally increase during the summer driving season. In certain regions, movements of black oil products and distillates, such as heating oil, generally increase during the winter months, while movements of asphalt products generally increase in the spring through fall months. Unseasonably cold winters result in significantly higher demand for heating oil in the northeastern United States. Meanwhile, our operations along the West Coast and in Alaska historically have been subject to seasonal variations in demand that vary from those exhibited in the East Coast and Gulf Coast regions. The summer driving season can increase demand for automobile fuel in all of our markets and, accordingly, the demand for our services. A decline in demand for, and level of consumption of, refined petroleum products could cause demand for tank vessel capacity and charter rates to decline, which would decrease our revenues and cash flows. Our West Coast operations provide seasonal diversification primarily as a result of services to our Alaskan markets, which experience the greatest demand for petroleum products in the summer months, due to weather conditions. Considering the above, we believe seasonal demand for our services is lowest during our third fiscal quarter. We do not see any significant seasonality in the Hawaiian market.
22
Properties
Pier facilities, a water treatment facility and office space in Norfolk, Virginia were leased beginning in December 2004 through October 2009. On October 30, 2009, we exercised the purchase option in the lease agreement to acquire the land and buildings. We have a definitive agreement to sell our property in Norfolk, Virginia, which should close by the end of September 2010. We will lease back a portion of the premises for up to six months.
We lease pier facilities and office space in Staten Island, New York. The lease expires in April 2019; however, we have the option to renew it for one additional ten-year period.
We lease office space for our principal executive office in East Brunswick, New Jersey, for which the lease expires in December 2013.
We lease pier and wharf facilities and office and warehouse space in Seattle, Washington and Philadelphia, Pennsylvania. These leases expire in 2013 and 2018, respectively.
We lease a parcel of land, pier facilities and office and warehouse space, on a month to month basis, in Honolulu, Hawaii. We also lease additional office space in Honolulu, Hawaii for which the lease expires February 2014.
SEC Reporting
We file annual, quarterly and current reports and other materials with the SEC. You may read and copy any materials we file with the SEC at the SEC's Public Reference Room at 100 F Street, NE, Washington, DC 20549. You may obtain information regarding the Public Reference Room by calling the SEC at 1-800-SEC-0330. In addition, the SEC maintains a website at www.sec.gov that contains reports, proxy and information statements, and other information regarding issuers that file electronically with the SEC.
We also provide electronic access to our periodic and current reports on our website, www.k-sea.com, free of charge. These reports are available on our website as soon as reasonably practicable after we electronically file such materials with, or furnish them to, the SEC. Information on our website or any other website is not incorporated by reference into this report and does not constitute a part of this report.
Risks Inherent in Our Business
Marine transportation is an inherently risky business.
Our vessels and their cargoes are at risk of being damaged or lost because of events such as:
- •
- marine disasters;
- •
- bad weather;
- •
- mechanical failures;
- •
- grounding, fire, explosions and collisions;
- •
- human error; and
- •
- war and terrorism.
All of these hazards can result in death or injury to persons, loss of property, environmental damages, delays or rerouting. If one of our vessels were involved in an accident, with the potential risk
23
of environmental contamination, the resulting media coverage could have a material adverse effect on our business, financial condition and results of operations.
Our affiliate, EW Transportation LLC, and its predecessors have been named, together with a large number of other companies, as co-defendants in 39 civil actions by various parties alleging unspecified damages from past exposure to asbestos and second-hand smoke aboard some of the vessels that it contributed to us in connection with the initial public offering of our common units. EW Transportation LLC and its predecessors have been dismissed from 38 of these lawsuits for an aggregate sum of approximately $47,000. The remaining case has been administratively dismissed, which effectively means that it remains active for routine matters not requiring a formal hearing. We may be subject to litigation in the future involving these plaintiffs and others alleging exposure to asbestos due to alleged failure to properly encapsulate friable asbestos or remove friable asbestos on our vessels, as well as for exposure to second-hand smoke and other matters.
A decline in demand for, and level of consumption of, refined petroleum products could cause demand for tank vessel capacity and charter rates to decline, which would decrease our revenues and profitability.
The demand for our services has declined over the past twelve months, as evidenced by the decrease in the net utilization rate for our fleet from 85% for fiscal 2009 to 77% for fiscal 2010. We expect the demand for our tank vessels to continue to be weak for the foreseeable future. The demand for tank vessel capacity is influenced by the demand for refined petroleum products and other factors including:
- •
- global and regional economic and political conditions;
- •
- developments in international trade;
- •
- changes in seaborne and other transportation patterns, including changes in the distances that cargoes are transported;
- •
- environmental concerns; and
- •
- competition from alternative sources of energy, such as natural gas, and alternate transportation methods.
In addition, a long-term global recession could reduce the demand for domestic refined petroleum transportation services and charter and freight rates, and could increase costs, thus adversely affecting the results of our operations. Any of these factors could adversely affect the demand for tank vessel capacity and charter rates. Any decrease in demand for tank vessel capacity or decrease in charter rates could adversely affect our business, financial condition and results of operations.
In addition, we operate our tank vessels in markets that have historically exhibited seasonal variations in demand and, as a result, in charter rates. For example, movements of certain clean oil products, such as motor fuels, generally increase during the summer driving season. In those same regions, movements of black oil products and certain clean oil products, such as heating oil, generally increase during the winter months, while movements of asphalt products generally increase in the spring through fall months. Unseasonably mild winters can result in significantly lower demand for heating oil in the northeastern United States. Meanwhile, our operations along the West Coast and in Alaska historically have been subject to seasonal variations in demand that vary from those exhibited in the East Coast and Gulf Coast regions. In addition, unpredictable weather patterns and variations in oil reserves disrupt vessel scheduling. Seasonality could materially affect our business, financial condition and results of operations in the future.
24
Our substantial indebtedness could limit our flexibility and adversely affect our financial health.
We have a substantial amount of indebtedness. As of June 30, 2010, we had approximately $382.9 million of indebtedness outstanding. As of September 10, 2010, after repayment of existing debt with proceeds from the sale of preferred units, net of estimated transaction related costs, and the proceeds on the sale of two tug boats and two double-hull barges, we had approximately $286.6 million of indebtedness outstanding. Our substantial indebtedness could limit our flexibility and adversely affect our financial health. For example, it could:
- •
- make us more vulnerable to general adverse economic and industry conditions;
- •
- require us to dedicate a substantial portion of our cash flow from operations to payments on our indebtedness, thereby
reducing the availability of our cash flow for operations and other purposes;
- •
- limit our flexibility in planning for, or reacting to, changes in our business and the industry in which we operate; and
- •
- place us at a competitive disadvantage compared to competitors that may have proportionately less indebtedness.
In addition, our ability to make scheduled payments or to refinance our obligations depends on our successful financial and operating performance. We cannot assure you that our operating performance will generate sufficient cash flow or that our capital resources will be sufficient for payment of our indebtedness obligations in the future. Our financial and operating performance, cash flow and capital resources depend upon prevailing economic conditions and certain financial, business and other factors, many of which are beyond our control.
If our cash flow and capital resources are insufficient to fund our debt service obligations, we may be forced to sell material assets or operations, obtain additional capital or restructure our debt. In the event that we are required to dispose of material assets or operations or restructure our debt to meet our debt service and other obligations, we cannot assure you as to the terms of any such transaction or how quickly any such transaction could be completed, if at all.
We may not be able to obtain additional funding for future capital needs or to refinance our debt, either on acceptable terms or at all.
Global financial markets and economic conditions have been, and continue to be, disrupted and volatile, which has caused substantial contraction in the credit and capital markets. These conditions, along with significant write-offs in the financial services sector and current weak economic conditions, have made, and will likely continue to make, it difficult to obtain funding for our capital needs. As a result, the cost of raising money in the debt and equity capital markets has increased substantially while the availability of funds from those markets has diminished significantly. Due to these factors, we cannot be certain that new debt or equity financing will be available to us on acceptable terms or at all. If funding is not available when needed, or is available only on unfavorable terms, we may be unable to meet our obligations as they come due. Without adequate funding, we may be unable to execute our strategy, complete future acquisitions or future construction projects or other capital expenditures, take advantage of other business opportunities or respond to competitive pressures, any of which could have a material adverse effect on our revenues and results of operations.
Voyage charters may not be available at rates that will allow us to operate our vessels profitably.
During fiscal 2010, we derived approximately 30% of our revenue from single voyage charters. We expect the percentage of our revenue derived from single voyage charters to increase in fiscal 2011 in light of continued weak economic conditions and an oversupply of barrel-carrying capacity. Voyage
25
charter rates fluctuate significantly based on tank vessel availability, the demand for refined petroleum products and other factors. Increased dependence on the voyage charter market by us could result in a lower utilization of our vessels and decreased profitability. Future voyage charters may not be available at rates that will allow us to operate our vessels profitably.
We may not be able to renew time charters, consecutive voyage charters, contracts of affreightment and bareboat charters when they expire.
We received approximately 70% of our revenue from time charters, consecutive voyage charters, contracts of affreightment and bareboat charters during fiscal 2010. These arrangements, which are generally for periods of one year or more, may not be renewed, or if renewed, may not be renewed at similar rates. During the fiscal year ended June 30, 2010, long-term charters on 29% of our fleet's capacity expired. Despite ongoing negotiations with our customers, with the exception of six term charters that were renewed (approximately 10% of our fleet capacity), we were unable to obtain additional long-term charters resulting in such vessels moving to the spot market. An additional 14% of our fleet's capacity is due for renewal or extension in fiscal 2011. We expect the market for long-term charters, consecutive voyage charters, contracts of affreightment and bareboat charters to continue to be weak until demand for refined products recovers. Our time charters, consecutive voyage charters, contracts of affreightment and bareboat charters may not be renewed, or if renewed, may not be renewed at similar rates. If we are unable to obtain new charters at rates equivalent to those received under the old charters, or utilize vessels coming off charter in the spot market, our profitability may be adversely affected.
We may not be able to grow or effectively manage our growth.
A principal focus of our long-term strategy is to continue to grow by expanding our business in all Jones Act markets in the U.S. and also into other geographic markets. Our future growth will depend upon a number of factors, some of which we can control and some of which we cannot. These factors include our ability to:
- •
- identify new geographic markets;
- •
- identify businesses engaged in managing, operating or owning vessels for acquisitions or joint ventures;
- •
- identify vessels for acquisition;
- •
- consummate acquisitions or joint ventures;
- •
- obtain required financing for acquisitions;
- •
- integrate any acquired businesses or vessels successfully with our existing operations; and
- •
- hire, train and retain qualified personnel to manage and operate our growing business and fleet.
A deficiency in any of these factors would adversely affect our ability to achieve anticipated levels of cash flows or realize other anticipated benefits. In addition, competition from other buyers could reduce our acquisition opportunities or cause us to pay a higher price than we might otherwise pay.
Acquisitions typically increase our debt and subject us to other substantial risks, which could adversely affect our results of operations.
From time to time, we may evaluate and seek to acquire assets or businesses that we believe complement our existing business and related assets. Any acquisition of a vessel or business may not be profitable and may not generate returns sufficient to justify our investment. In addition, any acquisition
26
growth strategy exposes us to risks that may harm our business, financial condition and operating results involves potential risks, including the risks that we may:
- •
- fail to realize anticipated benefits (such as new customer relationships) or increase cash flow;
- •
- decrease our liquidity by using a significant portion of available cash or borrowing capacity to finance acquisitions;
- •
- significantly increase our interest expense and indebtedness if we incur additional debt to finance acquisitions;
- •
- incur or assume unanticipated liabilities, losses or costs associated with the business or vessels acquired;
- •
- incur other significant charges, such as impairment of goodwill or other intangible assets, asset devaluation or
restructuring charges; or
- •
- distract management from its duties and responsibilities as it devotes substantial time and attention to the integration of the acquired businesses or vessels.
Management's assessment of these risks is necessarily inexact and may not reveal or resolve all existing or potential problems associated with an acquisition. Realization of any of these risks could adversely affect our operations and cash flows. If we consummate any future acquisition, our capitalization and results of operations may change significantly, and you will not have the opportunity to evaluate the economic, financial and other relevant information that we will consider in determining the application of these funds and other resources.
Additionally, our ability to grow our asset base in the near future through acquisitions may be limited due to our lack of access to capital markets.
Increased competition in the domestic tank vessel industry could result in reduced profitability and loss of market share for us.
Contracts for our vessels are generally awarded on a competitive basis, and competition in the markets we serve is intense. The level of competition in our industry has intensified over the past several years as many customers have shifted their preferences from long-term contracts to short-term contacts in light of uncertain market conditions. In addition, the weak economy, combined with an oversupply of barrel-carrying capacity, have forced down average daily rates and adversely affected our profitability.
The process for obtaining contracts for our vessels generally requires a lengthy and time consuming screening and bidding process that may extend for months. The most important factors determining whether a contract will be awarded include:
- •
- quality, availability and capability of the vessels;
- •
- ability to meet the customer's schedule;
- •
- price;
- •
- environmental, health and safety record;
- •
- reputation; and
- •
- experience
Some of our competitors may have greater financial resources and larger operating staffs than we do. As a result, they may be able to make vessels available more quickly and efficiently, and withstand the effects of declines in charter rates for a longer period of time. They may also be better able to
27
weather a downturn in the coastwise transportation industry. As a result, we could lose customers and market share to these competitors.
Increased competition from pipelines could result in reduced profitability.
We also face competition from refined petroleum product pipelines. Long-haul transportation of refined petroleum products is generally less costly by pipeline than by tank vessel. The construction of new pipeline segments to carry petroleum products into our markets, including pipeline segments that connect with existing pipeline systems and the conversion of existing non-refined petroleum product pipelines could adversely affect our ability to compete in particular locations.
We rely on a limited number of customers for a significant portion of our revenues. The loss of any of these customers could adversely affect our business and operating results.
Our customers consist primarily of major oil companies, oil traders and refineries. The portion of our revenues attributable to any single customer changes over time, depending on the level of relevant activity by the customer, our ability to meet the customer's needs and other factors, many of which are beyond our control. Two customers accounted for 16% and 11%, respectively, of our consolidated total revenues for fiscal 2010. If we were to lose either of these customers or if either of them significantly reduced its use of our services, our business and operating results could be adversely affected.
Our business would be adversely affected if we failed to comply with the Jones Act provisions on coastwise trade, or if those provisions were modified, repealed or waived.
We are subject to the Jones Act and other federal laws that restrict maritime transportation between points in the United States to vessels built and registered in the United States and owned and manned by U.S. citizens. We are responsible for monitoring the ownership of our common units and other partnership interests. If we do not comply with these restrictions, we would be prohibited from operating our vessels in U.S. coastwise trade, and under certain circumstances we would be deemed to have undertaken an unapproved foreign transfer, resulting in severe penalties, including permanent loss of U.S. coastwise trading rights for our vessels, fines or forfeiture of the vessels. For information about the Jones Act and other maritime laws, please read "Regulation—Coastwise Laws" in Item 1of this report.
In the past, interest groups have lobbied Congress to repeal the Jones Act to facilitate foreign flag competition for trades and cargoes currently reserved for U.S.-flag vessels under the Jones Act and cargo preference laws. We believe that interest groups may continue efforts to modify or repeal the Jones Act and cargo preference laws currently benefiting U.S.-flag vessels. If these efforts are successful, it could result in increased competition, which could reduce our revenues and cash available for distribution.
The Secretary of the Department of Homeland Security is vested with the authority and discretion to waive the coastwise laws to such extent and upon such terms as he may prescribe whenever he deems that such action is necessary in the interest of national defense. In response to the effects of Hurricanes Katrina and Rita, the Secretary of the Department of Homeland Security waived the coastwise laws generally for the transportation of petroleum products from September 1 to September 19, 2005 and from September 26, 2005 to October 24, 2005. In the past, the Secretary of the Department of Homeland Security has waived the coastwise laws generally for the transportation of petroleum released from the Strategic Petroleum Reserve undertaken in response to circumstances arising from major natural disasters. Any waiver of the coastwise laws, whether in response to natural disasters or otherwise, could result in increased competition from foreign tank vessel operators, which could reduce our revenues and cash available for distribution.
28
We must make substantial expenditures to maintain the operating capacity of our fleet, which will reduce our cash available for distribution.
Tank vessels are subject to the requirements of the Oil Pollution Act of 1990, or OPA 90. OPA 90 mandates that all single-hull tank vessels operating in U.S. waters be removed from petroleum and petroleum product transportation services at various times by January 1, 2015, and provides a schedule for the phase-out of the single-hull vessels based on their age and size. As of September 1, 2010, approximately 90% of the barrel-carrying capacity of our tank vessel fleet was double-hulled in compliance with OPA 90. The remaining 10% will be in compliance with OPA 90 until January 2015. The weak demand in the market for such single-hull vessels has resulted in our determining we would phase out certain of our single- hull vessels prior to their OPA 90 phase out dates. Based on the current demand levels for vessels in the market place, we do not expect to replace our remaining single-hull barrel capacity prior to vessel retirement.
Marine transportation of refined petroleum products is a capital intensive business, requiring significant investment to maintain an efficient fleet and to stay in regulatory compliance. We estimate that, over the next five years, we will spend an average of approximately $21.4 million per year to drydock and maintain our fleet. Periodically, we will also make expenditures to acquire or construct additional tank vessel capacity and to upgrade our overall fleet efficiency.
Please read "—Risks Related to Our Common Units—In calculating our available cash from operating surplus each quarter, we are required to deduct estimated maintenance capital expenditures, which may result in less cash available for distribution to unitholders than if actual maintenance capital expenditures were deducted" for information about our requirement to deduct estimated maintenance capital expenditures in calculating our available cash from operating surplus.
Capital expenditures and other costs necessary to operate and maintain a vessel vary depending on the age of the vessel and changes in governmental regulations, safety or other equipment standards.
Capital expenditures and other costs necessary to operate and maintain a vessel increase with the age of the vessel. In addition, changes in governmental regulations, safety or other equipment standards, as well as compliance with standards imposed by maritime self-regulatory organizations and customer requirements or competition, may require us to make additional expenditures. For example, we may be required to make significant expenditures for alterations or the addition of new equipment to satisfy requirements of the U.S. Coast Guard and the American Bureau of Shipping. In addition, we may be required to take our vessels out of service for extended periods of time, with corresponding losses of revenues, in order to make such alterations or to add such equipment. In the future, market conditions may not justify these expenditures or enable us to operate our older vessels profitably during the remainder of their economic lives.
In order to fund these capital expenditures, we will either incur borrowings or raise capital through the sale of debt or equity securities. Our ability to access the capital markets for future offerings may be limited by our financial condition at the time, by changes in laws and regulations (or interpretation thereof) and by adverse market conditions resulting from, among other things, general economic conditions and contingencies and uncertainties that are beyond our control. Our failure to obtain the funds for necessary future capital expenditures would limit our ability to continue to operate some of our vessels and could have a material adverse effect on our business and on our ability to make distributions to unitholders.
Our purchase of existing vessels carries risks associated with the quality of those vessels.
Our fleet renewal and expansion strategy implemented over the past five years included the acquisition of existing vessels as well as the ordering of newbuildings. In the future we may acquire existing vessels as a way of renewing and expanding our fleet. Unlike newbuildings, existing vessels
29
typically do not carry warranties with respect to their condition. While we generally inspect any existing vessel prior to purchase, such an inspection would normally not provide us with as much knowledge of its condition as we would possess if the vessel had been built for us and operated by us during its life. Repairs and maintenance costs for existing vessels are difficult to predict and may be more substantial than for vessels we have operated since they were built. These costs could decrease our profits and reduce our liquidity.
Delays or cost overruns in the construction of new vessels or the modification of existing vessels could adversely affect our business. Cash flows from new or retrofitted vessels may not be immediate or as high as expected.
We have entered into an agreement with a shipyard to lease a 50,000-barrel tank barge. In addition, we recently completed our newbuild tank construction program with the delivery of two 30,000-barrel barges (DBL 33 and DBL 34) completed at an estimated aggregate cost of $6.6 million, of which $1.1 million had been spent as of June 30, 2010. We may enter into agreements to commence newbuild projects in the future. Such projects are subject to the risk of delay or cost overruns caused by the following:
- •
- unforeseen quality or engineering problems;
- •
- work stoppages;
- •
- weather interference;
- •
- unanticipated cost increases;
- •
- delays in receipt of necessary equipment; and
- •
- an inability to obtain the requisite permits or approvals.
Significant delays could also have a material adverse effect on expected contract commitments for these vessels and our future revenues and cash flows. We will not receive any material increase in revenue or cash flow from new or modified vessels until they are placed in service and customers enter into binding arrangements for the use of the vessels. Furthermore, customer demand for new or modified vessels may not be as high as we currently anticipate, and, as a result, our future cash flows may be adversely affected.
Decreased utilization of our vessels due to bad weather could have a material adverse effect on our operating results and financial condition.
Unpredictable weather patterns tend to disrupt vessel scheduling and supplies of refined petroleum products and our vessels and cargoes are at risk of being damaged or lost because of bad weather. In addition, adverse weather conditions can cause delays in the delivery of newbuilds and in transporting cargoes. As a result, bad weather conditions could have a material adverse effect on our operating results and financial condition.
We are subject to complex laws and regulations, including environmental regulations that can adversely affect the cost, manner or feasibility of doing business.
Increasingly stringent federal, state and local laws and regulations governing worker health and safety and the manning, construction and operation of vessels significantly affect our operations. Many aspects of the marine industry are subject to extensive governmental regulation by the U.S. Coast Guard, the Department of Transportation, the Department of Homeland Security, the National Transportation Safety Board, the EPA and the U.S. Customs and Border Protection (CBP), and to regulation by private industry organizations such as the American Bureau of Shipping. The U.S. Coast Guard and the National Transportation Safety Board set safety standards and are authorized to
30
investigate vessel accidents and recommend improved safety standards. The U.S. Coast Guard is authorized to inspect vessels at will.
Our operations are also subject to federal, state, local and international laws and regulations that control the discharge of pollutants into the environment or otherwise relate to environmental protection. These laws cover a wide range of our operations and equipment. Compliance with such laws, regulations and standards, and particularly potential future changes in such laws (including possible climate change regulation), may require installation of costly equipment or operational changes. Failure to comply with applicable laws and regulations may result in administrative and civil penalties, criminal sanctions or the suspension or termination of our operations. Some environmental laws often impose strict liability for remediation of spills and releases of oil and hazardous substances, which could subject us to liability without regard to whether we were negligent or at fault. Under OPA 90, owners, operators and bareboat charterers are jointly and severally strictly liable for the discharge of oil within the internal and territorial waters of, and the 200-mile exclusive economic zone around, the United States. The United States Congress is considering amendments to OPA 90 that may increase our exposure to such claims. Additionally, an oil spill could result in significant liability, including fines, penalties, criminal liability and costs for natural resource damages, in addition to damages for personal injury, property damage, certain governmental claims and other economic harm, under OPA 90 and other federal or state statutes and common law. The potential for these releases could increase as we increase our fleet capacity. Most states bordering on a navigable waterway have enacted legislation providing for potentially unlimited liability for the discharge of pollutants within their waters.
Our insurance may not be adequate to cover our losses.
We may not be adequately insured to cover losses from our operational risks, which could have a material adverse effect on our operations. For example, a catastrophic oil spill or other disaster could exceed our insurance coverage. In addition, our affiliate, EW Transportation LLC, and its predecessors may not have insurance coverage prior to March 1986. If we were subject to claims related to that period, including claims from current or former employees, EW Transportation LLC may not have insurance to pay the liabilities, if any, that could be imposed on us. If we had to pay claims solely out of our own funds, it could have a material adverse effect on our financial condition. Furthermore, any claims covered by insurance would be subject to deductibles, and since it is possible that a large number of claims could be brought, the aggregate amount of these deductibles could be material.
We may not be able to procure adequate insurance coverage at commercially reasonable rates in the future, and some claims may not be paid. In the past, stricter environmental regulations have led to higher costs for insurance covering environmental damage or pollution, and new regulations could lead to similar increases or even make this type of insurance unavailable. In addition, our insurance may be voidable by the insurers as a result of certain actions of ours.
We have received and may receive additional calls from our mutual insurance carrier, which would result in additional expense for us.
Because we obtain some of our insurance through protection and indemnity associations, we also may be subject to calls, or premiums, in amounts based not only on our own claim records, but also the claim records of all other members of the protection and indemnity associations through which we receive insurance coverage for tort liability, including pollution-related liability. Our payment of these calls could result in significant expenses to us, which could reduce our profits or cause losses. Moreover, the protection and indemnity clubs and other insurance providers reserve the right to make changes in insurance coverage with little or no advance notice.
31
In December 2008, we received an additional call from our mutual insurance carrier. The call was primarily retrospective for policy years covering February 2006 through February 2009. The decision to make the call was based primarily on falling investment returns and projected underwriting losses. Our insurance carrier has the right to make these calls when it believes the level of its reserves will be insufficient to meet certain regulatory requirements. Our insurance carrier scheduled the payment of these calls in four installments due over a two year period, which allow for the reassessment at various points as to whether the calls remained necessary. The additional calls totaled approximately $3.8 million. We may be subject to additional calls from our mutual insurance carrier in the future, which could decrease our profits.
Terrorist attacks have resulted in increased costs and have disrupted our business. Continued hostilities in the Middle East or other sustained military campaigns may adversely impact our results of operations.
After the terrorist attacks of September 11, 2001, New York Harbor was shut down temporarily, resulting in the suspension of our local operations in the New York City area for four days and the loss of revenue related to these operations. The long-term impact that terrorist attacks and the threat of terrorist attacks may have on the petroleum industry in general, and on us in particular, is not known at this time. Uncertainty surrounding continued hostilities in the Middle East or other sustained military campaigns may affect our operations in unpredictable ways, including disruptions of petroleum supplies and markets, and the possibility that infrastructure facilities could be direct targets of, or indirect casualties of, an act of terror.
Changes in the insurance markets attributable to terrorist attacks may make certain types of insurance more difficult for us to obtain. Moreover, the insurance that may be available to us may be significantly more expensive than our existing insurance coverage. Instability in the financial markets as a result of terrorism or war could also affect our ability to raise capital.
We depend upon unionized labor for the provision of our services in certain geographic areas. Any work stoppages or labor disturbances could disrupt our business in those areas.
As of June 30, 2010, approximately 41% of our seagoing personnel were employed under a contract with a division of the International Longshoreman's Association that expires on June 30, 2011. Any work stoppages or other labor disturbances could have a material adverse effect on our business, financial condition and results of operations.
Our employees are covered by federal laws that may subject us to job-related claims in addition to those provided by state laws.
Some of our employees are covered by provisions of federal statutory and general maritime law. These laws typically operate to make liability limits established by state workers' compensation laws inapplicable to these employees and to permit these employees and their representatives to pursue actions against employers for job-related injuries in federal courts. Because we are not generally protected by the limits imposed by state workers' compensation statutes, we may have greater exposure for claims made by these employees.
Our vessels are crewed by certified and adequately trained personnel.
Our vessel employees, including captains, engineers, tankermen, mates and deckhands are licensed and certified. We rely on such vessel personnel to comply with safety rules and maritime laws and regulations during the course of transportation. The inability or failure to employ such certified personnel can adversely affect the success of our business.
32
We depend on key personnel for the success of our business.
We depend on the services of our senior management team and other key personnel. In particular, our success depends on the continued efforts of Mr. Timothy J. Casey, the President and Chief Executive Officer of K-Sea General Partner GP LLC, and other key employees. The loss of the services of any key employee could have a material adverse effect on our business, financial condition and results of operations. We may not be able to locate or employ on acceptable terms qualified replacements for senior management or key employees if their services were no longer available.
Due to our lack of asset diversification, adverse developments in our marine transportation business could adversely affect our business, financial condition, results of operations.
We rely exclusively on the revenues generated from our marine transportation business. Due to our lack of asset diversification, an adverse development in this business would have a significantly greater impact on our business, financial condition and results of operations than if we maintained more diverse assets.
Changes in international trade agreements could affect our ability to provide marine transportation services at competitive rates.
Currently, vessel trade or marine transportation between two points within the same country, generally known as cabotage or coastwise trade, is not included in the General Agreement on Trade in Services or the North American Free Trade Agreement. In addition, the Jones Act restricts maritime cargo transportation between U.S. ports to U.S.-flag vessels qualified to engage in U.S. coastwise trade. If maritime services were deemed to include cabotage and included in the General Agreement on Trade in Services, the North American Free Trade Agreement or other multi-national trade agreements, transportation of maritime cargo between U.S. ports could be opened to foreign-flag vessels. Foreign vessels would have lower construction costs and would generally operate at significantly lower costs than we do in U.S. markets, which would likely have a material adverse effect on our ability to compete.
Our revolving loan and credit agreements, our term loans and certain of our operating lease agreements contain restrictive covenants, including the requirement that we maintain defined ratios of asset coverage, fixed charge coverage and total funded debt to EBITDA (as defined in the agreements). Our failure to comply with our financial covenants could result in an event of default. If a default were to occur and we were unable to obtain a waiver, it could result in the related debt becoming immediately due and payable and the vessels under operating lease being seized by their owners, which would have a material adverse effect on our business and financial condition.
The agreements governing our credit facility, the term loans and the operating lease agreements contain restrictive covenants including the requirement that we maintain defined ratios of asset coverage, fixed charge coverage and total funded debt to EBITDA (as defined in the agreements).
We have taken actions such as selling assets and issuing limited partner units to enhance cash generation and reduce debt in order to facilitate compliance with our financial covenants. In the future, we may need to take additional actions to enhance cash generation and/or reduce debt, which may include, refinancing existing indebtedness, selling assets, issuing additional common or preferred units or pursuing other financing alternatives. If it becomes necessary for us to take such actions and we are unsuccessful or are otherwise unable to obtain waivers of our financial covenants, we may be in breach of such covenants, which could result in an event of default. If a default were to occur and we were unable to obtain a waiver, it could result in the related debt becoming immediately due and payable and the vessels under operating lease being seized by their owners, which would have a material adverse effect on our business and financial condition.
33
On August 17, 2010, the FASB and IASB proposed a new approach to lease accounting that would significantly change the way entities account for leases. Their exposure drafts "Leases" would result in a converged standard that ensure assets and liabilities arising from lease contracts are recognized in the balance sheet. The proposal effectively eliminates off-balance sheet accounting for most leases. All assets currently leased under operating leases would be brought onto the balance sheet, removing the distinction between capital and operating leases.
Pre-existing leases are not expected to be grandfathered, with the exception of "simple capital leases." The boards are proposing that lessees and lessors apply the new leasing approach by recognizing assets and liabilities for all outstanding leases at the date of the earliest period presented using a simplified retrospective approach. The new asset—representing the right to use the leased item for the lease term—and liability—representing the obligation to pay rentals—would be recognized and carried at amortized cost, based on the present value of payments over the term of the lease.
The exposure draft does not propose a specific effective date; however our current expectation is that the final standard is to have an effective date no earlier than 2012.
As of June 30, 2010 we have significant operating lease obligations, a majority of which expire after 2011. Such operating lease obligations, if required to be recorded as a liability on the balance sheet, would affect certain of our revolving loan and credit agreements, term loan and operating lease financial covenants relating to fixed charge coverage and total funded debt to EBITDA ratios, and may impact our ability to comply with such financial covenants. If we are unable to comply with our financial covenants it would have a material adverse effect on our business and financial condition.
Risks Related to Our Common Units
We may not have sufficient cash from operations to enable us to pay future quarterly distributions following establishment of cash reserves and payment of fees and expenses, including payments to our preferred unitholders and our general partner.
We have not paid a cash distribution for any quarter after September 30, 2009. Any decision to resume cash distributions on our units and the amount of any such distributions would consider maintaining sufficient cash flow in excess of the distribution to continue to move towards lower leverage levels. We will also consider general economic conditions and our outlook for our business as we determine to pay any distribution. The Revolver and ATB Amendments prohibit cash distributions prior to the end of the March 31, 2011 quarter and thereafter limit quarterly cash distributions to our unitholders to $0.45 per unit provided that we maintain a minimum liquidity of $17.5 million. If these conditions are satisfied, we will be permitted to pay distributions if (a) the fixed charge coverage ratio is at least 1.0 to 1.0 for two consecutive fiscal quarters prior to and after giving effect to such distributions; (b) the projected fixed charge coverage ratio is equal to or greater than 1.0 to 1.0 for the next twelve months and is equal to or greater than 1.0 to 1.0 in three of four of those quarters; and (c) the total funded debt to EBITDA ratio is less than 5.0 to 1.0.
Subject to the limitations contained in our Revolving Loan Agreement, and our ATB Agreement (collectively, "Revolver and ATB Agreements"), the amount of cash we can distribute on our common units principally depends upon the amount of cash we generate from our operations, which will fluctuate from quarter to quarter based on, among other things:
- •
- the level of consumption of refined petroleum products in the markets in which we operate;
- •
- the prices we obtain for our services;
- •
- the level of our operating costs, including payments to our general partner; and
- •
- prevailing economic conditions.
34
Additionally, the actual amount of cash we have available for distribution depends on other factors such as:
- •
- the level of capital expenditures we make, including for acquisitions, retrofitting of vessels and compliance with new
regulations;
- •
- the restrictions contained in our debt instruments and our debt service requirements;
- •
- the restrictions contained in our operating lease agreements and our lease service requirements;
- •
- fluctuations in our working capital needs;
- •
- our ability to make working capital borrowings; and
- •
- the amount, if any, of reserves, including reserves for future capital expenditures and other matters, established by our general partner in its discretion.
The amount of cash we have available for distribution depends primarily on our cash flow, including cash flow from operations and working capital borrowings, and not solely on profitability, which will be affected by non-cash items. As a result, we may make cash distributions during periods when we record losses and may not make cash distributions during periods when we record net income.
K-Sea General Partner L.P. and its affiliates have conflicts of interest and limited fiduciary duties, which may permit them to favor their own interests to the detriment of our unitholders.
As of September 10, 2010, affiliates of our general partner indirectly owned a 0.58% general partner interest and a 11.77% limited partner interest in us and own and control K-Sea General Partner GP LLC. Conflicts of interest may arise between K-Sea General Partner L.P. and its affiliates, on the one hand, and us and our unitholders, on the other hand. As a result of these conflicts, our general partner may favor its own interests and the interests of its affiliates over the interests of our unitholders. These conflicts include, among others, the following situations:
- •
- our general partner is allowed to take into account the interests of parties other than us, such as our affiliates, in
resolving conflicts of interest, which has the effect of limiting its fiduciary duty to our unitholders;
- •
- our general partner may limit its liability and reduce its fiduciary duties, while also restricting the remedies available
to our unitholders for actions that, without the limitations, might constitute breaches of fiduciary duty. As a result of purchasing common units, our unitholders consent to some actions and conflicts
of interest that might otherwise constitute a breach of fiduciary or other duties under applicable state law;
- •
- our general partner determines the amount and timing of asset purchases and sales, capital expenditures, borrowings,
issuances of additional partnership securities and reserves, each of which can affect the amount of cash that is distributed to our unitholders;
- •
- in some instances, our general partner may cause us to borrow funds in order to permit the payment of cash distributions,
even if the purpose or effect of the borrowing is to make incentive distributions;
- •
- our general partner determines which costs incurred by it and its affiliates, including K-Sea General
Partner GP LLC, are reimbursable by us;
- •
- our partnership agreement does not restrict our general partner from causing us to pay it or its affiliates for any services rendered on terms that are fair and reasonable to us or entering into additional contractual arrangements with any of these entities on our behalf;
35
- •
- our general partner controls the enforcement of obligations owed to us by it and its affiliates; and
- •
- our general partner decides whether to retain separate counsel, accountants or others to perform services for us.
Even if unitholders are dissatisfied, they would have difficulty removing our general partner without its consent.
Unlike the holders of common stock in a corporation, unitholders have only limited voting rights on matters affecting our business and, therefore, limited ability to influence management's decisions regarding our business. Unitholders did not elect our general partner or the board of directors of its general partner and will have no right to elect our general partner or the board of directors of its general partner on an annual or other continuing basis. The board of directors of the general partner of our general partner is chosen by its members.
Furthermore, if the unitholders are dissatisfied with the performance of our general partner, they will have difficulty removing our general partner. The vote of the holders of at least 662/3% of all outstanding common units is required to remove our general partner.
Cause is narrowly defined in our partnership agreement to mean that a court of competent jurisdiction has entered a final, non-appealable judgment finding our general partner liable for actual fraud, gross negligence or willful or wanton misconduct in its capacity as our general partner. Cause does not include most cases of charges of poor management of the business.
Our general partner's discretion in establishing cash reserves may reduce the amount of cash available for future distributions to unitholders.
Our partnership agreement gives our general partner broad discretion in establishing financial reserves for the proper conduct of our business. These reserves also will affect the amount of cash available for distribution.
In calculating our available cash from operating surplus each quarter, we are required to deduct estimated maintenance capital expenditures, which may result in less cash available for future distributions to unitholders than if actual maintenance capital expenditures were deducted.
Our partnership agreement requires us to deduct estimated maintenance capital expenditures from operating surplus each quarter, as opposed to actual maintenance capital expenditures, in order to reduce disparities in operating surplus caused by the fluctuating level of maintenance capital expenditures, such as drydocking. The amount of estimated maintenance capital expenditures we deduct from operating surplus is subject to review and change by the board of directors of K-Sea General Partner GP LLC, with the concurrence of the conflicts committee of such board. In years when estimated maintenance capital expenditures are higher than actual maintenance capital expenditures, the amount of cash available for distribution to unitholders will be lower than if actual maintenance capital expenditures were deducted from operating surplus.
Please read "—Risks Inherent in Our Business—We must make substantial expenditures to maintain the operating capacity of our fleet, which will reduce our cash available for distribution" for information regarding substantial expenditures that we must make to maintain the operating capacity of our fleet.
36
We may issue additional limited partner units without the approval of unitholders, which would dilute unitholders' ownership interests.
We may issue an unlimited number of limited partner interests of any type without the approval of our unitholders. For example, we issued 15,653,775 Series A Preferred Units to KA First Reserve, LLC in exchange for approximately $85.0 million on September 10, 2010. In addition, KA First Reserve has agreed to purchase an additional 2,762,431 preferred units for approximately $15.0 million upon clearance of a Hart-Scott-Rodino review. The issuance by us of additional common units, additional preferred units or other equity securities will have the following effects:
- •
- our unitholders' proportionate ownership interest in us will decrease;
- •
- the amount of cash available for future distributions on each unit may decrease;
- •
- the relative voting strength of each previously outstanding unit may be diminished; and
- •
- the market price of the common units may decline.
Our partnership agreement currently limits the ownership of our partnership interests by individuals or entities that are not U.S. citizens. This restriction could limit the liquidity of our common units.
In order to ensure compliance with Jones Act citizenship requirements, the board of directors of K-Sea General Partner GP LLC has adopted a requirement that at least 85% of our partnership interests must be held by U.S. citizens. This requirement may have an adverse impact on the liquidity or market value of our common units, because unitholders will be unable to sell units to non-U.S. citizens. Any purported transfer of common units in violation of these provisions will be ineffective to transfer the common units or any voting, dividend or other rights in respect of the common units.
Our general partner has a limited call right that may require unitholders to sell their common units at an undesirable time or price.
If at any time our general partner and its affiliates own more than 80% of the common units, our general partner will have the right, but not the obligation, which it may assign to any of its affiliates or to us, to acquire all, but not less than all, of the common units held by unaffiliated persons at a price not less than their then-current market price. As a result, unitholders may be required to sell their common units at an undesirable time or price and may not receive any return on their investment. Unitholders may also incur a tax liability upon a sale of their units. Our general partner is not obligated to obtain a fairness opinion regarding the value of the common units to be repurchased by it upon exercise of the limited call right. There is no restriction in our partnership agreement that prevents our general partner from issuing additional common units and exercising its call right.
Our partnership agreement restricts the voting rights of unitholders owning 20% or more of our common units.
Our partnership agreement restricts unitholders' voting rights by providing that any units held by a person that owns 20% or more of any class of units then outstanding, other than our general partner, its affiliates, their transferees and persons who acquired such units with the prior approval of the board of directors of the general partner of our general partner, cannot vote on any matter. The partnership agreement also contains provisions limiting the ability of unitholders to call meetings or to acquire information about our operations, as well as other provisions limiting the unitholders' ability to influence the manner or direction of management.
Cost reimbursements due our general partner and its affiliates will reduce cash available for distribution to unitholders.
Prior to making any distribution on the common units, we will reimburse our general partner and its affiliates for all expenses they incur on our behalf, which will be determined by our general partner
37
in its sole discretion. These expenses will include all costs incurred by the general partner and its affiliates in managing and operating us, including costs for rendering corporate staff and support services to us. In addition, our general partner and its affiliates may provide us with other services for which the general partner or its affiliates may charge us fees. The reimbursement of expenses and payment of fees, if any, to our general partner and its affiliates, could adversely affect our ability to pay cash distributions to unitholders.
Unitholders may not have limited liability if a court finds that unitholder action constitutes control of our business.
As a limited partner in a partnership organized under Delaware law, a unitholder could be held liable for our obligations to the same extent as a general partner if such unitholder participates in the "control" of our business. Our general partner generally has unlimited liability for the obligations of the partnership, such as its debts and environmental liabilities, except for those contractual obligations of the partnership that are expressly made without recourse to our general partner. In addition, Section 17-607 of the Delaware Revised Uniform Limited Partnership Act provides that, under some circumstances, a unitholder may be liable to us for the amount of a distribution for a period of three years from the date of the distribution. The limitations on the liability of holders of limited partner interests for the obligations of a limited partnership have not been clearly established in some of the other states in which we do business.
Restrictions in our debt agreements may prevent us from paying distributions.
Our payment of principal and interest on our debt will reduce cash available for distribution on our units. Our Revolver and ATB Agreements prohibit the payment of distributions prior to the end of the fiscal quarter ending March 31, 2011. The following requirements must be met and/or defaults must not have occurred (among others) before making any distributions:
- •
- failure to pay any principal, interest, fees, expenses or other amounts when due;
- •
- default under any vessel mortgage;
- •
- failure to notify the lenders of any significant oil spill or discharge of hazardous material, or of any action or claim
related thereto;
- •
- breach or lapse of any insurance with respect to the vessels;
- •
- breach of certain financial covenants;
- •
- failure to meet a minimum liquidity requirement of $17.5 million;
- •
- failure to meet a maximum total Funded Debt to EBITDA ratio (as defined per the Revolver and ATB Agreements) of less than
5.0 to 1.0;
- •
- failure to meet a minimum Fixed Charge Cover ratio (as defined per the Revolver and ATB Agreements) (a) of at least
1.0 to 1.0 for two consecutive fiscal quarters prior to and after giving effect to such distributions measured on a three month trailing basis; and (b) the projected fixed charge coverage ratio
is equal to or greater than 1.0 to 1.0 for the next twelve months and is equal to or greater than 1.0 to 1.0 in three of four of those quarters;
- •
- breach by our general partner or any of our subsidiaries of the guarantees issued under our amended agreement;
- •
- failure to observe any other agreement, security instrument, obligation or covenant beyond specified cure periods in
certain cases;
- •
- default under other material indebtedness of our operating partnership, our general partner or any of our subsidiaries;
38
- •
- bankruptcy or insolvency events involving us, our general partner or any of our subsidiaries;
- •
- failure of any representation or warranty to be materially correct;
- •
- a change of control, as defined in the applicable agreement;
- •
- a material adverse effect, as defined in the applicable agreement, occurs relating to us or our business; and
- •
- a judgment against us, our general partner or any of our subsidiaries in excess of certain allowances and not covered by insurance.
Any subsequent refinancing of our current debt or any new debt could have similar restrictions.
The control of our general partner may be transferred to a third party without unitholder consent.
Our general partner may transfer its general partner interest to a third party in a merger or in a sale of all or substantially all of its assets without the consent of the unitholders so long as the third party satisfies the citizenship requirements of the Jones Act. Furthermore, there is no restriction in the partnership agreement on the ability of the partners of our general partner from transferring their respective partnership interests in our general partner to a third party that satisfies the citizenship requirements of the Jones Act. The new partners of our general partner would then be in a position to replace the board of directors and officers of the general partner of our general partner with their own choices and to control the decisions taken by the board of directors and officers.
Our affiliates may engage in activities that compete directly with us.
Pursuant to the omnibus agreement entered into in connection with the initial public offering of our common units, certain of our affiliates have agreed not to engage, either directly or indirectly, in the business of providing marine transportation, distribution and logistics services for refined petroleum products in the United States to the extent such business generates qualifying income for federal income tax purposes. The omnibus agreement does not prohibit the equity owners of our affiliates from owning assets or engaging in businesses that compete directly or indirectly with us.
Certain of our investors may sell units in the public market, which could reduce the market price of our outstanding common units.
We have agreed to file a registration statement on Form S-3 to cover sales by KA First Reserve, LLC of all common units issuable upon conversion of our outstanding preferred units and additional preferred units that we issue as in-kind quarterly distributions. If KA First Reserve, LLC or a successor to its registration rights were to dispose of a substantial portion of these common units in the public market, whether in a single transaction or series of transactions, it could adversely affect the market price for our common units. In addition, these sales, or the possibility that these sales may occur, could make it more difficult for us to sell our common units in the future.
Tax Risks
Our tax treatment depends on our status as a partnership for federal income tax purposes, as well as our not being subject to a material amount of entity-level taxation by individual states. If the Internal Revenue Service ("IRS") were to treat us as a corporation or if we were to become subject to a material amount of entity-level taxation for state or foreign tax purposes, then our cash available for distribution to unitholders would be substantially reduced.
The anticipated after-tax economic benefit of an investment in us depends largely on our being treated as a partnership for federal income tax purposes. If less than 90% of our gross income for any taxable year is "qualifying income" from transportation or processing of crude oil, natural gas or products thereof, interest, dividends or similar sources, we will be subject to tax as a corporation under
39
Section 7704 of the Internal Revenue Code for federal income tax purposes for that taxable year and all subsequent years. The IRS has not provided any ruling whether we are taxable as a partnership for federal income tax purposes.
If we were treated as a corporation for federal income tax purposes, we would pay federal income tax on our taxable income at the corporate tax rate, which is currently a maximum of 35%, and would likely pay state income tax at varying rates. Distributions would generally be taxed again to unitholders as corporate dividends (to the extent of our current and accumulated earnings and profits) and no income, gains, losses, or deductions would flow through to unitholders. Because a tax would be imposed upon us as an entity, cash available for distribution to unitholders would be substantially reduced. Treatment of us as a corporation would result in a material reduction in the anticipated cash flow and after-tax return to unitholders and thus would likely result in a substantial reduction in the value of the common units.
Current law may change so as to cause us to be treated as a corporation for federal income tax purposes or otherwise subject us to entity-level taxation. For example, because of widespread state budget deficits and other reasons, several states are evaluating ways to subject partnerships to entity-level taxation through the imposition of state income, franchise and other forms of taxation. The partnership agreement provides that, if a law is enacted or an existing law is modified or interpreted in a manner that subjects us to taxation as a corporation or otherwise subjects us to entity-level taxation for federal, state, or local income tax purposes, the target distribution amounts will be adjusted to reflect the impact of that law on us.
The tax treatment of publicly traded partnerships or an investment in our common units could be subject to potential legislative, judicial or administrative changes and differing interpretations, possibly on a retroactive basis.
The present United States federal income tax treatment of publicly traded partnerships, including us, or an investment in our common units may be modified by administrative, legislative or judicial interpretation at any time. Any modification to the United States federal income tax laws and interpretations thereof may or may not be applied retroactively and could make it more difficult or impossible to meet the exception for us to be treated as a partnership for United States federal income tax purposes that is not taxable as a corporation, affect or cause us to change our business activities, affect the tax considerations of an investment in us, change the character or treatment of portions of our income and adversely affect an investment in our common units. For example, if members of Congress consider substantial changes to the definition of qualifying income under the Internal Revenue Code Section 7704(d), it is possible that these efforts could result in changes to the existing United States tax laws that affect publicly traded partnerships, including us. Further, at the federal level, legislation has been proposed that would eliminate partnership tax treatment for certain publicly traded partnerships. Although such legislation would not apply to us as currently proposed, it could be amended prior to enactment in a manner that does apply to us. We are unable to predict whether any of these changes or other proposals will ultimately be enacted. Any such changes could negatively impact the value of an investment in our common units.
If the IRS contests any of the federal income tax positions we take, the market for our common units may be adversely affected, and the costs of any contest will reduce our cash available for distribution to unitholders.
The IRS has not provided any ruling with respect to our treatment as a partnership for federal income tax purposes. The IRS may adopt positions that differ from the positions we take. It may be necessary to resort to administrative or court proceedings to sustain some or all of the positions we take. A court may not agree with some or all of the positions we take. Any contest with the IRS may materially and adversely impact the market for our common units and the price at which they trade. In
40
addition, the costs of any contest with the IRS will be borne indirectly by our unitholders and our general partner because the costs will reduce our cash available for distribution.
Unitholders may be required to pay taxes on their share of our income even if they do not receive any cash distributions from us.
Because our unitholders will be treated as partners to whom we will allocate taxable income, which could be different in amount than the cash we distribute, our unitholders will be required to pay any federal income taxes and, in some cases, state, local, and foreign income taxes on their share of our taxable income, even if they receive no cash distributions from us. Unitholders may not receive cash distributions equal to their share of our taxable income or even the tax liability that results from that income.
Tax gain or loss on the disposition of our common units could be different than expected.
If a unitholder sells his common units, that unitholder will recognize gain or loss equal to the difference between the amount realized and the unitholder's tax basis in those common units. Prior distributions in excess of the total net taxable income the unitholder was allocated for a common unit, which decreased the unitholder's tax basis in that common unit, will, in effect, become taxable income to the unitholder if the common unit is sold at a price greater than the unitholder's tax basis in that common unit, even if the price the unitholder receives is less than the unitholder's original cost. A substantial portion of the amount realized, whether or not representing gain, may be ordinary income to unitholders due to recapture items, including depreciation recapture. Should the IRS successfully contest some positions we take, unitholders could recognize more gain on the sale of common units than would be the case under those positions, without the benefit of decreased income in prior years. In addition, because the amount realized includes a unitholder's share of nonrecourse liabilities, if unitholders sell their common units, they may incur a tax liability in excess of the amount of cash they receive from the sale.
Tax-exempt entities and foreign persons face unique tax issues from owning our common units that may result in adverse tax consequences to them.
Investment in common units by tax-exempt entities, such as individual retirement accounts (known as IRAs) and other retirement plans, and non-U.S. persons, raises issues unique to them. For example, virtually all of our income allocated to organizations exempt from federal income tax, including IRAs and other retirement plans, will be unrelated business taxable income and therefore taxable to them. Distributions to non-U.S. persons will be reduced by withholding taxes at the highest applicable effective tax rate, and non-U.S. persons will be required to file United States federal income tax returns and pay tax on their share of our taxable income. If you are a tax-exempt entity or a foreign person, you should consult your tax advisor before investing in our common units.
We registered as a tax shelter under prior law. This may increase the risk of an IRS audit of us or a unitholder.
Prior to the enactment of the American Jobs Creation Act of 2004, certain types of entities were required to register with the IRS as "tax shelters," based on a perception that those entities might claim tax benefits that were unwarranted. We registered as a tax shelter under such prior law. The American Jobs Creation Act of 2004 repealed the tax shelter registration requirement and replaced it with a regime that requires reporting of certain "reportable transactions." We do not expect to engage in any reportable transactions. Nevertheless, our registration as a tax shelter under prior law, or our future participation in a reportable transaction, might increase the likelihood that we will be audited, and any such audit might lead to tax adjustments.
41
Should our tax returns be audited, any adjustments to our tax returns may lead to adjustments to our unitholders' tax returns and may lead to audits of unitholders' tax returns. Our unitholders' would be responsible for the consequences of any audits to their tax returns.
We treat each purchaser of common units as having the same tax benefits without regard to the units purchased. The IRS may challenge this treatment, which could adversely affect the value of the common units.
Because we cannot match transferors and transferees of common units and because we must maintain uniformity of the economic and tax characteristics of our common units to a purchaser of our common units, we will take depreciation and amortization positions that are intended to maintain such uniformity. These depreciation and amortization positions may not conform to all aspects of existing Treasury Regulations. A successful IRS challenge to those positions could adversely affect the amount of tax benefits available to unitholders. It also could affect the timing of these tax benefits or the amount of gain from the sale of common units and could have a negative impact on the value of our common units or result in audit adjustments to unitholders' tax returns.
Unitholders may be subject to state, local and foreign taxes and return filing requirements as a result of investing in our common units.
In addition to federal income taxes, unitholders will likely be subject to other taxes, such as state and local income taxes, unincorporated business taxes and estate, inheritance, or intangible taxes that are imposed by the various jurisdictions in which we do business or own property. Unitholders will likely be required to file state and local income tax returns and pay state and local income taxes in some or all of the various jurisdictions in which we do business or own property and may be subject to penalties for failure to comply with those requirements. We own property or conduct business in Alaska, California, Delaware, Hawaii, Massachusetts, New York, New Jersey, Oregon, Pennsylvania, Virginia and Washington, certain of which impose a personal income tax. We currently conduct certain operations in Canada and Venezuela in a manner that we believe does not subject unitholders to direct liability to pay tax or file returns in those countries, but there can be no assurance that we will conduct our foreign operations in this manner in the future. Taxes we pay with respect to our foreign operations reduce the cash flow available for distribution to our unitholders. We may do business or own property in other states or foreign countries in the future. It is the responsibility of unitholders to file all federal, state, local, and foreign tax returns.
We have subsidiaries that are treated as corporations for federal income tax purposes and are subject to corporate-level income taxes.
We conduct a portion of our operations through subsidiaries that are, or are treated as, corporations for federal income tax purposes. Currently, those operations consist primarily of our bunkering activities and our operation of a Canadian flagged vessel. We may elect to conduct additional operations in corporate form in the future. These corporate subsidiaries will be subject to corporate-level tax, which will reduce the cash available for distribution to us and, in turn, to our unitholders. If the IRS were to successfully assert that these corporate subsidiaries have more tax liability than we anticipate or legislation was enacted that increased the corporate tax rate, our cash available for distribution to our unitholders would be further reduced.
The sale or exchange of 50% or more of our capital and profits interests during any twelve-month period will result in the termination of our partnership for federal income tax purposes.
We will be considered to have terminated for federal income tax purposes if there is a sale or exchange of 50% or more of the total interests in our capital and profits within a twelve-month period. Our termination would, among other things, result in the closing of our taxable year for all unitholders and could result in a deferral of depreciation deductions allowable in computing our taxable income. If this occurs, you will be allocated an increased amount of federal taxable income for the year in which
42
we are considered to be terminated as a percentage of the cash distributed to you with respect to that period. The IRS has recently announced a publicly traded partnership technical termination relief program whereby, if the taxpayer requests relief and such relief is granted by the IRS, among other things, the partnership will only have to provide one Schedule K-1 to unitholders for the year notwithstanding two partnership tax years.
We prorate our items of income, gain, loss, and deduction between transferors and transferees of our units each month based upon the ownership of our units of the first day of each month, instead of on the basis of the date a particular unit is transferred. The IRS may challenge this treatment, which could change the allocation of items of income, gain, loss and deduction among our unitholders.
We prorate our items of income, gain, loss, and deduction between transferors and transferees of our units each month based upon the ownership of our units on the first day of each month, instead of on the basis of the date a particular unit is transferred, which is standard practice for master limited partnerships. The use of this proration method may not be permitted under existing Treasury regulations. Recently, however, the Department of the Treasury and the IRS issued proposed Treasury Regulations that provide a safe harbor pursuant to which a publicly traded partnership may use a similar monthly simplifying convention to allocate tax items among transferor and transferee unitholders. Although existing publicly traded partnerships are entitled to rely on these proposed Treasury Regulations, they are not binding on the IRS and are subject to change until final Treasury Regulations are issued.
A unitholder whose units are loaned to a "short seller" to cover a short sale of units may be considered as having disposed of those units. If so, he would no longer be treated for tax purposes as a partner with respect to those units during the period of the loan and may recognize gain or loss from the disposition.
Because a unitholder whose units are loaned to a "short seller" to cover a short sale of units may be considered as having disposed of the loaned units, he may no longer be treated for tax purposes as a partner with respect to those units during the period of the loan to the short seller and the unitholder may recognize gain or loss from such disposition. Moreover, during the period of the loan to the short seller, any of our income, gain, loss or deduction with respect to those units may not be reportable by the unitholder and any cash distributions received by the unitholder as to those units could be fully taxable as ordinary income. Unitholders desiring to assure their status as partners and avoid the risk of gain recognition from a loan to a short seller are urged to modify any applicable brokerage account agreements to prohibit their brokers from loaning their units.
We have adopted certain valuation methodologies that may result in a shift of income, gain, loss and deduction between the general partner and the unitholders. The IRS may challenge this treatment, which could adversely affect the value of the common units.
When we issue additional units or engage in certain other transactions, we determine the fair market value of our assets and allocate any unrealized gain or loss attributable to our assets to the capital accounts of our unitholders and our general partner. Our methodology may be viewed as understating the value of our assets. In that case, there may be a shift of income, gain, loss and deduction between certain unitholders and the general partner, which may be unfavorable to such unitholders. Moreover, subsequent purchasers of common units may have a greater portion of their Internal Revenue Code Section 743(b) adjustment allocated to our tangible assets and a lesser portion allocated to our intangible assets. The IRS may challenge our valuation methods, or our allocation of the Section 743(b) adjustment attributable to our tangible and intangible assets, and allocations of income, gain, loss and deduction between the general partner and certain of our unitholders.
A successful IRS challenge to these methods or allocations could adversely affect the amount of taxable income or loss being allocated to our unitholders. It also could affect the amount of gain from our unitholders' sale of common units and could have a negative impact on the value of the common
43
units or result in audit adjustments to our unitholders' tax returns without the benefit of additional deductions.
ITEM 1B. UNRESOLVED STAFF COMMENTS.
None.
We are a party to various suits in the ordinary course of business for monetary relief arising principally from personal injuries, collision or other casualty and to claims arising under vessel charters. All of these personal injury, collision and casualty claims against us are fully covered by insurance, subject to deductibles ranging from $10,000 to $250,000. We reserve on a current basis for amounts we expect to pay. Although the outcome of any individual claim or action cannot be predicted with certainty, we believe that any adverse outcome, individually or in the aggregate, would be substantially mitigated by applicable insurance or indemnification from previous owners of our assets, and would not have a material adverse effect on our financial position, results of operations or cash flows.
On July 7, 2010, one of our tug boats towing a third party barge was involved in a collision with an amphibious passenger vessel off of Penn's Landing in the Delaware River which resulted in the sinking of the passenger vessel. At the time of the collision, there were 35 passengers and two crew members on board the passenger vessel. Two of the passengers were fatally injured and several others were treated for minor injuries. The National Transportation Safety Board and United States Coast Guard are conducting a joint investigation of the incident. We have been notified of potential claims and have been named in several lawsuits relating to this incident. Although the outcome of these potential claims or actions cannot be predicted with certainty, we believe that any adverse outcome, individually or in the aggregate, would be substantially mitigated by applicable insurance and would not have a material adverse effect on our financial position, results of operations or cash flows.
EW Transportation LLC and its predecessors have been named, together with a large number of other companies, as co-defendants in 39 civil actions by various parties, including former employees, alleging unspecified damages from past exposure to asbestos and second-hand smoke aboard some of the vessels that it contributed to us in connection with our initial public offering. EW Transportation LLC and its predecessors have been dismissed from 38 of these lawsuits for an aggregate sum of approximately $47,000. The remaining case has been administratively dismissed, which effectively means that it remains active for routine matters not requiring a formal hearing. We may be subject to litigation in the future from these plaintiffs and others alleging exposure to asbestos due to alleged failure to properly encapsulate or remove friable asbestos on our vessels, as well as for exposure to second-hand smoke and other matters. For a related discussion of insurance coverage, please read "Business and Properties—Insurance Program" in Items 1 and 2 of this report.
Our predecessors have agreed to indemnify us for certain liabilities. For more information, please read "Certain Relationships and Related Transactions—Omnibus Agreement—Indemnification" in Item 13 of this report.
44
ITEM 5. MARKET FOR REGISTRANT'S COMMON EQUITY, RELATED SECURITY HOLDER MATTERS AND ISSUER PURCHASES OF EQUITY SECURITIES.
Market Price of Common Units, Distributions and Related Unitholder Matters
Our common units are listed on the New York Stock Exchange under the symbol "KSP." As of September 10, 2010, there were 19,127,411 outstanding common units, which were held by approximately 101 holders of record, representing approximately 12,200 beneficial owners. The following table sets forth, for the periods indicated, the high and low sales prices per common unit, as reported on the New York Stock Exchange, and the amount of cash distributions declared per common unit:
| |
Price Range | |
||||||||
|---|---|---|---|---|---|---|---|---|---|---|
| |
Cash Distribution(1) |
|||||||||
| |
High | Low | ||||||||
2010 Fiscal Year |
||||||||||
Fourth Quarter Ended June 30, 2010 |
$ | 10.12 | $ | 4.30 | $ | — | ||||
Third Quarter Ended March 31, 2010 |
$ | 15.36 | $ | 8.63 | $ | — | ||||
Second Quarter Ended December 31, 2009 |
$ | 23.50 | $ | 10.36 | $ | — | ||||
First Quarter Ended September 30, 2009 |
$ | 24.59 | $ | 18.03 | $ | 0.45 | ||||
2009 Fiscal Year |
||||||||||
Fourth Quarter Ended June 30, 2009 |
$ | 21.44 | $ | 16.46 | $ | 0.77 | ||||
Third Quarter Ended March 31, 2009 |
$ | 20.43 | $ | 13.25 | $ | 0.77 | ||||
Second Quarter Ended December 31, 2008 |
$ | 20.50 | $ | 10.80 | $ | 0.77 | ||||
First Quarter Ended September 30, 2008 |
$ | 31.75 | $ | 19.05 | $ | 0.77 | ||||
- (1)
- Distributions are shown for the quarter with respect to which they were declared.
The aggregate amount of cash distributions declared in respect of the 2010 and 2009 fiscal years totaled $8.7 million and $51.0 million, respectively. The general partner was issued an aggregate 99,683 common units in respect of the third and fourth quarters of fiscal 2009 in lieu of approximately $2.5 million of cash distributions. These common units were issued in a transaction exempt from registration pursuant to Section 4(2) of the Securities Act of 1933, as amended.
Cash Distribution Policy
Unless restricted by the terms of our Revolver and ATB Agreements, within 45 days after the end of each quarter, we distribute all of our available cash from operating surplus to unitholders of record on the applicable record date. Our available cash from operating surplus consists generally of all cash on hand at the end of the fiscal quarter, plus all cash on hand resulting from working capital borrowings made after the end of the quarter up to the date of determination of available cash, less the amount of cash that our general partner determines is necessary or appropriate to, among others:
- •
- provide for the proper conduct of our business, including reserves for future capital and maintenance expenditures;
- •
- comply with applicable law, any of our debt instruments, or other agreements; or
- •
- provide funds for distributions to our unitholders and to our general partner for any one or more of the next four quarters.
Our ability to distribute available cash is contractually restricted by the terms of our credit facilities, which require us to maintain certain financial ratios and generally prohibit distributions to unitholders if the distribution would cause an event of default, or an event of default exists, under our
45
credit facilities. Please read "Management's Discussion and Analysis of Financial Condition and Results of Operations—Liquidity and Capital Resources—Revolving Loan and Credit Agreements" in Item 7 of this report.
On September 10, 2010, we issued 15,653,775 Series A Preferred Units to KA First Reserve, LLC in exchange for approximately $85.0 million. In addition, KA First Reserve has agreed to purchase an additional 2,762,431 preferred units for approximately $15.0 million upon clearance of a Hart-Scott-Rodino review. The preferred units are convertible at any time into common units on a one-for-one basis, subject to certain adjustments in the event of certain dilutive issuances of common units. The preferred units have a coupon of 13.5%, with payment-in-kind distributions through the quarter ended June 30, 2012 or, if earlier, when we resume cash distributions on our common units. We have an option to force the conversion of the preferred units after three years if (1) the price of our common units is 150% of the conversion price on average for 20 consecutive days on a volume-weighted basis, and (2) the average daily trading volume of our common units for such 20 day period exceeds 50,000 common units. The preferred units were priced at $5.43 per unit, which represents a 10% premium to the 5-day volume weighted average price of our common units as of August 26, 2010.
Incentive Distribution Rights
Incentive distribution rights represent the right to receive an increasing percentage of quarterly distributions of available cash from operating surplus after the minimum quarterly distribution and certain target distribution levels have been achieved. Our general partner currently holds a 100% equity interest in the entity that holds the incentive distribution rights, and may transfer the incentive distribution rights separately from its general partner interest, subject to restrictions in the partnership agreement.
As of September 10, 2010, our general partner and its affiliates owned an approximately 0.58% general partner interest in us, 4,115,840 common units and all of our incentive distribution rights. An affiliate of our general partner is entitled to receive incentive distributions if the amount we distribute with respect to any quarter exceeds levels specified in our partnership agreement. Under the incentive distribution provisions, an affiliate of our general partner is entitled to 13% of amounts we distribute in excess of $0.55 per unit, 23% of the amounts we distribute in excess of $0.625 per unit and 48% of amounts we distribute in excess of $0.75 per unit.
Under our partnership agreement, our general partner and holders of incentive distribution rights may elect to receive distributions with respect to a quarter, in whole or in part, in the form of common units instead of cash to the extent approved in advance by the conflicts committee of the board of directors of the general partner of our general partner.
Issuer Purchases of Equity Securities
We did not repurchase any of our common units during the fourth quarter of fiscal 2010.
46
ITEM 6. SELECTED FINANCIAL DATA.
The following table sets forth selected historical financial and operating data of K-Sea Transportation Partners L.P. The following table should be read in conjunction with the consolidated financial statements, including the notes thereto, included elsewhere in this report, and "Management's Discussion and Analysis of Financial Condition and Results of Operations" in Item 7 of this report.
| |
Years Ended June 30, | |||||||||||||||||
|---|---|---|---|---|---|---|---|---|---|---|---|---|---|---|---|---|---|---|
| |
2010 | 2009 | 2008 | 2007 | 2006 | |||||||||||||
Income Statement Data: |
||||||||||||||||||
Voyage revenue |
$ | 248,092 | $ | 310,429 | $ | 312,680 | $ | 216,924 | $ | 176,650 | ||||||||
Other revenue |
17,333 | 20,033 | 13,600 | 9,650 | 6,118 | |||||||||||||
Total revenues |
265,425 | 330,462 | 326,280 | 226,574 | 182,768 | |||||||||||||
Voyage expenses |
45,890 | 67,029 | 79,427 | 45,875 | 37,973 | |||||||||||||
Vessel operating expenses |
138,051 | 144,291 | 124,551 | 96,005 | 77,325 | |||||||||||||
General and administrative expenses |
27,238 | 29,806 | 28,947 | 20,472 | 17,309 | |||||||||||||
Depreciation and amortization |
64,196 | 53,582 | 48,311 | 33,415 | 26,810 | |||||||||||||
Loss on acquisition of land and building |
1,697 | — | — | — | — | |||||||||||||
Net (gain) loss on sale of vessels |
(801 | ) | (702 | ) | (601 | ) | 102 | (313 | ) | |||||||||
Impairment of goodwill |
54,300 | — | — | — | — | |||||||||||||
Total operating expenses |
330,571 | 294,006 | 280,635 | 195,869 | 159,104 | |||||||||||||
Operating income (loss) |
(65,146 | ) | 36,456 | 45,645 | 30,705 | 23,664 | ||||||||||||
Interest expense, net |
22,588 | 21,503 | 21,275 | 14,097 | 10,118 | |||||||||||||
Net loss on reduction of debt(1) |
— | — | — | — | 7,224 | |||||||||||||
Other expense (income), net |
(535 | ) | 402 | (2,164 | ) | (63 | ) | (64 | ) | |||||||||
Income (loss) before provision for (benefit of) income taxes |
(87,199 | ) | 14,551 | 26,534 | 16,671 | 6,386 | ||||||||||||
Provision for (benefit of) income taxes |
(218 | ) | 287 | 529 | 851 | 484 | ||||||||||||
Net income (loss) |
(86,981 | ) | 14,264 | 26,005 | 15,820 | 5,902 | ||||||||||||
Less net income attributable to non-controlling interest |
398 | 317 | 337 | — | — | |||||||||||||
Net income (loss) attributable to K-Sea Transportation Partners L.P. unitholders ("net income (loss) of K-Sea") |
$ | (87,379 | ) | $ | 13,947 | $ | 25,668 | $ | 15,820 | $ | 5,902 | |||||||
Allocation of net income (loss) of K-Sea: |
||||||||||||||||||
General partner's interest in net income (loss) of K-Sea |
$ | (916 | ) | $ | 4,474 | $ | 3,311 | $ | 1,320 | $ | 391 | |||||||
Limited partner's interest in net income (loss) of K-Sea |
$ | (86,463 | ) | $ | 9,473 | $ | 22,357 | $ | 14,500 | $ | 5,511 | |||||||
Net income (loss) of K-Sea |
$ | (87,379 | ) | $ | 13,947 | $ | 25,668 | $ | 15,820 | $ | 5,902 | |||||||
Net income per unit—basic |
$ | (4.60 | ) | $ | 0.61 | $ | 1.73 | $ | 1.45 | $ | 0.57 | |||||||
—diluted |
$ | (4.60 | ) | $ | 0.61 | $ | 1.73 | $ | 1.45 | $ | 0.57 | |||||||
Balance Sheet Data (at year end): |
||||||||||||||||||
Vessels and equipment, net |
$ | 604,197 | $ | 533,996 | $ | 608,209 | $ | 358,580 | $ | 316,237 | ||||||||
Total assets |
696,137 | 738,803 | 798,308 | 439,833 | 389,220 | |||||||||||||
Total debt |
382,935 | 383,013 | 439,206 | 244,287 | 193,380 | |||||||||||||
K-Sea Transportation Partners' capital |
230,420 | 279,414 | 275,178 | 152,653 | 163,943 | |||||||||||||
Non-controlling interest capital |
4,589 | 4,514 | 4,519 | — | — | |||||||||||||
Cash Flow Data: |
||||||||||||||||||
Net cash provided by (used in): |
||||||||||||||||||
Operating activities |
$ | 7,797 | $ | 52,277 | $ | 40,775 | $ | 41,176 | $ | 20,072 | ||||||||
Investing activities |
(39,637 | ) | (45,382 | ) | (292,196 | ) | (63,704 | ) | (105,398 | ) | ||||||||
Financing activities |
31,917 | (6,828 | ) | 252,261 | 22,614 | 86,064 | ||||||||||||
Other Financial Data: |
||||||||||||||||||
Capital expenditures(2): |
||||||||||||||||||
Maintenance |
$ | 22,825 | $ | 21,431 | $ | 27,836 | $ | 20,337 | $ | 13,753 | ||||||||
Expansion (including vessel and company acquisitions) |
9,213 | 9,624 | 240,710 | 25,960 | 98,073 | |||||||||||||
Total |
$ | 32,038 | $ | 31,055 | $ | 268,546 | $ | 46,297 | $ | 111,826 | ||||||||
Construction of tank vessels |
$ | 37,675 | $ | 65,189 | $ | 51,987 | $ | 33,315 | $ | 20,702 | ||||||||
Distributions declared per common unit in respect of the period |
$ | 0.45 | $ | 3.080 | $ | 2.990 | $ | 2.680 | $ | 2.380 | ||||||||
47
| |
Years Ended June 30, | |||||||||||||||
|---|---|---|---|---|---|---|---|---|---|---|---|---|---|---|---|---|
| |
2010 | 2009 | 2008 | 2007 | 2006 | |||||||||||
Operating Data: |
||||||||||||||||
Number of tank barges (at period end) |
65 | 69 | 74 | 60 | 61 | |||||||||||
Number of tankers (at period end) |
— | — | 1 | 1 | 2 | |||||||||||
Number of tugboats (at period end) |
66 | 66 | 66 | 44 | 41 | |||||||||||
Total barrel-carrying capacity (in thousands at period end) |
4,187 | 4,125 | 4,423 | 3,464 | 3,357 | |||||||||||
Net utilization(3) |
77 | % | 85 | % | 84 | % | 85 | % | 83 | % | ||||||
Average daily rate(4) |
$ | 11,391 | $ | 11,521 | $ | 11,334 | $ | 10,097 | $ | 9,245 | ||||||
- (1)
- Fiscal
2006 includes a loss of $7.2 million in connection with the restructuring of our revolving credit facility and repayment of certain term
loans, including our private placement bonds guaranteed by the Maritime Administration of the U.S. Department of Transportation pursuant to Title XI of the Merchant Marine Act of 1936 in fiscal 2006.
- (2)
- We
define maintenance capital expenditures as capital expenditures required to maintain, over the long term, the operating capacity of our fleet, and
expansion capital expenditures as those capital expenditures that increase, over the long term, the operating capacity of our fleet. Examples of maintenance capital expenditures include costs related
to drydocking a vessel, retrofitting an existing vessel or acquiring a new vessel to the extent such expenditures maintain the operating capacity of our fleet. Capital expenditures associated with
retrofitting an existing vessel, or acquiring a new vessel, which increase the operating capacity of our fleet over the long term whether through increasing our aggregate barrel-carrying capacity,
improving the operational performance of a vessel or otherwise, are classified as expansion capital expenditures. Drydocking expenditures are more extensive than normal routine maintenance and,
therefore, are capitalized and amortized over three years. For more information regarding our accounting treatment of drydocking expenditures, please read "Management's Discussion and Analysis of
Financial Condition and Results of Operations—Critical Accounting Policies—Amortization of Drydocking Expenditures" in Item 7 of this report.
- (3)
- "Net
utilization" is a percentage equal to the total number of days actually worked by a tank vessel or group of tank vessels during a defined period,
divided by the number of calendar days in the period multiplied by the total number of tank vessels operating or in drydock during that period.
- (4)
- "Average daily rate" equals the net voyage revenue earned by a tank vessel or group of tank vessels during a defined period, divided by the total number of days actually worked by that tank vessel or group of tank vessels during that period.
48
ITEM 7. MANAGEMENT'S DISCUSSION AND ANALYSIS OF FINANCIAL CONDITION AND RESULTS OF OPERATIONS.
The following is a discussion of the historical consolidated financial condition and results of operations of K-Sea Transportation Partners L.P. and should be read in conjunction with our historical consolidated financial statements and notes thereto included elsewhere in this report.
We are a leading provider of marine transportation, distribution and logistics services for refined petroleum products in the United States. As of September 1, 2010, we operated a fleet of 65 tank barges and 66 tugboats that serves a wide range of customers, including major oil companies, oil traders and refiners. With approximately 4.2 million barrels of capacity, as of September 1, 2010, we believe we operate the largest coastwise tank barge fleet in the United States.
Demand for our services is driven primarily by demand for refined petroleum products in the areas in which we operate. We generate revenue by charging customers for the transportation and distribution of their products utilizing our tank vessels and tugboats. These services are generally provided under the following four basic types of contractual relationships:
- •
- time charters, which are contracts to charter a vessel for a fixed period of time, generally one year or more, at a set
daily rate;
- •
- contracts of affreightment, which are contracts to provide transportation services for products over a specific trade
route, generally for one or more years, at a negotiated per barrel rate;
- •
- voyage charters, which are charters for shorter intervals, usually a single round-trip, that are made on
either a current market rate or advance contractual basis; and
- •
- bareboat charters, which are longer-term agreements that allow a customer to operate one of our vessels and utilize its own operating staff without taking ownership of the vessel.
In addition, a variation of a voyage charter is known as a "consecutive voyage charter." Under this arrangement, consecutive voyages are performed for a specified period of time.
The table below illustrates the primary distinctions among these types of contracts:
| |
Time Charter | Contract of Affreightment |
Voyage Charter(1) |
Bareboat Charter |
||||
|---|---|---|---|---|---|---|---|---|
Typical contract length |
One year or more | One year or more | Single voyage | One year or more | ||||
Rate basis |
Daily | Per barrel | Varies | Daily | ||||
Voyage expenses(2) |
Customer pays | We pay | We pay | Customer pays | ||||
Vessel operating expenses(2) |
We pay | We pay | We pay | Customer pays | ||||
Idle time |
Customer pays as long as vessel is available for operations | Customer does not pay | Customer does not pay | Customer pays |
- (1)
- Under
a consecutive voyage charter, the customer pays for idle time.
- (2)
- See "Definitions" below.
For contracts of affreightment and voyage charters, revenue is recognized based upon the relative transit time in each period, with expenses recognized as incurred. Although contracts of affreightment and certain contracts for voyage charters may be effective for a period in excess of one year, revenue is recognized over the transit time of individual voyages, which are generally less than ten days in duration. For time charters and bareboat charters, revenue is recognized ratably over the contract period, with expenses recognized as incurred.
49
One of the principal distinctions among these types of contracts is whether the vessel operator or the customer pays for voyage expenses, which include fuel, port charges, pilot fees, tank cleaning costs and canal tolls. Some voyage expenses are fixed, and the remainder can be estimated. If we, as the vessel operator, pay the voyage expenses, we typically pass these expenses on to our customers by charging higher rates under the contract or re-billing such expenses to them. As a result, although voyage revenue from different types of contracts may vary, the net revenue that remains after subtracting voyage expenses, which we call net voyage revenue, is comparable across the different types of contracts. Therefore, we principally use net voyage revenue, rather than voyage revenue, when comparing performance between different periods. Since net voyage revenue is a non-GAAP measurement, it is reconciled to the nearest GAAP measurement, voyage revenue, under "Results of Operations" below.
SIGNIFICANT EVENTS DURING FISCAL 2010
Goodwill Impairment Charge
In June 2010, management considered whether or not events or changes in circumstances indicated that the carrying amount of its goodwill, all of which relates to our Pacific region reporting unit, may not be recoverable. As a result of severe disruptions in our markets causing reductions to our revenue, operating income, and cash flow forecasts, we determined that such factors were indicative of a triggering event requiring an interim impairment analysis as of June 30, 2010. These disruptions in our markets contributed to a sustained decline in our unit price, and as a result, our equity market capitalization fell significantly below the net book value of the equity. Our goodwill impairment test is based on a discounted cash flow analysis using the estimated future cash flows from our vessels. The market perceived risk premium implied by our sustained low unit price and increased cost of debt increased our discount rate causing a full-write off of our goodwill. Accordingly we recorded an impairment charge of $54.3 million relating to the goodwill associated with our Pacific region reporting unit during the three months and year ended June 30, 2010. See "—Critical Accounting Policies—Impairment of Goodwill" below.
Long Lived Assets Impairment Charge
The expiration of long-term contracts has resulted in increased double-hull availability within the industry. In addition, the customer preference for double-hull vessels has intensified, resulting in the commercial obsolescence of single-hull equipment. As a result, it is becoming increasingly difficult to employ single-hull vessels at margins sufficient to operate them profitably. Therefore, although we are permitted to continue to operate our single-hull tank vessels until January 1, 2015, we phased out certain of our single hulls during fiscal year 2010.
During September 2009, we recorded an impairment charge of $5.9 million on certain single-hull vessels based on cash flow forecasts developed using our own data. An additional impairment charge of $1.7 million was recorded during March 2010 relating to four vessels with a net book value of $3.7 million. The impairment charge was based on estimated sales proceeds for such vessels, which were under contracts for sale and which were sold during the fourth quarter of fiscal 2010. We identified a triggering event requiring an impairment review of all of our long lived assets as of June 30, 2010. As a result, an additional impairment charge of $4.2 million was recorded relating to eight tug boats, two single hull vessels and one small vessel used to support activities in Hawaii.
In August 2010, we sold a newbuild 30,000-barrel barge for $2.3 million, net of commission and escrow agent fees. As the asset was held for sale as of June 30, 2010, we recorded a construction in progress impairment charge of $0.9 million reflecting the difference in the purchase commitment cost and the net proceeds received upon sale.
See "—Critical Accounting Policies—Impairment of Long Lived Assets" below.
50
Common Unit Offering
In August 2009, we completed a public offering of 3,244,500 common units representing limited partner interests. The price to the public was $19.15 per unit. The aggregate net proceeds of approximately $59.2 million from the offering, after payment of underwriting discounts and commissions but excluding other transaction costs, were used to repay borrowings of approximately $35.0 million under our revolving loan and credit agreements and to make construction progress payments in connection with our vessel newbuilding program.
Issuance of Series A Preferred Units
On September 10, 2010, we issued 15,653,775 Series A Preferred Units to KA First Reserve, LLC in exchange for approximately $85.0 million. In addition, KA First Reserve has agreed to purchase an additional 2,762,431 preferred units for approximately $15.0 million upon clearance of a Hart-Scott-Rodino review. The preferred units are convertible at any time into common units on a one-for-one basis, subject to certain adjustments in the event of certain dilutive issuances of common units. The preferred units have a coupon of 13.5%, with payment-in-kind distributions through the quarter ended June 30, 2012 or, if earlier, when we resume cash distributions on our common units. We have an option to force the conversion of the preferred units after three years if (1) the price of our common units is 150% of the conversion price on average for 20 consecutive days on a volume-weighted basis, and (2) the average daily trading volume of our common units for such 20 day period exceeds 50,000 common units. The preferred units were priced at $5.43 per unit, which represents a 10% premium to the 5-day volume weighted average price of our common units as of August 26, 2010. We used the net proceeds from the sale of the preferred units to KA First Reserve to reduce outstanding indebtedness and pay fees and expenses related to the transaction. The preferred units were issued and sold in a private transaction exempt from registration under Section 4(2) of the Securities Act, and certain rules and regulations promulgated under that section.
Amendment of Partnership Agreement
Effective September 10, 2010, in connection with the issuance of the preferred units to KA First Reserve, the Partnership entered into the Fourth Amended and Restated Agreement of Limited Partnership ("Restated Partnership Agreement") to, among other things, designate the terms of the preferred units.
Under the Restated Partnership Agreement, except with respect to certain matters, the preferred units have voting rights that are identical to the voting rights of the common units and vote with the common units as a single class, with each preferred unit entitled to one vote for each common unit into which such preferred unit is convertible. The preferred units also have class voting rights on any matter, including a merger, consolidation or business combination, that adversely affects, amends or modifies any of the rights, preferences, privileges or terms of the preferred units.
We will not pay any distribution with respect of any common units in any quarter in which the preferred units do not receive a quarterly distribution in full in cash. If we fail to pay in full any quarterly distribution with respect to the preferred units, the amount of such unpaid distribution will accrue and accumulate from the last day of the quarter for which such distribution is due until paid in full, and such unpaid amounts will accrue interest at the coupon rate. The record date for the determination of preferred unit holders entitled to receive quarterly distributions will be the same as the record date for determination of common unit holders entitled to receive quarterly distributions.
Under the Restated Partnership Agreement, upon any liquidation and winding up or the sale of substantially all of our assets, the holders of preferred units generally will be entitled to receive, in
51
preference to the holders of any of our other securities, the liquidation value of the preferred units, which is equal to the sum of (i) the issue price, plus (ii) all unpaid cash distributions and all accrued and unpaid interest thereon, plus (iii) all accrued but unpaid distributions for the quarter in which liquidation occurs, minus distributions of capital surplus to the holders of the preferred units.
Amendment of Credit Facility
On August 31, 2010, we amended our revolving loan agreement (as amended, "Revolving Loan Agreement") to, among other things, (1) reduce the revolving lenders' commitments from $175.0 million to $115.0 million (subject to a maximum borrowing base equal to two-thirds of the orderly liquidation value of the vessel collateral), (2) amend the fixed charge coverage, total funded debt to EBITDA and asset coverage covenants, (3) maintain a July 1, 2012 maturity date, and (4) allow the payment of cash distributions subject to liquidity requirements and certain minimum financial ratios starting with the fiscal quarter ending March 31, 2011. The obligations under the Revolving Loan Agreement are collateralized by a first priority security interest, subject to permitted liens, on certain vessels having an orderly liquidation value equal to at least 1.50 times the amount of the aggregate obligations (including letters of credit) outstanding under the Revolving Loan Agreement. Borrowings under the Revolving Loan Agreement bear interest at a rate per annum equal, at our option, to (a) the greater of the prime rate, the federal funds rate plus 0.5% or the 30-day London Interbank Offered Rate ("LIBOR") plus 1%, plus a margin based upon the ratio of total funded debt to EBITDA of between 1.75% and 4.75%, or (b) the 30-day LIBOR, plus a margin based upon the ratio of total funded debt to EBITDA ranging from 2.75% to 5.75%.
Other Amendments
Also on August 31, 2010, we entered into an amendment (the "ATB Amendment") to a secured term loan credit facility ("Term Loan Agreement") in the amount of $57.6 million dated June 4, 2008. The ATB Amendment, among other things, amended the financial covenants and LIBOR margins to conform to the financial covenants and LIBOR margins in the Revolving Loan Agreement, as amended by the Revolver Amendment described above. The ATB Amendment was subject to an amendment fee of $0.3 million.
Also on August 31, 2010, we obtained consents on five operating leases to incorporate by reference the financial covenants in the Revolver Amendment. We incurred fees of $0.2 million relating to such consents. On June 29, 2010, we entered into amendments to eliminate the financial covenants in two of our operating lease agreements and one term loan agreement.
Additionally, on August 31, 2010, we terminated an operating lease agreement (bareboat charter agreement) with the shipowner in conjunction with the shipowner's sale of the vessel to another party. We incurred a charge of $0.7 million relating to the lease termination. Concurrently, we entered into a new eight year lease agreement (bareboat charter agreement) with the new owner of the vessel which requires monthly lease payments of $0.1 million.
Agreements to Sell Non-Core Assets
We have entered into a definitive agreement to sell two tugboats and our two oldest double-hulled barges to an international buyer, and we have a definitive agreement to sell our environment services property in Norfolk, Virginia. Both transactions should close by the end of September 2010.
52
DEFINITIONS
In order to understand our discussion of our results of operations, it is important to understand the meaning of the following terms used in our analysis and the factors that influence our results of operations:
- •
- Voyage revenue. Voyage revenue includes revenue from time
charters, contracts of affreightment and voyage charters, where we, as vessel operator, pay the vessel operating expenses. Voyage revenue is impacted by changes in charter and utilization rates and by
the mix of business among the types of contracts described in the preceding sentence.
- •
- Voyage expenses. Voyage expenses include fuel and other
items such as port charges, pilot fees, tank cleaning costs and canal tolls, which are unique to a particular voyage. Depending on the form of contract and customer preference, voyage expenses may be
paid directly by customers or by us. If we pay voyage expenses, they are included in our results of operations when they are incurred. Typically when we pay voyage expenses, we add them to our freight
rates at an approximate cost.
- •
- Net voyage revenue. Net voyage revenue is equal to voyage
revenue less voyage expenses. As explained above, the amount of voyage expenses we incur for a particular contract depends upon the form of the contract. Therefore, in comparing revenues between
reporting periods, we use net voyage revenue to improve the comparability of reported revenues that are generated by the different forms of contracts. Since net voyage revenue is a
non-GAAP measurement, it is reconciled to the nearest GAAP measurement, voyage revenue, under "Results of Operations" below.
- •
- Other revenue. Other revenue includes revenue from
bareboat charters and from towing and other miscellaneous services.
- •
- Vessel operating expenses. The most significant direct
vessel operating expenses are wages paid to vessel crews, routine maintenance and repairs and marine insurance. We may also incur outside towing expenses during periods of peak demand and in order to
maintain our operating capacity while our tugs are drydocked or otherwise out of service for scheduled and unscheduled maintenance.
- •
- Depreciation and amortization. We incur fixed charges
related to the depreciation of the historical cost of our fleet and the amortization of expenditures for drydockings. The aggregate number of drydockings undertaken in a given period, the size of the
vessels and the nature of the work performed determine the level of drydocking expenditures. We capitalize expenditures incurred for drydocking and amortize these expenditures over 36 months.
We also amortize, over periods ranging from three to twenty years, intangible assets in connection with vessel acquisitions.
- •
- General and administrative expenses. General and
administrative expenses generally consist of employment costs of shore side staff and the cost of facilities, as well as legal, audit, insurance and other administrative costs.
- •
- Total tank vessel days. Total tank vessel days is equal to
the number of calendar days in the period multiplied by the total number of tank vessels operating or in drydock during that period.
- •
- Scheduled drydocking days. Scheduled drydocking days are days designated for the inspection and survey of tank vessels, and identification and completion of required refurbishment work, as required by the U.S. Coast Guard and the American Bureau of Shipping to maintain the vessels' qualification to work in the U.S. coastwise trade. Generally, drydockings are required twice every five years and last between 30 and 60 days, based upon the size of the vessel and the type and extent of work required.
53
- •
- Net utilization. Net utilization is a primary measure of
operating performance in our business. Net utilization is a percentage equal to the total number of days worked by a tank vessel or group of tank vessels during a defined period, divided by total tank
vessel days for that tank vessel or group of tank vessels. Net utilization is adversely impacted by scheduled drydocking, scheduled and unscheduled maintenance and idle time not paid for by the
customer.
- •
- Average daily rate. Average daily rate, another key
measure of our operating performance, is equal to the net voyage revenue earned by a tank vessel or group of tank vessels during a defined period, divided by the total number of days actually worked
by that tank vessel or group of tank vessels during that period. Fluctuations in average daily rates result not only from changes in charter rates charged to our customers, but also from changes in
vessel utilization and efficiency, which could result from internal factors, such as newer and more efficient tank vessels, and from external factors such as weather or other delays.
- •
- Coastwise and local trades. Our business is segregated into coastwise trade and local trade. Our coastwise trade generally comprises voyages of between 200 and 1,000 miles by vessels with greater than 40,000 barrels of barrel-carrying capacity. These voyages originate from the mid-Atlantic states to points as far north as Canada and as far south as Cape Hatteras, from points within the Gulf Coast region to other points within that region or to the Northeast, to and from points on the West Coast of the United States and Alaska, and to and from points within the Hawaiian islands. We also own two non-Jones Act tank barges that transport petroleum products internationally. Our local trade generally comprises voyages by smaller vessels of less than 200 miles. The term U.S. coastwise trade is an industry term used generally for Jones Act purposes, and would include both our coastwise and local trades.
54
The following table summarizes our results of operations for the periods presented (dollars in thousands, except average daily rates):
| |
For the Years Ended June 30, | ||||||||||||
|---|---|---|---|---|---|---|---|---|---|---|---|---|---|
| |
2010 | 2009 | 2008 | ||||||||||
Voyage revenue |
$ | 248,092 | $ | 310,429 | $ | 312,680 | |||||||
Other revenue |
17,333 | 20,033 | 13,600 | ||||||||||
Total revenues |
265,425 | 330,462 | 326,280 | ||||||||||
Voyage expenses |
45,890 | 67,029 | 79,427 | ||||||||||
Vessel operating expenses |
138,051 | 144,291 | 124,551 | ||||||||||
General and administrative expenses |
27,238 | 29,806 | 28,947 | ||||||||||
Depreciation and amortization |
64,196 | 53,582 | 48,311 | ||||||||||
Loss on acquisition of land and building |
1,697 | — | — | ||||||||||
Net gain on sale of vessels |
(801 | ) | (702 | ) | (601 | ) | |||||||
Impairment of goodwill |
54,300 | — | — | ||||||||||
Total operating expenses |
330,571 | 294,006 | 280,635 | ||||||||||
Operating income (loss) |
(65,146 | ) | 36,456 | 45,645 | |||||||||
Interest expense, net |
22,588 | 21,503 | 21,275 | ||||||||||
Other expense (income), net |
(535 | ) | 402 | (2,164 | ) | ||||||||
Income (loss) before provision for (benefit of) income taxes |
(87,199 | ) | 14,551 | 26,534 | |||||||||
Provision for (benefit of) income taxes |
(218 | ) | 287 | 529 | |||||||||
Net income (loss) |
(86,981 | ) | $ | 14,264 | $ | 26,005 | |||||||
Less net income attributable to non-controlling interest |
398 | 317 | 337 | ||||||||||
Net income (loss) attributable to K-Sea Transportation Partners L.P. unitholders |
$ | (87,379 | ) | $ | 13,947 | $ | 25,668 | ||||||
Net voyage revenue by trade |
|||||||||||||
Coastwise |
|||||||||||||
Total tank vessel days |
15,154 | 16,262 | 15,103 | ||||||||||
Days worked |
11,997 | 14,246 | 13,174 | ||||||||||
Scheduled drydocking days |
540 | 333 | 831 | ||||||||||
Net utilization |
79 | % | 88 | % | 87 | % | |||||||
Average daily rate |
$ | 13,340 | $ | 13,457 | $ | 13,731 | |||||||
Total coastwise net voyage revenue(a) |
$ | 160,042 | $ | 191,711 | $ | 180,893 | |||||||
Local |
|||||||||||||
Total tank vessel days |
7,806 | 8,545 | 9,267 | ||||||||||
Days worked |
5,754 | 6,880 | 7,406 | ||||||||||
Scheduled drydocking days |
102 | 218 | 174 | ||||||||||
Net utilization |
74 | % | 81 | % | 80 | % | |||||||
Average daily rate |
$ | 7,327 | $ | 7,513 | $ | 7,070 | |||||||
Total local net voyage revenue(a) |
$ | 42,160 | $ | 51,689 | $ | 52,360 | |||||||
Tank vessel fleet |
|||||||||||||
Total tank vessel days |
22,960 | 24,807 | 24,370 | ||||||||||
Days worked |
17,751 | 21,126 | 20,580 | ||||||||||
Scheduled drydocking days |
642 | 551 | 1,005 | ||||||||||
Net utilization |
77 | % | 85 | % | 84 | % | |||||||
Average daily rate |
$ | 11,391 | $ | 11,521 | $ | 11,334 | |||||||
Total fleet net voyage revenue(a) |
$ | 202,202 | $ | 243,400 | $ | 233,253 | |||||||
- (a)
- Net voyage revenue is a non-GAAP measure which is defined above under "Definitions" and reconciled to Voyage revenue, the nearest GAAP measure, under "Voyage Revenue and Voyage Expenses" in the period-to-period comparisons below.
55
Fiscal Year Ended June 30, 2010 Compared to the Fiscal Year Ended June 30, 2009
Voyage Revenue and Voyage Expenses
Voyage revenue was $248.1 million for the year ended June 30, 2010; a decrease of $62.3 million, or 20.1%, as compared to voyage revenue of $310.4 million for the year ended June 30, 2009. Voyage expenses were $45.9 million for the year ended June 30, 2010, a decrease of $21.1 million, or 31.5%, as compared to voyage expenses of $67.0 million for the year ended June 30, 2009. The decrease in voyage revenue primarily relates to lower utilization for the fleet. The decrease in voyage expenses primarily relates to lower utilization for the fleet offset by an increase in the price of fuel for the year ended June 30, 2010 as compared to the year ended June 30, 2009.
Net Voyage Revenue
Net voyage revenue was $202.2 million for the year ended June 30, 2010; a decrease of $41.2 million, or 16.9%, as compared to net voyage revenue of $243.4 million for the year ended June 30, 2009. In our coastwise trade, net voyage revenue was $160.0 million for the year ended June 30, 2010, a decrease of $31.7 million, or 16.5%, as compared to $191.7 million for the year ended June 30, 2009. Net utilization in our coastwise trade was 79% for the year ended June 30, 2010 as compared to 88% for the year ended June 30, 2009. Net voyage revenue in our coastwise trade decreased by an aggregate $51.7 million for the year ended June 30, 2010 primarily relating to (1) a decrease of $23.8 million relating to thirteen barges which worked in the spot market in the twelve months ended June 30, 2010 as compared to being on time charters during the twelve months ended June 30, 2009, (2) a decrease of $11.4 million relating to seven single-hull barges, of which three were sold, three were retired and one was returned to the lessor from a long-term lease in January 2009, (3) a decrease of $10.1 million relating to five barges which moved from transporting petroleum products during the year ended June 30, 2009 to performing storage activities for the processing of oily water at our waste water treatment facility during the year ended June 30, 2010, (4) a decrease of $3.1 million relating to four vessels on time charter during the twelve months ended June 30, 2010 and 2009 which had a decline in average daily rate on their new or renewed time charter, (5) a decrease of $2.3 million relating to two vessels which were in the shipyard for an extended period during the year ended June 30, 2010 and (6) a decrease of $1.0 million relating to one barge which had lower utilization during the year ended June 30, 2010 due to weak demand in the spot market. These decreases were partially offset by an aggregate increase in net voyage revenue in our coastwise trade of $20.0 million relating to (1) an increase of $16.4 million due to an increase in the number of working days for our barges due to the delivery of the DBL 76, which began operations in November 2008, the DBL 79, which began operations in January 2009, the DBL 185, which began operations in November 2009, the DBL 54, which began operations in March 2010, and the DBL 106, which began operations in April 2010 and (2) an increase of $3.6 million relating to three barges which were in the shipyard for extended periods during the year ended June 30, 2009 and four barges which had higher rates and utilization during the year ended June 30, 2010 primarily due to contractual rate increases and some service interruption experienced during the three month period ended December 31, 2008. Coastwise average daily rates decreased 0.9% to $13,340 for the year ended June 30, 2010 from $13,457 for the year ended June 30, 2009 mainly as a result of lower rates relating to storage contracts serviced by vessels supporting our waste water treatment facility.
Net voyage revenue in our local trade for the year ended June 30, 2010 decreased by $9.5 million, or 18.4%, to $42.2 million from $51.7 million for the year ended June 30, 2009. Local net voyage revenue decreased an aggregate of $10.5 million for the year ended June 30, 2010 primarily due to (1) a decrease of $2.8 million relating to the retirement of three single-hull vessels during fiscal year 2009, (2) a decrease of $3.3 million relating to five single hull barges which were retired during the year ended June 30, 2010, (3) a decrease of $3.2 million relating to six barges which worked in the spot market in the year ended June 30, 2010 as compared to being on a time charter for the year ended
55
June 30, 2009 and (4) a decrease of $1.2 million relating to four vessels which were in the shipyard for an extended period during the year ended June 30, 2010. These decreases were partially offset by an aggregate increase in net voyage revenue in our local trade of $1.0 million relating to (1) an increase of $0.7 million due to a vessel which was placed in service during the fourth quarter of fiscal 2009, (2) an increase of $0.1 million due to one barge which had increased utilization and rates for the year ended June 30, 2010 and (3) an increase of $0.2 million due to a vessel that was in the shipyard for an extended period during the year ended June 30, 2009. Net utilization in our local trade was 74% for the year ended June 30, 2010, compared to 81% for the year ended June 30, 2009. Average daily rates in our local trade decreased 2.5% to $7,327 for the year ended June 30, 2010 from $7,513 for the year ended June 30, 2009 due to weak spot market rates.
Other Revenue
Other revenue decreased by $2.7 million, or 13.5%, to $17.3 million for the year ended June 30, 2010, as compared to $20.0 million for the year ended June 30, 2009. Other revenue decreased by an aggregate $5.1 million due to a decrease of $4.1 million due to the expiration of time charters relating to tug boats acquired in fiscal year 2008 and laying up certain tug boats in fiscal year 2010, a decrease of $0.5 million for three barges under bareboat charter during the year ended June 30, 2009, which were disposed in the fiscal year 2009, and the absence of a gain during fiscal year 2010 relating to a customer contract cancellation settlement which occurred during fiscal year 2009. This decrease was partially offset by an aggregate increase of $2.5 million relating to one tug boat towing contract and one barge bareboat contract which each began during fiscal year 2010.
Vessel Operating Expenses
Vessel operating expenses were $138.1 million for the year ended June 30, 2010, a decrease of $6.2 million, or 4.3%, as compared to $144.3 million for the year ended June 30, 2009. Vessel labor and related costs for the year ended June 30, 2010 decreased $8.2 million, primarily due to a decrease in crew headcount resulting from lower utilization which was partially offset by an increase in medical insurance costs of $1.5 million. Other vessel operating costs decreased approximately $6.0 million for the year ended June 30, 2010, including: (1) a decrease of $2.1 million in repairs and maintenance, (2) a decrease of $1.7 million in insurance expense primarily due to the supplemental insurance call which occurred during the year ended June 30, 2009, reduced premiums relating to vessels sold during the years ended June 30, 2010 and 2009 and premium credits for vessels laid up during the year ended June 30, 2010, (3) a decrease of $1.3 million in outside towing expenses as a result of additional tug availability during the year ended June 30, 2010 due to the retirement of certain single-hull vessels, (4) a decrease of $0.7 million in bad debt expense and (5) a decrease of $0.2 million relating to fuel and other costs due to expired towing contracts and a decrease in the overall price of fuel. These decreases were partially offset by $6.5 million of aggregate increases attributable to (1) $5.5 million in outside charter fees due to the sale of eight tank barges under sale leaseback agreements in fiscal year 2009, (2) $0.7 million relating to an increase in operating costs for our waste water treatment facility, and (3) $0.3 million in claim costs.
Depreciation and Amortization
Depreciation and amortization was $64.2 million for the year ended June 30, 2010, an increase of $10.6 million, or 19.8%, as compared to $53.6 million for the year ended June 30, 2009. The increase in depreciation and amortization for the year ended June 30, 2010 includes $12.6 million due to the impairment of certain vessels and construction in progress as described under "—Significant Events" above. This increase was partially offset by a decrease of $2.0 million for vessels sold under sale leaseback during fiscal year 2009 and lower depreciation for vessels sold and impaired during the years ended June 30, 2010 and 2009.
56
Loss on Acquisition of Land and Building
Loss on acquisition of land and building was $1.7 million for the year ended June 30, 2010. The loss of $1.7 million for the year ended June 30, 2010 was a result of the October 2009 exercise of a purchase option in a lease agreement which was executed in December 2004. The price of the facility was approximately $1.7 million in excess of its fair value resulting in the loss. Fair value was determined based on our consideration of comparable land sales and replacement cost data. The lease did not have any renewal options and purchasing the facility was necessary to enable us to continue using the facility and maintain the waste water treatment business.
Net Gain on Sale of Vessels
Net gain on sale of vessels was $0.8 million for the year ended June 30, 2010, an increase of $0.1 million, or 14.3%, as compared to $0.7 million for the year ended June 30, 2009. The gain of $0.8 million for the year ended June 30, 2010 was a result of the sale of nine single hull barges, one deck barge and one tug boat.
Impairment of Goodwill
Impairment of goodwill was $54.3 million for the year ended June 30, 2010. The impairment of goodwill was a result of a triggering event requiring both a long lived asset impairment and goodwill impairment analysis as described under "—Significant Events" above.
General and Administrative Expenses
General and administrative expenses were $27.2 million for the year ended June 30, 2010; a decrease of $2.6 million, or 8.7%, as compared to general and administrative expenses of $29.8 million for the year ended June 30, 2009. The $2.6 million decrease includes a $1.1 million decrease in labor and related costs due to a reduction in head count offset by an increase in medical expense of $0.4 million, a $0.2 million decrease in stock compensation costs due to the absence of new grants during fiscal year 2010, a $0.3 million decrease in travel expenses resulting from a decrease in headcount, a $0.7 million decrease in expenses relating to professional services and an additional $0.6 million in general cost reduction activities.
Interest Expense, Net
Net interest expense was $22.6 million for the year ended June 30, 2010, or $1.1 million higher than the $21.5 million incurred for the year ended June 30, 2009. Net interest expense increased for the year ended June 30, 2010 compared to June 30, 2009 due to higher margins on certain debt agreements and a $0.8 million write-off of deferred financing fees, both resulting from amending our revolving loan agreement and a term loan facility, partially offset by lower average debt balances and lower variable interest rates.
Other Expense (Income), Net
Other expense (income), net of ($0.5 million) for the year ended June 30, 2010 is primarily comprised of a $0.5 million reversal of a provision for contract cancellation due to a settlement agreement with a shipyard. Other expense (income), net of $0.4 million for the year ended June 30, 2009 is primarily comprised of the same $0.5 million provision for contract cancellation noted above.
Provision for Income Taxes
Our provision for income taxes is based on our estimated annual effective tax rate. For the year ended June 30, 2010 and 2009, our effective tax rate was negative 0.3% and 2.0%, respectively. Our
57
effective tax rate was lower for the year ended June 30, 2010 compared to the year ended June 30, 2009, primarily due to the pre-tax book loss at our corporate subsidiaries. Our effective tax rate comprises the New York City Unincorporated Business Tax and foreign taxes on our operating partnership, plus federal, state, local and foreign corporate income taxes on the taxable income of our operating partnership's corporate subsidiaries.
Net Income (Loss)
Net loss was $87.0 million for the year ended June 30, 2010; a decrease of $101.3 million compared to net income of $14.3 million for the year ended June 30, 2009. This decrease resulted primarily from a $101.6 million decrease in operating income, and a $1.1 million increase in interest expense, partially offset by a $0.9 million increase in other income and a $0.5 million decrease in the provision for income taxes.
Fiscal Year Ended June 30, 2009 Compared to the Fiscal Year Ended June 30, 2008
Voyage Revenue and Voyage Expenses
Voyage revenue was $310.4 million for the year ended June 30, 2009; a decrease of $2.3 million, or 0.7%, as compared to voyage revenue of $312.7 million for the year ended June 30, 2008. Voyage expenses were $67.0 million for the year ended June 30, 2009, a decrease of $12.4 million, or 15.6%, as compared to voyage expenses of $79.4 million for the year ended June 30, 2008. The decrease in voyage expenses primarily relates to the decrease in the price of fuel.
Net Voyage Revenue
Net voyage revenue was $243.4 million for the year ended June 30, 2009; an increase of $10.1 million, or 4.3%, as compared to net voyage revenue of $233.3 million for the year ended June 30, 2008. In our coastwise trade, net voyage revenue was $191.7 million for the year ended June 30, 2009, an increase of $10.8 million, or 6.0%, as compared to $180.9 million for the year ended June 30, 2008. Net utilization in our coastwise trade was 88% for the year ended June 30, 2009 as compared to 87% for the year ended June 30, 2008. Net voyage revenue in our coastwise trade increased $15.0 million for the year ended June 30, 2009 due (1) to an increase in the number of working days for our barges (a) the DBL 77 and the Washington, both of which began operations in July 2008 and (b) the DBL 76 and the DBL 79, which began operations in November 2008 and January 2009, respectively, and (2) the net decrease in scheduled drydocking days in fiscal year 2009 versus fiscal year 2008. These increases were partially offset by a decrease of $2.5 million relating to two barges that were sold and a decrease of $1.8 million relating to a barge which worked in the spot market in the year ended June 30, 2009 as compared to being on a time charter for the year ended June 30, 2008. Average daily rates in our coastwise trade decreased 2.0% to $13,457 for the year ended June 30, 2009 from $13,731 for the year ended June 30, 2008 due to a write down of our fuel inventory to reflect lower fuel cost and lower rates in the Gulf Coast region due to decreased demand for #6 oil due to the lower price of natural gas.
Net voyage revenue in our local trade for the year ended June 30, 2009 decreased by $0.7 million, or 1.3%, to $51.7 million from $52.4 million for the year ended June 30, 2008. Local net voyage revenue increased by $3.8 million during the year ended June 30, 2009 due to the increased number of working days for the newbuild barges DBL 23, DBL 24 and DBL 25, which were delivered in September 2007, December 2007, and March 2008, respectively. Additionally, local net voyage revenue increased by $2.0 million due to the movement of two vessels from performing operational support activities for our waste water treatment and Philadelphia facilities during the year ended June 30, 2008 to the spot bunker market in the year ended June 30, 2009 and the return to service of a vessel that was in shipyard for an extended period during the year ended June 30, 2008. The $5.8 million increase
58
was offset by a decrease in local net voyage revenue of $6.4 million due to the retirement of six single-hull vessels, four of which were sold as of June 30, 2009. Net utilization in our local trade was 81% for the year ended June 30, 2009, compared to 80% for the year ended June 30, 2008. Average daily rates in our local trade increased 6.3% to $7,513 for the year ended June 30, 2009 from $7,070 for the year ended June 30, 2008 due to higher rates on certain clean oil vessels due to a colder winter as compared to the year ended June 30, 2008 and higher rates on certain newbuild vessels.
Other Revenue
Other revenue increased by $6.4 million, or 47.1%, to $20.0 million for the year ended June 30, 2009, as compared to $13.6 million for the year ended June 30, 2008. Of this $6.4 million increase, $5.9 million was attributable to increased revenue from the purchase of eight tugboats in June 2008, $0.9 million was a result of a full year of operations relating to the Smith Maritime Group acquisition, and $0.5 million related to a customer contract cancellation settlement during fiscal year 2009. These increases were partially offset by a $1.0 million decrease due to three vessels whose charters terminated during fiscal year 2009 and which had operated under charters during the year ended June 30, 2008.
Vessel Operating Expenses
Vessel operating expenses were $144.3 million for the year ended June 30, 2009, an increase of $19.7 million, or 15.8%, as compared to $124.6 million for the year ended June 30, 2008. Voyage and vessel operating expenses as a percentage of total revenues increased to 63.9% for the year ended June 30, 2009 from 62.5% for the year ended June 30, 2008. Vessel labor and related costs for the year ended June 30, 2009 increased $18.0 million as a result of a contractual labor rate increase reflected in our new two-year labor contract with certain of our vessel employees and a higher average number of employees for the year ended June 30, 2009 due to the operation of the additional barges and tugboats described under "—Net voyage revenue" and "—Other Revenue" above. Other vessel operating costs increased approximately $1.8 million for the year ended June 30, 2009, including $8.4 million of aggregate increases attributable to (1) an increase in vessel insurance premiums of $4.4 million due an increased number of vessels and rate increases, including $2.5 million relating to the additional call described in "—Significant Events" above; (2) an increase of $1.2 million for repairs, damages, maintenance, supplies and parts; (3) an increase of $0.6 million relating to bad debt expense primarily as a result of the resolution of an arbitration proceeding; (4) an increase of $0.9 million in outside charter fees primarily due to certain sale-leaseback agreements entered into during fiscal 2009; and (5) an increase of $1.3 million relating to fuel and other costs. Such increases were partially offset by a decrease of $6.0 million in outside towing expenses as a result of the purchase of eight additional tug boats in June 2008 and a $0.6 million decrease in uninsured losses relating to the deductible portion of insurance claims.
Depreciation and Amortization
Depreciation and amortization was $53.6 million for the year ended June 30, 2009, an increase of $5.3 million, or 11.0%, as compared to $48.3 million for the year ended June 30, 2008. The increase in depreciation and amortization for the year ended June 30, 2009 includes $5.0 million for vessels purchased and newbuilds placed in service during fiscal years 2009 and 2008 and $5.8 million for increased drydocking amortization. These increases were partially offset by a decrease of $6.4 million due to the change in estimated useful lives of our vessels and salvage values as described under "—Significant Events" above.
General and Administrative Expenses
General and administrative expenses were $29.8 million for the year ended June 30, 2009; an increase of $0.9 million, or 3.1%, as compared to general and administrative expenses of $28.9 million
59
for the year ended June 30, 2008. As a percentage of total revenues, general and administrative expenses increased to 9.0% for the year ended June 30, 2009 from 8.9% for the year ended June 30, 2008. The $0.9 million increase for the year ended June 30, 2009 is primarily the result of increased personnel costs resulting from increased average headcount for the year ended June 30, 2009 to support our growth and the additional facilities costs of our offices in Hawaii and Seattle.
Interest Expense, Net
Net interest expense was $21.5 million for the year ended June 30, 2009, or $0.2 million higher than the $21.3 million incurred for the year ended June 30, 2008. Net interest expense increased slightly for the year ended June 30, 2009 compared to June 30, 2008 because of higher average debt balances, partially offset by lower variable interest rates.
Other Expense (Income), Net
Other expense (income), net of $0.4 million for the year ended June 30, 2009 is primarily comprised of a $0.5 million provision for contract cancellation. Other expense (income), net of ($2.2 million) for the year ended June 30, 2008 is primarily comprised of a reimbursement of certain expenses totaling $2.1 million resulting from a court settlement relating to an incident with one of our tank barges in November 2005.
Provision for Income Taxes
Our provision for income taxes is based on our estimated annual effective tax rate. For the fiscal year ended June 30, 2009 and 2008, our effective tax rate was 2.0%. Our effective tax rate comprises the New York City Unincorporated Business Tax and foreign taxes on our operating partnership, plus federal, state, local and foreign corporate income taxes on the taxable income of our operating partnership's corporate subsidiaries.
Net Income
Net income was $14.3 million for the year ended June 30, 2009; a decrease of $11.7 million compared to net income of $26.0 million for the year ended June 30, 2008. This decrease resulted primarily from a $9.2 million decrease in operating income, a $2.6 million decrease in other income and a $0.2 million increase in interest expense, partially offset by a $0.2 million decrease in the provision for income taxes.
LIQUIDITY AND CAPITAL RESOURCES
Operating Cash Flows. Net cash provided by operating activities was $7.8 million, $52.3 million and $40.8 million for the years ended June 30, 2010, 2009 and 2008, respectively. The decrease of $44.5 million in fiscal 2010, compared to fiscal 2009, resulted from a $6.8 million negative impact from changes in assets and liabilities, a $1.2 million increase in drydocking payments and a $36.5 million negative impact from operating results, after adjusting for non-cash expenses such as depreciation and amortization. During the year ended June 30, 2010, our working capital increased, thereby decreasing cash flow, primarily due to an increase in accounts receivable as a result of fewer time charter contracts (which are paid in advance). The increase of $11.5 million in fiscal 2009, compared to fiscal 2008, resulted from a $10.2 million positive impact from changes in operating working capital and by decreased drydocking payments of $4.9 million, offset by $3.6 million of negative impact from operating results, after adjusting for non-cash expenses such as depreciation and amortization. During fiscal 2008, our working capital increased mainly due to increased accounts receivable as a result of increased revenues, and increased prepaid expenses as a result of increased fuel inventory which resulted from higher fuel prices.
60
Investing Cash Flows. Net cash used in investing activities totaled $39.6 million, $45.4 million and $292.2 million for the years ended June 30, 2010, 2009 and 2008, respectively. Tank vessel construction in the year ended June 30, 2010 aggregated $37.7 million and included progress payments on the construction of one 185,000-barrel articulated tug-barge unit and one 100,000-barrel tank barge. Capital expenditures of $5.5 million for the year ended June 30, 2010 consisted primarily of coupling tugboats to our newbuild tank barges. The year ended June 30, 2010 also includes approximately $4.2 million for the purchase of land and a building associated with our waste water treatment operations in Norfolk, Virginia. Proceeds from the sale of vessels and equipment aggregated $5.3 million for the year ended June 30, 2010 and included the sale of nine single hull barges, one deck barge and one tug boat. Collections on notes receivable from the purchasers of two vessels sold in fiscal year 2009 were $2.6 million for the year ended June 30, 2010. Tank vessel construction in the year ended June 30, 2009 aggregated $65.2 million and included progress payments on the construction of one 185,000-barrel articulated tug barge unit, one 100,000-barrel tank barge and two 80,000-barrel tank barges. Capital expenditures of $10.1 million for the year ended June 30, 2009 consisted primarily of coupling tugboats to our newbuild tank barges and rebuilding the hull of one of our tugboats. Cash proceeds on the sale of vessels in the year ended June 30, 2009 were $29.5 million, primarily related to sale-leaseback agreements. Excluded from this amount are $1.5 million related to a note issued by the purchaser of a single-hull barge which was paid in monthly installments with the final payment received in April 2010 and $2.1 million related to a note issued by the purchaser of a single-hull barge which is expected to be paid in monthly installments with the final payment due in October 2010.
Fiscal 2008 included the $168.9 million cash portion of the purchase price for the Smith Maritime Group. Vessel acquisitions for fiscal 2008 included $60.5 million to acquire two existing barges and eleven additional tugs. We issued a $3.0 million note to the seller on one of the barge purchases, which was paid in November 2007. Tank vessel construction for fiscal 2008 aggregated $52.0 million and included progress payments on the construction of three new 80,000-barrel tank barges, three new 28,000-barrel tank barges, a new 50,000-barrel tank barge, a new 100,000-barrel tank barge and a new 185,000-barrel articulated tug-barge unit. Other capital expenditures, totaling $13.3 million in fiscal 2008, related primarily to the coupling of tugboats to our newbuild tank barges, tank renovations on two tank barges and improvements to a newly purchased tug.
Financing Cash Flows. Net cash provided by financing activities was $31.9 million for the year ended June 30, 2010. Net cash used in financing activities was $6.8 million for the year ended June 30, 2009. Net cash provided by financing activities was $252.3 million for the year ended June 30, 2008. The primary financing activities for the year ended June 30, 2010 included $62.1 million in gross proceeds ($59.2 million net proceeds after payment of underwriting discounts and commissions and other transaction costs) from the issuance of 3,244,500 new common units in August 2009, $11.6 million in proceeds from the issuance of long-term debt, net proceeds of $4.2 million from revolving loan and credit agreements borrowings and repayment including a revolving loan agreement repayment of $35.0 million using the equity offering proceeds and the repayment of $16.9 million of term loan borrowings. We also made $21.0 million in distributions to partners as described under "—Payment of Distributions" below, and were required to deposit $3.1 million as additional collateral under a term loan agreement. The primary financing activities for the year ended June 30, 2009 included $51.6 million in gross proceeds from the issuance of 2,000,000 common units in August 2008, $41.4 million in proceeds from the issuance of long-term debt and the repayment of $20.7 million of term loans (which excludes $49.8 million of term loans refinanced via operating lease agreements). We used a portion of the equity offering proceeds for the repayment of $37.5 million of revolving loan borrowings and had additional net borrowings under the revolving loan and credit agreements of $11.7 million. We also made $50.8 million in distributions to partners during fiscal 2009 as described under "—Payment of Distributions" below. The primary financing activities for fiscal 2008 were $138.3 million in gross proceeds from the issuance of 3,500,000 common units in September 2007, $105.0 million of borrowings related to the Smith Maritime Group acquisition, which were repaid with
61
the equity offering proceeds, and $161.9 million of other term loans to finance our vessel newbuilding program and certain tug and barge purchases (including the purchase of eight tugboats from Roehrig Maritime LLC as described under "—Term Loans" below). Repayment of term loans during fiscal 2008 totaled $171.8 million, which included $105.0 million related to the Smith Maritime Group and $27.5 million of bridge financing for the purchase of eight tugboats from Roehrig Maritime LLC. We also increased our credit line borrowings during fiscal 2008 by a net $69.0 million relating to the Smith Maritime Group acquisition and for progress payments on barges under construction, and paid $40.4 million in distributions to partners as described under "—Payment of Distributions" below.
Payment of Distributions. The board of directors of K-Sea General Partner GP LLC declared the following quarterly distributions to unitholders: $0.77 per unit in respect of the quarter ended June 30, 2008, which was paid on August 14, 2008 to unitholders of record on August 6, 2008; $0.77 per unit in respect of the quarter ended September 30, 2008, which was paid on November 14, 2008 to unitholders of record on November 7, 2008; $0.77 per unit in respect of the quarter ended December 31, 2008, which was paid on February 16, 2009 to unitholders of record on February 9, 2009; and $0.77 per unit in respect of the quarter ended March 31, 2009, which was paid on May 15, 2009 to unitholders of record on May 8, 2009. Additionally, the board of directors of K-Sea General Partner GP LLC declared a quarterly distribution of $0.77 per unit in respect of the quarter ended June 30, 2009, which was paid on August 14, 2009 to holders of record on August 10, 2009. The board of directors of K-Sea General Partner GP LLC declared a quarterly distribution of $0.45 per unit in respect of the quarter ended September 30, 2009, which was paid on November 16, 2009 to holders of record on November 9, 2009.
For the quarterly period ended March 31, 2009, the board of directors of K-Sea General Partner GP LLC, after considering the recommendation of its conflicts committee, which consists entirely of independent directors, approved the issuance of 49,775 common units to our general partner in lieu of $1.244 million in cash distributions for the quarterly period ended March 31, 2009. For the quarterly period ended June 30, 2009, the board of directors of K-Sea General Partner GP LLC, after considering the recommendation of its conflicts committee, approved the issuance of 49,908 common units to our general partner in lieu of $1.248 million in cash distributions. Any proposal to issue common units to the general partner in lieu of a future cash distribution will be considered by the board of directors of K-Sea General Partner GP LLC and its conflicts committee at the time such future distribution is considered.
Oil Pollution Act of 1990. Tank vessels are subject to the requirements of OPA 90. OPA 90 mandates that all single-hull tank vessels operating in U.S. waters be removed from petroleum and petroleum product transportation services at various times by January 1, 2015, and provides a schedule for the phase-out of the single-hull vessels based on their age and size. At September 1, 2010, approximately 90% of the barrel-carrying capacity of our tank vessel fleet was double-hulled in compliance with OPA 90, and the remainder will be in compliance with OPA 90 until January 2015.
Ongoing Capital Expenditures. Marine transportation of refined petroleum products is a capital intensive business, requiring significant investment to maintain an efficient fleet and to stay in regulatory compliance. We estimate that, over the next five years, we will spend an average of approximately $21.4 million per year to drydock and maintain our fleet. We expect drydocking and maintenance expenditures to approximate $20.1 million in fiscal 2011. In addition, we anticipate that we will spend approximately $1.0 million annually for other general capital expenditures. Periodically, we also make expenditures to acquire or construct additional tank vessel capacity and/or to upgrade our overall fleet efficiency. For a further discussion of maintenance and expansion capital expenditures, please read footnote 2 to the table in "Selected Financial Data" in Item 6 of this report. The following
62
table summarizes total maintenance capital expenditures, including drydocking expenditures, and expansion capital expenditures for the periods presented (in thousands):
| |
Years Ended June 30, | ||||||||||
|---|---|---|---|---|---|---|---|---|---|---|---|
| |
2010 | 2009 | 2008 | ||||||||
Maintenance capital expenditures |
$ | 22,825 | $ | 21,431 | $ | 27,836 | |||||
Expansion capital expenditures (including vessel and company acquisitions) |
9,213 | 9,624 | 240,710 | ||||||||
Total capital expenditures |
$ | 32,038 | $ | 31,055 | $ | 268,546 | |||||
Construction of tank vessels |
$ | 37,675 | $ | 65,189 | $ | 51,987 | |||||
We took delivery of an 185,000-barrel articulated tug-barge unit, the DBL 185, in October 2009, and a 100,000-barrel tank barge, the DBL 106, in April 2010. These tank barges cost, in the aggregate, $101.8 million. During fiscal 2009, we took delivery of the following newbuild vessels: in November 2008, an 80,000-barrel tank barge, the DBL 76 and in December 2008, an 80,000-barrel tank barge, the DBL 79.
We took delivery of one 30,000-barrel tank barge in July 2010, the DBL 33; and one 30,000-barrel tank barge in August 2010, the DBL 34. These tank barges cost, in the aggregate and after the addition of certain special equipment, approximately $6.6 million. We have a long term contract with a customer relating to the DBL 33. In August 2010, we sold the DBL 34 for $2.3 million, net of commission and escrow agent fees. Since the net proceeds from the sale were lower than the aggregate newbuild cost, we recorded an impairment charge of $0.9 million as of June 30, 2010. We expect to take delivery of a 50,000 barrel tank barge in the third quarter of fiscal 2011 under a lease from the shipyard.
In December 2008, we sold three barges under sale-leaseback agreements with two financial institutions for an aggregate sales price of $34.4 million. The proceeds of the sales were used to make the final payment for construction of one of the vessels, refinance debt with operating lease obligations and fund a security deposit associated with a lease agreement. Each of the three operating lease agreements gives us the right to renew the lease at the end of its initial lease term, which ranges from ten to twelve years. Two of the leases include early buy out options after ten years and nine years, respectively. One lease includes a rent escalation after six years. Gains on the sale of two vessels of $0.9 million and $0.8 million were deferred and are being amortized as a reduction of lease expense, which is included in vessel operating expenses, on a straight line basis over their respective lease terms. Prepaid rent and deferred transaction related costs of $1.6 million are being amortized on a straight line basis over the respective lease terms.
In June 2009, we sold five barges under sale-leaseback agreements with three financial institutions for an aggregate sales price of $47.8 million. Approximately $34.4 million of sales proceeds were disbursed directly by the purchasers to refinance debt with operating lease obligations and fund security deposits associated with certain lease agreements. Four of the five operating lease agreements gave us the right to renew the lease at the end of its initial lease term, which ranges from nine and a half to ten years. Two of these leases included early buyout options after nine years, one lease included an early buyout option after seven and three quarter years and two leases included early buyout options after seven years. Gains on the sale of two vessels of $1.4 million and $0.1 million are being deferred and amortized as a reduction of lease expense, which is included in vessel operating expenses, on a straight line basis over each of their respective lease terms. Losses on the sales of two vessels of $0.3 million and $0.1 million are included in the consolidated statement of operations for the year ended June 30, 2009. Prepaid rent and deferred transaction related costs of $1.1 million are being amortized on a straight line basis over the respective lease terms.
63
Aggregate rent expense for these eight operating lease agreements over their terms is $74.7 million (net of the gain, prepaid rent and deferred cost amortization described above), including rent expense of $7.1 million and $1.4 million for the years ended June 30, 2010 and 2009, respectively, and $7.1 million per year for each year in the five year period ending June 30, 2015. The net unamortized gain relating to these eight leases was $2.8 million and $3.1 million, as of June 30, 2010 and 2009, respectively. The net unamortized prepaid rent and deferred cost relating to these eight leases was $2.4 million and $2.7 million, as of June 30, 2010 and 2009, respectively.
Liquidity Needs. Our primary short-term liquidity needs are to fund general working capital requirements, payment of debt service, distributions to unitholders, and drydocking expenditures while our long term liquidity needs are primarily associated with expansion and other maintenance capital expenditures. Expansion capital expenditures are primarily for the purchase of vessels, while maintenance capital expenditures include drydocking expenditures and the cost of replacing tank vessel operating capacity. Our primary sources of funds for our short term liquidity needs are cash flows from operations and borrowings under our revolving loan and credit agreements, while our long-term sources of funds are cash from operations, long-term bank borrowings and other debt or equity financings.
We believe that cash flows from operations and borrowings under our revolving loan and credit agreements, described under "—Revolving Loan and Credit Agreements" below, will be sufficient to meet our liquidity needs for the next 12 months.
Revolving Loan and Credit Agreements.
Effective August 31, 2010, we amended (the "Revolver Amendment") our revolving loan agreement (as amended, the "Revolving Loan Agreement") to among other things (1) reduce the revolving lenders' commitments from $175.0 million to $115.0 million (subject to a maximum borrowing base equal to two-thirds of the orderly liquidation value of the vessel collateral), (2) amend the fixed charge coverage and total funded debt to EBITDA covenants and increase the asset coverage ratio , (3) maintain a July 1, 2012 maturity date, and (4) allow us to pay cash distributions subject to liquidity requirements and certain minimum financial ratios starting with the fiscal quarter ending March 31, 2011. In connection with the Revolver Amendment, we incurred amendment and structuring fee totaling $1.16 million, excluding other transaction related costs. Due to the reduction in the borrowing capacity, we will record a charge for the three months ended September 30, 2010 relating to a portion of the unamortized deferred costs associated with the previous revolving loan agreement.
As amended by the Revolver Amendment, the obligations under the Revolving Loan Agreement are collateralized by a first priority security interest, subject to permitted liens, on certain of our vessels having an orderly liquidation value equal to at least 1.50 times the amount of the aggregate obligations (including letters of credit) outstanding under the Revolving Loan Agreement. Borrowings under the Revolving Loan Agreement bear interest at a rate per annum equal, at our option, to (a) the greater of the prime rate, the federal funds rate plus 0.5% or 1% above the 30-day London Interbank Offered Rate ("LIBOR") (a "base rate loan") or (b) the 30-day LIBOR, in each case plus a margin based upon the ratio of total funded debt to EBITDA, as defined in the Revolving Loan Agreement. We also incur commitment fees, payable quarterly, on the unused amounts under this facility.
64
The following table summarizes the applicable margins under the Revolving Loan Agreement, as amended:
Ratio of Total Debt to EBITDA
|
LIBOR Margin |
Base Rate Margin |
Commitment Fee |
|||||||
|---|---|---|---|---|---|---|---|---|---|---|
Greater than or equal to 6.00:1.00 |
5.750 | % | 4.750 | % | 0.875 | % | ||||
Greater than or equal to 5.00:1.00 and less than 6.00:1.00 |
5.250 | % | 4.250 | % | 0.750 | % | ||||
Greater than or equal to 4.50:1.00 and less than 5.00:1.00 |
4.750 | % | 3.750 | % | 0.625 | % | ||||
Greater than or equal to 3.50:1.00 and less than 4.50:1.00 |
4.250 | % | 3.250 | % | 0.500 | % | ||||
Greater than or equal to 2.50:1.00 and less than 3.50:1.00 |
3.750 | % | 2.750 | % | 0.450 | % | ||||
Greater than or equal to 1.50:1.00 and less than 2.50:1.00 |
3.250 | % | 2.250 | % | 0.375 | % | ||||
Less than 1.50:1.00 |
2.750 | % | 1.750 | % | 0.375 | % | ||||
provided; that commencing January 1, 2011, all pricing associated with a ratio in excess of 6.00:1.00 shall increase by 0.50% and shall continue to increase an additional 0.50% for each fiscal quarter thereafter for each quarter that such ratio exceeds 6.00:1.00.
Interest on a base rate loan is payable monthly over the term of the Revolving Loan Agreement. Interest on a LIBOR-based loan is due, at our election, one, two or three months after such loan is made. Outstanding principal amounts are due upon termination of the Revolving Loan Agreement.
As a result of the Revolver Amendment, the minimum fixed charge coverage ratio will decrease from 1.50 to 1.00 to 0.75 to 1.00 for the fiscal quarter ended June 30, 2010; 0.50 to 1.00 through December 31, 2010; 0.60 to 1.00 through June 30, 2011; 0.70 to 1.00 through December 31, 2011; 0.75 to 1.00 through March 31, 2012; and 1.05 to 1.00 through June 30, 2012 and thereafter. In addition, our ratio of total funded debt to EBITDA may not exceed 6.50 to 1.00 for the fiscal quarter ended June 30, 2010; 6.90 to 1.00 through December 31, 2010; 6.75 to 1.00 through March 31, 2011; 6.50 to 1.00 through June 30, 2011; 5.75 to 1.00 through September 30, 2011; 5.20 to 1.00 through December 31, 2011; 4.85 to 1.00 through March 31, 2012; and 4.40 to 1.00 through June 30, 2012 and thereafter.
The Revolver Amendment limits quarterly cash distributions to our unitholders to $0.45 per unit and requires that, inter alia, we maintain a minimum liquidity of $17.5 million in order to declare any distributions. In general, the Revolver Amendment defines liquidity as the sum of (a) unrestricted cash determined on a consolidated basis plus (b) (i) the lesser of (A) $115.0 million and (B) the orderly liquidation value of the vessel collateral divided by 1.50, minus (ii) the aggregate amount outstanding to the lenders as of the date of such determination. We will be permitted to pay distributions if (a) the fixed charge coverage ratio is at least 1.0 times for two consecutive fiscal quarters prior to and after giving effect to such distributions; (b) the projected fixed charge coverage ratio is equal to or greater than 1.0 to 1.0 for the next twelve months and is equal to or greater than 1.0 to 1.0 in three of four of those quarters; and (c) the total funded debt to EBITDA ratio is less than 5.0 to 1.0. No such cash distributions may be paid prior to the end of the March 31, 2011 quarter. Any decision to resume cash distributions on our units and the amount of any such distributions would consider maintaining sufficient cash flow in excess of the distribution to continue to move towards lower leverage levels. We will also consider general economic conditions and our outlook for our business as we determine to pay any distribution.
65
Loan proceeds under the Revolving Loan Agreement may be used for any purpose in the ordinary course of business, including vessel acquisitions, ongoing working capital needs and distributions. The Revolving Loan Agreement contains covenants that include, among others:
- •
- the maintenance of financial ratios (all ratios as defined in the agreement) as shown below;
- •
- restrictions on creating liens on or disposing of the vessels collateralizing the Revolving Loan Agreement, subject to
permitted exceptions;
- •
- restrictions on merging and selling assets outside the ordinary course of business;
- •
- prohibitions on making distributions to limited or general partners of ours during the continuance of a default;
- •
- prohibitions on making distributions to limited or general partners of ours unless a minimum liquidity of $
17.5 million and certain financial ratios are met;
- •
- restrictions on transactions with affiliates and materially changing our business; and
- •
- limitations on capital expenditures and permitted acquisitions.
The Revolving Loan Agreement contains customary events of default. If an event of default occurs and is continuing, we must repay all amounts outstanding under the agreement.
As of June 30, 2010 borrowings under the Revolving Loan Agreement amounted to $136.0 at the LIBOR rate and $9.0 at the base rate. As of June 30, 2009 borrowings outstanding were $140.0 at the LIBOR rate.
On November 30, 2007, we entered into agreements with a financial institution to swap the LIBOR-based, variable rate interest payments on $104.9 million of our Revolving Loan Agreement borrowings to fixed rates, for a term of three years. The fixed rates to be paid by us average 4.01% plus the applicable margin. The fair value of the swap contracts of ($1.9 million) and ($4.7 million) as of June 30, 2010 and 2009, respectively, is included in other liabilities in the consolidated balance sheets.
We also have a separate $5.0 million revolver with a commercial bank to support our daily cash management. On January 5, 2010, we amended and restated this revolver. The amendment reduced the borrowing capacity to $4.0 million (subject to a borrowing base limitation of 75% of orderly liquidation value), conformed the financial covenants to the financial covenants of the Revolving Loan Agreement, including future amendments to such financial covenants, and increased the interest rate margin from 1.4% to 4.25%. Advances under this facility bear interest at 30-day LIBOR plus the margin. The outstanding balances at June 30, 2010 and 2009 totaled $0.0 million and $0.4 million, respectively. This revolving credit facility is collateralized by three barges and one tug boat.
66
Term Loans. Term loans and capital lease obligation outstanding at June 30, 2010 and 2009 were as follows. Descriptions of these borrowings are included below:
| |
2010 | 2009 | ||||||
|---|---|---|---|---|---|---|---|---|
| |
(in thousands) |
|||||||
Term loans due: |
||||||||
May 1, 2012 |
1,772 | 2,619 | ||||||
October 1, 2012 |
1,622 | 2,245 | ||||||
December 31, 2012 |
7,530 | 8,317 | ||||||
January 1, 2013 |
11,318 | 11,039 | ||||||
April 30, 2013 |
12,750 | 14,036 | ||||||
May 1, 2013 |
63,143 | 67,661 | ||||||
June 1, 2014 |
15,966 | 17,418 | ||||||
July 1, 2015 |
24,920 | 26,284 | ||||||
November 1, 2015 |
5,244 | 5,601 | ||||||
December 1, 2016 |
56,057 | 46,023 | ||||||
February 28, 2018 |
4,893 | 5,139 | ||||||
April 1, 2018 |
3,905 | 4,096 | ||||||
May 1, 2018 |
14,914 | 15,638 | ||||||
August 1, 2018 |
14,451 | 16,220 | ||||||
Capital lease obligation |
— | 399 | ||||||
|
238,485 | 242,735 | ||||||
Less current portion |
19,024 | 16,820 | ||||||
|
$ | 219,461 | $ | 225,915 | ||||
On October 8, 2008, we entered into a loan agreement with a financial institution to borrow $5.8 million, for which we pledged two tug boats as collateral. The proceeds of the loan were used to repay indebtedness under our revolving loan agreement. This loan bears interest at a fixed rate of 5.85% per annum. This loan is repayable by one payment of interest only covering the period from the closing date through October 31, 2008, which was paid on November 1, 2008, and 84 monthly installments of $0.06 million commencing December 1, 2008, with the remaining principal balance of $2.9 million, together with interest, due on November 1, 2015. Outstanding borrowings were $5.2 million and $5.6 million at June 30, 2010 and 2009, respectively.
On June 5, 2008, we closed the last of eleven fixed-rate term loans aggregating $72.1 million, which were entered into between April 30, 2008 and June 5, 2008. These loans were arranged with a financial institution, which assigned all but two to other financial institutions. The proceeds of these loans were used to repay borrowings under our revolving loan agreement, except for $15.0 million which was used to repay an advance on such loans which was borrowed on March 21, 2008 concurrent with the repayment of a separate term loan on March 24, 2008. These term loan agreements contain customary events of default, including a cross default to our revolving loan agreement, and also the fixed charge coverage ratio requirement that is included in the revolving loan agreement. In conjunction with the sale-leaseback transactions two of these term loans were repaid in December 2008 and four were repaid in June 2009. The remaining five term loans have a term of ten years maturing between April 1, 2018 and May 1, 2018 and are collateralized by three barges and two tugboats. The remaining five term loans bear a weighted average interest rate of 6.43% and are repayable in an aggregate fixed monthly payment of $0.2 million. Final balloon payments on the remaining five term loans aggregate $9.1 million between April 1, 2018 and May 1, 2018. Borrowings outstanding on these loans totaled $18.8 million and $19.7 million at June 30, 2010 and 2009, respectively.
67
Also on June 5, 2008, in connection with the acquisition of eight tugboats and ancillary equipment from Roehrig Maritime LLC, we entered into a $31.7 million bridge loan agreement with a financial institution. The bridge loan was to mature on October 5, 2008; we have since refinanced $27.5 million of the bridge loan with term loans and repaid the balance on July 13, 2008 using our revolving loan agreement. The term loans all have terms of seven years. Two of the loans totaling $19.9 million bear a weighted average interest rate of 6.52% and are repayable in an aggregate fixed monthly amount of $0.2 million, with final balloon payments of principal totaling $12.1 million due at maturity on July 1, 2015. A third term loan bears interest at LIBOR plus 2.0%, is repayable in fixed principal amounts ranging from $30,896 to $41,946 monthly, plus interest, and matures on July 1, 2015 at which time a final balloon payment of principal of $4.6 million is due. These term loans are collateralized by six tugboats. Borrowings outstanding on these term loans totaled $24.9 million and $26.3 million at June 30, 2010 and 2009, respectively.
On June 4, 2008, we entered into a credit agreement (the "ATB Facility") with a financial institution pursuant to which the lender agreed to provide financing during the construction period, and thereafter, for a 185,000-barrel articulated tug-barge unit in an amount equal to 80% of the acquisition costs of the unit, up to a maximum of $57.6 million. Obligations under the ATB Facility were collateralized during the construction period by an assignment of our rights under the construction contract with the shipyard and, after delivery, are collateralized by a first preferred mortgage in the tug-barge unit and a cash security deposit of $3.1 million. Interest is payable quarterly at the applicable LIBOR rate plus a margin based upon our ratio of total funded debt to EBITDA, as defined in the agreement. The margin ranged from 1.05% to 1.85% through December 31, 2009 and 2.75% to 4.75% through June 30, 2010. At the November 2, 2009 delivery date of the unit, the aggregate of the advances taken during the construction period of $57.6 million were converted to a term loan ("ATB Loan") repayable in twenty-eight quarterly payments covering 37.5% of the term loan, which approximate $0.8 million each, plus interest at LIBOR plus the applicable margin. The twenty eighth and final payment will also include a balloon payment of $36.0 million. The ATB Loan contained the same financial covenants as are contained in our revolving loan agreement described above, as well as customary events of default. Outstanding borrowings were $56.1 million and $46.0 million at June 30, 2010 and 2009 respectively, under the agreement. On June 13, 2008, we also entered into an agreement with the bank to swap the LIBOR-based, variable rate interest payments on the outstanding balance of the ATB Loan to a fixed rate of 5.08% over the same term, resulting in a total fixed interest rate of 5.08% plus the applicable margin. The fair value of the swap contract of ($8.0 million) and ($4.6 million) as of June 30, 2010 and 2009, respectively, is included in other liabilities in the consolidated balance sheets. On August 31, 2010, we amended the ATB Loan (as amended, "ATB Agreement") to amend the financial covenants in the ATB Loan to conform to the financial covenants and LIBOR margins in the Revolving Loan Agreement, as amended by the Revolver Amendment. The Revolving Loan Agreement LIBOR margins range from 2.75% to 5.75% and commencing January 1, 2011, all pricing associated with a total funded debt to EBITDA ratio in excess of 6.00:1.00 shall increase by 0.50% and shall continue to increase an additional 0.50% for each fiscal quarter thereafter for each quarter that such ratio exceeds 6.00:1.00. In connection with this amendment, we paid an amendment fee of 0.5% of the outstanding principal amount. At August 31, 2010, borrowings outstanding under the ATB Agreement were $55.3 million.
On February 22, 2008, we closed a new ten-year, $5.4 million term loan to finance the purchase of a tugboat. The loan bears interest at 6.15%, and is repayable in monthly installments of $46,220 with a final payment at maturity on February 28, 2018 of $2.4 million. The loan is collateralized by the related tugboat. The principal balance of the loan was $4.9 million and $5.1 million at June 30, 2010 and 2009, respectively.
68
On August 14, 2007, in connection with the acquisition of the Smith Maritime Group, we assumed two term loans totaling $23.5 million. The first, in the amount of $19.5 million, bears interest at LIBOR plus 1.25% and is repayable in equal monthly installments of $147,455, plus interest, through August 2018. The second, in the amount of $4.0 million, bears interest at LIBOR plus 1.0% and is repayable in monthly installments ranging from $59,269 to $81,320, plus interest, through May 2012. These loans are collateralized by three tank barges. We also agreed with the lender to assume the two existing interest rate swaps relating to these two loans. The LIBOR-based, variable rate interest payments on these loans have been swapped for fixed payments at an average rate of 5.46%, plus a margin, over the same terms as the loans. Borrowings outstanding on the term loans were $16.2 million and $18.8 million at June 30, 2010 and 2009, respectively. The fair value of the swap contract of ($2.1 million) and ($1.9 million) as of June 30, 2010 and 2009, respectively, is included in other liabilities in the consolidated balance sheets.
Also in connection with the acquisition of the Smith Maritime Group, we acquired an option to purchase a 50% interest in a joint venture which was exercised in October 2007. The joint venture is consolidated in the accompanying financial statements. The joint venture debt, consisting of a term loan which bears interest at 6.5%, matures on October 1, 2012, and is collateralized by the related tank barge. Borrowings outstanding on this term loan at June 30, 2010 and 2009 were $1.6 million and $2.2 million, respectively.
In May 2006, we entered into a loan agreement ("Loan Agreement") to borrow up to $23.0 million to partially finance construction of two 28,000-barrel and one 100,000-barrel tank barges. The loan bears interest at 30-day LIBOR plus 1.40%, and is repayable in monthly principal payments of $120,958, plus accrued interest, over seven years, with the remaining principal amount of $10.3 million payable at maturity on June 1, 2014. The loan is collateralized by the related tank barges and two other tank vessels. Borrowings outstanding on this loan were $16.0 million and $17.4 million at June 30, 2010 and 2009, respectively. On December 30, 2009, we entered into an amendment ("Loan Agreement Amendment") to the Loan Agreement to amend the Loan Agreement financial covenants to conform to the financial covenants of the Revolving Loan Agreement and incorporate future Revolving Loan Agreement financial covenant amendments.
On April 3, 2006, we entered into an agreement with a lending institution under which we borrowed $80.0 million, for which we pledged six tugboats and six tank barges as collateral. We used the proceeds of these loans to repay indebtedness under our revolving loan agreement. Borrowings are represented by six loans which have been assigned to other lending institutions. These loans bear interest at a rate equal to LIBOR plus 1.40%, and are repayable in 84 monthly installments with the remaining principal payable at maturity. The agreement contains certain prepayment premiums. Borrowings outstanding on these loans totaled $63.1 million and $67.7 million as of June 30, 2010 and 2009, respectively. Also on April 3, 2006, we entered into an agreement with the lending institution to swap the one-month, LIBOR-based, variable interest payments on the $80.0 million of loans for a fixed payment at a rate of 5.2275% plus the applicable margin, over the same terms as the loans. This swap results in a fixed interest rate on the loans of 6.6275% for their seven-year term. The fair value of the swap contract of ($6.7 million) and ($6.4 million) as of June 30, 2010 and 2009, respectively, is included in other liabilities in the consolidated balance sheets.
The interest rate swap contracts referred to above have all been designated as cash flow hedges and, therefore, the unrealized gains and losses resulting from the change in fair value of each of the contracts are being reflected in other comprehensive income in the consolidated statements of operations.
On December 19, 2005, one of our subsidiaries entered into a seven year Canadian dollar (CDN $) term loan to refinance the purchase of an integrated tug-barge unit. The proceeds of US $13.0 million were used to repay borrowings under our revolving loan agreement, which had been used
69
to finance the purchase of the unit. The loan bears interest at a fixed rate of 6.59% and is repayable in 60 monthly installments of CDN $136,328 and 23 monthly installments of CDN $215,991 with the remaining principal amount of CDN $7.7 million payable at maturity on January 1, 2013. This loan is collateralized by the related tug-barge unit and one other tank barge. Borrowings outstanding on this loan totaled US $11.3 million and US $11.0 million as of June 30, 2010 and 2009, respectively.
In June 2005, we entered into an agreement to borrow up to $18.0 million to finance the purchase of an 80,000-barrel double-hull tank barge and construction of two 28,000-barrel double-hull tank barges. The loan bears interest at 30-day LIBOR plus 1.71%, and is repayable in monthly principal installments of $107,143 with the remaining principal amount of $9.0 million payable at maturity on April 30, 2013. The loan is collateralized by the related tank barges. Borrowings outstanding on this loan were $12.7 million and $14.0 million at June 30, 2010 and 2009, respectively.
In March 2005, we entered into an agreement to borrow up to $11.0 million to partially finance construction of a 100,000-barrel tank barge. The loan bears interest at 30-day LIBOR plus 1.05%, and is repayable in monthly principal installments of $65,500 with the remaining principal amount of $5.5 million payable at maturity on December 31, 2012. The loan is collateralized by the related tank barge. Borrowings outstanding on this loan totaled $7.5 million and $8.3 million at June 30, 2010 and 2009, respectively.
Other amendments
On June 29, 2010 we entered into amendments to eliminate the financial covenants in two of our operating lease agreements and one term loan agreement. On August 31, 2010, we obtained consents on five operating leases to incorporate by reference the financial covenants in the Revolver Amendment. We incurred fees of $0.2 million relating to such consents. On August 31, 2010 the Bareboat Charter was terminated in conjunction with the sale of the vessel by the original lessor to a third party ("New Lessor"). We were required to pay the original lessor a termination fee of $0.7 million. We entered into an eight year operating lease with the New Lessor which requires monthly charter payments of $0.1 million.
Restrictive Covenants. The agreements governing our revolving loan and credit agreements, the term loans and the operating lease agreements contain restrictive covenants, some of which were amended as a result of the amendments and consents described above. The restrictive covenants among other things, (a) prohibit any distributions prior to March 31, 2011, (b) limit quarterly cash distributions to our unit holders to $0.45 per unit and requires that we maintain a minimum liquidity of $17.5 million and meet certain financial covenants in order to declare any distributions, (c) prohibit distributions if a default has occurred and is continuing, (d) restrict capital expenditures, permitted acquisitions, investments and sales of assets, and (e) require us to adhere to certain financial covenants, including defined ratios of (i) Asset Coverage of at least 1.50 to 1.00, (ii) Fixed Charge Coverage of at least 0.75 to 1.00 at June 30, 2010; 0.50 to 1.00 through December 31, 2010; 0.60 to 1.00 through June 30, 2011; 0.70 to 1.00 through December 31, 2011; 0.75 to 1.00 through March 31, 2012; and 1.05 to 1.00 through June 30, 2012 and thereafter, (iii) Total Funded Debt to EBITDA may not exceed 6.50 to 1.00 at June 30, 2010; 6.90 to 1.00 through December 31, 2010; 6.75 to 1.00 through March 31, 2011; 6.50 to 1.00 through June 30, 2011; 5.75 to 1.00 through September 30, 2011; 5.20 to 1.00 through December 30, 2011; 4.85 to 1.00 through March 31, 2012; and 4.40 to 1.00 through June 30, 2012 and thereafter (each ratio as defined in the agreements). As of June 30, 2009, we were in compliance with all of our debt covenants. As a result of the August 31, 2010 amendments described above, as of June 30, 2010 we are in compliance with all of our financial and debt covenants. Without these amendments, we would have been in violation of the minimum fixed charge coverage ratio and the total funded debt to EBITDA ratio requirements at June 30, 2010.
70
Issuance of Preferred Units. On September 10, 2010, we issued 15,653,775 Series A Preferred Units to KA First Reserve, LLC in exchange for approximately $85.0 million. In addition, KA First Reserve has agreed to purchase an additional 2,762,431 preferred units for approximately $15.0 million upon clearance of a Hart-Scott-Rodino review. The preferred units are convertible at any time into common units on a one-for-one basis, subject to certain adjustments in the event of certain dilutive issuances of common units. The preferred units have a coupon of 13.5%, with payment-in-kind distributions through the quarter ended June 30, 2012 or, if earlier, when we resume cash distributions on our common units. We have an option to force the conversion of the preferred units after three years if (1) the price of our common units is 150% of the conversion price on average for 20 consecutive days on a volume-weighted basis, and (2) the average daily trading volume of our common units for such 20 day period exceeds 50,000 common units. The preferred units were priced at $5.43 per unit, which represents a 10% premium to the 5-day volume weighted average price of our common units as of August 26, 2010. We used the net proceeds from the sale of the preferred units to KA First Reserve, and will use the net proceeds from the sale of any additional preferred units to KA First Reserve, to reduce outstanding indebtedness and pay fees and expenses related to the transaction.
Issuances of Common Units. In August 2009, we completed a public offering of 3,244,500 common units at a price to the public of $19.15 per unit. The net proceeds of $59.4 million from the offering, after payment of underwriting discounts and commissions but excluding other transaction costs, were used to repay borrowings of approximately $35.0 million under our revolving loan and credit agreements and to make construction progress payments in connection with our vessel newbuilding program.
On August 20, 2008, we completed a public offering of 2,000,000 common units at a price to the public of $25.80 per unit. The net proceeds of $49.8 million from the offering, after payment of underwriting discounts and commissions and payment of expenses, were used to repay borrowings under our revolving loan and credit agreements and to make construction progress payments in connection with our vessel newbuilding program.
On August 14, 2007, we issued 250,000 common units to certain sellers in connection with our acquisition of the Smith Maritime Group. On September 26, 2007, we completed a public offering of 3,500,000 common units at a price to the public of $39.50 per unit. The net proceeds of $131.9 million from the offering, after payment of underwriting discounts and commissions and expenses, were used to repay borrowings under the revolving loan and credit agreements.
Conversion of Subordinated Units. On January 14, 2004, we completed our initial public offering of our common units and, in connection therewith, also issued to our predecessor companies an aggregate of 4,165,000 subordinated units. We met certain financial tests described in our partnership agreement for early conversion of the first 50% of subordinated units and, as a result, 1,041,250 of these subordinated units converted to common units on each of February 14, 2007 and February 14, 2008. The subordination period for the remaining subordinated units ended in February 2009 when we met certain financial tests described in our partnership agreement. At that time all the remaining subordinated units converted into common units on a one-for-one basis. The common units are no longer entitled to arrearages.
71
Contractual Obligations and Contingencies. Our contractual obligations at June 30, 2010 consisted of the following (in thousands):
| |
Total | Less than 1 Year |
2 - 3 Years | 4 - 5 Years | After 5 Years |
|||||||||||
|---|---|---|---|---|---|---|---|---|---|---|---|---|---|---|---|---|
Long-term debt and capital lease obligations |
$ | 382,935 | $ | 19,024 | $ | 252,253 | $ | 28,907 | $ | 82,751 | ||||||
Interest on long-term debt and capital lease obligations(1) |
64,490 | 18,285 | 24,136 | 13,791 | 8,278 | |||||||||||
Operating lease obligations(2) |
92,665 | 11,347 | 22,253 | 19,840 | 39,225 | |||||||||||
Purchase obligations(3) |
5,589 | 5,589 | — | — | — | |||||||||||
|
$ | 545,679 | $ | 54,245 | $ | 298,642 | $ | 62,538 | $ | 130,254 | ||||||
- (1)
- Interest
is only on fixed rate debt, which has a weighted-average interest rate of 7.67%. See Item 7A—Quantitative and Qualitative
Disclosures About Market Risk—for discussion of interest on variable rate debt.
- (2)
- Additionally,
we have a lease agreement with a shipyard for one 50,000-barrel barge with expected delivery in the third quarter of fiscal year
2011. Aggregate rent for the ten year terms of this lease is $17,280.
- (3)
- Capital expenditures relating to shipyard payments for the construction of two 30,000 barrel double hull tank barges and coupling equipment for tugboats.
Certain executive officers of K-Sea General Partner GP LLC have entered into employment agreements with K-Sea Transportation Inc., our indirect wholly owned corporate subsidiary. Each of these employment agreements had an initial term of one year, which is automatically extended for successive one-year terms unless either party gives 30 days written notice prior to the end of the term that such party desires not to renew the employment agreement. These executive officers currently receive aggregate base annual salaries of $740,000. In addition, each employee is eligible to receive an annual bonus award based upon consideration of our partnership performance and individual performance. If the employee's employment is terminated without cause or if the employee resigns for good reason, the employee will be entitled to severance in an amount equal to the greater of (a) the product of 1.3125 (1.75 multiplied by .75) multiplied by the employee's base salary at the time of termination or resignation and (b) the product of 1.75 multiplied by the remaining term of the employee's non-competition provisions multiplied by the employee's base salary at the time of termination or resignation.
The European Union has been working toward a new directive for the insurance industry, called "Solvency 2", with a proposed implementation date of November 1, 2012 and which requires increases in the level of free, or unallocated, reserves required to be maintained by insurance entities, including protection and indemnity clubs that provide coverage for the maritime industry. The West of England Ship Owners Insurance Services Ltd. ("WOE"), a mutual insurance association based in Luxembourg, provides our protection and indemnity insurance coverage and would be impacted by the Solvency 2 directive. In anticipation of the Solvency 2 regulatory requirements, the WOE has assessed its members an additional capital call which it believes will contribute to achievement of the projected required free reserve increases. Our capital call of $1.1 million was paid during calendar 2007. A further request for capital may be made in the future; however, the amount of such further assessment, if any, cannot be reasonably estimated at this time. As a shipowner member of the WOE, we have an interest in the WOE's free reserves, and therefore have recorded the additional $1.1 million capital call as an
72
investment, at cost, subject to periodic review for impairment. This amount is included in other assets in the June 30, 2010 and 2009 consolidated balance sheets.
We are the subject of various claims and lawsuits in the ordinary course of business for monetary relief arising principally from personal injuries, collisions and other casualties. Although the outcome of any individual claim or action cannot be predicted with certainty, we believe that any adverse outcome, individually or in the aggregate, would be substantially mitigated by applicable insurance or indemnification from previous owners of our assets, and would not have a material adverse effect on our financial position, results of operations or cash flows. We are also subject to deductibles with respect to its insurance coverage that range from $10,000 to $250,000 per incident and provide on a current basis for estimated payments thereunder.
Inflation
During the last three years, inflation has had a relatively minor effect on our financial results. Our contracts generally contain escalation clauses whereby certain cost increases, including labor and fuel, can be passed through to our customers.
Related Party Transactions
For information regarding related party transactions, please read "Certain Relationships and Related Transactions" in Item 13 of this report.
Seasonality
We operate our tank vessels in markets that exhibit seasonal variations in demand and, as a result, in charter rates. For example, movements of clean oil products, such as motor fuels, generally increase during the summer driving season. In certain regions, movements of black oil products and distillates, such as heating oil, generally increase during the winter months, while movements of asphalt products generally increase in the spring through fall months. Unseasonably cold winters result in significantly higher demand for heating oil in the northeastern United States. Meanwhile, our operations along the West Coast and in Alaska historically have been subject to seasonal variations in demand that vary from those exhibited in the East Coast and Gulf Coast regions. The summer driving season can increase demand for automobile fuel in all of our markets and, accordingly, the demand for our services. A decline in demand for, and level of consumption of, refined petroleum products could cause demand for tank vessel capacity and charter rates to decline, which would decrease our revenues and cash flows. Our West Coast operations provide seasonal diversification primarily as a result of its services to our Alaskan markets, which experience the greatest demand for petroleum products in the summer months, due to weather conditions. Considering the above, we believe seasonal demand for our services is lowest during our third fiscal quarter. We do not see any significant seasonality in the Hawaiian market.
73
An accounting policy is deemed to be critical if it requires us to make an accounting estimate based on assumptions about matters that are uncertain at the time an accounting estimate is made. An accounting policy is also deemed critical if different accounting estimates that reasonably could be used or changes in the accounting estimates are reasonably likely to occur periodically, which changes could materially change the financial statements. We consider accounting policies related to revenue recognition and related reserve, depreciation and amortization of vessels and equipment, impairment of long lived assets including vessels and equipment and intangible assets, impairment of goodwill, deferred income taxes and loss contingency accruals to be critical accounting policies due to the judgments and estimation processes involved in each.
Revenue Recognition and Related Reserve
We earn revenue under contracts of affreightment, voyage charters, time charters and bareboat charters. Revenue is generally recorded when services are rendered, we have a signed charter agreement or other evidence of an arrangement, pricing is fixed or determinable and collection is reasonably assured. We recognize revenue based on ASC 605, which allocates revenue between reporting periods based on the relative transit time in each reporting period with expenses recognized as incurred.
For contracts of affreightment and voyage charters, revenue is recognized based upon the relative transit time in each period, with expenses recognized as incurred. We are responsible for the voyage expenses, which include fuel and other items such as port charges, pilot fees, tank cleaning costs and canal tolls which are unique to a particular voyage, and the vessel operating expenses, such as wages paid to vessel crews, routine maintenance and repairs, marine insurance, and outside towing. Although contracts of affreightment and certain contracts for voyage charters may be effective for a period in excess of one year, revenue is recognized over the transit time of individual voyages, which are generally less than ten days in duration. For time charters and bareboat charters, revenue is recognized ratably over the contract period, with expenses recognized as incurred. For time charters we are responsible for vessel operating expenses, while the customer is responsible for the voyage expenses. For bareboat charters the customer is responsible for both the vessel operating expenses and voyage expenses. Estimated losses on contracts of affreightment and charters are accrued when such losses become evident and can be estimated.
We extend credit to our customers in the normal course of business. We serve a wide range of customers including major oil companies, oil traders and refiners. We perform a credit review of all customers with significant transactions to determine whether a customer is credit worthy and collection is probable. Prior credit history with us, credit reports, financial statements, and bank references are used to assess creditworthiness. We usually do not require collateral. Estimates of uncollectible amounts are revised each period, and changes are recorded in the period they become known. We provide an estimate for uncollectible accounts based primarily on management's judgment. Management uses historical losses, current economic conditions and individual evaluations of each customer including the age of its unpaid amounts and information about the customer's current financial strength to make adjustments to the allowance for doubtful accounts. We believe our allowances to be based on fair judgment and adequate at the time of their creation. Historically, credit risk with respect to our trade receivables has generally been considered minimal because of the financial strength of our customers. During fiscal 2009 we recorded an increase in the allowance for doubtful accounts of $0.5 million primarily due to changes in facts and circumstances relating to an arbitration proceeding with one customer. Because amounts due from individual customers can be significant, future adjustments to the allowance may be material if one or more individual customer's balances are deemed uncollectible.
74
Depreciation and Amortization of Vessels and Equipment
In assessing the appropriateness of the useful lives and salvage values of our vessels, we consider growth in the fleet and changes in its composition. We review industry data as well as our accumulated data on useful lives, historical utilization levels and the planned future use of our vessels, to assess whether or not our assets are fully operative and economic for their estimated useful lives. We review both historical and current data relating to the price per ton of scrap steel for estimating the salvage values of our vessels.
Vessels and equipment are recorded at cost, which includes contract price, capitalized interest where appropriate, and other direct costs relating to acquiring and placing the vessels in service. Vessels and equipment are depreciated using the straight-line method over the estimated useful lives of the individual assets as follows: double-hulled tank barges and tug boats—ten to thirty years; pier and office equipment—three to five years. For single-hull tank vessels, useful lives are limited to the remaining period of operation prior to mandatory retirement as required by OPA 90. We also consider the impact of customer demand for double-hull vessels and the resulting impact on actual utilization levels for single-hull vessels in assessing the appropriateness of the remaining useful lives of its single-hull tank vessels.
Major renewals and betterments of assets are capitalized and depreciated over the remaining useful lives of the assets. Maintenance and repairs that do not improve or extend the useful lives of the assets are expensed.
Also included in vessels and equipment are drydocking expenditures that are capitalized and amortized over three years based on regulatory drydocking requirements. Drydocking of vessels is required by both the U.S. Coast Guard and by the applicable classification society, which in our case is the American Bureau of Shipping. Such drydocking activities include, but are not limited to, the inspection, refurbishment and replacement of steel, engine components, tail shafts, mooring equipment and other parts of the vessel. We make estimates and judgments relating to the classification of items such as whether an item is a capital improvement, a drydocking expense or a repair and maintenance item. For example, the replacement of steel during a scheduled drydocking may be considered either a drydocking expense or a capital improvement depending on the volume of steel replaced.
Impairment of Long Lived Assets
We periodically review our vessels and equipment and intangible assets for impairment in accordance with Statement of Financial Accounting ASC 360, whenever events or changes in circumstances indicate that the carrying value may not be recoverable. Factors that could indicate impairment include significant underperformance of the asset as compared to historical or projected future operating results, changes in regulations relating to an asset, significant changes in the actual or intended use of the asset, or significant negative industry or economic trends. An indication that a vessel's carrying amount may not be recoverable would require us to estimate the undiscounted future cash flows expected to result from the use of the vessel and its eventual disposition. If the sum of the undiscounted expected future cash flows is less than the carrying amount of the vessel, we would recognize an impairment loss to the extent the carrying value exceeds its fair value as determined by either appraisal or discounted cash flow. In determining whether an asset is impaired we made assumptions regarding estimated future cash flows from the asset which included assumptions relating to the intended use of the asset, asset utilization, estimated average daily rates and other related factors.
The generally weak economy has resulted in lower demand for oil and refined petroleum products in the United States. During the last six months of calendar year 2009, a number of major refining companies announced the shut-down of refineries, which reduces demand for petroleum carrying barges and increases the industry's availability of double-hull vessels, for which customers show a preference
75
over single-hull vessels, thus causing an under utilization of single-hull vessels. We, therefore, determined we would phase out certain of its single-hull vessels prior to their OPA 90 phase out dates. During September 2009, we recorded an impairment charge of $5.9 million on certain single-hull vessels determined based on cash flow forecasts developed using our own data. An additional impairment charge of $1.7 million was recorded during March 2010 relating to four vessels with a net book value of $3.7 million. The impairment charge was based on estimated sales proceeds for such vessels, which were under contracts for sale and which were sold during the fourth quarter of fiscal 2010.
As a result of the continued U.S. economic downturn, contracts not being renewed increasing our dependency on the voyage charter market resulting in reductions to our revenue, operating income, and cash flow forecasts, and a significant sustained decline in our market capitalization, we determined that such factors were indicative of a triggering event requiring an impairment review of all of our long lived assets as of June 30, 2010. As a result of its fair value (primarily based on appraisal) being lower than the carrying amount, an additional impairment charge of $4.2 million was recorded relating to eight tug boats, two single hull vessels, and one small vessel used to support activities in Hawaii. Additionally a $0.9 million impairment charge was recorded based on the sales proceeds for a 30,000- barrel tank barge sold in August 2010 being lower than its construction cost.
While we believe the estimates used are reasonable, if additional triggering events are identified which require another long lived asset impairment analysis and the assumptions used in estimating future cash flows change, we may be required to record additional impairment charges relating to our long lived assets.
Impairment of Goodwill
Goodwill represents the purchase price in excess of the fair value of the net assets acquired and liabilities assumed by us at the date of acquisition. ASC 350 requires that goodwill be tested for impairment at the reporting unit level on an annual basis and more frequently if an event occurs or circumstances change that would more likely than not reduce the fair value of the reporting unit below its carrying value. We test for impairment during the second quarter (as of October 31) of our fiscal year using a two-step process. Step 1 involves comparing the fair value of a reporting unit to its carrying amount. If the fair value of the reporting unit is greater than its carrying amount, there is no impairment. If the reporting unit's carrying amount is greater than the fair value, the second step must be completed to determine the impairment loss, if any. Step 2 calculates the implied fair value of goodwill by deducting the fair value of all tangible and intangible assets, excluding goodwill, of the reporting unit from the fair value of the reporting unit as determined in Step 1. The implied fair value of goodwill determined in this step is compared to the carrying value of goodwill. If the implied fair value of goodwill is less than the carrying value of goodwill, an impairment loss is recognized equal to the difference.
We operate in a single operating segment. We have two reporting units consisting of our Atlantic region and Pacific region operations. All of our goodwill relates to the Pacific region reporting unit. We determine the fair value of the Pacific region reporting unit using an income approach based on the present value of estimated future cash flows. We believe that the income approach is appropriate due to the long term nature of our time charters, consecutive voyage charters, and contracts of affreightment and bareboat charters, which are generally for periods of one year or more and generally contain renewal options. We assess the reasonableness of our approach by consideration of current trading multiples for peer companies. We used our business plans and projections as the basis for expected future cash flows for purposes of the annual impairment test as of October 31, 2009. Inherent in the development of the cash flow projections prepared as of October 31, 2009 were assumptions and estimates derived from a review of operating results for fiscal 2009 and the first quarter of fiscal 2010,
76
approved business plans, expected growth rates (which considered both existing contracts and contracts relating to our newbuild program vessels), cost of capital and tax rates.
As a result of the continued U.S. economic downturn, contracts not being renewed increasing our dependency on the voyage charter market resulting in reductions to our revenue, operating income, and cash flow forecasts, and a significant sustained decline in our market capitalization, we determined that such factors were indicative of a triggering event requiring an interim impairment analysis as of June 30, 2010.
For purposes of the interim impairment test as of June 30, 2010, we used our fiscal year 2011 business plan as the basis for expected future cash flows. Inherent in the development of the updated cash flow projections are assumptions and estimates derived from a review of operating results for fiscal 2010. During the fiscal years ended June 30, 2010 and 2009, approximately 83% and 95% of the Pacific region reporting unit's revenue was derived from long term contracts. As the percentage of revenue associated with long term contracts declines, our revenue is subject to a higher degree of volatility. Vessels operating under single voyage charters, which are generally priced at prevailing market rates, have the potential to generate decreased profit margins during periods of economic downturn and increased profit margins during periods of improved charter rates, while vessels operating on long term time charters generally provide more predictable cash flow. Increased dependence on the voyage charter market could result in a lower utilization of our vessels and decreased profitability. As a result of the increased risk relating to the higher level of volatility associated with more of the Pacific region reporting unit vessels operating in the voyage charter market combined with the unexpected duration of customers failing to commit to long term contracts, our updated fiscal year 2011 business plan and 2012-2014 forecasts reflect a contribution margin approximately 12% lower than previously estimated for the 2011 -2014 contribution margins used in the October 31 assessment. The lower contribution margin is estimated based on assumptions relating to (1) the period of recovery needed for us to obtain new long-term charters, for vessels currently operating in the voyage charter market, at rates at least equivalent to those received under our old long-term charters, (2) utilization rates, (3) the number of vessels to lay up due to estimated low utilization rates and the period to lay up such vessels, and (4) average daily rates and estimated fixed and variable operating costs for each vessel. The decline in the Pacific region reporting unit's revenues and contribution margin for the fiscal year ended June 30, 2010 has reduced both the Pacific region reporting unit's and our cash flows and liquidity.
In addition to the assumptions described above, we also make certain assumptions about future economic conditions including inflation, interest rates and other market data. The following critical assumptions were used in determining the fair value of goodwill as of both June 30, 2010 and October 31, 2009: (1) reduced utilization of certain vessels from their historic utilization levels based on known or anticipated non-renewal of long term contracts, (2) the impact of newbuilds placed into service in fiscal 2010, (3) a projected long term growth of 3% for determining terminal value; (4) a tax rate of 35%, which reflects a market participant rather than our tax rate, and (5) an average discount rate of 13% and 9.5%, respectively, representing our weighted average cost of capital ("WACC") as of June 30, 2010 and October 31, 2009. Factors inherent in determining our WACC included our own and peer company data relating to (1) the value of our limited partner units and peer company common stock; (2) the amounts of debt and equity and the percentages they comprise of total capitalization; and (3) expected interest costs on debt and debt market conditions.
The increase in our WACC from the 9.5% used at October 31, 2009 to 13% used at June 30, 2010 is primarily due to our estimate of the overall level of inherent risk of the reporting unit relating to (1) the potential for increased volatility in Pacific reporting unit revenue due to the decrease in revenue derived from long term contracts, (2) the lack of transparency relating to the duration of the ongoing economic downturn, the period or strength of a recovery and the resultant impact on customer willingness to commit to long term contracts at rates at least equivalent to those received under our old
77
charters, (3) an increase in the cost of both debt financing resulting from the need to renegotiate our revolving loan agreement due to potential violation of financial covenants at June 30, 2010, and (4) an increase in the cost of equity financing relating to the rate of return an outside investor would expect to earn due to the forgoing factors. The above mentioned factors, among other factors, contributed to the sustained reduced unit price. Our market capitalization as of June 30, 2010 was significantly less than our book value indicating an implied impairment.
Assumptions in estimating future cash flows are subject to a high degree of judgment and complexity. We based our fair value estimate on assumptions we believe to be reasonable.
The result of our analysis indicated that goodwill attributable to the Pacific region reporting unit is fully impaired. Accordingly, we recorded an impairment charge of $54.3 million relating to the goodwill associated with our Pacific region reporting unit during the three months and fiscal year ended June 30, 2010.
Deferred Income Taxes
We provide deferred taxes for the tax effects of differences between the financial reporting and tax bases of assets and liabilities at enacted tax rates in effect in the jurisdictions where we operate for the years in which the differences are expected to reverse. In accordance with the applicable standards, we regularly assess our ability to realize our deferred tax assets. Assessments of the realization of deferred tax assets require that management consider all available evidence, both positive and negative, and make significant judgments about many factors, including the amount and likelihood of future income. Based on all the available evidence, we believe the net deferred tax assets of our Canadian and domestic corporate subsidiaries are not currently realizable. In reaching this determination, we evaluated our three year cumulative results as well as the impacts that current economic conditions may have on our future results. As a result we have provided for a valuation allowance on the net deferred tax assets of our Canadian and domestic corporate subsidiaries. It is reasonably possible that we could reduce a portion of our valuation allowance in the near term.
Loss Contingency Accruals
We are required to make accruals of certain loss contingencies related to litigation, arbitration and mediation activities and claims under our personnel indemnity, hull and other insurance policies (collectively, "claims"), contract disputes, etc. We accrue these items in accordance with ASC 450 which requires us to accrue for losses we believe are probable and can be reasonably estimated; however, the estimation of the amount to accrue requires significant judgment. Claim accruals require us to make assumptions about the outcome of each claim based on current information. Adjustments to accruals are required due to changes in facts and circumstances. During fiscal year 2010 we reversed a $0.5 million accrual relating to a contract cancellation due to a settlement agreement with a shipyard, during fiscal 2009 we recorded an accrual of $0.5 million relating to a customer contract cancellation and during fiscal 2008 we recognized $2.1 million in other income relating to the settlement of legal proceedings relating to an incident with one of our tank barges in November 2005.
In February 2008, the FASB issued an interpretive accounting pronouncement that delayed the effective date of the application of an accounting standard relating to fair value measurements to fiscal years beginning after November 15, 2008 for all nonfinancial assets and nonfinancial liabilities that are recognized or disclosed at fair value in the financial statements on a nonrecurring basis. We adopted this standard as it relates to nonrecurring measurements on July 1, 2009. The adoption of this standard on July 1, 2009 resulted in additional fair value measurement disclosures relating to long lived assets in the accompanying consolidated financial statements.
78
In August 2009, the FASB issued changes to fair value accounting for liabilities. These changes clarify existing guidance that in circumstances in which a quoted price in an active market for the identical liability is not available, an entity is required to measure fair value using either a valuation technique that uses a quoted price of either a similar liability or a quoted price of an identical or similar liability when traded as an asset, or another valuation technique that is consistent with the principles of fair value measurements, such as an income approach (e.g., present value technique). This guidance also states that both a quoted price in an active market for the identical liability and a quoted price for the identical liability when traded as an asset in an active market when no adjustments to the quoted price of the asset are required are Level 1 fair value measurements. The adoption of this clarification of existing guidance on October 1, 2009 did not have an effect of the accompanying consolidated financial statements.
In December 2007, the FASB issued a new accounting standard relating to non-controlling interests in consolidated financial statements. This standard established accounting and reporting standards for the non-controlling interest in a subsidiary and for the deconsolidation of a subsidiary. These accounting and reporting standards require for-profit entities that prepare consolidated financial statements to: (a) present non-controlling interests as a component of equity, separate from the parent's equity; (b) separately present the amount of consolidated net income attributable to non-controlling interests in the income statement; (c) consistently account for changes in a parent's ownership interests in a subsidiary in which the parent entity has a controlling financial interest as equity transactions; (d) require an entity to measure at fair value its remaining interest in a subsidiary that is deconsolidated; and (e) require an entity to provide sufficient disclosures that identify and clearly distinguish between interests of the parent and interests of non-controlling owners. On July 1, 2009, we adopted this new standard. Accordingly, for periods presented in these consolidated financial statements, we have reclassified our non-controlling interest liability into partners' capital in the consolidated balance sheets and have separately presented income attributable to non-controlling interests on the consolidated statements of operations. The net income attributable to our unitholders is reported as "Net income (loss) of K- Sea" in the consolidated statements of operations.
In May 2008, the FASB issued a new accounting standard relating to the application of the two-class method for calculating earnings per unit to master limited partnerships. This new accounting standard considers the difference between net income and distributions when calculating earnings per unit. On July 1, 2009, we adopted this new accounting standard, which is required to be applied retrospectively for all periods presented. The difference between the amounts of our net income (loss) allocated to the limited and general partners and the related earnings per unit calculation under the new accounting standard and our previous accounting methodology for the years ended June 30, 2009 and 2008 is a reduction of $4.3 million and $2.9 million, respectively, in the amount of our net income allocated to the limited partners, a decrease of $0.28 and $0.24 in basic net income per limited partner unit and $0.27 and $0.22 in diluted net income per limited partner unit, respectively.
In June 2008, the FASB issued a new accounting standard relating to determining whether instruments granted in share-based payment transactions are considered participating securities under the two-class method of calculating basic and diluted earnings per unit. This new standard affects entities that accrue or pay cash distributions on share-based payment awards during the awards' service period when the cash distributions are not required to be returned if the employees forfeit the unvested award. This new standard requires that all outstanding unvested share-based payment awards that contain rights to non- forfeitable cash distributions participate in undistributed earnings with common unitholders and are considered participating securities. Certain of our share-based awards under our Long-Term Incentive Plan ("LTIP") include rights to non-forfeitable distribution equivalent rights ("DER"). Based on the requirements of this new accounting standard, we included such outstanding unvested awards with DER in the calculation of basic weighted average limited partner units outstanding. Previously, such outstanding unvested awards with DER, if dilutive, were included in
79
the calculation of diluted weighted average limited partner units outstanding. On July 1, 2009, we adopted the provisions of this new accounting standard, which is also required to be applied retrospectively for all periods presented. The adoption of this standard decreased the basic net income per unit previously reported for the years ended June 30, 2009 and 2008 by $0.01 and $0.02, respectively.
In June 2009, the FASB issued "The FASB Codification and the Hierarchy of Generally Accepted Accounting Principles" (the "Codification"), which became effective for financial statements issued for interim and annual periods ending after September 15, 2009. On the effective date the Codification superseded all then existing non-SEC accounting and reporting standards and became the source of authoritative U.S. generally accepted accounting principles. Our adoption of this standard on July 1, 2009 did not have an effect on the accompanying consolidated financial statements.
In December 2009, the FASB issued amendments to an accounting standard to improve financial reporting by enterprises involved with variable interest entities, which is effective for fiscal years and interim periods within those fiscal years for fiscal years beginning after November 15, 2009. These amendments are to replace the quantitative-based risks and rewards calculation for determining which reporting entity, if any, has a controlling financial interest in a variable interest entity with an approach focused on identifying which reporting entity has the power to direct the activities of a variable interest entity that most significantly impact the entity's economic performance and (1) the obligation to absorb losses of the entity or (2) the right to receive benefits from the entity. The amendments also require additional disclosures about a reporting entity's involvement in variable interest entities. We are currently analyzing the impact of these amendments.
In December 2009, the FASB issued an accounting standard update "Fair Value Measurements and Disclosures (Topic 820) Improving Disclosures about Fair Value Measurements" that requires disclosures about (1) the different classes of assets and liabilities measured at fair value, (2) the valuation techniques and inputs used, (3) the activity in Level 3 fair value measurements and (4) the transfers between Levels 1, 2 and 3. Certain disclosures required by the standard update were effective for interim and annual reporting periods beginning after December 15, 2009 and therefore were included in our interim consolidated financial statements upon adoption of this standard effective January 1, 2010. Other disclosures regarding purchases, sales, issuances, and settlements in the roll forward of activity in Level 3 fair value measurements are effective for fiscal years beginning after December 15, 2010, and for interim periods within those fiscal years. We are currently analyzing the impact of the Level 3 amendments.
80
ITEM 7A. QUANTITATIVE AND QUALITATIVE DISCLOSURES ABOUT MARKET RISK.
Our primary market risk is the potential impact of changes in interest rates on our variable rate borrowings. After considering the interest rate swap agreements discussed below, as of June 30, 2010, approximately $300.2 million, of our long-term debt bore interest at fixed interest rates ranging from 5.85% to 9.33%. Borrowings under a portion of our revolving loan agreement and certain other term loans, totaling $82.7 million at June 30, 2010, bore interest at a floating rate based on LIBOR, which subjects us to increases or decreases in interest expense resulting from movements in that rate. Based on our total outstanding floating rate debt as of June 30, 2010, the impact of a 1% change in interest rates would result in a change in interest expense, and a corresponding impact on income before income taxes, of approximately $0.8 million annually.
As of June 30, 2010, we had seven outstanding interest rate swap agreements, three relating to the revolving loan agreement that expire in December 2010 and four relating to our term loans that expire during the period from May 2012 to August 2018, concurrently with the hedged term loans. As of June 30, 2010, we were paying a weighted average fixed rate of 7.98% (including applicable margins), and we were receiving a weighted average variable rate of 3.65%. The primary objective of these contracts is to reduce the aggregate risk of higher interest costs associated with variable rate debt. Our interest rate swap contracts have been designated as cash flow hedges and, accordingly, gains and losses resulting from changes in the fair value of these contracts are recognized as other comprehensive income as required by the FASB Codification standards relating to hedging. We are exposed to credit related losses in the event of non-performance by counterparties to these instruments; however, the counterparties are major financial institutions and we consider such risk of loss to be minimal. We do not hold or issue derivative financial instruments for trading purposes.
ITEM 8. FINANCIAL STATEMENTS AND SUPPLEMENTARY DATA.
The financial statements set forth on pages F-1 to F-52 of this report are incorporated herein by reference.
ITEM 9. CHANGES IN AND DISAGREEMENTS WITH ACCOUNTANTS ON ACCOUNTING AND FINANCIAL DISCLOSURE.
None.
ITEM 9A. CONTROLS AND PROCEDURES.
Evaluation of Disclosure Controls and Procedures
In accordance with Exchange Act Rules 13a-15 and 15d-15, we carried out an evaluation, under the supervision and with the participation of management, including our Chief Executive Officer and Chief Financial Officer, of the effectiveness of our disclosure controls and procedures as of the end of the period covered by this report. Based on that evaluation, our Chief Executive Officer and Chief Financial Officer concluded that our disclosure controls and procedures were effective as of June 30, 2010.
Changes in Internal Control Over Financial Reporting
There has been no change in our internal control over financial reporting that occurred during the three months ended June 30, 2010 that has materially affected, or is reasonably likely to materially affect, our internal control over financial reporting.
Management's Report on Internal Control Over Financial Reporting
See page F-2 of this report for Management's Report on Internal Control Over Financial Reporting.
None.
81
ITEM 10. DIRECTORS, EXECUTIVE OFFICERS AND CORPORATE GOVERNANCE.
K-Sea General Partner GP LLC, as the general partner of K-Sea General Partner L.P., our general partner, manages our operations and activities. Our general partner is not elected by our unitholders and is not subject to re-election on a regular basis. Unitholders are not entitled to elect the directors of K-Sea General Partner GP LLC or directly or indirectly participate in our management or operation.
Set forth below is information concerning the directors and executive officers of K-Sea General Partner GP LLC as of September 1, 2010. Executive officers and directors are elected for one-year terms.
Name
|
Age | Position with K-Sea General Partner GP LLC | ||
|---|---|---|---|---|
| James J. Dowling | 64 | Chairman of the Board | ||
| Timothy J. Casey | 49 | President, Chief Executive Officer and Director | ||
| Anthony S. Abbate | 70 | Director | ||
| Barry J. Alperin | 70 | Director | ||
| James C. Baker | 37 | Director | ||
| Brian P. Friedman | 54 | Director | ||
| Kevin S. McCarthy | 51 | Director | ||
| Gary D. Reaves II | 30 | Director | ||
| Frank Salerno | 51 | Director | ||
| Terrence P. Gill | 42 | Chief Financial Officer | ||
| Thomas M. Sullivan | 51 | Chief Operating Officer and President—Atlantic Region | ||
| Richard P. Falcinelli | 49 | Executive Vice President and Secretary | ||
| Gregory J. Haslinsky | 47 | Senior Vice President, Business Development and Marketing | ||
| Gordon Smith | 41 | President—Pacific Region |
James J. Dowling has served as our Chairman of the Board since July 2003, has served as Chairman of the Board of EW Transportation LLC (formerly K-Sea Transportation LLC) since January 2002 and has served as a director of EW Transportation LLC since its formation in April 1999. Mr. Dowling has been a Managing Director of Jefferies Capital Partners, a private investment firm, since January 2002, and is a director of various private companies in which Jefferies Capital Partners has an interest. Jefferies Capital Partners is the manager of Furman Selz Investors II L.P. and its affiliated entities, principal owners of our general partner.
Timothy J. Casey has served as our President, Chief Executive Officer and Director since July 2003. Mr. Casey has served as President, Chief Executive Officer and Director of EW Transportation LLC since April 1999. Mr. Casey is also Chairman of the Board of Directors of American Waterways Operators, a board member of The Seamen's Church Institute and a member of the American Bureau of Shipping.
Anthony S. Abbate has served as a Director since February 2004. Mr. Abbate was President, Chief Executive Officer and a director of Interchange Financial Services Corporation, a bank holding company, since 1984 until his retirement in 2007 and President, Chief Executive Officer and a director of its principal subsidiary, Interchange Bank, from 1981 until his retirement in 2007. In April 2007, Mr. Abbate joined the Board of Directors of Sussex Bancorp, a bank holding company.
James C. Baker became a Director on September 10, 2010 pursuant to the terms of the Director Designation Agreement executed in connection with the Series A Preferred Unit investment by KA First Reserve, LLC. Mr. Baker is a Senior Managing Director of Kayne Anderson Capital Advisors, which he joined in 2004 and is an Executive Vice President of Kayne Anderson MLP Investment Company, Kayne Anderson Energy Total Return Fund, Inc. and Kayne Anderson Energy Development
82
Company, which are each NYSE listed closed-end investment companies. Mr. Baker also serves on the board of directors of ProPetro Services, Inc. and Petris Technology, Inc.
Barry J. Alperin has served as a Director since February 2004. Mr. Alperin is a business consultant who retired from Hasbro Inc. in 1996 after 11 years in various senior executive positions, including Vice Chairman and Director. Mr. Alperin is currently on the board of Henry Schein, Inc., a distributor of healthcare products to office-based practitioners, and The Hain Celestial Group, Inc., a natural and organic beverage, snack, specialty food and personal care products company.
Brian P. Friedman has served as a director since July 2003. Since 1997, Mr. Friedman has been President of Jefferies Capital Partners, a private equity investment firm. Mr. Friedman also serves as Chairman of the Executive Committee of Jefferies & Company, Inc., a global securities and investment banking firm, and as a director of Jefferies Group, Inc. As a result of his management of various private equity funds and the significant equity positions those funds hold in their portfolio companies, Mr. Friedman serves on several boards of directors of private portfolio companies. Mr. Friedman also serves on the board of directors of Carrols Restaurant Group, Inc.
Kevin S. McCarthy became a Director on September 10, 2010 pursuant to the terms of the Director Designation Agreement executed in connection with the Series A Preferred Unit investment by KA First Reserve, LLC. Mr. McCarthy is Chairman, Chief Executive Officer and President of Kayne Anderson MLP Investment Company, Kayne Anderson Energy Total Return Fund, Inc. and Kayne Anderson Energy Development Company, which are each NYSE listed closed-end investment companies. Mr. McCarthy is a Senior Managing Director of Kayne Anderson Capital Advisors which he joined in 2004. Mr. McCarthy also serves on the board of directors of Range Resources Corporation, Clearwater Natural Resources, L.P., ProPetro Services, Inc. and Direct Fuel Partners, L.P.
Gary D. Reaves II became a Director on September 10, 2010 pursuant to the terms of the Director Designation Agreement executed in connection with the Series A Preferred Unit investment by KA First Reserve, LLC. Mr. Reaves is a Vice President of First Reserve Corporation, which he joined in 2006. First Reserve is one of the world's leading private equity firms in the energy industry, making both private equity and infrastructure investments throughout the energy value chain, with approximately $19 billion under management. His responsibilities range from deal origination and structuring to due diligence, execution and monitoring, with particular focus on the midstream and equipment, manufacturing and services sectors. Prior to joining First Reserve, Mr. Reaves was employed by UBS Investment Bank in the Global Energy Group.
Frank Salerno has served as a Director since February 2004. Mr. Salerno has served as a director for WisdomTree Investments, Inc. (formerly known as Index Development Partners) since July 2005 and chair of its audit and compensation committees and as a director for Crystal International Travel Group since April 2006. From mid-1999 until his retirement in February 2004, Mr. Salerno was Managing Director and Chief Operating Officer of Merrill Lynch Investment Advisors—Americas Institutional Division, an investment advisory company.
Terrence P. Gill has served as our Chief Financial Officer since November 2008, and served as our Corporate Controller from July 2003 to November 2008. Mr. Gill has served as Chief Finance Officer of EW Transportation LLC since November 2008, and served as Controller of EW Transportation LLC from May 2000 to November 2008. From November 1996 to May 2000, Mr. Gill was employed by Pricewaterhouse Coopers LLP, most recently as an audit manager. Mr. Gill is a certified public accountant.
Thomas M. Sullivan has served as Chief Operating Officer and President—Atlantic Region since April 2008. Mr. Sullivan served as Vice President of Operations from July 2003 to April 2008. Mr. Sullivan served as Vice President of Operations for EW Transportation LLC since April 1999.
83
Mr. Sullivan also served as Vessel Supervisor for EW Transportation LLC's predecessor from March 1995 until April 1999.
Richard P. Falcinelli has served as Executive Vice President and Secretary since April 2008. Mr. Falcinelli served as Vice President of Administration and Secretary from July 2003 to April 2008. Mr. Falcinelli has served as Vice President of Administration and Secretary of EW Transportation LLC since April 1999.
Gregory J. Haslinsky has served as our Senior Vice President, Business Development and Marketing since January 2009. Mr. Haslinsky served as Vice President, Sales and Marketing from October 2005 to January 2009 and has been employed by K-Sea Transportation since December 1999 in various sales capacities. Mr. Haslinsky was employed from November 1988 to November 1999 by Maritrans, a marine transportation company, holding various sales and marketing positions within the organization.
Gordon Smith has served as our President—Pacific Region since April 2008. From August 2007 to April 2008, Mr. Smith served as Vice Chairman. Mr. Smith was President of Smith Maritime, Ltd. from 1992 and Vice President of Sirius Maritime LLC from 2002 until our acquisition of those companies in August 2007.
Meetings and Committees of the Board of Directors
Meetings
K-Sea General Partner GP LLC's board of directors held five meetings during fiscal 2010. During fiscal 2010, each director attended at least 75% of the aggregate of (1) the total number of meetings of the board of directors of K-Sea General Partner GP LLC and (2) the total number of meetings held by all committees of such board on which he served.
Audit Committee
K-Sea General Partner GP LLC has a standing audit committee consisting of Messrs. Abbate, Alperin (Chairman) and Salerno. The board of directors of K-Sea General Partner GP LLC has determined that all members of the audit committee are independent within the meaning of the listing standards of the New York Stock Exchange and the applicable rules of the Securities and Exchange Commission. In addition, the board of directors of K-Sea General Partner GP LLC has determined that Mr. Abbate is an audit committee financial expert within the meaning of the rules of the Securities and Exchange Commission.
The primary responsibilities of the audit committee are to assist the board of directors of K-Sea General Partner GP LLC in overseeing (1) the integrity of our financial statements, (2) our independent registered public accounting firm's qualifications, independence, and performance, (3) the effectiveness of our internal controls and procedures and our internal audit function, and (4) our compliance with legal and regulatory requirements. The audit committee has the sole authority to appoint, retain and terminate our independent registered public accounting firm, which reports directly to the audit committee.
The audit committee has established procedures for the receipt, retention and treatment of complaints we receive regarding accounting, internal accounting controls or auditing matters and the confidential, anonymous submission by our employees of concerns regarding questionable accounting or auditing matters.
Compensation Committee
K-Sea General Partner GP LLC has a standing compensation committee consisting of Messrs. Alperin, Dowling (Chairman) and Friedman. The compensation committee, among other tasks,
84
determines and approves the chief executive officer's compensation, makes recommendations to the board with respect to other executive officer compensation, and reviews from time to time the compensation and benefits of non-employee directors.
Conflicts Committee
K-Sea General Partner GP LLC has a standing conflicts committee consisting of Messrs. Abbate, Alperin and Salerno. The conflicts committee reviews specific matters that the board of directors of K-Sea General Partner GP LLC believes may involve conflicts of interest and takes such other action as may be required under the terms of our partnership agreement.
Finance Committee
K-Sea General Partner GP LLC has a standing finance committee consisting of Messrs. Dowling and Casey. The finance committee is authorized to review and approve derivative transactions (including interest rate swaps) with respect to up to 50% of our total outstanding indebtedness.
Director Independence
For information on director independence, please read "Item 13. Certain Relationships and Related Transactions, and Director Independence."
Policies and Procedures for Approval of Related Person Transactions
The Board of Directors of K-Sea General Partner GP LLC has adopted a policy pursuant to which related party transactions are reviewed, approved or ratified. The policy applies to any transaction in which (1) we are a participant, (2) any related person has a direct or indirect material interest and (3) the amount involved exceeds $120,000, but excludes any transaction that does not require disclosure under Item 404(a) of Regulation S-K. The Conflicts Committee is responsible for reviewing, approving and ratifying any related person transaction, except those related to compensation which is the responsibility of the compensation committee.
Code of Business Conduct and Ethics
The board of directors of K-Sea General Partner GP LLC has adopted a code of business conduct and ethics for all employees, officers and directors. If any amendments are made to the code or if K-Sea General Partner GP LLC grants any waiver, including any implicit waiver, from a provision of the code that the SEC or the New York Stock Exchange ("NYSE") requires us to disclose, we will disclose the nature of such amendment or waiver on our website or in a current report on Form 8-K.
Corporate Governance Guidelines
The board of directors of K-Sea General Partner GP LLC has adopted corporate governance guidelines in accordance with the rules of the New York Stock Exchange.
Availability of Corporate Governance Documents
Copies of the board committee charters, code of business conduct and ethics and corporate governance guidelines are available, without charge, on our website at www.k-sea.com and in print, free of charge, upon written request to the Secretary, K-Sea General Partner GP LLC, One Tower Center Blvd., 17th Floor, East Brunswick, New Jersey 08816.
Executive Sessions of the Board of Directors
Messrs. Abbate, Alperin, Dowling, Friedman and Salerno, who are non-management directors of K-Sea General Partner GP LLC, meet at regularly scheduled executive sessions without management. These meetings are chaired on a rotating basis by the chairmen of the audit committee and compensation committee. Persons wishing to communicate with our non-management directors may do so by writing to them at K-Sea General Partner GP LLC, c/o Board of Directors, One Tower Center Blvd., 17th Floor, East Brunswick, New Jersey 08816.
85
Messrs. Abbate, Alperin, and Salerno, who are independent non-management directors of K-Sea General Partner GP LLC, meet at least annually in executive sessions without management and the other directors. Mr. Abbate serves as the presiding director at those executive sessions.
Communications with Independent Directors
Persons wishing to communicate with our independent non-management directors may do so by writing to them at K-Sea General Partner GP LLC, c/o Board of Directors, One Tower Center Blvd., 17th Floor, East Brunswick, New Jersey 08816.
Payments to Our General Partner
K-Sea General Partner LP does not receive any management fee or other compensation in connection with its management of us; however, K-Sea General Partner LP or its affiliates who perform services for us and/or our subsidiaries are reimbursed at cost for all expenses incurred on our behalf which are necessary or appropriate to the conduct of our business. Reimbursed expenses were $1,382, $20,290 and $1,143 in fiscal 2010, fiscal 2009 and fiscal 2008, respectively. We also directly pay the fees of the independent directors of K-Sea General Partner GP LLC and reimburse meeting-related expenses of all directors of K-Sea General Partner GP LLC.
Section 16(a) Beneficial Ownership Reporting Compliance
Section 16(a) of the Securities Exchange Act of 1934 requires our officers and directors, and persons who own more than 10% of a registered class of our equity securities, to file reports of beneficial ownership and changes in beneficial ownership with the SEC. Officers, directors and greater than 10% unitholders are required by SEC regulations to furnish us with copies of all Section 16(a) forms.
Based solely on our review of the copies of such forms we received, or representations from certain reporting persons that no Form 4s were required for those persons, we believe that during the fiscal year ended June 30, 2010, all of our officers, directors, and greater than 10% beneficial owners complied on a timely basis with all applicable filing requirements under Section 16(a) of the Securities Exchange Act of 1934, except for the failure by each of K-Sea General Partner LP, EW Transportation LLC and K-Sea General Partner GP LLC to file one Form 4 and the failure by each of Brian P. Friedman and Park Avenue Transportation Inc. to file two Form 4s.
ITEM 11. EXECUTIVE COMPENSATION.
Compensation Discussion and Analysis
This Compensation Discussion and Analysis is intended to provide investors with an understanding of our compensation policies and decisions regarding our named executive officers for fiscal 2010. Our named executive officers are our Chief Executive Officer, our Chief Financial Officer and our three other most highly compensated executive officers for fiscal 2010.
Executive Compensation Philosophy
In establishing executive compensation, we believe that:
- •
- base salaries should reflect the basic duties and responsibilities of the executive and be reasonably competitive with
comparator group companies;
- •
- annual cash bonuses should reflect our annual results, performance against budget, progress toward our short and long-term strategic and operating goals, and individual performance and contribution; and
86
- •
- equity awards encourage significant executive equity ownership to further align executive interests to our unitholders.
Purpose of Our Executive Compensation Program
The purpose of our executive compensation program is to assist us in achieving our business objectives by developing and retaining talented senior executives with a competitive compensation package, and to motivate them to achieve our strategic goals. Historically, our primary business objective has been to increase our distributable cash flow per unit, which serves as a basis for our distribution payments to unitholders. From our inception in 2003 through the third quarter of 2009, one of our primary strategies for increasing distributable cash flow per unit was the expansion of our fleet through newbuilding and accretive and strategic acquisitions. From our initial public offering in January 2004 through September 30, 2009, we grew our fleet barrel-carrying capacity from 2.3 million barrels to 4.2 million barrels. In response to the prolonged recession in the United States and the anemic recovery currently underway, changes in customer preferences away from long-term contracts, an oversupply of tank barges, and volatility in the commodity and capital markets, we have adjusted our business strategy to focus on maximizing our liquidity, improving our balance sheet through debt reduction and other methods, maintaining a stable asset base, improving the profitability of our assets by increasing their utilization while controlling costs and reducing our capital expenditures. During fiscal 2011, the key elements of our strategy will include the following:
- •
- improving profitability
- •
- continuing to improve our balance sheet and financial flexibility;
- •
- maximizing fleet utilization and improving productivity;
- •
- maintaining safe, low-cost and efficient operations;
- •
- balancing our fleet deployment between longer-term contracts and shorter-term business in an
effort to provide stable cash flows through business cycles, while preserving flexibility to respond to changing market conditions; and
- •
- attracting and maintaining customers by adhering to high standards of performance, reliability and safety.
For additional information regarding our business strategies, please see "Items 1 and 2. Business and Properties—Our Partnership."
Role of the Compensation Committee
Responsibilities and Authority
The Compensation Committee of K-Sea General Partner GP LLC has overall responsibility for determining the compensation of our named executive officers. The specific duties and responsibilities of the Compensation Committee are described above under "Item 10. Directors, Executive Officers and Corporate Governance—Meetings and Committees of the Board of Directors—Compensation Committee" and in the charter of the Compensation Committee, which is available on the "Investor Relations—Governance" section of our website at www.k-sea.com.
The compensation payable to all of our named executive officers is reviewed and approved by the Compensation Committee. The Compensation Committee seeks input from Timothy J. Casey, our President and Chief Executive Officer, regarding the amount of compensation payable to, and the individual performance of, our named executive officers (other than Mr. Casey). Our Compensation Committee has not met to determine the timing or amount, if any, of bonuses or other incentive compensation for fiscal 2010. For the past several months, we have focused on maximizing our liquidity,
87
improving our balance sheet through debt reduction and other methods, maintaining a stable asset base, improving the profitability of our assets by increasing their utilization while controlling costs and reducing our capital expenditures.
Independent Compensation Consultant
We have not used an independent compensation consultant since fiscal 2007, when we retained Pearl Meyer and Partners ("PMP"). The basis of our compensation structure for the past several years was established during an evaluation of the partnership's compensation methodology by the Compensation Committee and PMP in fiscal 2007.
Timing of Decisions
The Compensation Committee typically meets after the end of each fiscal year to review base salaries for the then-current year, to consider incentive compensation (consisting of cash bonuses and equity-based awards) and to review and, as appropriate, make changes to our executive compensation program. The Compensation Committee also meets at other times during the year and acts by written consent when necessary and appropriate. During fiscal 2010, the Compensation Committee met once in September 2009 to evaluate whether to change base salaries or award bonuses or other incentive compensation with respect to performance in fiscal 2009. During fiscal 2010, the Chairman of the Compensation Committee also met with members of our management team on several occasions to discuss our executive compensation policies and programs.
We do not time the release of material non-public information for the purpose of affecting the values of executive compensation. At the time of making equity-based compensation decisions, the Compensation Committee may be aware of material non-public information and takes such information into account, but it does not adjust the size of grants to reflect possible market reaction. The Compensation Committee considers grants of equity-based compensation on an annual basis shortly after the end of each fiscal year, although specific grants may be made at other times to recognize the promotion of an employee, a change in responsibility or a specific achievement.
Elements of Compensation
Our executive compensation program includes three main elements: a base salary, an annual cash bonus and an annual equity-based incentive award. These individual components are designed to:
- •
- through a market-competitive base salary that is consistent with the executive's position and level of responsibility,
provide a minimum level of compensation to each individual;
- •
- through an annual cash bonus, reward individuals who contribute to the financial and operational success of our
partnership; and
- •
- through equity-based incentive awards, reward individuals who contribute to the financial and operational success of our partnership and, at the same time, further align the executives' interests with the long-term interests of our unitholders.
We view the various components of compensation as related, but distinct, and emphasize "pay for performance." A significant portion of total executive compensation reflects a risk aspect and is tied to our financial and strategic goals. Our compensation philosophy is to foster entrepreneurship at all levels of the organization by making long-term equity-based incentives, a significant component of executive compensation. We determine the appropriate level for each compensation component based in part, but not exclusively, on our view of internal equity and consistency, and other considerations we deem relevant, such as rewarding extraordinary performance. The Compensation Committee has not yet adopted any policies for allocating compensation between long-term and currently paid out
88
compensation, between cash and non-cash compensation, or among different forms of non-cash compensation.
As described in more detail below, our executive compensation program is designed to reward partnership and individual performance.
- •
- Partnership Performance: Partnership performance is
measured by various metrics, such as EBITDA (earnings before interest, taxes, depreciation and amortization), distributable cash flow on an aggregate and per unit basis, vessel utilization and average
daily rates, other vessel operating measures, and financing and compliance objectives. The Compensation Committee also considers other achievements during the year when evaluating our performance.
- •
- Individual Performance: Individual performance is evaluated based on individual expertise, leadership, ethics and personal performance against goals and objectives.
Employment Agreements
Timothy J. Casey, Thomas M. Sullivan, and Richard P. Falcinelli have entered into employment agreements with K-Sea Transportation Inc., one of our indirect wholly owned subsidiaries. The employment agreements contemplate that each employee will serve as an officer of the general partner of our general partner and other affiliates. Each of the employment agreements had an initial term of one year. The term of each employment agreement is automatically extended for successive one-year terms unless either party gives 30-days written notice prior to the end of the term that such party desires not to renew the employment agreement.
Each employment agreement established an annual base salary for the named executive officer, which has been subsequently increased by the Compensation Committee. Under the employment agreement, each employee is eligible to receive an annual incentive bonus based upon the financial performance of us and our subsidiaries. The board of directors of K-Sea General Partner GP LLC will determine the amount of any incentive bonus award and may issue additional awards to each employee in the amounts and at the times it so determines. Further, Messrs. Casey, Sullivan and Falcinelli are each furnished an automobile for business use and reimbursed for reasonable costs of insurance, gasoline and repairs for the automobile in accordance with our reimbursement policies.
Each employment agreement also provides for certain payments upon termination of employment. For more information, please read below "Executive Compensation Tables—Potential Payments upon Termination or Change in Control." The Compensation Committee is currently evaluating potential revisions to the employment agreements.
Base Salary, Annual Cash Bonus and Equity-Based Incentive Awards
Our Compensation Committee has not met to determine whether any change in base salaries is necessary or whether an annual cash bonus or equity-based incentive award is appropriate with respect to our performance in fiscal 2010.
When our Compensation Committee last met in September 2009, it did not change the base salaries of our named executive officers, nor did it award any annual cash bonuses or equity-based compensation to named executive officers.
Perquisites and Other Benefits
Messrs. Casey, Sullivan, Falcinelli and Haslinsky are furnished an automobile for business use and reimbursed for reasonable costs of insurance, gasoline and repairs for the automobile in accordance with our reimbursement policies. Messrs. Gill and Smith are each provided an annual car allowance of $8,000.
89
We seek to provide benefit plans, such as medical, life and disability insurance, in line with market conditions. Executive officers are eligible for the same benefit plans provided to other exempt employees, including insurance plans and supplemental plans chosen and paid for by employees who wish additional coverage. We do not have any special insurance plans for executive officers.
Other Compensation Related Matters
Equity Ownership
Although we encourage our executive officers to retain ownership in our partnership, we do not have a policy requiring maintenance of a specified equity ownership level. In the aggregate, as of June 30, 2010, our named executive officers beneficially owned an aggregate of 71,005 common units and 32,300 phantom units. Additionally, our named executive officers receive an aggregate of approximately 8.39% of any cash distributions that may be received by our general partner and its affiliates through their ownership interest in these entities. These arrangements further tie the interests of these executive officers to the interests of unitholders.
Our policies prohibit our executive officers from using puts, calls or options to hedge the economic risk of their ownership.
Recovery of Prior Awards
We do not have a policy with respect to adjustment or recovery of awards or payments if relevant performance measures upon which previous awards were based are restated or otherwise adjusted in a manner that would reduce the size of such award or payment.
Impact of Tax and Accounting Treatment
Accounting Treatment
Effective July 1, 2005, we adopted FAS 123R, which requires that companies recognize in their financial statements the cost of employee services received in exchange for awards of equity instruments based on the grant date fair value of those awards.
Tax Treatment
Section 162(m) of the Code generally disallows a tax deduction to publicly traded corporations for compensation in excess of $1 million paid to the Chief Executive Officer or any of the four other most highly compensated officers. Because we are organized as a limited partnership, we are not subject to the provisions of Section 162(m) of the Code.
Section 409A of the Code imposes new constraints on nonqualified deferred compensation, and some awards under our long-term incentive plan and severance benefits under employment agreements with our officers may be subject to these new rules. Failure to comply with Section 409A may result in the early taxation of deferred compensation and the imposition of a 20% penalty. We intend to design our compensation arrangements to be either exempt from Section 409A or to comply with Section 409A, and we amended certain arrangements in calendar year 2008 to bring them into compliance with the regulations under Section 409A.
90
The Compensation Committee has reviewed and discussed with management the compensation discussion and analysis required by Item 402(b) of Regulation S-K. Based on the review and discussion referred to above, the Compensation Committee recommended to the board of directors that this compensation discussion and analysis be included in this Form 10-K.
| Compensation Committee: | ||
James J. Dowling (Chairman) Barry J. Alperin Brian P. Friedman |
COMPENSATION COMMITTEE INTERLOCKS AND INSIDER PARTICIPATION
None of our executive officers serves as a member of the board of directors or compensation committee of any entity that has one or more of its executive officers serving as a member of our general partner's board of directors or compensation committee.
There are no matters relating to interlocks or insider participation that we are required to report.
Name and Principal Position |
Fiscal Year |
Salary ($) |
Bonus ($) |
Stock Awards ($)(1) |
Option Awards ($) |
Non-Equity Incentive Plan Compensation ($) |
Change in Pension Value and Nonqualified Deferred Compensation Earnings ($) |
All Other Compensation ($)(2) |
Total ($) | ||||||||||||||||||||
|---|---|---|---|---|---|---|---|---|---|---|---|---|---|---|---|---|---|---|---|---|---|---|---|---|---|---|---|---|---|
Timothy J. Casey |
2010 | $ | 300,000 | $ | 0 | $ | 239,541 | $ | — | $ | — | $ | — | $ | 20,653 | $ | 560,194 | ||||||||||||
President and Chief |
2009 | $ | 300,000 | $ | 0 | $ | 297,637 | $ | — | $ | — | $ | — | $ | 19,905 | $ | 617,542 | ||||||||||||
Executive Officer |
2008 | $ | 300,000 | $ | 240,000 | $ | 251,174 | $ | — | $ | — | $ | — | $ | 25,862 | $ | 817,036 | ||||||||||||
|
— | ||||||||||||||||||||||||||||
Terrence P. Gill |
2010 |
$ |
190,000 |
$ |
0 |
$ |
26,771 |
$ |
— |
$ |
— |
$ |
— |
$ |
21,053 |
$ |
237,824 |
||||||||||||
Chief Financial |
2009 | $ | 168,750 | $ | 0 | $ | 28,940 | $ | — | $ | — | $ | — | $ | 12,256 | $ | 209,946 | ||||||||||||
Officer |
|||||||||||||||||||||||||||||
Thomas M. Sullivan |
2010 |
$ |
220,000 |
$ |
0 |
$ |
78,724 |
$ |
— |
$ |
— |
$ |
— |
$ |
19,564 |
$ |
318,288 |
||||||||||||
Chief Operating |
2009 | $ | 219,580 | $ | 0 | $ | 97,880 | $ | — | $ | — | $ | — | $ | 20,330 | $ | 337,790 | ||||||||||||
Officer—President— |
2008 | $ | 210,000 | $ | 84,000 | $ | 82,089 | $ | — | $ | — | $ | — | $ | 20,510 | $ | 396,599 | ||||||||||||
Atlantic Region |
|||||||||||||||||||||||||||||
Richard P. Falcinelli |
2010 |
$ |
220,000 |
$ |
0 |
$ |
78,724 |
$ |
— |
$ |
— |
$ |
— |
$ |
21,484 |
$ |
320,208 |
||||||||||||
Executive Vice |
2009 | $ | 219,580 | $ | 0 | $ | 97,880 | $ | — | $ | — | $ | — | $ | 22,635 | $ | 340,095 | ||||||||||||
President and |
2008 | $ | 210,000 | $ | 84,000 | $ | 82,089 | $ | — | $ | — | $ | — | $ | 21,468 | $ | 397,557 | ||||||||||||
Secretary |
|||||||||||||||||||||||||||||
Gregory J. Haslinsky |
2010 |
$ |
220,000 |
$ |
0 |
$ |
74,818 |
$ |
— |
$ |
— |
$ |
— |
$ |
19,679 |
$ |
314,497 |
||||||||||||
Senior Vice President, |
2009 | $ | 219,538 | $ | 0 | $ | 82,255 | $ | — | $ | — | $ | — | $ | 18,227 | $ | 320,020 | ||||||||||||
Business |
2008 | $ | 200,000 | $ | 84,000 | $ | 66,464 | $ | 18,983 | $ | 369,447 | ||||||||||||||||||
Development and Marketing |
|||||||||||||||||||||||||||||
- (1)
- This
amount reflects the compensation cost recognized by us during each of the fiscal years shown under FAS 123R for grants made in such year.
Pursuant to SEC rules, the amounts shown exclude the impact of estimated forfeitures related to service-based vesting conditions. These amounts reflect our recognized compensation expense for these
awards under FAS 123R, and do not correspond to the actual value that will be recognized by the named executive officers.
- (2)
- Represents contributions to our 401(k) Savings Plan during each of the fiscal years shown and the value of personal use of an automobile.
91
Grants of Plan-Based Awards Table
There were no awards of phantom units granted in fiscal 2010 for our named executive officers.
Outstanding Equity Awards at Fiscal Year-End
The following table sets forth information concerning the outstanding equity awards made for each named executive officer as of June 30, 2010.
| |
Stock Awards(1) | ||||||||||||
|---|---|---|---|---|---|---|---|---|---|---|---|---|---|
Name
|
Number of Shares or Units of Stock That Have Not Vested (#)(3) |
Market Value of Shares or Units of Stock That Have Not Vested ($)(2)(3) |
Equity Incentive Plan Awards: Number of Unearned Shares, Units or Other Rights That Have Not Vested (#) |
Equity Incentive Plan Awards: Market or Payout Value of Unearned Shares, Units or Other Rights That Have Not Vested ($) |
|||||||||
Timothy J. Casey |
14,960 | $ | 73,603 | — | — | ||||||||
Terrence P. Gill |
2,400 | $ | 11,808 | — | — | ||||||||
Thomas M. Sullivan |
4,980 | $ | 24,502 | — | — | ||||||||
Richard P. Falcinelli |
4,980 | $ | 24,502 | — | — | ||||||||
Gregory J. Haslinsky |
4,980 | $ | 24,502 | — | — | ||||||||
- (1)
- Represents
phantom unit awards that vest in five annual installments. All phantom unit awards are subject to accelerated vesting on a change in control or
the termination of the employee's employment due to death, disability or retirement and to such other terms as are set forth in the award agreement. Holders of phantom units have the right to receive
an amount in cash equal to, and payable at the same time as, the cash distribution made with respect to a common unit during the period the phantom unit is outstanding.
- (2)
- Calculated
by multiplying the number of common units as of June 30, 2010 by $4.92 which was the closing price of our common units on the NYSE on
June 30, 2010. The following tables sets forth information relating to outstanding equity awards granted to each named executive and the units expected future vesting.
- (3)
- The following tables set forth information concerning the phantom unit awards granted to each named executive officer as of June 30, 2010, the outstanding phantom unit awards as of June 30, 2010 and the vesting dates of phantom unit awards to vest in future periods.
| |
|
|
October 1, 2010 | October 1, 2011 | |||||||||||||||
|---|---|---|---|---|---|---|---|---|---|---|---|---|---|---|---|---|---|---|---|
| |
Number of Shares or Units of Stock Granted February 2004 thru September 2008 |
Number of Shares or Units of Stock to Vest in Future Periods |
|||||||||||||||||
| |
Number of Shares or Units of Stock To Vest (#) |
Market Value of Shares or Units of Stock To Vest ($)(2) |
Number of Shares or Units of Stock To Vest (#) |
Market Value of Shares or Units of Stock To Vest ($)(2) |
|||||||||||||||
Timothy J. Casey |
46,700 | 14,960 | 6,340 | $ | 31,193 | 3,340 | $ | 16,433 | |||||||||||
Terrence P. Gill |
5,000 | 2,400 | 800 | $ | 3,936 | 600 | $ | 2,952 | |||||||||||
Thomas M. Sullivan |
15,500 | 4,980 | 2,100 | $ | 10,332 | 1,100 | $ | 5,412 | |||||||||||
Richard P. Falcinelli |
15,500 | 4,980 | 2,100 | $ | 10,332 | 1,100 | $ | 5,412 | |||||||||||
Gregory J. Haslinsky |
13,000 | 4,980 | 2,100 | $ | 10,332 | 1,100 | $ | 5,412 | |||||||||||
92
| |
Number of Restricted Shares or Units of Stock Granted February 2004 thru September 2008 |
|
October 1, 2012 | October 1, 2013 | |||||||||||||||
|---|---|---|---|---|---|---|---|---|---|---|---|---|---|---|---|---|---|---|---|
| |
Number of Restricted Shares or Units of Stock to Vest in Future Periods |
||||||||||||||||||
| |
Number of Shares or Units of Stock To Vest (#) |
Market Value of Shares or Units of Stock To Vest ($)(2) |
Number of Shares or Units of Stock To Vest (#) |
Market Value of Shares or Units of Stock To Vest ($)(2) |
|||||||||||||||
Timothy J. Casey |
46,700 | 14,960 | 3,340 | $ | 16,433 | 1,940 | $ | 9,544 | |||||||||||
Terrence P. Gill |
5,000 | 2,400 | 600 | $ | 2,952 | 400 | $ | 1.968 | |||||||||||
Thomas M. Sullivan |
15,500 | 4,980 | 1,100 | $ | 5,412 | 680 | $ | 3,346 | |||||||||||
Richard P. Falcinelli |
15,500 | 4,980 | 1,100 | $ | 5,412 | 680 | $ | 3,346 | |||||||||||
Gregory J. Haslinsky |
13,000 | 4,980 | 1,100 | $ | 5,412 | 680 | $ | 3,346 | |||||||||||
Option Exercises and Stock Vested Table
The following table sets forth the number of shares acquired upon the vesting of phantom unit awards, and the value realized upon exercise or vesting of such awards, for each of our named executive officers in fiscal 2010.
| |
Stock Awards | ||||||
|---|---|---|---|---|---|---|---|
Name
|
Number of Shares Acquired on Vesting (#) |
Value Realized on Vesting ($)(1) |
|||||
Timothy J. Casey |
9,340 | $ | 186,520 | ||||
Terrence P. Gill |
1,000 | $ | 19,970 | ||||
Thomas M. Sullivan |
3,100 | $ | 61,907 | ||||
Richard P. Falcinelli |
3,100 | $ | 61,907 | ||||
Gregory J. Haslinsky |
2,600 | $ | 51,922 | ||||
- (1)
- Represents the number of common units multiplied by $19.97 which was the closing price of our common units on the NYSE on the vesting date of October 1, 2009.
Pension Benefits
We do not maintain any plans that provide for payments or other benefits at, following or in connection with retirement, other than a 401(k) plan that is available to all U.S. employees.
Non-Qualified Deferred Compensation
We do not maintain any defined contribution or other plan that provides for the deferral of compensation on a basis that is not tax-qualified under the Internal Revenue Code.
93
Potential Payments upon Termination or Change-in-Control
Timothy J. Casey, Thomas M. Sullivan and Richard P. Falcinelli have entered into employment agreements ("Employment Agreements") with K-Sea Transportation Inc., one of our indirect wholly owned subsidiaries. The Employment Agreements do not provide for any payments in the event of a change in control. The Employment Agreements provide that if the employee's employment is terminated without cause or if the employee resigns for good reason, the employee is entitled to severance in an amount equal to the greater of (a) the product of 1.3125 (1.75 multiplied by 0.75) multiplied by the employee's base salary at the time of termination or resignation and (b) the product of 1.75 multiplied by the remaining term of the employee's non-competition provisions multiplied by the employee's base salary at the time of termination or resignation. In addition, we will make COBRA payments on behalf of the employee for a period of one year. If the employee is terminated for cause or terminates employment without good reason (other than death or disability), the employee is entitled to receive only earned but unpaid compensation and benefits. If the employee is terminated due to death, the employee's designated beneficiary or, if none, his estate is entitled to receive an amount equal to one-half of the employee's annual base salary at the time of death. If the employee is terminated due to disability, the employee is entitled to receive an amount equal to one-half of the employee's annual base salary at the time of disability and, if the employee so elects, COBRA payments for one year following termination.
Under the Employment Agreements and the Employment and Retirement Agreement, "cause" and "good reason" are defined as follows
- •
- Cause: the employee (1) after repeated notices and
warnings, fails to perform his reasonably assigned duties as reasonably determined by us, (2) materially breaches certain provisions of the employment agreement, or (3) commits or
engages in a felony or any intentional dishonest, unethical or fraudulent act which materially damages our reputation.
- •
- Good reason: the resignation of the employee after the relocation of our principal office outside of a 75-mile radius of our current location unless the new location is mutually agreed upon by us and the employee.
If a change in control were to have occurred as of June 30, 2010, all phantom units awarded to named executive officers awards under our long-term incentive plan would have immediately vested. In addition, all such awards would immediately vest upon the death, disability or retirement (after reaching age 65) of the named executive. If a named executive officer is terminated other than in connection with a change in control or the executive's death, disability or retirement (after reaching age 65), any unvested phantom units awarded to such executive would be forfeited.
94
The following tables set forth potential amounts payable to our named executive officers upon termination of employment under various circumstances, as if terminated on June 30, 2010.
| |
Change in Control | |||||||||||||||
|---|---|---|---|---|---|---|---|---|---|---|---|---|---|---|---|---|
| |
Casey | Gill | Sullivan | Falcinelli | Haslinsky | |||||||||||
Accelerated vesting of phantom units(1) |
$ | 73,603 | $ | 11,808 | $ | 24,502 | $ | 24,502 | $ | 24,502 | ||||||
- (1)
- Determined by multiplying the number of unvested phantom units as of June 30, 2010 by $4.92, which was the closing price of our common units on the NYSE on June 30, 2010.
| |
Termination Without Cause or Resignation for Good Reason(1) |
|||||||||||||||
|---|---|---|---|---|---|---|---|---|---|---|---|---|---|---|---|---|
| |
Casey | Gill | Sullivan | Falcinelli | Haslinsky | |||||||||||
Severance payment |
$ | 1,050,000 | $ | — | $ | 770,000 | $ | 770,000 | $ | — | ||||||
COBRA payments |
15,907 | — | 15,907 | 15,907 | — | |||||||||||
Accelerated vesting of phantom units |
— | — | — | — | — | |||||||||||
Total |
$ | 1,065,907 | $ | — | $ | 785,907 | $ | 785,907 | $ | — | ||||||
- (1)
- If the employee is terminated for cause or terminates employment without good reason (other than death or disability), the employee is entitled to receive only earned but unpaid compensation and benefits.
| |
Termination in the Event of Death | |||||||||||||||
|---|---|---|---|---|---|---|---|---|---|---|---|---|---|---|---|---|
| |
Casey | Gill | Sullivan | Falcinelli | Haslinsky | |||||||||||
Severance payment |
$ | 150,000 | $ | — | $ | 110,000 | $ | 110,000 | $ | — | ||||||
COBRA payments |
15,907 | — | 15,907 | 15,907 | — | |||||||||||
Accelerated vesting of phantom units |
73,603 | 11,808 | 24,502 | 24,502 | 24,502 | |||||||||||
Total |
$ | 239,510 | $ | 11,808 | $ | 150,409 | $ | 150,409 | $ | 24,502 | ||||||
| |
Termination in the Event of Disability | |||||||||||||||
|---|---|---|---|---|---|---|---|---|---|---|---|---|---|---|---|---|
| |
Casey | Gill | Sullivan | Falcinelli | Haslinsky | |||||||||||
Severance payment |
$ | 150,000 | $ | — | $ | 110,000 | $ | 110,000 | $ | — | ||||||
COBRA payments |
15,907 | — | 15,907 | 15,907 | — | |||||||||||
Accelerated vesting of phantom units |
73,603 | 11,808 | 24,502 | 24,502 | 24,502 | |||||||||||
Total |
$ | 239,510 | $ | 11,808 | $ | 150,409 | $ | 150,409 | $ | 24,502 | ||||||
Director Compensation
K-Sea General Partner GP LLC pays no additional remuneration to its employees for serving as directors. Also, neither Mr. Dowling nor Mr. Friedman received any remuneration during fiscal 2010 for serving as a director; however, they were reimbursed for expenses attendant to board membership.
95
The following table sets forth a summary of the compensation paid to non-employee directors in fiscal 2010:
Name
|
Fees Earned or Paid in Cash ($) |
Stock Awards ($)(1) |
Option Awards ($) |
Non-Equity Incentive Plan Compensation ($) |
Change in Pension Value and Nonqualified Deferred Compensation Earnings ($) |
All Other Compensation ($) |
Total ($)(2)(3) |
|||||||||||||||
|---|---|---|---|---|---|---|---|---|---|---|---|---|---|---|---|---|---|---|---|---|---|---|
Brian P. Friedman |
$ | — | $ | — | $ | — | $ | — | $ | — | $ | — | $ | — | ||||||||
James J. Dowling |
— | $ | 23,438 | — | — | — | — | $ | 23,438 | |||||||||||||
Anthony S. Abbate |
$ | 34,000 | $ | 42,049 | — | — | — | — | $ | 76,049 | ||||||||||||
Barry J. Alperin |
$ | 40,000 | $ | 42,049 | — | — | — | — | $ | 82,049 | ||||||||||||
Frank Salerno |
$ | 34,000 | $ | 42,049 | — | — | — | — | $ | 76,049 | ||||||||||||
- (1)
- Represents
the number of previously issued phantom units that vested during fiscal 2009 multiplied by the closing price of our common units on the date of
grant.
- (2)
- Each
of Messrs. Abbate, Alperin and Salerno receive an annual retainer of $25,000 in consideration of their services as director of K-Sea
General Partner GP LLC. In addition, for each board meeting that Messrs. Abbate, Alperin and Salerno attend they receive a fee of $1,000. Furthermore, Messrs. Abbate,
Alperin and Salerno, receive $1,000 for each audit committee meeting they attend (or $500 in the case of an audit committee meeting that falls on the same day as a board meeting). Mr. Alperin
receives an additional $1,000 for each audit committee meeting for his services as chairman of the audit committee. Mr. Alperin receives $1,000 for each compensation committee meeting that he
attends (or $500 in the case of a compensation committee meeting that falls on the same day as a board meeting).
- (3)
- We also reimburse directors for out-of-pocket expenses attendant to Board membership.
96
ITEM 12. SECURITY OWNERSHIP OF CERTAIN BENEFICIAL OWNERS AND MANAGEMENT AND RELATED SECURITYHOLDER MATTERS.
A diagram depicting our organizational structure as of September 10, 2010 is presented below.
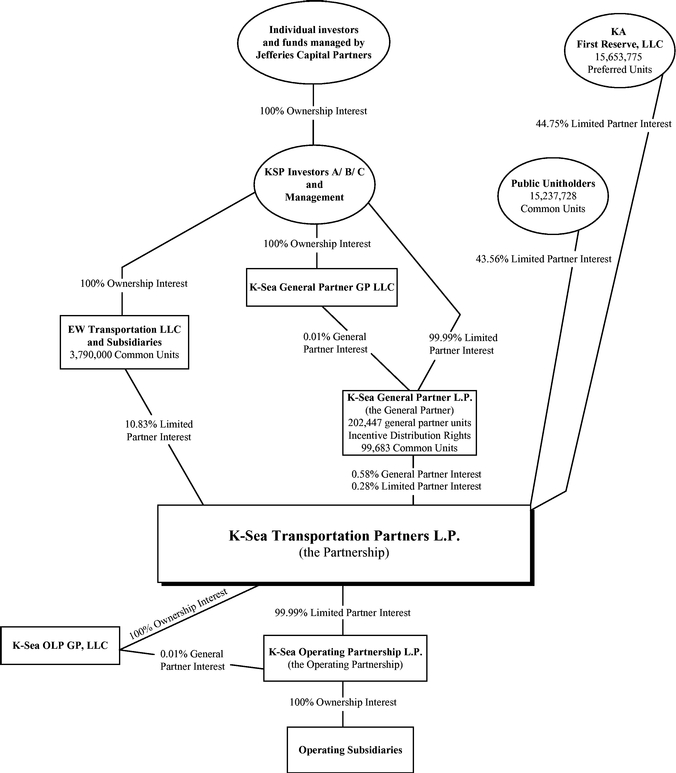
97
K-Sea Transportation Partners L.P.
The following table sets forth the beneficial ownership of units of K-Sea Transportation Partners L.P. as of September 10, 2010 by beneficial owners of 5% or more of such units, by each director and named executive officer of K-Sea General Partner GP LLC and by all directors and executive officers as a group. Percentages reflected in the table are based upon a total of 19,127,411common units and 15,653,775 preferred units outstanding as of September 10, 2010.
Name of Beneficial Owners(1)
|
Common Units(2) |
Percentage of Common Units |
Series A Preferred Units |
Percentage of Preferred Units |
Total Units |
Percentage of Total Units |
|||||||||||||
|---|---|---|---|---|---|---|---|---|---|---|---|---|---|---|---|---|---|---|---|
Beneficial owners of 5% or more: |
|||||||||||||||||||
KA First Reserve LLC(3) |
— | — | 15,653,775 | 100.00 | % | 15,653,775 | 45.01 | % | |||||||||||
EW Transportation LLC(4) |
3,790,000 | 19.81 | % | — | — | 3,790,000 | 10.90 | % | |||||||||||
EW Holding Corp(5) |
1,075,412 | 5.62 | % | — | — | 1,075,412 | 3.09 | % | |||||||||||
All directors and exec officers: |
|||||||||||||||||||
Brian P. Friedman and EW subs(6) |
3,933,595 | 20.57 | % | — | — | 3,933,595 | 11.31 | % | |||||||||||
James J. Dowling |
48,000 | * | — | — | 48,000 | * | |||||||||||||
Anthony S. Abbate |
28,500 | * | — | — | 28,500 | * | |||||||||||||
Barry J. Alperin |
13,500 | * | — | — | 13,500 | * | |||||||||||||
James C. Baker |
— | — | — | — | — | — | |||||||||||||
Kevin S. McCarthy |
— | — | — | — | — | — | |||||||||||||
Gary D. Reaves II |
— | — | — | — | — | — | |||||||||||||
Frank Salerno |
7,800 | * | — | — | 7,800 | * | |||||||||||||
Timothy J. Casey |
42,080 | * | — | — | 42,080 | * | |||||||||||||
Thomas M. Sullivan |
13,905 | * | — | — | 13,905 | * | |||||||||||||
Richard P. Falcinelli |
13,820 | * | — | — | 13,820 | * | |||||||||||||
Gregory J. Haslinsky |
10,890 | * | — | — | 10,890 | * | |||||||||||||
Terrence P. Gill |
3,750 | * | — | — | 3,750 | * | |||||||||||||
All directors and executive officers as a group (14 persons) |
4,115,840 |
21.52 |
% |
— |
— |
4,115,840 |
11.83 |
% |
|||||||||||
- *
- Less
than 1%.
- (1)
- Unless
otherwise noted, each beneficial owner has sole voting and dispositive power with respect to the common units set forth opposite such holder's name.
- (2)
- Holders
of restricted units do not have voting or investment power with respect to such units prior to vesting. Restricted units that are exercisable within
60 days of the date of this report are deemed outstanding for purposes of determining the beneficial ownership and computing the percentage ownership of such person, but are not deemed
outstanding for purposes of computing the percentage ownership of any other person. Accordingly, the following common units that may be issued upon the vesting of restricted units are included in the
table: Mr. Abbate—1,000; Mr. Alperin—1,000; Mr. Salerno—1,000; Mr. Casey—6,340; Mr. Gill—800;
Mr. Sullivan—2,100; Mr. Falcinelli—2,100; and Mr. Haslinsky—2,100.
- (3)
- The address of KA First Reserve LLC is 717 Texas Avenue, Suite 3100, Houston, Texas 77002. If, at any time after June 30, 2012, there is a "preferred distribution arrearage" outstanding for at least four consecutive quarters, the KA First Reserve, LLC and its affiliates will have the right for all times thereafter to designate directors constituting a mathematical majority of the directors on the Board. A "preferred distribution arrearage" means the excess, if any, of (a) the required
98
distributions with respect to a Series A Preferred Unit in a quarter over (b) the sum of all distributions with respect to a Series A Preferred Unit in such quarter.
- (4)
- EW Transportation LLC is owned by individual investors, including certain of our directors and executive officers, and by KSP Investors A L.P., KSP Investors B L.P. and KSP Investors C L.P. (each, a "KSP Entity"). The table below sets forth the economic interest in, and beneficial ownership of equity interests of, EW Transportation LLC., which beneficial ownership includes units beneficially owned by EW Holding Corp. and EW Transportation Corp., its wholly owned subsidiaries. The address of EW Transportation LLC is One Tower Center Blvd. 17th FL, East Brunswick, New Jersey 08816.
Name of Beneficial Owner
|
Economic Interest |
Equity Interest |
|||||
|---|---|---|---|---|---|---|---|
KSP Investors A L.P(a). |
57.6 | % | 62.9 | % | |||
KSP Investors B L.P(a). |
19.8 | % | 21.7 | % | |||
KSP Investors C L.P(a). |
12.6 | % | 13.7 | % | |||
Park Avenue Transportation Inc.(a) |
90.0 | % | 98.3 | % | |||
Brian P. Friedman(a) |
90.0 | % | 98.3 | % | |||
James J. Dowling(b) |
— | — | |||||
Anthony S. Abbate |
— | — | |||||
Barry J. Alperin |
— | — | |||||
James C. Baker |
— | — | |||||
Kevin S. McCarthy |
— | — | |||||
Gary D. Reaves II |
— | — | |||||
Frank Salerno |
— | — | |||||
Timothy J. Casey |
5.5 | % | * | ||||
Terrence P. Gill |
* | * | |||||
Thomas M. Sullivan |
1.3 | % | * | ||||
Richard P. Falcinelli |
1.3 | % | * | ||||
Gregory J. Haslinsky |
* | * | |||||
All directors and executive officers of K-Sea General Partner GP LLC as a group (14 persons) |
98.4 | % | 99.7 | % | |||
- *
- Less
than 1%.
- (a)
- Park
Avenue Transportation Inc. is the general partner of each of KSP Entity and, therefore, has sole voting and dispositive power with respect to
the equity interests of EW Transportation LLC. Mr. Friedman owns 51% of the outstanding shares of capital stock of Park Avenue Transportation Inc., the general partner of each KSP
Entity. In addition, Mr. Friedman has an economic interest in FS Private Investments LLC, which in turn has an economic interest in each KSP Entity. Mr. Friedman also has direct
economic interests in certain of the KSP Entities.
- (b)
- Mr. Dowling is a limited partner in KSP Investors C L.P. and has an effective 1.38% economic interest in EW Transportation LLC.
- (5)
- EW
Holding Corp.'s beneficial ownership includes units beneficially owned by EW Transportation Corp., its wholly owned subsidiary. The address of each
entity is One Tower Center Blvd. 17th FL, East Brunswick, New Jersey 08816.
- (6)
- Mr. Friedman owns 51% of Park Avenue Transportation Inc., the general partner of each KSP Entity and, therefore, may be deemed to beneficially own the common units held by EW Transportation LLC. The address of each KSP Entity and Park Avenue Transportation Inc. is 520 Madison Avenue, 12th Floor, New York, New York 10022.
99
The following table sets forth the economic interest in, and the beneficial ownership of equity interests of, K-Sea General Partner GP LLC, the general partner of our general partner, as of September 10, 2010:
Name of Beneficial Owner
|
Economic Interest/ Equity Interest |
|||
|---|---|---|---|---|
KSP Investors A L.P. |
57.6 | % | ||
KSP Investors B L.P. |
19.8 | % | ||
KSP Investors C L.P. |
12.6 | % | ||
Park Avenue Transportation Inc.(1) |
90.0 | % | ||
Brian P. Friedman(1) |
90.0 | % | ||
James J. Dowling(2) |
— | |||
Anthony S. Abbate |
— | |||
Barry J. Alperin |
— | |||
James C. Baker |
— | |||
Kevin S. McCarthy |
— | |||
Gary D. Reaves II |
— | |||
Frank Salerno |
— | |||
Timothy J. Casey |
5.5 | % | ||
Terrence P. Gill |
* | |||
Thomas M. Sullivan |
1.3 | % | ||
Richard P. Falcinelli |
1.3 | % | ||
Gregory J. Haslinsky |
* | |||
All directors and executive officers of K-Sea General Partner GP LLC as a group (14 persons) |
98.4 | % | ||
- *
- Less
than 1%.
- (1)
- Park
Avenue Transportation Inc. is the general partner of each KSP Entity and, therefore, has sole voting and dispositive power with respect to the
equity interests of K-Sea General Partner GP LLC.
- (2)
- Mr. Dowling has an effective 1.38% economic interest in K-Sea General Partner GP LLC.
Equity Compensation Plan Information
The following table sets forth in tabular format a summary of our equity plan information as of September 10, 2010:
| |
(a) | (b) | (c) | ||||||||
|---|---|---|---|---|---|---|---|---|---|---|---|
Plan Category
|
Number of securities to be issued upon exercise of outstanding options, warrants and rights |
Weighted average exercise price of outstanding options, warrants and rights |
Number of securities remaining available for future issuance under equity compensation plans (excluding securities reflected in column (a)) |
||||||||
Equity compensation plans approved by securityholders(1) |
— | — | 232,806 | (2) | |||||||
Equity compensation plans not approved by securityholders |
— | — | — | ||||||||
Total |
— | — | 232,806 | ||||||||
- (1)
- The
K-Sea Transportation Partners L.P. Long-Term Incentive Plan is our only equity compensation plan. No options, warrants or
rights have been issued under this plan.
- (2)
- An aggregate of 207,194 restricted units have been issued, net of forfeitures, under the K-Sea Transportation Partners L.P. Long-Term Incentive Plan.
100
ITEM 13. CERTAIN RELATIONSHIPS AND RELATED TRANSACTIONS, AND DIRECTOR INDEPENDENCE.
Distributions and Payments to Our General Partner and Its Affiliates
Our operations and activities are managed by our general partner. Our general partner and its affiliates do not receive a management fee or other compensation for the management of our partnership. Our general partner and its affiliates are entitled to be reimbursed, however, for all direct and indirect expenses incurred on our behalf. Our general partner has sole discretion in determining the amount of these expenses. Reimbursed expenses were $1,382, $20,290 and $1,143 in fiscal 2010, fiscal 2009 and fiscal 2008, respectively.
As of September 10, 2010, our general partner and its affiliates owned an approximately 0.58% general partner interest in us, 4,115,840 common units and all of our incentive distribution rights. An affiliate of our general partner is entitled to receive incentive distributions if the amount we distribute with respect to any quarter exceeds levels specified in our partnership agreement. Under the incentive distribution provisions, an affiliate of our general partner is entitled to 13% of amounts we distribute in excess of $0.55 per unit, 23% of the amounts we distribute in excess of $0.625 per unit and 48% of amounts we distribute in excess of $0.75 per unit.
Under our partnership agreement, K-Sea General Partner L.P. may elect to receive distributions with respect to a quarter determined pursuant to the partnership agreement, in whole or in part, in the form of common units instead of cash (an "In-Kind Distribution Quarter") to the extent approved in advance by the conflicts committee of the board of directors of K-Sea General Partner GP LLC. For the quarterly periods ended March 31, 2009 and June 30, 2009, the board of directors of K-Sea General Partner GP LLC, after considering the recommendation of its conflicts committee, approved the issuance of 49,775 common units and 49,908 common units to K-Sea General Partner L.P. in lieu of $1.244 million and $1.248 million in cash distributions, respectively.
If our general partner withdraws or is removed, its general partner interest and its incentive distribution rights will either be sold to the new general partner for cash or converted into common units, in each case for an amount equal to the fair market value of those interests.
Upon our liquidation, the partners, including our general partner, will be entitled to receive liquidating distributions according to their particular capital account balances.
Omnibus Agreement
We are a party to an omnibus agreement with the KSP Entities, EW Transportation LLC, EW Acquisition Corp., EW Holding Corp., EW Transportation Corp., K-Sea General Partner LP (our general partner), K-Sea General Partner GP LLC (the general partner of our general partner), K-Sea OLP GP LLC (the general partner of our operating partnership) and K-Sea Operating Partnership L.P. (our operating partnership).
Noncompetition
Under the omnibus agreement, neither the KSP Entities nor their controlled affiliates may engage, either directly or indirectly, in the business of providing refined petroleum product marine transportation, distribution and logistics services in the United States to the extent such business generates qualifying income for federal income tax purposes. The restriction does not apply to the assets that were retained by our predecessors at the closing of our initial public offering in January 2004. Except as provided above, neither the KSP Entities nor their controlled affiliates are prohibited from engaging in activities in which they compete directly or indirectly with us. Jefferies Capital Partners, and the funds it manages, are not prohibited from owning assets or engaging in businesses that compete directly or indirectly with us.
101
Indemnification
Under the omnibus agreement, the KSP Entities, EW Transportation LLC and the subsidiaries of EW Transportation LLC (collectively, "the Indemnitors") have jointly and severally agreed to indemnify us until January 14, 2014, against certain toxic tort liabilities associated with the operation of the assets before January 14, 2004. Liabilities resulting from changes in law after the closing of our initial public offering are excluded from the environmental indemnity. We have agreed to indemnify the Indemnitors for events and conditions associated with the operation of our assets that occur on or after January 14, 2004 to the extent the Indemnitors are not required to indemnify us. There is an aggregate cap of $10 million on the amount of indemnity coverage provided by the Indemnitors for the environmental and toxic tort liabilities.
The Indemnitors have also agreed to indemnify us for liabilities related to:
- •
- events and conditions associated with any assets retained by the Indemnitors or any of their respective affiliates,
whether occurring before or after January 14, 2004;
- •
- certain liabilities retained by EW Holding Corp., EW Transportation LLC and EW Transportation Corp.; and
- •
- certain income tax liabilities attributable to the operation of the assets contributed to us prior to the time they were contributed to us in connection with our initial public offering.
Amendments
The omnibus agreement may not be amended without the prior approval of the conflicts committee if the proposed amendment will, in the reasonable discretion of our general partner, adversely affect holders of our common units.
Relationship with KA First Reserve, LLC
Director Designation Agreement
KA First Reserve, LLC owns 15,653,775 Series A Preferred Units representing limited partner interests, representing 45.0% limited partnership interest in us as of September 10, 2010. In addition, KA First Reserve has agreed to purchase an additional 2,762,431 preferred units for approximately $15.0 million upon clearance of a Hart-Scott-Rodino review. In connection with the sale of the Series A Preferred Units to KA First Reserve, LLC, we entered into a Director Designation Agreement with KA First Reserve, LLC, our general partner, K-Sea General Partner GP LLC, which is the general partner of our general partner, and certain owners of the equity interests in K-Sea General Partner GP LLC. Under the Director Designation Agreement, KA First Reserve, LLC is entitled to the following representation on the board of K-Sea General Partner LLC (the "Board"):
- •
- For so long as KA First Reserve, LLC and its affiliates own more than 33% of our outstanding common units, KA First
Reserve, LLC will have the right to designate 3 directors to the Board.
- •
- For so long as KA First Reserve, LLC and its affiliates own more than 22% of our outstanding common units and up to
33% of our outstanding common units, KA First Reserve, LLC will have the right to designate 2 directors to the Board.
- •
- For so long as KA First Reserve, LLC and its affiliates own more than 11% of our outstanding common units and up to 22% of our outstanding common units, KA First Reserve, LLC will have the right to designate 1 director to the Board.
If KA First Reserve, LLC and its affiliates own 11% or less of our outstanding common units, KA First Reserve, LLC will no longer have the right to designate directors to the Board. Ownership of outstanding common units includes the Series A Preferred Units on an as-converted basis.
102
If, at any time after June 30, 2012, there is a "preferred distribution arrearage" outstanding for at least four consecutive quarters, the KA First Reserve, LLC and its affiliates will have the right for all times thereafter to designate directors constituting a mathematical majority of the directors on the Board. A "preferred distribution arrearage" means the excess, if any, of (a) the required distributions with respect to a Series A Preferred Unit in a quarter over (b) the sum of all distributions with respect to a Series A Preferred Unit in such quarter.
Registration Rights Agreement
We have also entered into an agreement with KA First Reserve, LLC to provide the holders of Series A Preferred Units and the common units issuable upon conversion thereof with customary registration rights. Pursuant to the registration rights agreement, we have agreed to, among other things, file a shelf registration statement for the resale of the common units into which the preferred units may convert as soon as practicable following receipt of written notice from KA First Reserve requesting the filing of such shelf registration statement. Moreover, we have agreed to use reasonable best efforts to cause the shelf registration statement to be declared effective by the SEC no later than 240 days after receipt of such notice from KA First Reserve.
Incentive Distribution Rights
In connection with the Series A Preferred Unit investment, KA First Reserve, LLC has also been granted the right to acquire a 35% interest in the entity that owns our incentive distribution rights. This right expires on September 10, 2011.
Restrictions on General Partner's Authority
For so long as KA First Reserve, LLC owns at least 50% of the preferred units, our general partner may not, without the consent of KA First Reserve, LLC, do any of the following:
- •
- cause or permit us to invest in, or dispose of, the equity securities or debt securities of any person or otherwise
acquire or dispose of any interest in any person, to acquire or dispose of interest in any joint venture or partnership or any similar arrangement with any person, or to acquire or dispose of assets
of any person, or to make any capital expenditure (other than maintenance capital expenditures), or to make any loan or advance to any person if the total consideration (including cash, equity issued
and debt assumed) paid or payable, or received or receivable, by us exceeds $15.0 million in any one or series of related transactions or in the aggregate exceeds $50.0 million in any
twelve-month period;
- •
- cause or permit us to incur, create or guarantee any indebtedness which exceeds (x) $75.0 million in any one
or series of related transactions to the extent the proceeds of such financing are used to refinance existing indebtedness, or (y) $25.0 million in any twelve-month period to the extent
such indebtedness increases our aggregate indebtedness;
- •
- authorize or permit the purchase, redemption or other acquisition of our securities (or any options, rights, warrants or
appreciation rights relating to our securities);
- •
- select or dismiss, or enter into any employment agreement or amendment of any employment agreement of, our CEO or CFO;
- •
- enter into any agreement or effect any related-party transaction, other than any transaction in the ordinary course of
business and determined by the Board of Directors of the general partner of our general partner to be on an arm's length basis; or
- •
- cause or permit us to enter into any agreement or make any commitment to do any of the foregoing.
103
Operations Manager
We currently employ William Sullivan as an operations manager at our Staten Island, New York location. William Sullivan is the brother of Thomas M. Sullivan, Chief Operating Officer and President—Atlantic Region. William Sullivan received total compensation of approximately $163,283 in respect of fiscal 2010. Additionally, we currently employ Bernard Casey as an operations manager at our Honolulu, Hawaii location. Bernard Casey is the brother of Timothy J. Casey, President, Chief Executive Officer and Director. Bernard Casey received total compensation of approximately $222,233 including a housing allowance and relocation expenses, in respect of fiscal 2010. The compensation for William Sullivan and Bernard Casey is reviewed and approved by the Compensation Committee.
Properties
We lease our Staten Island, New York office and pier facilities from, and charter certain vessels to, affiliates of an employee who is not an executive officer or director. Additionally, we utilize one of these affiliates for tank cleaning services. Please read note 13 to our audited consolidated financial statements included elsewhere in this report.
We lease a parcel of land used for storage of vessel parts and equipment from Gordon Smith, President—Pacific Region, for $12,000 per month.
Director Independence
The board of directors of K-Sea General Partner GP LLC has determined that Messrs. Abbate, Alperin and Salerno are independent within the meaning of the listing standards for general independence of the New York Stock Exchange. Under the listing standards, the audit committee is required to be composed solely of directors who are independent. The standards for audit committee membership include additional requirements under rules of the SEC.
The listing standards relating to general independence consist of both a requirement for a board determination that the director has no material relationship with the listed company and a listing of several specific relationships that preclude independence. To assist it in making determinations of independence, the board has adopted categorical standards as permitted under the listing standards. Although the board considers all relevant facts and circumstances in assessing whether a director is independent, relationships falling within the categorical standards are not required to be disclosed or separately discussed in this report in connection with the board's independence determinations. A relationship falls within the categorical standards adopted by the board if it:
- •
- is a type of relationship addressed in
- •
- the rules of the SEC requiring proxy statement disclosure of relationships and transactions, or
- •
- the provisions of the New York Stock Exchange Listed Company Manual listing relationships that preclude a determination of independence,
- •
- consists of charitable contributions by us to an organization where a director is an executive officer and does not exceed the greater of $1 million or 2% of the organization's gross revenue in any of the last three years.
but under those rules neither requires disclosure nor precludes a determination of independence, or
None of the independent directors had relationships relevant to an independence determination that were outside the scope of the board's categorical standards.
104
Because we are a limited partnership, the listing standards of the New York Stock Exchange do not require K-Sea General Partner GP LLC to have a majority of independent directors or a nominating/corporate governance or compensation committee.
ITEM 14. PRINCIPAL ACCOUNTANT FEES AND SERVICES.
The following table presents fees for services rendered by PricewaterhouseCoopers LLP during fiscal 2010 and fiscal 2009.
| |
Year Ended June 30, 2010 |
Year Ended June 30, 2009 |
|||||
|---|---|---|---|---|---|---|---|
Audit fees(1) |
$ | 1,165,500 | $ | 1,142,500 | |||
Audit-related fees(2) |
202,000 | 179,105 | |||||
Tax fees(3) |
738,975 | 800,274 | |||||
All other fees |
— | — | |||||
Total |
$ | 2,106,475 | $ | 2,121,879 | |||
- (1)
- Fees
for audit of annual financial statements and internal control over financial reporting under the Sarbanes Oxley Act of 2002, reviews of the related
quarterly financial statements, and reviews of documents filed with the SEC.
- (2)
- Fees
for professional services for consultations related to financial accounting and reporting standards.
- (3)
- Fees related to professional services for tax compliance, tax advice and tax planning.
The audit committee has considered whether the provision of the non-audit services described above is compatible with maintaining the independence of PricewaterhouseCoopers LLP and determined that the provision of such services was compatible with maintaining such independence.
Audit Committee Policies and Procedures for Pre-approval of Audit and Non-Audit Services
Consistent with SEC policies regarding auditor independence, the audit committee is responsible for pre-approving all audit and non-audit services performed by the independent registered public accounting firm. In addition to its approval of the audit engagement, the audit committee takes action at least annually to authorize the performance by the independent registered public accounting firm of several specific types of services within the categories of audit-related services and tax services. Audit-related services include assurance and related services that are reasonably related to the performance of the audit or review of the financial statements. Authorized tax services include compliance-related services such as services involving tax filings, as well as consulting services such as tax planning, transaction analysis and opinions. Services are subject to pre-approval of the specific engagement if they are outside the specific types of services included in the periodic approvals or if they are in excess of specified fee limitations. The audit committee may delegate pre-approval authority to subcommittees or to the Chairman. During 2010, no pre-approval requirements were waived.
105
ITEM 15. EXHIBITS AND FINANCIAL STATEMENT SCHEDULES.
(a)(1) Financial Statements.
See "Index to Financial Statements" set forth on page F-1.
(a)(2) Financial Statement Schedules.
None.
(a)(3) Exhibits.
| Exhibit Number |
|
Description | |||
|---|---|---|---|---|---|
| 3.1 | * | — | Certificate of Limited Partnership of K-Sea Transportation Partners L.P. (incorporated by reference to Exhibit 3.1 to the Partnership's Registration Statement on Form S-1 (Registration No. 107084), as amended (the "Registration Statement"), originally filed with the Securities and Exchange Commission on July 16, 2003). | ||
| 3.2 | — | Fourth Amended and Restated Agreement of Limited Partnership of K-Sea Transportation Partners L.P. (including specimen unit certificate for the common units) | |||
| 3.3 | * | — | Certificate of Limited Partnership of K-Sea Operating Partnership L.P. (incorporated by reference to Exhibit 3.3 to the Registration Statement). | ||
| 3.4 | * | — | Amended and Restated Agreement of Limited Partnership of K-Sea Operating Partnership L.P. (incorporated by reference to Exhibit 3.4 to the Partnership's Quarterly Report on Form 10-Q for the period ended December 31, 2003). | ||
| 3.5 | * | — | Certificate of Limited Partnership of K-Sea General Partner L.P. (incorporated by reference to Exhibit 3.5 to the Registration Statement). | ||
| 3.6 | * | — | First Amended and Restated Agreement of Limited Partnership of K-Sea General Partner L.P. (incorporated by reference to Exhibit 3.6 to the Partnership's Quarterly Report on Form 10-Q for the period ended December 31, 2003). | ||
| 3.7 | * | — | Certificate of Formation of K-Sea General Partner GP LLC (incorporated by reference to Exhibit 3.7 to the Registration Statement). | ||
| 3.8 | * | — | First Amended and Restated Limited Liability Company Agreement of K-Sea General Partner GP LLC (incorporated by reference to Exhibit 3.8 to the Partnership's Quarterly Report on Form 10-Q for the period ended December 31, 2003). | ||
| 10.1 | * | — | Contribution, Conveyance and Assumption Agreement, dated as of January 14, 2004, among K-Sea Investors L.P., K-Sea Transportation LLC, EW Holding Corp., K-Sea Transportation Corp., K-Sea Transportation Partners L.P. and K-Sea Operating Partnership L.P. (incorporated by reference to Exhibit 10.2 to the Partnership's Quarterly Report on Form 10-Q for the period ended December 31, 2003). | ||
| 10.2 | * | — | Omnibus Agreement, dated as of January 14, 2004, among K-Sea Investors L.P., K-Sea Acquisition Corp., New EW Holding Corp., New K-Sea Transportation Corp., K-Sea General Partner L.P., K-Sea General Partner GP LLC, K-Sea Transportation Partners L.P., K-Sea OLP GP LLC and K-Sea Operating Partnership L.P. (incorporated by reference to Exhibit 10.3 to the Partnership's Quarterly Report on Form 10-Q for the period ended December 31, 2003). | ||
106
| Exhibit Number |
|
Description | |||
|---|---|---|---|---|---|
| 10.3.1 | * | — | K-Sea Transportation Partners L.P. Long-term Incentive Plan (incorporated by reference to Exhibit 10.7 to the Partnership's Quarterly Report on Form 10-Q for the period ended March 31, 2004). | ||
| 10.3.2 | * | — | Form of Director Phantom Unit Award Agreement (incorporated by reference to Exhibit 10.1 to the Partnership's Current Report on Form 8-K filed with the Securities and Exchange Commission on October 7, 2004). | ||
| 10.3.3 | * | — | Form of Employee Phantom Unit Award Agreement (incorporated by reference to Exhibit 10.2 to the Partnership's Current Report on Form 8-K filed with the Securities and Exchange Commission on October 7, 2004). | ||
| 10.4 | * | — | K-Sea Transportation Partners L.P. Employee Unit Purchase Plan (incorporated by reference to Exhibit 4.2 to the Partnership's Registration Statement on Form S-8 (Registration No. 333-117251) filed on July 9, 2004). | ||
| 10.5 | *† | — | Employment Agreement, dated as of January 14, 2004, between K-Sea Transportation Inc. and Timothy J. Casey (incorporated by reference to Exhibit 10.9 to the Partnership's Quarterly Report on Form 10-Q for the period ended December 31, 2003). | ||
| 10.6 | *† | — | Employment Agreement, dated as of January 14, 2004, between K-Sea Transportation Inc. and Richard P. Falcinelli (incorporated by reference to Exhibit 10.11 to the Partnership's Quarterly Report on Form 10-Q for the period ended December 31, 2003). | ||
| 10.7 | *† | — | Employment Agreement, dated as of January 14, 2004, between K-Sea Transportation Inc. and Thomas M. Sullivan (incorporated by reference to Exhibit 10.12 to the Partnership's Quarterly Report on Form 10-Q for the period ended December 31, 2003). | ||
| 10.8 | *† | — | Form of Indemnification Agreement (incorporated by reference to Exhibit 10.12 to the Partnership's Annual Report on Form 10-K for the fiscal year ended June 30, 2005) | ||
| 10.9 | * | — | Amended and Restated Loan and Security Agreement, dated as of August 14, 2007 (the "Revolving Loan Agreement"), by and among K-Sea Operating Partnership L.P., as Borrower, LaSalle Bank National Association and Citibank, N.A., as co-syndication agents, Citizens Bank of Pennsylvania and HSBC Bank USA National Association, as co-documentation agents, and KeyBank National Association, as administrative agent and collateral trustee, and the lenders party thereto (incorporated by reference to Exhibit 10.1 to the Partnership's Current Report on Form 8-K filed with the Securities and Exchange Commission on August 20, 2007). | ||
| 10.10 | — | Amendment No. 1 to the Revolving Loan Agreement, dated as of November 7, 2007, by and among K-Sea Operating Partnership L.P., as Borrower, LaSalle Bank National Association and Citibank, N.A., as co-syndication agents, Citizens Bank of Pennsylvania and HSBC Bank USA National Association, as co-documentation agents, and KeyBank National Association, as administrative agent and collateral trustee, and the lenders party thereto. | |||
107
| Exhibit Number |
|
Description | |||
|---|---|---|---|---|---|
| 10.11 | — | Amendment No. 2 to the Revolving Loan Agreement, dated as of, June 30, 2008, by and among K-Sea Operating Partnership L.P., as Borrower, LaSalle Bank National Association and Citibank, N.A., as co-syndication agents, Citizens Bank of Pennsylvania and HSBC Bank USA National Association, as co-documentation agents, and KeyBank National Association, as administrative agent and collateral trustee, and the lenders party thereto. | |||
| 10.12 | * | — | Amendment No. 3 to the Revolving Loan Agreement, dated as of December 23, 2009, by and among K-Sea Operating Partnership L.P., as Borrower, LaSalle Bank National Association and Citibank, N.A., as co-syndication agents, Citizens Bank of Pennsylvania and HSBC Bank USA National Association, as co-documentation agents, and KeyBank National Association, as administrative agent and collateral trustee, and the lenders party thereto (incorporated by reference to Exhibit 10.1 to the Partnership's Quarterly Report on Form 10-Q for the period ended December 31, 2009). | ||
| 10.13 | — | Amendment No. 4 to the Revolving Loan Agreement, dated as of August 31, 2010, by and among K-Sea Operating Partnership L.P., as Borrower, LaSalle Bank National Association and Citibank, N.A., as co-syndication agents, Citizens Bank of Pennsylvania and HSBC Bank USA National Association, as co-documentation agents, and KeyBank National Association, as administrative agent and collateral trustee, and the lenders party thereto. | |||
| 10.14 | * | — | Master Loan and Security Agreement dated as of April 3, 2006 by and among K-Sea Operating Partnership L.P., as Borrower, Key Equipment Finance Inc., as Lender, and K-Sea Transportation Partners L.P., K-Sea Transportation Inc. and Sea Coast Transportation LLC, as Guarantors (incorporated by reference to Exhibit 10.1 to the Partnership's Current Report on Form 8-K filed with the Securities and Exchange Commission on April 7, 2006). | ||
| 10.15 | — | Securities Purchase Agreement, dated as of September 1, 2010, by and among K-Sea Transportation Partners L.P., K-Sea General Partner L.P. and KA First Reserve, | |||
| 10.16 | — | Registration Rights Agreement, dated as of September 10, 2010, by and between K-Sea Transportation Partners L.P. and KA First Reserve, LLC. | |||
| 10.17 | — | Director Designation Agreement, dated as of September 10, 2010, by and among K-Sea Transportation Partners L.P., K-Sea General Partner GP LLC, K-Sea General Partner L.P., K-Sea Investors A L.P., K-Seas Investors B L.P., K-Sea Investors C L.P., the other members of K-Sea General Partner GP LLC signatory thereto and KA First Reserve, LLC. | |||
| 21.1 | — | List of Subsidiaries. | |||
| 23.1 | — | Consent of PricewaterhouseCoopers LLP. | |||
| 31.1 | — | Certification of Chief Executive Officer pursuant to Section 302 of the Sarbanes-Oxley Act of 2002. | |||
| 31.2 | — | Certification of Chief Financial Officer pursuant to Section 302 of the Sarbanes-Oxley Act of 2002. | |||
| 32.1 | — | Certification of Chief Executive Officer pursuant to 18 U.S.C. Section 1350, as adopted pursuant to Section 906 of the Sarbanes-Oxley Act of 2002. | |||
108
| Exhibit Number |
|
Description | |||
|---|---|---|---|---|---|
| 32.2 | — | Certification of Chief Financial Officer pursuant to 18 U.S.C. Section 1350, as adopted pursuant to Section 906 of the Sarbanes-Oxley Act of 2002. | |||
| 99.1 | * | — | Loan Agreement, dated as of March 17, 2005, between K-Sea Operating Partnership L.P. and First Union Commercial Corporation (incorporated by reference to Exhibit 10.3 to the Partnership's Quarterly Report on Form 10-Q for the period ended March 31, 2005). | ||
| 99.2 | * | — | Loan Agreement, dated as of June 28, 2005, between K-Sea Operating Partnership L.P. and Citizens Asset Finance, d/b/a Citizens Leasing Corporation (incorporated by reference to Exhibit 10.16 to the Partnership's Annual Report on Form 10-K for the fiscal year ended June 30, 2005) | ||
| 99.3 | * | — | Loan Agreement dated December 19, 2005 between K-Sea Canada Corp., as Borrower, and Citizens Leasing Corp. d/b/a Citizens Asset Finance, as Lender, (incorporated by reference to Exhibit 10.3 to the Partnership's Quarterly Report on Form 10-Q for the period ended December 31, 2005). | ||
| 99.4 | * | — | Loan Agreement dated as of May 12, 2006 among K-Sea Operating Partnership L.P., as Borrower, Citizens Leasing Corporation, as Lender, and Citizens Leasing Corporation, as agent and collateral trustee for the other lenders that may become parties to the loan agreement (incorporated by reference to Exhibit 99.4 to the Partnership's Annual Report on Form 10-K for the fiscal year ended June 30, 2006). | ||
| 99.5 | * | — | Credit Facility Agreement providing for a Secured Term Loan Credit Facility dated June 4, 2008 by K-Sea Operating Partnership L.P., as Borrower, and DnB NOR Bank ASA, as Mandated Lead Arranger, Bookrunner, Administrative Agent and Security Trustee, and the banks and financial institutions indentified therein, as Lenders (incorporated by reference to Exhibit 99.5 to the Partnership's Annual Report on Form 10-K for the fiscal year ended June 30, 2008). | ||
| 99.6 | — | Amendment No. 1, dated as of June 30, 2008, to a Secured Term Loan Credit Facility dated June 4, 2008 by K-Sea Operating Partnership L.P., as Borrower, and DnB NOR Bank ASA, as Mandated Lead Arranger, Bookrunner, Administrative Agent and Security Trustee, and the banks and financial institutions indentified therein, as Lenders. | |||
| 99.7 | * | — | Amendment No. 2, dated as of December 23, 2009, to a Secured Term Loan Credit Facility dated June 4, 2008 by K-Sea Operating Partnership L.P., as Borrower, and DnB NOR Bank ASA, as Mandated Lead Arranger, Bookrunner, Administrative Agent and Security Trustee, and the banks and financial institutions indentified therein, as Lenders (incorporated by reference to Exhibit 99.2 to the Partnership's Quarterly Report on Form 10-Q for the period ended December 31, 2009). | ||
| 99.8 | — | Amendment No. 3, dated as of August 31, 2010, to a Secured Term Loan Credit Facility dated June 4, 2008 by K-Sea Operating Partnership L.P., as Borrower, and DnB NOR Bank ASA, as Mandated Lead Arranger, Bookrunner, Administrative Agent and Security Trustee, and the banks and financial institutions indentified therein, as Lenders. | |||
- *
- Incorporated
by reference, as indicated.
- †
- Management contract, compensatory plan or arrangement.
109
Pursuant to the requirements of Section 13 or 15(d) of the Securities Exchange Act of 1934, the registrant has duly caused this report to be signed on its behalf by the undersigned, thereunto duly authorized.
| K-SEA TRANSPORTATION PARTNERS L.P. | ||||
By: K-SEA GENERAL PARTNER L.P., its General Partner |
||||
By: K-SEA GENERAL PARTNER GP LLC, its General Partner |
||||
September 13, 2010 |
By: |
/s/ TIMOTHY J. CASEY Timothy J. Casey President and Chief Executive Officer |
||
Pursuant to the requirements of the Securities Exchange Act of 1934, this report has been signed by the following persons in the capacities and on the dates indicated:
Signature
|
Title
|
Date
|
||
|---|---|---|---|---|
| /s/ TIMOTHY J. CASEY Timothy J. Casey |
President and Chief Executive Officer and Director (Principal Executive Officer) | September 13, 2010 | ||
/s/ TERRENCE P. GILL Terrence P. Gill |
Chief Financial Officer (Principal Financial and Accounting Officer) |
September 13, 2010 |
||
/s/ JAMES J. DOWLING James J. Dowling |
Chairman of the Board and Director |
September 13, 2010 |
||
/s/ ANTHONY S. ABBATE Anthony S. Abbate |
Director |
September 13, 2010 |
||
/s/ BARRY J. ALPERIN Barry J. Alperin |
Director |
September 13, 2010 |
||
/s/ BRIAN P. FRIEDMAN Brian P. Friedman |
Director |
September 13, 2010 |
||
/s/ FRANK SALERNO /s/ Frank Salerno |
Director |
September 13, 2010 |
110
INDEX TO CONSOLIDATED STATEMENTS
F-1
Management's Report on Internal Control Over Financial Reporting
Our management, including our Chief Executive Officer and Chief Financial Officer, is responsible for establishing and maintaining adequate internal control over financial reporting as defined in Rules 13a-15(f) and 15d-15(f) of the Securities and Exchange Act of 1934. Management assessed the effectiveness of our internal control over financial reporting as of June 30, 2010 based on the framework in "Internal Control—Integrated Framework," issued by the Committee of Sponsoring Organizations of the Treadway Commission. Based on that assessment, management concluded that our internal control over financial reporting was effective as of June 30, 2010, based on those criteria.
Management's assessment of the effectiveness of our internal control over financial reporting as of June 30, 2010 has been audited by PricewaterhouseCoopers LLP, an independent registered public accounting firm, as stated in their report which is included under the heading "Report of Independent Registered Public Accounting Firm" on page F-3.
F-2
Report of Independent Registered Public Accounting Firm
To the General Partner and Unitholders of K-Sea Transportation Partners L.P.,
In our opinion, the consolidated financial statements listed in the index appearing under Item 15 (a)(1) present fairly, in all material respects, the financial position of K-Sea Transportation Partners L.P. and its subsidiaries (collectively, the "Partnership") at June 30, 2010 and June 30, 2009, and the results of their operations and their cash flows for each of the three years in the period ended June 30, 2010 in conformity with accounting principles generally accepted in the United States of America. Also in our opinion, the Partnership maintained, in all material respects, effective internal control over financial reporting as of June 30, 2010, based on criteria established in Internal Control—Integrated Framework issued by the Committee of Sponsoring Organizations of the Treadway Commission (COSO). The Partnership's management is responsible for these financial statements, for maintaining effective internal control over financial reporting and for its assessment of the effectiveness of internal control over financial reporting, included in the accompanying Management's Report on Internal Control Over Financial Reporting on page F-2. Our responsibility is to express opinions on these financial statements and on the Partnership's internal control over financial reporting based on our integrated audits. We conducted our audits in accordance with the standards of the Public Company Accounting Oversight Board (United States). Those standards require that we plan and perform the audits to obtain reasonable assurance about whether the financial statements are free of material misstatement and whether effective internal control over financial reporting was maintained in all material respects. Our audits of the financial statements included examining, on a test basis, evidence supporting the amounts and disclosures in the financial statements, assessing the accounting principles used and significant estimates made by management, and evaluating the overall financial statement presentation. Our audit of internal control over financial reporting included obtaining an understanding of internal control over financial reporting, assessing the risk that a material weakness exists, and testing and evaluating the design and operating effectiveness of internal control based on the assessed risk. Our audits also included performing such other procedures as we considered necessary in the circumstances. We believe that our audits provide a reasonable basis for our opinions.
As discussed in Note 2 to the consolidated financial statements, the Partnership changed the manner in which it accounts for earnings per unit in 2010.
A company's internal control over financial reporting is a process designed to provide reasonable assurance regarding the reliability of financial reporting and the preparation of financial statements for external purposes in accordance with generally accepted accounting principles. A company's internal control over financial reporting includes those policies and procedures that (i) pertain to the maintenance of records that, in reasonable detail, accurately and fairly reflect the transactions and dispositions of the assets of the company; (ii) provide reasonable assurance that transactions are recorded as necessary to permit preparation of financial statements in accordance with generally accepted accounting principles, and that receipts and expenditures of the company are being made only in accordance with authorizations of management and directors of the company; and (iii) provide reasonable assurance regarding prevention or timely detection of unauthorized acquisition, use, or disposition of the company's assets that could have a material effect on the financial statements.
Because of its inherent limitations, internal control over financial reporting may not prevent or detect misstatements. Also, projections of any evaluation of effectiveness to future periods are subject to the risk that controls may become inadequate because of changes in conditions, or that the degree of compliance with the policies or procedures may deteriorate.
/s/ PRICEWATERHOUSECOOPERS LLP
Florham
Park, New Jersey
September 13, 2010
F-3
K-SEA TRANSPORTATION PARTNERS L.P.
CONSOLIDATED BALANCE SHEETS
(in thousands)
| |
June 30, | ||||||||
|---|---|---|---|---|---|---|---|---|---|
| |
2010 | 2009 | |||||||
Assets |
|||||||||
Current Assets |
|||||||||
Cash and cash equivalents |
$ | 1,896 | $ | 1,819 | |||||
Accounts receivable, net |
33,206 | 29,819 | |||||||
Deferred taxes |
1,649 | 1,118 | |||||||
Prepaid expenses and other current assets |
18,857 | 16,689 | |||||||
Total current assets |
55,608 | 49,445 | |||||||
Vessels and equipment, net |
604,197 | 533,996 | |||||||
Construction in progress |
730 | 66,882 | |||||||
Deferred financing costs, net |
3,227 | 3,152 | |||||||
Goodwill |
— | 54,300 | |||||||
Other assets |
32,375 | 31,028 | |||||||
Total assets |
$ | 696,137 | $ | 738,803 | |||||
Liabilities and Partners' Capital |
|||||||||
Current Liabilities |
|||||||||
Current portion of long-term debt |
$ | 19,024 | $ | 16,820 | |||||
Accounts payable |
15,720 | 17,239 | |||||||
Accrued expenses and other current liabilities |
33,607 | 27,134 | |||||||
Deferred revenue |
12,005 | 12,476 | |||||||
Total current liabilities |
80,356 | 73,669 | |||||||
Term loans and capital lease obligation |
219,461 | 225,915 | |||||||
Credit line borrowings |
144,450 | 140,278 | |||||||
Other liabilities |
13,375 | 11,395 | |||||||
Deferred taxes |
3,486 | 3,618 | |||||||
Total liabilities |
461,128 | 454,875 | |||||||
Commitments and contingencies |
|||||||||
Partners Capital |
|||||||||
General partner |
1,223 | 2,230 | |||||||
Limited partners |
247,193 | 294,259 | |||||||
Accumulated other comprehensive loss |
(17,996 | ) | (17,075 | ) | |||||
Total K-Sea Transportation Partners L.P. unitholders' capital |
230,420 | 279,414 | |||||||
Non-controlling interest |
4,589 | 4,514 | |||||||
Total partners' capital |
235,009 | 283,928 | |||||||
Total liabilities and partners' capital |
696,137 | $ | 738,803 | ||||||
See accompanying notes to consolidated financial statements.
F-4
K-SEA TRANSPORTATION PARTNERS L.P.
CONSOLIDATED STATEMENTS OF OPERATIONS
(in thousands, except per unit amounts)
| |
For the Years Ended June 30, | |||||||||||
|---|---|---|---|---|---|---|---|---|---|---|---|---|
| |
2010 | 2009 | 2008 | |||||||||
Voyage revenue |
$ | 248,092 | $ | 310,429 | $ | 312,680 | ||||||
Other revenue |
17,333 | 20,033 | 13,600 | |||||||||
Total revenues |
265,425 | 330,462 | 326,280 | |||||||||
Voyage expenses |
45,890 | 67,029 | 79,427 | |||||||||
Vessel operating expenses |
138,051 | 144,291 | 124,551 | |||||||||
General and administrative expenses |
27,238 | 29,806 | 28,947 | |||||||||
Depreciation and amortization |
64,196 | 53,582 | 48,311 | |||||||||
Loss on acquisition of land and building |
1,697 | — | — | |||||||||
Net (gain) loss on sale of vessels |
(801 | ) | (702 | ) | (601 | ) | ||||||
Impairment of goodwill |
54,300 | — | — | |||||||||
Total operating expenses |
330,571 | 294,006 | 280,635 | |||||||||
Operating (loss) income |
(65,146 | ) | 36,456 | 45,645 | ||||||||
Interest expense, net |
22,588 | 21,503 | 21,275 | |||||||||
Other expense (income), net |
(535 | ) | 402 | (2,164 | ) | |||||||
Income (loss) before provision for income taxes |
(87,199 | ) | 14,551 | 26,534 | ||||||||
Provision for (benefit of) income taxes |
(218 |
) |
287 |
529 |
||||||||
Net income (loss) |
$ | (86,981 | ) | $ | 14,264 | $ | 26,005 | |||||
Less net income attributable to non-controlling interest |
398 | 317 | 337 | |||||||||
Net income (loss) attributable to K-Sea Transportation Partners L.P. unitholders ("net income (loss) of K-Sea") |
$ | (87,379 | ) | $ | 13,947 | $ | 25,668 | |||||
Allocation of net income (loss) of K-Sea: |
||||||||||||
General partner's interest in net income (loss) of K-Sea |
(916 | ) | 4,474 | 3,311 | ||||||||
Limited partner's interest in net income (loss) of K-Sea |
(86,463 | ) | 9,473 | 22,357 | ||||||||
Net income (loss) of K-Sea |
$ | (87,379 | ) | $ | 13,947 | $ | 25,668 | |||||
Basic net income (loss) of K-Sea per unit |
$ | (4.60 | ) | $ | 0.61 | $ | 1.73 | |||||
Diluted net income (loss) of K-Sea per unit |
$ | (4.60 | ) | $ | 0.61 | $ | 1.73 | |||||
Weighted average units outstanding—basic |
18,802 |
15,569 |
12,939 |
|||||||||
Weighted average units outstanding—diluted |
18,802 | 15,590 | 12,952 | |||||||||
See accompanying notes to consolidated financial statements.
F-5
K-SEA TRANSPORTATION PARTNERS L.P.
CONSOLIDATED STATEMENT OF PARTNERS' CAPITAL
(in thousands)
| |
|
Limited Partners | |
|
|
||||||||||||||||||||
|---|---|---|---|---|---|---|---|---|---|---|---|---|---|---|---|---|---|---|---|---|---|---|---|---|---|
| |
|
Common | Subordinated | Accumulated Other Comprehensive Income |
|
|
|||||||||||||||||||
| |
General Partner |
Non- controlling Interest $ |
|
||||||||||||||||||||||
| |
Units | $ | Units | $ | TOTAL | ||||||||||||||||||||
Balance of Partners' Capital at June 30, 2007 |
$ | 1,962 | 6,819 | $ | 127,164 | 3,124 | $ | 23,002 | $ | 525 | $ | 152,653 | |||||||||||||
Investment in joint venture |
$ | 4,450 | 4,450 | ||||||||||||||||||||||
Issuance of common units under long-term incentive plan |
23 | 725 | 725 | ||||||||||||||||||||||
Conversion of subordinated units to common units, net of tax related adjustments (note 1) |
1,041 | 2,872 | (1,041 | ) | (2,872 | ) | — | ||||||||||||||||||
Fair market value adjustment for interest rate swap contracts, net of taxes of $91 |
(6,720 | ) | (6,720 | ) | |||||||||||||||||||||
Foreign currency translation adjustment |
10 | 10 | |||||||||||||||||||||||
Issuance of common units, net of transaction costs of $6,332 |
3,500 | 131,918 | 131,918 | ||||||||||||||||||||||
Issuance of common units for the Smith Maritime Group |
250 | 11,298 | 11,298 | ||||||||||||||||||||||
Distributions to partners |
(2,968 | ) | (29,076 | ) | (8,330 | ) | (40,374 | ) | |||||||||||||||||
Cash distributions to non-controlling interests |
(268 | ) | (268 | ) | |||||||||||||||||||||
Net income |
3,311 | 17,932 | 4,425 | 337 | 26,005 | ||||||||||||||||||||
Balance of Partners' Capital at June 30, 2008 |
$ | 2,305 | 11,633 | $ | 262,833 | 2,083 | $ | 16,225 | $ | (6,185 | ) | $ | 4,519 | $ | 279,697 | ||||||||||
Issuance of common units under long-term incentive plan |
28 | 983 | 983 | ||||||||||||||||||||||
Amortization of restricted units awards under long term incentive plan |
1,218 | 1,218 | |||||||||||||||||||||||
Issuance of common units, net of costs of $1,795 |
2,000 | 49,805 | 49,805 | ||||||||||||||||||||||
Conversion of subordinated units to common units |
2,083 | 12,104 | (2,083 | ) | (12,104 | ) | — | ||||||||||||||||||
Fair market value adjustment for interest rate swap contracts, net of taxes of $135 |
(10,775 | ) | (10,775 | ) | |||||||||||||||||||||
Foreign currency translation adjustment |
(115 | ) | (115 | ) | |||||||||||||||||||||
Distributions to partners |
(4,549 | ) | (42,420 | ) | (4,811 | ) | (51,780 | ) | |||||||||||||||||
Unit distribution to the General Partner |
50 | 953 | 953 | ||||||||||||||||||||||
Cash distributions to non-controlling interests |
(322 | ) | (322 | ) | |||||||||||||||||||||
Net income |
4,474 | 8,783 | 690 | 317 | 14,264 | ||||||||||||||||||||
Balance of Partners' Capital at June 30, 2009 |
$ | 2,230 | 15,794 | $ | 294,259 | — | — | $ | (17,075 | ) | $ | 4,514 | $ | 283,928 | |||||||||||
Issuance of common units under long- term incentive plan |
39 | 1,291 | 1,291 | ||||||||||||||||||||||
Amortization of restricted units awards under long term incentive plan |
(187 | ) | (187 | ) | |||||||||||||||||||||
Issuance of common units, net of costs of $2,965 |
3,244 | 59,167 | 59,167 | ||||||||||||||||||||||
Fair market value adjustment for interest rate swap contracts, net of taxes of $13 |
(1,018 | ) | (1,018 | ) | |||||||||||||||||||||
Foreign currency translation adjustment |
97 | 97 | |||||||||||||||||||||||
Distributions to partners |
(91 | ) | (22,076 | ) | (22,167 | ) | |||||||||||||||||||
Cash distributions to non-controlling interests |
(323 | ) | (323 | ) | |||||||||||||||||||||
Unit distributions to the General Partner |
50 | 1,202 | 1,202 | ||||||||||||||||||||||
Net income (loss) |
(916 | ) | (86,463 | ) | 398 | (86,981 | ) | ||||||||||||||||||
Balance of Partners' Capital at June 30, 2010 |
$ | 1,223 | 19,127 | $ | 247,193 | — | — | $ | (17,996 | ) | $ | 4,589 | $ | 235,009 | |||||||||||
See accompanying notes to consolidated financial statements.
F-6
K-SEA TRANSPORTATION PARTNERS L.P.
CONSOLIDATED STATEMENTS OF CASH FLOWS
(in thousands)
| |
For the Years Ended June 30 | ||||||||||||
|---|---|---|---|---|---|---|---|---|---|---|---|---|---|
| |
2010 | 2009 | 2008 | ||||||||||
Cash flows from operating activities: |
|||||||||||||
Net income (loss) |
$ | (86,981 | ) | $ | 14,264 | $ | 26,005 | ||||||
Adjustments to reconcile net income (loss) to net cash provided by operating activities: |
|||||||||||||
Depreciation and amortization |
65,908 | 54,564 | 48,820 | ||||||||||
Impairment of goodwill |
54,300 | — | — | ||||||||||
Payment of drydocking expenditures |
(22,139 | ) | (20,986 | ) | (25,908 | ) | |||||||
Change in provision for loss on cancellation of contract |
(500 | ) | 515 | — | |||||||||
Provision for doubtful accounts |
328 | 1,028 | 549 | ||||||||||
Deferred income taxes |
(651 | ) | (114 | ) | 478 | ||||||||
Net gain on sale of vessels |
(801 | ) | (702 | ) | (601 | ) | |||||||
Loss on acquisition of land and building |
1,697 | — | — | ||||||||||
Gain on settlement of legal proceedings |
— | — | (2,073 | ) | |||||||||
Restricted unit compensation costs |
1,104 | 1,324 | 1,156 | ||||||||||
Other |
(63 | ) | (8 | ) | 176 | ||||||||
Changes in assets and liabilities: |
|||||||||||||
Accounts receivable |
(3,715 | ) | 11,243 | (12,248 | ) | ||||||||
Prepaid expenses and other current assets |
653 | 6,322 | (13,437 | ) | |||||||||
Other assets |
(1,354 | ) | (2,210 | ) | 196 | ||||||||
Accounts payable |
(1,670 | ) | (10,948 | ) | 7,957 | ||||||||
Accrued expenses and other current liabilities |
2,152 | 209 | 5,505 | ||||||||||
Deferred revenue |
(471 | ) | (1,743 | ) | 4,200 | ||||||||
Other liabilities |
— | (481 | ) | — | |||||||||
Net cash provided by operating activities |
7,797 | 52,277 | 40,775 | ||||||||||
Cash flows from investing activities: |
|||||||||||||
Vessel acquisitions |
(197 | ) | — | (60,475 | ) | ||||||||
Acquisition of the Smith Maritime Group, net of cash acquired |
— | — | (168,881 | ) | |||||||||
Construction of tank vessels |
(37,675 | ) | (65,189 | ) | (51,987 | ) | |||||||
Other capital expenditures |
(5,460 | ) | (10,069 | ) | (13,282 | ) | |||||||
Acquisition of land and building |
(4,242 | ) | — | — | |||||||||
Proceeds from settlement of legal proceedings |
— | — | 2,073 | ||||||||||
Proceeds on sale of vessels |
5,310 | 29,536 | 2,192 | ||||||||||
Collection of notes receivable from sale of vessels |
2,627 | 340 | — | ||||||||||
Investment in joint venture |
— | — | (1,836 | ) | |||||||||
Net cash used in investing activities |
(39,637 | ) | (45,382 | ) | (292,196 | ) | |||||||
|
|||||||||||||
F-7
K-SEA TRANSPORTATION PARTNERS L.P.
CONSOLIDATED STATEMENTS OF CASH FLOWS (Continued)
(in thousands)
| |
For the Years Ended June 30 | ||||||||||||
|---|---|---|---|---|---|---|---|---|---|---|---|---|---|
| |
2010 | 2009 | 2008 | ||||||||||
Cash flows from financing activities: |
|||||||||||||
Proceeds from credit line borrowings |
200,898 | 224,539 | 309,953 | ||||||||||
Repayment of credit line borrowings |
(196,726 | ) | (250,332 | ) | (240,953 | ) | |||||||
Gross proceeds from equity offering |
62,132 | 51,600 | 138,250 | ||||||||||
Proceeds from long-term debt borrowings |
11,577 | 41,442 | 266,931 | ||||||||||
Payment of term loans |
(16,889 | ) | (20,695 | ) | (171,840 | ) | |||||||
Payment of additional collateral |
(3,075 | ) | — | — | |||||||||
Financing costs paid—equity offerings |
(2,965 | ) | (1,795 | ) | (6,234 | ) | |||||||
Financing costs paid—debt borrowings |
(1,747 | ) | (438 | ) | (3,204 | ) | |||||||
Distributions to non-controlling interest |
(323 | ) | (322 | ) | (268 | ) | |||||||
Distributions to partners |
(20,965 | ) | (50,827 | ) | (40,374 | ) | |||||||
Net cash (used in) provided by financing activities |
31,917 | (6,828 | ) | 252,261 | |||||||||
Cash and cash equivalents: |
|||||||||||||
Net increase |
77 | 67 | 840 | ||||||||||
Balance at beginning of year |
1,819 | 1,752 | 912 | ||||||||||
Balance at end of year |
$ | 1,896 | $ | 1,819 | $ | 1,752 | |||||||
Supplemental disclosure of cash flow information: |
|||||||||||||
Cash paid during the year for: |
|||||||||||||
Interest, net of amounts capitalized |
$ | 20,187 | $ | 20,972 | $ | 21,799 | |||||||
Income taxes |
$ | 61 | $ | 46 | $ | 375 | |||||||
Supplemental disclosure of non-cash investing and financing activities: |
|||||||||||||
Sale of vessels for notes receivable |
$ | 3,516 | |||||||||||
Use of proceeds of sale-leaseback disbursed directly by the purchaser: |
|||||||||||||
Refinancing of term loans with operating lease agreements |
$ | 49,806 | |||||||||||
Lease security deposits |
$ | 3,492 | |||||||||||
Acquisition of the Smith Maritime Group: |
|||||||||||||
Value of common units issued to sellers |
$ | 11,298 | |||||||||||
Debt assumed |
$ | 23,511 | |||||||||||
Purchase of vessel with note payable |
$ | 3,000 | |||||||||||
Issuance of limited partner units under the long-term incentive plan |
$ | 1,291 | $ | 983 | $ | 725 | |||||||
Distribution of units to the general partner |
$ | 1,202 | $ | 953 | |||||||||
See accompanying notes to consolidated financial statements.
F-8
K-SEA TRANSPORTATION PARTNERS L.P.
NOTES TO CONSOLIDATED FINANCIAL STATEMENTS
(dollars in thousands, except unit and per unit amounts)
Note 1: Basis of Presentation
K-Sea Transportation Partners L.P. and its subsidiaries (collectively, the "Partnership") provide marine transportation, distribution and logistics services for refined petroleum products in the United States. On January 14, 2004, the Partnership completed its initial public offering of common units representing limited partner interests and, in connection therewith, also issued to its predecessor companies an aggregate of 4,165,000 subordinated units representing limited partner interests. The Partnership met certain financial tests described in its partnership agreement ("K-Sea Partnership Agreement") for early conversion of the subordinated units and, as a result, 1,041,250, 1,041,250 and 2,082,500 of these subordinated units converted to common units on a one-for-one basis on February 14, 2007, February 14, 2008 and February 16, 2009, respectively.
The Partnership's consolidated statement of partners' capital for the year ended June 30, 2008 includes a reclassification of $4,676 related to the allocation of a deferred tax benefit from common limited partners' capital to subordinated limited partners capital. Such reclassification is included in the line item entitled "Conversion of subordinated units to common units, net of tax related adjustments" in such statement.
The Partnership's general partner, K-Sea General Partner L.P., holds 202,447 general partner units, representing a 1.05% general partner interest in the Partnership as of June 30, 2010 as well as certain incentive distribution rights in the Partnership. Incentive distribution rights represent the right to receive an increasing percentage of cash distributions after the minimum quarterly distribution, and certain target distribution levels have been achieved. The target distribution levels entitle the general partner to receive an additional 13% of total quarterly cash distributions in excess of $0.55 per unit until all unitholders have received $0.625 per unit, an additional 23% of total quarterly cash distributions in excess of $0.625 per unit until all unitholders have received $0.75 per unit, and an additional 48% of total quarterly cash distributions in excess of $0.75 per unit. The Partnership is required to distribute all of its available cash from operating surplus, as defined in its partnership agreement. Additional contributions by the general partner to the Partnership upon issuance of new common units are not mandatory.
In May 2009, the Partnership issued 49,775 limited partner units to the general partner in lieu of $1,244 in cash distributions, effectively $25.00 per unit for the distribution declared for the quarter ended March 31, 2009. In August 2009, the Partnership issued 49,908 limited partner units to the general partner in lieu of $1,248 in cash distributions, effectively $25.00 per unit for the distribution declared for the quarter ended June 30, 2009. Future such issuances in lieu of cash distributions will be considered by the Board of Directors of the general partner of K-Sea General Partner L.P. at the time future distributions are considered.
Note 2: Summary of Significant Accounting Policies
The FASB Codification. In June 2009, the Financial Accounting Standards Board ("FASB") issued "The FASB Codification and the Hierarchy of Generally Accepted Accounting Principles", an accounting standards codification ("ASC" or the "Codification"), which is effective for financial statements issued for interim and annual periods ending after September 15, 2009. On the effective date the Codification superseded all then existing non-SEC accounting and reporting standards and became the source of authoritative U.S. generally accepted accounting principles. The adoption of this standard by the Partnership on July 1, 2009 did not have an effect on the accompanying consolidated
F-9
K-SEA TRANSPORTATION PARTNERS L.P.
NOTES TO CONSOLIDATED FINANCIAL STATEMENTS (Continued)
(dollars in thousands, except unit and per unit amounts)
Note 2: Summary of Significant Accounting Policies (Continued)
financial statements. The ASC consists of topics, subtopics, sections and paragraphs. Certain accounting policies described below reference relevant ASC topic, subtopic, etc.
Basis of Consolidation. These consolidated financial statements are for the Partnership and its wholly owned subsidiaries. All material inter-company transactions and balances have been eliminated in consolidation.
During fiscal 2008, the Partnership acquired a 50% interest in a joint venture formed to own and charter a tank barge. The joint venture is a single asset leasing entity and is considered a variable interest entity as such term is defined by the FASB. The joint venture as lessor of the asset loses the right to exercise residual power over the asset during the term of the lease (bareboat charter agreement). The Partnership is the lessee under the bareboat charter agreement, which includes renewal options that result in the Partnership having greater decision making over the asset for substantially all of its useful life and consequently greater economic interest. As a result, the Partnership is deemed the primary beneficiary of the variable interest entity requiring consolidation of the variable interest entity in the accompanying financial statements. The joint venture has a term loan, which matures on October 1, 2012, that is collateralized by the related tank barge. The Partnership is not required to provide financial support to the joint venture, other than what is required in the normal course of business pertaining to the bareboat charter agreement. Creditors of the joint venture have no recourse to the general credit of the Partnership. The current and non-current portions of such borrowings are included in current portion of long-term debt and term loans and capital lease obligation, respectively, on the consolidated balance sheets.
Non-controlling Interests in Consolidated Financial Statements. In December 2007, the FASB issued a new accounting standard relating to non-controlling interests in consolidated financial statements. This standard established accounting and reporting standards for the non-controlling interest in a subsidiary and for the deconsolidation of a subsidiary. These accounting and reporting standards require for-profit entities that prepare consolidated financial statements to: (a) present non-controlling interests as a component of equity, separate from the parent's equity; (b) separately present the amount of consolidated net income attributable to non-controlling interests in the income statement; (c) consistently account for changes in a parent's ownership interests in a subsidiary in which the parent entity has a controlling financial interest as equity transactions; (d) require an entity to measure at fair value its remaining interest in a subsidiary that is deconsolidated; and (e) require an entity to provide sufficient disclosures that identify and clearly distinguish between interests of the parent and interests of non-controlling owners.
On July 1, 2009, the Partnership adopted this new standard. Accordingly, for periods presented in these consolidated financial statements, the Partnership has reclassified its non-controlling interest liability into partners' capital in the consolidated balance sheets and has separately presented income attributable to non-controlling interests on the consolidated statements of operations. The net income attributable to the K-Sea Transportation Partners L.P. unitholders is reported as "Net income (loss) of K- Sea" in the consolidated statements of operations.
Currency Translation. Assets and liabilities related to the Partnership's Canadian subsidiary are translated at the exchange rate prevailing on the balance sheet date, and revenues and expenses are
F-10
K-SEA TRANSPORTATION PARTNERS L.P.
NOTES TO CONSOLIDATED FINANCIAL STATEMENTS (Continued)
(dollars in thousands, except unit and per unit amounts)
Note 2: Summary of Significant Accounting Policies (Continued)
translated at the weighted average exchange rate for the period. The resulting translation gain or loss is reflected in partners' capital as a component of accumulated other comprehensive income.
Use of Estimates. The preparation of financial statements in conformity with generally accepted accounting principles requires management to make estimates and assumptions that affect the reported amounts of assets and liabilities and disclosures of contingent assets and liabilities at the date of the financial statements, and revenues and expenses during the reporting period. The most significant estimates relate to depreciation of the vessels and equipment, amortization of drydocking costs, estimates used in assessing the recoverability of goodwill, intangible and other long lived assets, liabilities incurred from workers' compensation, commercial and other claims, the allowance for doubtful accounts and deferred income taxes. Actual results could differ from these estimates.
Cash and Cash Equivalents. The Partnership considers all highly liquid investments with original maturities of three months or less to be cash equivalents.
Concentrations of Credit Risk. Financial instruments which potentially subject the Partnership to concentrations of credit risk are primarily cash and cash equivalents and trade accounts receivable. The Partnership maintains its cash and cash equivalents on deposit at a financial institution in amounts that, at times, may exceed insurable limits.
There was one customer that accounted for 10% of consolidated accounts receivable at June 30, 2010 and two customers that accounted for 18% and 13% of consolidated accounts receivable at June 30, 2009. Two customers accounted for 16% and 11% of consolidated total revenues for the fiscal year ended June 30, 2010. Two customers accounted for 20% and 11% of consolidated total revenues for the fiscal year ended June 30, 2009. Three customers accounted for 16%, 12% and 11% of consolidated total revenues for the fiscal year ended June 30, 2008.
With respect to accounts receivable, the Partnership extends credit based upon an evaluation of a customer's financial condition and generally does not require collateral. The Partnership's allowance for doubtful accounts totaling $1,496 and $1,264 at June 30, 2010 and 2009, respectively, is based on the Partnership's best estimate of the amount of probable credit losses in the Partnership's existing accounts receivable. The Partnership does not believe it is exposed to concentrations of credit risk that are likely to have a material adverse effect on its financial position, results of operations or cash flows. For the fiscal years ended June 30, 2010, 2009 and 2008, the Partnership's allowance for doubtful amounts was impacted by additional charges of $328, $1,028 and $549, and write-offs of $96, $1,733 and ($7), respectively.
Insurance Claims Receivable. Insurance claims receivable, which are included in prepaid expenses and other current assets, represent claims for reimbursement of expenses incurred that have been made under the Partnership's hull and machinery, and protection and indemnity coverages. The Partnership records the probable amount that it expects to recover from insurance net of the applicable deductible (See note 13).
Fuel Supplies. Fuel used to operate the Partnership's vessels, and on hand at the end of the period, is recorded at cost. Such amounts totaled $4,595 and $4,291 as of June 30, 2010 and 2009,
F-11
K-SEA TRANSPORTATION PARTNERS L.P.
NOTES TO CONSOLIDATED FINANCIAL STATEMENTS (Continued)
(dollars in thousands, except unit and per unit amounts)
Note 2: Summary of Significant Accounting Policies (Continued)
respectively, and are included in prepaid expenses and other current assets in the consolidated balance sheets.
Vessels and Equipment—including Changes in Accounting Estimates. Vessels and equipment are recorded at cost, which includes contract price, capitalized interest where appropriate and other direct costs relating to acquiring and placing the vessels in service. Vessels and equipment are depreciated using the straight-line method over the estimated useful lives of the individual assets. In assessing the appropriateness of the useful lives and salvage values of its vessels, the Partnership considers growth in the fleet, changes in its composition, as well as other information.
During fiscal year 2009, the Partnership concluded, based on its accumulated data on useful lives and the planned future use of its vessels, as well as a review of industry data, that its assets are fully operative and economic for periods greater than those previously used for book depreciation purposes. Accordingly, effective July 1, 2008, the Partnership prospectively increased the estimated useful lives of double-hulled tank barges and tugboats to a range of ten to thirty years, from the previous ranges of ten to twenty five years and ten to twenty years, respectively, and increased salvage values for double-hulled tank barges. These changes in accounting estimates increased operating income and net income by $6,405 and $6,326, respectively, and net income per fully diluted limited partner unit by $0.40, for the fiscal year ended June 30, 2009.
For single-hull tank vessels, useful lives are limited to the remaining period of operation prior to mandatory retirement as required by the Oil Pollution Act of 1990 ("OPA 90"). OPA 90 requires that the 11 (including three chartered-in) single-hull vessels operated by the Partnership as of June 30, 2010, representing approximately 11% of total barrel-carrying capacity, be retired or retrofitted to double-hull by January 1, 2015. During the fiscal year ended June 30, 2010 the Partnership determined that it would phase out certain of its single hull vessels prior to their OPA 90 retirement dates. See note 6 for further information.
The expiration of long-term contracts over the course of the year has resulted in increased double-hull availability within the industry. In addition, the customer preference for double-hull vessels has intensified, resulting in the commercial obsolescence of single-hull equipment. As a result, the Partnership identified a triggering event requiring an impairment review of all of its long lived assets and long lived asset groups as of June 30, 2010. As a result in the fourth quarter of fiscal year 2010 an additional impairment charge of $4,213 was recorded for relating to eight tug boats, two single hull vessels and one small vessel used to support activities in Hawaii.
Included in vessels and equipment are drydocking expenditures that are capitalized and amortized over three years based on regulatory drydocking requirements. Drydocking of vessels is required both by the United States Coast Guard and by the applicable classification society, which in the Partnership's case is the American Bureau of Shipping. Such drydocking activities include, but are not limited to, the inspection, refurbishment and replacement of steel, engine components, tail shafts, mooring equipment and other parts of the vessel.
Major renewals and betterments of assets are capitalized and depreciated over the remaining useful lives of the assets. Leasehold improvements are capitalized and depreciated over the shorter of their useful lives or the remaining term of the lease. Maintenance and repairs that do not improve or extend the useful lives of the assets are expensed.
F-12
K-SEA TRANSPORTATION PARTNERS L.P.
NOTES TO CONSOLIDATED FINANCIAL STATEMENTS (Continued)
(dollars in thousands, except unit and per unit amounts)
Note 2: Summary of Significant Accounting Policies (Continued)
The Partnership assesses impairment of long-lived assets used in operations when indicators of impairment are present. An impairment loss would be recognized if the undiscounted cash flows estimated to be generated by those assets are less than the assets' carrying amounts, and to the extent the carrying value exceeds fair value by appraisal.
When property items are retired, sold or otherwise disposed of, the related cost and accumulated depreciation are removed from the accounts with any gain or loss on the dispositions included in income. Assets to be disposed of are reported at the lower of their carrying amounts or fair values, less the estimated costs of disposal.
Construction in Progress. Construction in progress comprises expenditures relating to the Partnership's newbuild program which is described in note 6. Construction in progress is recorded at cost, including capitalized interest where appropriate. The Partnership capitalizes direct and indirect costs clearly associated with the development, design, and construction of new vessels as these costs have a future benefit. Costs include installments paid to the shipyard, payments made to third parties in connection with the vessel newbuild program, and interest costs incurred during the construction period, which is defined as the period from the start of construction until the date that each vessel is substantially complete and ready for use. In August 2010, the Partnership sold the DBL 34 for $2,290, net of commission and escrow agent fees. As the asset was held for sale as of June 30, 2010, the Partnership recorded a construction in progress impairment charge of $861 reflecting the difference in the purchase commitment cost and the net proceeds expected upon sale.
Leases. Leases are classified as either capital or operating. Those leases that transfer substantially all the benefits and risks of ownership of property to the Partnership are accounted for as capital leases. All other leases are accounted for as operating leases. Rental expense for leases classified as operating and that contain predetermined fixed increases of minimum rentals during the term of the lease is recognized on a straight-line basis over the life of the lease, beginning with the point at which the Partnership obtains control and possession of the leased properties.
Deferred Financing Costs. Direct costs associated with obtaining long-term financing are deferred and amortized over the terms of the related financings. Deferred financing costs are stated net of accumulated amortization of $1,799 and $1,515, at June 30, 2010 and 2009, respectively.
Goodwill. Goodwill represents the excess of the purchase price over the fair value of the net assets of the acquired business at the date of the acquisition. GAAP requires that goodwill be tested for impairment on an annual basis and more frequently if an event occurs or circumstances change that would more likely than not reduce the fair value of the reporting unit below its carrying value. The Partnership tests for impairment at least annually using a two-step process. The first step identifies potential impairment by comparing the fair value of a reporting unit with its book value, including goodwill. If the fair value of the reporting unit exceeds the carrying amount, goodwill is not impaired and the second step is not necessary. If the carrying value exceeds the fair value, the second step calculates the possible impairment loss by comparing the implied fair value of goodwill with the carrying amount. If the implied fair value of goodwill is less than the carrying amount, a write-down is recorded.
F-13
K-SEA TRANSPORTATION PARTNERS L.P.
NOTES TO CONSOLIDATED FINANCIAL STATEMENTS (Continued)
(dollars in thousands, except unit and per unit amounts)
Note 2: Summary of Significant Accounting Policies (Continued)
In June 2010, management considered whether or not events or changes in circumstances indicated that the carrying amount of its goodwill may not be recoverable. As a result of the continued U.S. economic downturn, contracts not being renewed increasing the Partnership's dependency on the voyage charter market resulting in reductions to the Partnership's revenue, operating income, and cash flow forecasts, and a significant sustained decline in the Partnership's market capitalization, the Partnership determined that such factors were indicative of a triggering event requiring an interim impairment analysis as of June 30, 2010. All of the Partnership's goodwill relates to the Pacific region reporting unit. The result of the Partnership's analysis indicated that goodwill attributable to the Pacific region reporting unit is fully impaired. Accordingly, the Partnership recorded an impairment charge of $54,300 relating to the goodwill associated with its Pacific region reporting unit during the three months and year ended June 30, 2010. As a result of the goodwill impairment adjustment, the Partnership has written off the goodwill of the Pacific region reporting unit (See note 5).
Intangible Assets. Included in other assets are intangible assets acquired as part of business combinations or asset acquisitions which are recorded at fair value at their acquisition date and are amortized on a straight-line basis over their estimated useful lives. The Partnership reviews intangible assets to evaluate whether events or changes have occurred that would suggest an impairment of carrying value. An impairment charge would be recognized when expected undiscounted future operating cash flows are lower than the carrying value, and to the extent the carrying value exceeds fair value.
Derivative instruments. In March 2008 the FASB issued an amendment to an accounting standard that required qualitative disclosure about objectives and strategies for using derivatives, quantitative disclosures about fair value amounts and gains and losses in derivative instruments and disclosures about credit-risk related contingent features in derivative agreements. The Partnership adopted the accounting standard effective January 1, 2009 and includes the required disclosures in the notes to the consolidated financial statements.
The Partnership utilizes derivative financial instruments to reduce interest rate risks. The Partnership does not hold or issue derivative financial instruments for trading purposes. The Partnership accounts for its derivative financial instruments in accordance with ASC 815 which requires that an entity recognize all derivative financial instruments as either assets or liabilities, depending on the rights or obligations under the contract. Derivative financial instruments are measured at fair value. Changes in the fair value (gains or losses) of those derivative financial instruments are reported in earnings or other comprehensive income depending on the use of the derivative and whether it qualifies for hedge accounting. The accounting for gains and losses associated with changes in the fair value of the derivative will depend on the hedge designation and whether the hedge is highly effective in achieving offsetting changes in fair value of cash flows of the asset or liability hedged.
The Partnership enters into interest rate swap contracts to hedge its exposure to variability in expected future cash flows relating to interest payments associated with the Partnership's floating- rate borrowings. These swap contracts have been designated as cash flow hedges. A derivative financial instrument qualifies for cash flow hedge accounting if it meets criteria specified by ASC 815 which includes among others a) that the forecasted transaction is specifically identified, b) its occurrence is probable and c) the forecasted transaction is a transaction with a party external to the reporting entity.
F-14
K-SEA TRANSPORTATION PARTNERS L.P.
NOTES TO CONSOLIDATED FINANCIAL STATEMENTS (Continued)
(dollars in thousands, except unit and per unit amounts)
Note 2: Summary of Significant Accounting Policies (Continued)
The effective portion of the cash flow hedge's gain or loss is initially reported as a component of other comprehensive income and subsequently reclassified into earnings when the forecasted transaction affects earnings. Assessing hedge effectiveness includes an evaluation of whether or not critical terms of the derivative and the hedged item are the same (i.e. size, reset and payment dates, market conventions, etc.). The ineffective portion of the gain or loss is reported in earnings immediately. Based on the characteristics of each interest rate swap contract and its related floating rate borrowing the Partnership uses either the "matched terms" accounting method or alternative methods when the "matched term" shortcut method is not applied, as provided by the guidance described in ASC 815.
Revenue Recognition—Related Expenses. The Partnership earns revenue under contracts of affreightment, voyage charters, time charters and bareboat charters. For contracts of affreightment and voyage charters, revenue is recognized based upon the relative transit time in each period, with expenses recognized as incurred. The Partnership is responsible for the voyage expenses, including fuel and other expenses which are unique to a particular voyage, such as port charges, pilot fees, tank cleaning costs and canal tolls, and the vessel operating expenses such as wages paid to vessel crews, routine maintenance and repairs, marine insurance, and outside towing. Although contracts of affreightment and certain voyage charters may be effective for a period in excess of one year, revenue is recognized over the transit time of individual voyages, which are generally less than ten days in duration. For time charters and bareboat charters, revenue is recognized ratably over the contract period, with expenses recognized as incurred. For time charters the Partnership is responsible for vessel operating expenses, while the customer is responsible for the voyage expenses. For bareboat charters, the customer is responsible for both the vessel operating expenses and the voyage expenses. Estimated losses on contracts of affreightment and charters are accrued when such losses become evident.
Deferred revenue. Deferred revenue arises in the normal course of business from advance billings under charter agreements. Revenue is recognized ratably over the contract period.
Income Taxes. The Partnership's effective tax rate comprises the New York City Unincorporated Business Tax and foreign taxes on its operating partnership, plus federal, state, local and foreign corporate income taxes on the income of the operating partnership's corporate subsidiaries.
Deferred taxes represent the tax effects of differences between the financial reporting and tax bases of the Partnership's assets and liabilities, as applicable, at enacted tax rates in effect for the years in which the differences are expected to reverse. The recoverability of deferred tax assets is evaluated and a valuation allowance established when it is more likely than not that some portion or all of the deferred tax assets will not be realized.
The Partnership records tax related interest and penalties as interest expense and general and administrative expenses, respectively.
Unit-Based Compensation. The Partnership has adopted a long-term incentive plan ("LTIP") that permits the granting of awards to directors and employees in the form of restricted units and unit options. The Partnership recognizes compensation cost for the restricted units on a straight-line basis over the vesting periods of the awards, which range from approximately three to five years. No unit options have been granted.
F-15
K-SEA TRANSPORTATION PARTNERS L.P.
NOTES TO CONSOLIDATED FINANCIAL STATEMENTS (Continued)
(dollars in thousands, except unit and per unit amounts)
Note 2: Summary of Significant Accounting Policies (Continued)
Net Income per Unit. In May 2008, the FASB issued a new accounting standard relating to the application of the two-class method for calculating earnings per unit to master limited partnerships. This new accounting standard considers the difference between net income and distributions when calculating earnings per unit. On July 1, 2009, the Partnership adopted this new accounting standard, which is required to be applied retrospectively for all periods presented. The Partnership's former practice was to calculate earnings per limited partner unit based solely upon the net income available to the limited partners after deducting the general partner's interest in net income. Under the new accounting standard, the difference between net income and distributions that have been or will be made for the reporting period is allocated to the limited partners and general partner before the earnings per limited partner unit is calculated. Therefore, the new practice gives effect to any special allocations, including incentive distributions to our IDR holder (general partner), which are declared and paid following the close of each quarter. If there is an excess of distributions over net income, such difference is allocated to the general partner and limited partners of an entity based on their respective sharing of losses specified in the entity's partnership agreement for the period presented. The K-Sea Partnership Agreement contractually limits the sharing of losses to the general partner (units) and the limited partner (units) and therefore, the excess of distributions over net income is not allocated to the IDR holder.
If there are undistributed earnings they are allocated to the general partner and the limited partners of an entity utilizing the contractual terms of the entity's partnership agreement. If distributions are contractually limited to the IDR holder's share of currently designated available cash for distributions as defined under the entity's partnership agreement, undistributed earnings in excess of available cash are not to be allocated to the IDR holder. The K-Sea Partnership Agreement contractually limits its distributions to Available Cash (as defined in the agreement), and, therefore, undistributed earnings, if any, are not allocated to the IDR holder (general partner).
Accordingly, the effect of adopting this accounting standard impacts the Partnership's presentation of earnings per unit in periods when distributions exceed net income as the reported earnings per limited partner unit will be lower than under the Partnership's former practice. These differences will be material for those periods where there are material differences between the Partnership's net income and the distributions it has or will pay with respect to such period.
In June 2008, the FASB issued a new accounting standard relating to determining whether instruments granted in share-based payment transactions are considered participating securities under the two-class method of calculating basic and diluted earnings per unit. On July 1, 2009, the Partnership adopted the provisions of this new accounting standard, which is also required to be applied retrospectively for all periods presented. This new standard affects entities that accrue or pay cash distributions on share-based payment awards during the awards' service period when the cash distributions are not required to be returned if the employees forfeit the unvested award. This new standard requires that all outstanding unvested share-based payment awards that contain rights to non- forfeitable cash distributions participate in undistributed earnings with common unitholders and are considered participating securities. Certain of the Partnership's share-based awards under its LTIP include rights to non-forfeitable distribution equivalent rights ("DER"). Based on the requirements of this new accounting standard, the Partnership included such outstanding unvested awards with DER in the calculation of basic weighted average limited partner units outstanding. Previously, such outstanding
F-16
K-SEA TRANSPORTATION PARTNERS L.P.
NOTES TO CONSOLIDATED FINANCIAL STATEMENTS (Continued)
(dollars in thousands, except unit and per unit amounts)
Note 2: Summary of Significant Accounting Policies (Continued)
unvested awards with DER, if dilutive, were included in the calculation of diluted weighted average limited partner units outstanding. The adoption of this standard decreased the basic net income per unit previously reported for the years ended June 30, 2009 and 2008 by $0.01 and $0.02, respectively.
Under these new accounting standards, for the accounting periods included in this report, the allocation of net income between our general partner and limited partners was as follows:
| |
Years Ended June 30, | ||||||||||||
|---|---|---|---|---|---|---|---|---|---|---|---|---|---|
| |
2010 | 2009 | 2008 | ||||||||||
Net income (loss) of K-Sea |
$ | (87,379 | ) | $ | 13,947 | $ | 25,668 | ||||||
Less distributions paid |
(8,727 |
) |
(53,819 |
) |
(44,592 |
) |
|||||||
Undistributed earnings (loss)/distributions in excess of earnings |
$ | (96,106 | ) | $ | (39,872 | ) | $ | (18,924 | ) | ||||
Allocation of net income (loss) of K-Sea |
|||||||||||||
Limited partner allocation: |
|||||||||||||
Cash distributions (98.95%, 98.73% and 98.55% equity ownership, as of June 30, 2010, 2009 and 2008, respectively) |
$ | 8,636 | $ | 48,838 | $ | 41,007 | |||||||
Allocation of undistributed earnings (loss)/distributions in excess of earnings |
(95,099 | ) | (39,365 | ) | (18,650 | ) | |||||||
Net income (loss) of K-Sea allocated to limited partners |
$ | (86,463 | ) | $ | 9,473 | $ | 22,357 | ||||||
General partner allocation: |
|||||||||||||
Cash distribution (1.05%, 1.27% and 1.45% equity ownership, as of June 30, 2010, 2009 and 2008, respectively) |
$ | 91 | $ | 623 | $ | 605 | |||||||
Allocation of undistributed earnings (loss)/distributions in excess of earnings |
(1,007 | ) | (506 | ) | (274 | ) | |||||||
Cash distribution IDR |
— | 4,357 | 2,980 | ||||||||||
Net income (loss) of K-Sea allocated to general partner |
$ | (916 | ) | $ | 4,474 | $ | 3,311 | ||||||
On July 1, 2009, the Partnership adopted this new accounting standard, which is required to be applied retrospectively for all periods presented. The difference between the amounts of net income (loss) of K-Sea allocated to the limited and general partners and the related earnings per unit calculation under the new accounting standard and our previous accounting methodology for the years ended June 30, 2009 and 2008 is a reduction of $4,293 and $2,906, respectively, in the amount of net income of K-Sea allocated to the limited partners, a decrease of $0.28 and $0.24 in basic net income per limited partner unit and $0.27 and $0.22 in diluted net income per limited partner unit, respectively.
Distributions per Unit. Distributions to limited partners were $0.45, $3.08 and $2.92 per unit for the years ended June 30, 2010, 2009 and 2008, respectively.
Accumulated Comprehensive Income (Loss). Included within accumulated other comprehensive income (loss) for the Partnership are adjustments related to foreign currency translation and fair value adjustments relating to interest rate swap agreements classified as cash flow hedges, net of the related
F-17
K-SEA TRANSPORTATION PARTNERS L.P.
NOTES TO CONSOLIDATED FINANCIAL STATEMENTS (Continued)
(dollars in thousands, except unit and per unit amounts)
Note 2: Summary of Significant Accounting Policies (Continued)
tax. Total comprehensive income (loss) for the years ended June 30, 2010, 2009 and 2008 is presented in note 3.
Other Adopted Accounting Standards.
Fair Value Measurements. In September 2006, the FASB issued a new accounting standard for fair value measurements which defined fair value, established a framework for measuring fair value in generally accepted accounting principles and expanded disclosures about fair value measurements. The FASB, however, delayed the effective date of the new accounting standard for fair value measurements for all nonfinancial assets and nonfinancial liabilities that are recognized or disclosed at fair value in the financial statements on a nonrecurring basis ("nonrecurring measurements") to fiscal years beginning after November 15, 2008. The Partnership adopted the fair value measurement standard on July 1, 2008 except for nonrecurring measurements. The Partnership adopted this standard as it relates to nonrecurring measurements on July 1, 2009. The adoption of this standard by the Partnership on July 1, 2009 resulted in additional fair value measurement disclosures relating to long lived assets in the accompanying consolidated financial statements.
In August 2009, the FASB issued changes to fair value accounting for liabilities. These changes clarify existing guidance that in circumstances in which a quoted price in an active market for the identical liability is not available, an entity is required to measure fair value using either a valuation technique that uses a quoted price of either a similar liability or a quoted price of an identical or similar liability when traded as an asset, or another valuation technique that is consistent with the principles of fair value measurements, such as an income approach (e.g., present value technique). This guidance also states that both a quoted price in an active market for the identical liability and a quoted price for the identical liability when traded as an asset in an active market when no adjustments to the quoted price of the asset are required are Level 1 fair value measurements. The Partnership's adoption of this clarification of existing guidance on October 1, 2009 did not have an effect of the accompanying consolidated financial statements.
Note 3: Other Comprehensive Income (Loss)
Total comprehensive income (loss) for the year ended June 30, 2010, 2009 and 2008 were as follows:
| |
2010 | 2009 | 2008 | |||||||||
|---|---|---|---|---|---|---|---|---|---|---|---|---|
Net income (loss) |
$ | (86,981 | ) | $ | 14,264 | $ | 26,005 | |||||
Other comprehensive income (loss): |
||||||||||||
Fair market value adjustment for interest rate swaps, net of taxes (note 8) |
(1,018 | ) | (10,775 | ) | (6,720 | ) | ||||||
Foreign currency translation gain (loss) |
97 | (115 | ) | 10 | ||||||||
Total other comprehensive income (loss) |
(921 | ) | (10,890 | ) | (6,710 | ) | ||||||
Total comprehensive income (loss) |
(87,902 | ) | 3,374 | 19,295 | ||||||||
Less comprehensive income attributable to non-controlling interest |
398 | 317 | 337 | |||||||||
Comprehensive income (loss) attributable to K-Sea unitholders |
$ | (88,300 | ) | $ | 3,057 | 18,958 | ||||||
F-18
K-SEA TRANSPORTATION PARTNERS L.P.
NOTES TO CONSOLIDATED FINANCIAL STATEMENTS (Continued)
(dollars in thousands, except unit and per unit amounts)
Note 4: Acquisitions
The Smith Maritime Group
On August 14, 2007, the Partnership, through certain wholly owned subsidiaries, completed the acquisition of all of the equity interests in Smith Maritime, Ltd., Go Big Chartering, LLC and Sirius Maritime, LLC (collectively, the "Smith Maritime Group"). This transaction is part of the Partnership's business strategy to expand its fleet through strategic and accretive acquisitions. The Smith Maritime Group provides marine transportation and logistics services to major oil companies, oil traders and refiners in Hawaii and along the West Coast of the United States. The aggregate purchase price was $203,690. As further described in note 7 below, the Partnership financed the cash portion of the purchase through additional borrowings under its revolving loan agreement and a bridge loan.
Under the purchase method of accounting, for fiscal year 2008, the Partnership has included the Smith Maritime Group's results of operations from August 14, 2007, the acquisition date, through June 30, 2008. The aggregate recorded purchase price of $203,690 consisted of $168,881 of cash, including $1,496 of direct expenses, $23,511 of assumed debt, and $11,298 representing 250,000 common units valued at their average market value during the five-day period surrounding the announcement of the definitive agreement. The Partnership allocated the purchase price to the tangible assets, intangible assets, and liabilities acquired based on their fair values. The purchased identifiable intangible assets are being amortized on a straight-line basis over their respective estimated useful lives. The excess of the purchase price over the fair value of the acquired net assets has been recorded as goodwill, which is not amortized but is reviewed at least annually for impairment. (See note 5) Such purchase price was in excess of the net assets acquired because the Partnership believed that the cash flows generated from the acquired business will be accretive. The Partnership's allocation of the purchase price is as follows:
Current assets |
$ | 8,229 | |||
Vessels and equipment, net |
158,660 | ||||
Intangible assets |
20,115 | ||||
Goodwill |
37,915 | ||||
Other assets |
9 | ||||
|
224,928 | ||||
Liabilities and capital lease obligations |
21,238 | ||||
Total purchase price |
$ | 203,690 | |||
The identifiable intangible assets purchased in the acquisition include customer relationships and covenants not to compete, valued at $17,400 which is being amortized over 20 years and $100 which is being amortized over 3 years, respectively, (see note 5). The acquisition also included an option to purchase a 50% interest in a tank barge, at less than fair market value, which resulted in recognition of an intangible asset of $2,615 at the acquisition date. Upon exercise of the option in October 2007, the Partnership obtained a 50% interest in a joint venture, which joint venture is considered a variable interest entity and is consolidated in the accompanying financial statements. The amount of goodwill that is deductible for tax purposes over 15 years is $24,415.
The consolidated balance sheets reflect $4,589 and $4,514 as of June 30, 2010 and 2009, respectively, for the non-controlling interest in this joint venture. The joint venture has a term loan,
F-19
K-SEA TRANSPORTATION PARTNERS L.P.
NOTES TO CONSOLIDATED FINANCIAL STATEMENTS (Continued)
(dollars in thousands, except unit and per unit amounts)
Note 4: Acquisitions (Continued)
which matures on October 1, 2012, that is collateralized by the related tank barge. The carrying value of the tank barge is $10,789 and $11,263 at June 30, 2010 and 2009, respectively and is included in vessels and equipment on the consolidated balance sheet. Borrowings outstanding on this term loan at June 30, 2010 and 2009 were $1,622 and $2,245, respectively. The current and non-current portions of such borrowings are included in current portion of long-term debt and term loans and capital lease obligation, respectively, on the consolidated balance sheets.
Pro Forma Financial Information
The unaudited pro forma financial information for the fiscal year ended June 30, 2008 combines the historical results of the Partnership with the historical results of the Smith Maritime Group for the period preceding the August 14, 2007 acquisition. The unaudited financial information in the table below summarizes the combined results of operations of the Partnership and the Smith Maritime Group, on a pro forma basis, as though the acquisition had been completed as of the beginning of the period presented. This pro forma financial data is presented for information purposes only and is not necessarily indicative of the results of operations that would have been achieved had the acquisition actually taken place at July 1, 2007.
| |
For the Year Ended June 30, 2008 |
|||
|---|---|---|---|---|
| |
(unaudited) |
|||
Revenues |
$ | 332,618 | ||
Net income |
$ | 27,636 | ||
Basic net income per limited partner unit |
$ | 1.77 | ||
Fully diluted net income per limited partner unit |
$ | 1.76 | ||
Effective July 1, 2009, the Partnership adopted the provisions of a new accounting standard, relating to determining whether instruments granted in share-based payment transactions are considered participating securities under the two-class method of calculating basic and diluted earnings per unit, which was also required to be applied retrospectively for all periods presented. The difference between the unaudited proforma earnings per unit calculation under the new accounting standard and our previous accounting methodology for the fiscal year ended June 30, 2008 is a decrease of $0.22 in basic net income per limited partner unit and a decrease of $0.21 in diluted net income per limited partner unit.
Note 5: Goodwill and Intangible Assets
ASC 350 requires that goodwill be tested for impairment at the reporting unit level on an annual basis and more frequently if an event occurs or circumstances change that would more likely than not reduce the fair value of the reporting unit below its carrying value. In conjunction with a long-lived asset impairment charge recorded in the first quarter of fiscal year 2010 the Partnership performed a test for goodwill impairment at September 30, 2009. The Partnership's annual test for impairment was performed during the second quarter (as of October 31) of its fiscal year. Both impairment tests indicated there was no impairment of goodwill.
F-20
K-SEA TRANSPORTATION PARTNERS L.P.
NOTES TO CONSOLIDATED FINANCIAL STATEMENTS (Continued)
(dollars in thousands, except unit and per unit amounts)
Note 5: Goodwill and Intangible Assets (Continued)
The Partnership operates in a single operating segment. It has two reporting units consisting of its Atlantic region and Pacific region operations. All of the Partnership's goodwill relates to the Pacific region reporting unit. As a result of the continued U.S. economic downturn, contracts not being renewed increasing the Partnership's dependency on the voyage charter market resulting in reductions to the Partnership's revenue, operating income, and cash flow forecasts, and a significant sustained decline in the Partnership's market capitalization, the Partnership determined that such factors were indicative of a triggering event requiring an interim impairment analysis as of June 30, 2010.
Goodwill impairment testing is a two-step process. Step 1 involves comparing the fair value of the Partnership's reporting unit to its carrying amount. If the fair value of the reporting unit is greater than its carrying amount, there is no impairment. If the reporting unit's carrying amount is greater than the fair value, the second step must be completed to determine the impairment loss, if any. Step 2 calculates the implied fair value of goodwill by deducting the fair value of all tangible and intangible assets, excluding goodwill, of the reporting unit from the fair value of the reporting unit as determined in Step 1. The implied fair value of goodwill determined in this step is compared to the carrying value of goodwill. If the implied fair value of goodwill is less than the carrying value of goodwill, an impairment loss is recognized equal to the difference. The result of the Partnership's analysis indicated that goodwill attributable to the Pacific region reporting unit is fully impaired. Accordingly, the Partnership recorded an impairment charge of $54,300 relating to the goodwill associated with its Pacific region reporting unit during the three months and year ended June 30, 2010.
Historically, the Partnership has used an income approach based on the present value of estimated future cash flows. The Partnership believes that the income approach is appropriate due to the long term nature of the Partnership's time charters, consecutive voyage charters, contracts of affreightment and bareboat charters, which are generally for periods of one year or more and generally contain renewal options. The Partnership assesses the reasonableness of its approach by consideration of current trading multiples for peer companies. The Partnership used its business plans and projections as the basis for expected future cash flows for purposes of the annual impairment test as of October 31, 2009. Inherent in the development of the cash flow projections prepared as of October 31, 2009 were assumptions and estimates derived from a review of operating results for fiscal 2009 and the first quarter of fiscal 2010, approved business plans, expected growth rates (which considered both existing contracts and contracts relating to the Partnership's newbuild program vessels), cost of capital and tax rates.
For purposes of the interim impairment test as of June 30, 2010, the Partnership used its fiscal year 2011 business plan as the basis for expected future cash flows. Inherent in the development of the updated cash flow projections are assumptions and estimates derived from a review of operating results for fiscal 2010. During the fiscal years ended June 30, 2010 and 2009, approximately 83% and 95% of the Pacific region reporting unit's revenue was derived from long term contracts. As the percentage of revenue associated with long term contracts declines, the Partnership's revenue is subject to a higher degree of volatility. Vessels operating under single voyage charters, which are generally priced at prevailing market rates, have the potential to generate decreased profit margins during periods of economic downturn and increased profit margins during periods of improved charter rates, while vessels operating on long term time charters generally provide more predictable cash flow. Increased dependence on the voyage charter market could result in a lower utilization of the Partnership's vessels
F-21
K-SEA TRANSPORTATION PARTNERS L.P.
NOTES TO CONSOLIDATED FINANCIAL STATEMENTS (Continued)
(dollars in thousands, except unit and per unit amounts)
Note 5: Goodwill and Intangible Assets (Continued)
and decreased profitability. As a result of the increased risk relating to the higher level of volatility associated with more of the Pacific region reporting unit vessels operating in the voyage charter market combined with the unexpected duration of customers failing to commit to long term contracts, the Partnership's updated fiscal year 2011 business plan and fiscal 2012 through 2014 forecasts reflect a contribution margin approximately 12% lower than previously estimated for the fiscal 2011 through 2014 contribution margins used in the October 31 assessment. The lower contribution margin is estimated based on assumptions relating to (1) the period of recovery needed for the Partnership to obtain new long-term charters, for vessels currently operating in the voyage charter market, at rates at least equivalent to those received under the Partnership's old long-term charters, (2) utilization rates, (3) the number of vessels to lay up due to estimated low utilization rates and the period to lay up such vessels, and (4) average daily rates and estimated fixed and variable operating costs for each vessel. The decline in the Pacific region reporting unit's revenues and contribution margin for the fiscal year ended June 30, 2010 has reduced both the Pacific region reporting unit's and the Partnership's cash flows and liquidity as further described below.
In addition to the assumptions described above, the Partnership also makes certain assumptions about future economic conditions including inflation, interest rates and other market data. The following critical assumptions were used in determining the fair value of goodwill as of both June 30, 2010 and October 31, 2009: (1) reduced utilization of certain vessels from their historic utilization levels based on known or anticipated non-renewal of long term contracts, (2) the impact of newbuilds placed into service in fiscal 2010, (3) a projected long term growth of 3% for determining terminal value; (4) a tax rate of 35%, which reflects a market participant rather than the Partnership's tax rate, and (5) an average discount rate of 13% and 9.5%, respectively, representing the Partnership's weighted average cost of capital ("WACC") as of June 30, 2010 and October 31, 2009. Factors inherent in determining the Partnership's WACC included the Partnership's own and peer company data relating to (1) the value of the Partnership's limited partner units and peer company common stock; (2) the amounts of debt and equity and the percentages they comprise of total capitalization; and (3) expected interest costs on debt and debt market conditions.
The increased dependence on the voyage charter market for both the Atlantic and Pacific region reporting units resulted in reductions in the Partnership's fiscal 2010 revenue, operating income and cash flow forecasts resulting in the Partnership obtaining amendments to certain of its debt and lease agreements in December 2009 in order to remain in compliance with the financial covenants contained in such debt and lease agreements. As of the June 30, 2010 measurement date the Partnership was seeking additional amendments to such debt and lease agreements in order to remain in compliance with the financial covenants contained therein as the Partnership's operating cash flows declined significantly in the three months ended June 30, 2010. The Partnership's ratio of debt to total capital (defined as debt plus equity market capitalization) was approximately 80% at June 30, 2010 versus approximately 60% at October 31, 2009.
The increase in the Partnership's WACC from the 9.5% used at October 31, 2009 to 13% used at June 30, 2010 is primarily due to the Partnership's estimate of the overall level of inherent risk of the reporting unit relating to (1) the potential for increased volatility in Pacific reporting unit revenue due to the decrease in revenue derived from long term contracts, (2) the lack of transparency relating to the duration of the ongoing economic downturn, the period or strength of a recovery and the resultant
F-22
K-SEA TRANSPORTATION PARTNERS L.P.
NOTES TO CONSOLIDATED FINANCIAL STATEMENTS (Continued)
(dollars in thousands, except unit and per unit amounts)
Note 5: Goodwill and Intangible Assets (Continued)
impact on customer willingness to commit to long term contracts at rates at least equivalent to those received under the Partnership's old charters, (3) an increase in the cost of both debt financing resulting from the need to renegotiate the Partnership's revolving loan agreement due to potential violation of financial covenants at June 30, 2010 (See note 7) and (4) an increase in the cost of equity financing relating to the rate of return an outside investor would expect to earn due to the forgoing factors. The above mentioned factors, among other factors, contributed to the sustained reduced unit price. The market capitalization of the Partnership as of June 30, 2010 was significantly less than the book value of the Partnership indicating an implied impairment.
Assumptions in estimating future cash flows are subject to a high degree of judgment and complexity. The Partnership based its fair value estimate on assumptions it believes to be reasonable.
The changes in the carrying amount of goodwill for the years ended June 30, 2010 and 2009 are as follows:
| |
Total | |||
|---|---|---|---|---|
Balance as of June 30, 2008 |
$ | 54,300 | ||
Activity during fiscal year 2009 |
— | |||
Balance as of June 30, 2009 |
$ | 54,300 | ||
Impairment of goodwill |
(54,300 | ) | ||
Balance as of June 30, 2010 |
$ | — | ||
Intangible assets are reviewed for impairment whenever events or changes in circumstances indicate that the carrying amount of an asset or asset group may not be recoverable in accordance with ASC 360. The economic conditions that affect the Partnership's industry have not significantly recovered, which has led to a sustained decline in customers committing to long term contracts upon the expiration of existing contracts. The Partnership considered that the 72% utilization rate of the Partnership's vessels for the three months ended June 30, 2010 did not reflect a significant recovery when compared to the seasonally low utilization rate of 71% for the three months ended March 31, 2010. In addition, the Partnership has experienced a significant prolonged decline in its limited partner unit price, resulting in a significant reduction in the Partnership's market capitalization. Accordingly, the Partnership performed an assessment of its purchased intangible assets and its other long lived assets to test for recoverability in accordance with ASC 360.
The assessment of recoverability is based on management's estimates. The process for assessing the impairment of long lived assets requires that a long-lived asset or asset group represent the lowest level for which identifiable cash flows are largely independent of the cash flows of other groups of assets and liabilities. The Partnership estimated the future net undiscounted cash flows expected to be generated from the use of the long-lived assets and asset groups and their eventual disposal and then compared the estimated undiscounted cash flows to the carrying amount of the long-lived asset groups. Such estimated undiscounted cash flows considered asset utilization, estimates of average daily rates and other related factors. The cash flow period was based on the remaining useful lives of the primary asset in each long-lived asset group which ranges from 1 to 30 years. Assumptions used in the cash flow projections are consistent with internal projections and reflect the Partnership's current economic
F-23
K-SEA TRANSPORTATION PARTNERS L.P.
NOTES TO CONSOLIDATED FINANCIAL STATEMENTS (Continued)
(dollars in thousands, except unit and per unit amounts)
Note 5: Goodwill and Intangible Assets (Continued)
outlook. The result of the analysis indicated that for the asset groups which included intangible assets, the estimated undiscounted cash flows exceeded the carrying amounts of such long-lived asset groups, therefore there is no impairment of intangible assets. See note 6 for information relating to the impairment of other long lived assets.
Intangible assets consist of customer relationships, customer contracts and covenants not to compete. The net carrying amount of intangible assets for the years ended June 30, 2010 and 2009 are as follows:
| |
|
As of June 30, 2010 | |||||||||||
|---|---|---|---|---|---|---|---|---|---|---|---|---|---|
| |
Amortization period in years |
Gross Carrying Amount |
Accumulated Amortization |
Net Carrying Amount |
|||||||||
Customer Relationships/Contracts |
3 - 20 | $ | 32,415 | $ | (12,306 | ) | $ | 20,109 | |||||
Covenants Not to Compete |
3 - 4 | 550 | (545 | ) | 5 | ||||||||
Total |
$ | 32,965 | $ | (12,851 | ) | $ | 20,114 | ||||||
| |
|
As of June 30 2009 | |||||||||||
|---|---|---|---|---|---|---|---|---|---|---|---|---|---|
| |
Amortization period in years |
Gross Carrying Amount |
Accumulated Amortization |
Net Carrying Amount |
|||||||||
Customer Relationships/Contracts |
3 - 20 | $ | 32,415 | $ | (9,956 | ) | $ | 22,459 | |||||
Covenants Not to Compete |
3 - 4 | 550 | (473 | ) | 77 | ||||||||
Total |
$ | 32,965 | $ | (10,429 | ) | $ | 22,536 | ||||||
Amortization expense for the customer relationships/contracts and the covenant not to compete for the years ended June 30, 2010, 2009 and 2008 were $2,422, $2,943 and $2,793, respectively. The expected future amortization expense related to these intangible assets is as follows:
Year ending June 30,
|
|
||||
|---|---|---|---|---|---|
2011 |
$ | 1,846 | |||
2012 |
1,840 | ||||
2013 |
1,840 | ||||
2014 |
1,840 | ||||
2015 |
1,840 | ||||
2016 and thereafter |
10,908 | ||||
Total |
$ | 20,114 | |||
F-24
K-SEA TRANSPORTATION PARTNERS L.P.
NOTES TO CONSOLIDATED FINANCIAL STATEMENTS (Continued)
(dollars in thousands, except unit and per unit amounts)
Note 6: Vessels and Equipment and Construction in Progress
At June 30, 2010 and 2009, vessels and equipment and construction in progress comprised the following:
| |
2010 | 2009 | |||||
|---|---|---|---|---|---|---|---|
Vessels |
$ | 810,150 | $ | 697,359 | |||
Pier and office equipment |
6,427 | 6,309 | |||||
Land and building |
2,545 | — | |||||
|
819,122 | 703,668 | |||||
Less accumulated depreciation and amortization |
(214,925 | ) | (169,672 | ) | |||
Vessels and equipment, net |
$ | 604,197 | $ | 533,996 | |||
Construction in progress |
$ | 730 | $ | 66,882 | |||
At June 30, 2010 vessels and equipment with a book value of $575,025 are subject to liens, which are further described in note 7 below.
Depreciation and amortization of vessels and equipment for the fiscal years ended June 30, 2010, 2009 and 2008 was $61,776, $50,360, and $45,519, respectively. Depreciation and amortization of vessels and equipment for the year ended June 30, 2010 includes an impairment charge of $12,630. The impairment charge pertains to $861 for construction in progress and $11,769 for certain vessels and equipment.
The generally weak economy has resulted in lower demand for oil and refined petroleum products in the United States. During the last six months of calendar year 2009, a number of major refining companies announced the shut-down of refineries, which reduces demand for petroleum carrying barges and increases the industry's availability of double-hull vessels, for which customers show a preference over single-hull vessels, thus causing an under utilization of single-hull vessels. The Partnership, therefore, determined it would phase out certain of its single-hull vessels prior to their OPA 90 phase out dates. During September 2009, the Partnership recorded an impairment charge of $5,853 on certain single-hull vessels determined based on cash flow forecasts developed using the Partnership's own data. An additional impairment charge of $1,703 was recorded during March 2010 relating to four vessels with a net book value of $3,669. The impairment charge was based on estimated sales proceeds for such vessels, which were under contracts for sale and which were sold during the fourth quarter of fiscal 2010.
As described in note 5, the Partnership identified a triggering event requiring an impairment review of all of its long lived assets and long lived asset groups as of June 30, 2010. As a result an additional impairment charge of $4,213 was recorded relating to eight tug boats, two single hull vessels and one small vessel used for support activities in Hawaii.
While the Partnership believes the estimates used are reasonable, if additional triggering events are identified which require another long lived asset impairment analysis and the assumptions used in estimating future cash flows change, the Partnership may be required to record additional impairment charges relating to its long lived assets.
F-25
K-SEA TRANSPORTATION PARTNERS L.P.
NOTES TO CONSOLIDATED FINANCIAL STATEMENTS (Continued)
(dollars in thousands, except unit and per unit amounts)
Note 6: Vessels and Equipment and Construction in Progress (Continued)
Land and buildings in Norfolk, Virginia, which support our waste water treatment operations, were leased beginning in December 2004 through October 2009. On October 30, 2009, the Partnership exercised the purchase option in the lease agreement to acquire the land and buildings at a cost of $4,242 (including closing costs). Loss on acquisition of land and buildings for the year ended June 30, 2010 of $1,697 relates to the write down of such land and buildings to fair value based on management's consideration of comparable land sales and replacement cost data.
During fiscal 2010, the Partnership took delivery of the following newbuild vessels: in October 2009, the Partnership took delivery of an 185,000-barrel articulated tug-barge unit, the DBL 185, and in April 2010, the Partnership took delivery of a 100,000-barrel tank barge the DBL 106. These tank barges cost, in the aggregate, $101,827.
On March 6, 2010 the Partnership executed a bareboat charter agreement which satisfied its August 2008 commitment that provides for the use of a 50,000-barrel barge for a period of ten years. Monthly rent payments required under this lease agreement are $170 for the first 60 months, $145 for the next 24 months and $125 for the last 36 months. Such monthly rent payments will be recorded on a straight line basis over the term of the lease. The lease includes an option to purchase the vessel after five years at fair market value, which is defined in the agreement as not to be less than $11,345 and not to exceed $12,500.
During the twelve months ended June 30, 2010 the Partnership sold or otherwise disposed of ten single hull barges, a single hull deck barge, a tug boat and a small support vessel for aggregate net proceeds of $5,310 and recognized an aggregate net gain on the sales of $801.
During fiscal 2009, the Partnership took delivery of the following newbuild vessels: in December 2008 and November 2008, the Partnership took delivery of two 80,000-barrel tank barge newbuild vessels, the DBL 79 and the DBL 76. These tank barges cost, in the aggregate, $31,636.
In December 2008, the Partnership sold three barges under sale-leaseback agreements with two financial institutions for an aggregate sales price of $34,397. Approximately $18,855 of sales proceeds were disbursed directly by the purchasers to refinance debt with operating lease obligations and fund a security deposit associated with a lease agreement. Such activities are shown as non-cash investing and financing activities in the statements of cash flows. Additionally $10,153 was disbursed to make the final payment for construction of one of the vessels and the remainder was used to repay borrowings under credit agreements. Each of the three operating lease agreements gives the charterer the right to renew the lease at the end of its initial lease term, which ranges from ten to twelve years. Two of the leases include early buyout options after ten years and nine years, respectively. One lease includes a rent escalation after six years. Gains on the sale of two vessels of $863 and $812 are being deferred and amortized as a reduction of lease expense, which is included in vessel operating expenses on a straight line basis over their respective lease terms of twelve and ten years. Prepaid rent and deferred transaction related costs of $1,602 are being amortized on a straight line basis over the respective lease terms.
In June 2009 the Partnership sold five barges under sale-leaseback agreements with three financial institutions for an aggregate sales price of $47,752. Approximately $34,448 of sales proceeds were disbursed directly by the purchasers to refinance debt with operating lease obligations and fund security deposits associated with certain lease agreements. Such activities are therefore shown as non-cash
F-26
K-SEA TRANSPORTATION PARTNERS L.P.
NOTES TO CONSOLIDATED FINANCIAL STATEMENTS (Continued)
(dollars in thousands, except unit and per unit amounts)
Note 6: Vessels and Equipment and Construction in Progress (Continued)
investing and financing activities in the statements of cash flows. Four of the five operating lease agreements give the charterer the right to renew the lease at the end of its initial lease term, which ranges from nine and a half to ten years. Two of these leases included early buyout options after nine years, one lease includes an early buyout option after seven and three quarter years and two leases include early buyout options after seven years. Gains on the sale of two vessels of $1,416 and $81 are being deferred and amortized as a reduction of lease expense, which is included in vessel operating expenses on a straight line basis over each of their respective lease terms of ten years. Losses on the sales of two vessels of $251 and $93 are included in the consolidated statement of operations at June 30, 2009. Prepaid rent and deferred transaction related costs of $1,132 are being amortized on a straight line basis over the respective lease terms.
Aggregate rent expense for these eight operating lease agreements over their terms was $74,740 (net of the gain, prepaid rent and deferred cost amortization described above), including rent expense of $7,109 and $1,407 for the years ended June 30, 2010 and 2009, respectively; and $7,109 per year for each year in the five year period ended June 30, 2015. The net unamortized gain relating to these eight leases was $2,781 and $3,083, as of June 30, 2010 and 2009, respectively. The net unamortized prepaid rent and deferred cost relating to these eight leases was $2,411 and $ 2,663, as of June 30, 2010 and 2009, respectively.
In January 2009, the Partnership sold a single hull barge for a $1,458 note from the purchaser. The final monthly installment was paid in April 2010. The Partnership recognized a loss on the sale of $274. In June 2009, the Partnership sold a single hull barge for $2,080, which included a deposit of $500 and a note from the purchaser in the amount of $1,580. The Partnership recognized a gain on the sale of $1,317. The note receivable and related accrued interest outstanding at June 30, 2010 was $557 and is included in prepaid and other current assets in the consolidated balance sheet. The final monthly installment payment is due in October 2010.
The Partnership took delivery of one 30,000-barrel tank barge in July, the DBL 33; and one 30,000-barrel tank barge in August 2010, the DBL 34. These tank barges cost, in the aggregate and after the addition of certain special equipment, approximately $6,601. The Partnership has a long term contract with a customer relating to the DBL 33. In August 2010, the Partnership sold the DBL 34 for $2,290, net of commission and escrow agent fees. As the asset was held for sale as of June 30, 2010, the Partnership recorded a construction in progress impairment charge of $861 reflecting the difference in the purchase commitment cost and the net proceeds expected upon sale. The impairment charge is reflected in depreciation and amortization on the consolidated statement of operations. Construction in progress at June 30, 2010 of $285 relates to costs incurred (net of the impairment charge of $861) for the 30,000-barrel tank barges described above and $445 relates to coupling systems for four tug boats.
We expect to take delivery of a 50,000 barrel tank barge in the third quarter of fiscal 2011 under a lease from the shipyard.
Note 7: Financing
Revolving Loan and Credit Agreements
The Partnership, through its wholly owned subsidiary, K-Sea Operating Partnership L.P. (the "Operating Partnership"), maintains a revolving loan agreement with a group of banks (the "Revolving
F-27
K-SEA TRANSPORTATION PARTNERS L.P.
NOTES TO CONSOLIDATED FINANCIAL STATEMENTS (Continued)
(dollars in thousands, except unit and per unit amounts)
Note 7: Financing (Continued)
Lenders"), with Key Bank National Association as administrative agent and lead arranger, to provide financing for the Partnership's operations. On August 14, 2007, the Partnership amended and restated its revolving loan agreement ("Amended and Restated Loan and Security Agreement") to provide for (1) an increase in availability to $175,000 under the primary revolving facility, with an increase in the term to seven years, (2) an additional $45,000 364-day senior secured revolving credit facility, (3) amendments to certain financial covenants and (4) a reduction in interest rate margins. Under certain conditions, the Partnership had the right to increase the primary revolving facility by up to $75,000, to a maximum total facility amount of $250,000. On November 7, 2007, the Partnership exercised this right and increased the facility by $25,000 to $200,000. The primary revolving facility is collateralized by a first perfected security interest in a pool of vessels and certain equipment and machinery related to such vessels. Through the period from August 14, 2007 until December 22, 2009, the revolving facility bore interest at the London Interbank Offered Rate, or LIBOR, plus a margin ranging from 0.7% to 1.5% depending on the Partnership's ratio of total funded debt to EBITDA (as defined in the agreement). The Partnership also incurred commitment fees, payable quarterly, on the unused amount of the facility at a rate ranging from 0.15% to 0.30% based also upon the ratio of Total Funded Debt to EBITDA. On August 14, 2007, the Partnership borrowed $67,000 under the primary revolving facility and $45,000 under the 364-day facility to fund a portion of the purchase price of the Smith Maritime Group (see note 4).
Also on August 14, 2007, the Partnership entered into a bridge loan facility for up to $60,000 with an affiliate of KeyBank National Association in connection with the Smith Maritime Group acquisition. While outstanding, the bridge loan facility bore interest at an annual rate of LIBOR plus 1.5%, and was to mature on November 12, 2007.
Both the $45,000 364-day senior secured facility and the $60,000 bridge loan were repaid on September 26, 2007 upon closing of an offering of common units by the Partnership. See "—Common Unit Offerings" below.
On December 23, 2009, the Operating Partnership entered into an amendment (the "December Revolver Amendment") to its Amended and Restated Loan and Security Agreement (the "Original Revolver Agreement" and as amended, the "December Revolving Loan Agreement"). The December Revolver Amendment, among other things, (1) reduced the Revolving Lenders' commitments from $200,000 to $175,000 (subject to a maximum borrowing base equal to 75% of the orderly liquidation value of the vessel collateral), (2) eliminated the accordion feature of the Revolving Loan Agreement whereby the Partnership could request an increase in the total commitments under the December Revolving Loan Agreement by up to $50,000, (3) accelerated the maturity date from August 14, 2014 to July 1, 2012 and (4) required additional security to be assigned to the security trustee under the December Revolving Loan Agreement.
As amended by the December Revolver Amendment, the obligations under the December Revolving Loan Agreement are collateralized by a first priority security interest, subject to permitted liens, on certain vessels of the Operating Partnership and other subsidiaries of the Partnership having an orderly liquidation value equal to at least 1.333 times the amount of the aggregate obligations (including letters of credit) outstanding under the December Revolving Loan Agreement. As of June 30, 2010, the pool of vessels and certain equipment and machinery related to such vessels which
F-28
K-SEA TRANSPORTATION PARTNERS L.P.
NOTES TO CONSOLIDATED FINANCIAL STATEMENTS (Continued)
(dollars in thousands, except unit and per unit amounts)
Note 7: Financing (Continued)
collateralize the December Revolving Loan Agreement have a net book value of $256,482, a total fair market value of $251,817 and an orderly liquidation value of $214,139.
Borrowings under the December Revolving Loan Agreement bear interest at a rate per annum equal, at the option of the Operating Partnership, to (a) the greater of the prime rate, the federal funds rate plus 0.5% or 1% above the adjusted 30-day London Interbank Offered Rate ("LIBOR") (a "base rate loan") or (b) the 30-day LIBOR, in each case plus a margin based upon the ratio of total funded debt to EBITDA, as defined in the December Revolving Loan Agreement. The Operating Partnership also incurs commitment fees, payable quarterly, on the unused amounts under this facility. The base rate margin ranges from 1.75% to 3.75%, the LIBOR margin ranges from 2.75% to 4.75% and the commitment fee ranges from 0.375% to 0.625%, each based on the ratio of total funded debt to EBITDA. At June 30, 2010 the LIBOR rate was 0.35%. As of June 30, 2010, borrowings under the December Revolving Loan Agreement amounted to $135,950 at the LIBOR rate and $8,500 at the base rate. As of June 30, 2009, the Partnership had $139,850, outstanding on the revolving loan agreement at the LIBOR rate.
As a result of the December Revolver Amendment, the minimum fixed charge coverage ratio decreased from 1.85 to 1.00 to 1.50 to 1.00 at March 31, 2010. In addition, the Operating Partnership's ratio of total funded debt to EBITDA may not exceed (a) 5.00 to 1.00 from March 31, 2010 to and including September 29, 2010, and (b) 4.50 to 1.00 from and after September 30, 2010. The Partnership utilizes twelve-month trailing EBITDA (EBITDA, as defined in the Revolving Loan Agreement) for the fixed charge coverage and total funded debt to EBITDA calculations.
The December Revolver Amendment also limits quarterly cash distributions to the Partnership's unitholders to $0.45 per unit and requires that the Partnership maintain a minimum liquidity of $17,500 in order to declare any distributions. The December Revolver Amendment defines liquidity as the sum of (a) unrestricted cash of the Operating Partnership determined on a consolidated basis plus (b) (i) the lesser of (A) $175,000 and (B) the orderly liquidation value of the vessel collateral divided by 1.333, minus (ii) the aggregate amount outstanding to the lenders as of the date of such determination.
Due to the reduction in the borrowing capacity from the Original Revolver Agreement, the Partnership recorded a charge for the year ended June 30, 2010 of $807 relating to the unamortized deferred costs associated with the Original Revolver Agreement. Such charge is reflected as interest expense in the consolidated statement of operations. The December Revolver Amendment was subject to an amendment and restructuring fee totaling $1,275 and other transaction costs of $79. Both the remaining unamortized deferred costs of the Original Revolver Agreement of $732 as of December 23, 2009, as well as the costs incurred relating to the December Revolver Amendment, are being amortized over the remaining term of the December Revolving Loan Agreement which expires July 1, 2012.
Based on the Partnership's internal projections in May 2010, the Partnership projected that it would breach certain of its financial covenants at June 30, 2010. As a result on June 30, 2010, the Operating Partnership entered into an amendment (the "Amendment Letter") to its December Revolving Loan Agreement. For the period from June 30, 2010 through August 31, 2010 (the "Period"), the Amendment Letter, among other things, (1) provided a waiver of the fixed charge coverage and total funded debt to EBITDA financial covenants and (2) reduced the Revolving Lenders'
F-29
K-SEA TRANSPORTATION PARTNERS L.P.
NOTES TO CONSOLIDATED FINANCIAL STATEMENTS (Continued)
(dollars in thousands, except unit and per unit amounts)
Note 7: Financing (Continued)
commitments from $175,000 to $155,000 (subject to a maximum borrowing base equal to 75% of the orderly liquidation value of the vessel collateral).
On August 31, 2010, the Operating Partnership amended (the "Revolver Amendment") its Amended and Restated Loan and Security Agreement (as amended, the "Revolving Loan Agreement") to among other things, (1) reduce the Revolving Lenders' commitments from $175,000 to $115,000 (subject to a maximum borrowing base equal to two-thirds of the orderly liquidation value of the vessel collateral), (2) amend the fixed charge coverage and funded debt to EBITDA covenants and increase the asset coverage ratio, (3) maintain a July 1, 2012 maturity date (4) and allow the Partnership to pay cash distributions subject to liquidity requirements and certain minimum financial ratios starting with the fiscal quarter ending March 31, 2011. In connection with the Revolver Amendment, we incurred an amendment and structuring fee totaling $1,163, excluding other transaction related costs.
As amended by the Revolver Amendment, the obligations under the Revolving Loan Agreement are collateralized by a first priority security interest, subject to permitted liens, on certain vessels of the Operating Partnership and other subsidiaries of the Partnership having an orderly liquidation value equal to at least 1.50 times the amount of the aggregate obligations (including letters of credit) outstanding under the Revolving Loan Agreement. Borrowings under the Revolving Loan Agreement bear interest at a rate per annum equal, at the option of the Operating Partnership, to (a) the greater of the prime rate, the federal funds rate plus 0.5% or 1% above the 30-day London Interbank Offered Rate ("LIBOR") (a "base rate loan") or (b) the 30-day LIBOR, in each case plus a margin based upon the ratio of total funded debt to EBITDA, as defined in the Revolving Loan Agreement. The Operating Partnership also incurs commitment fees, payable quarterly, on the unused amounts under this facility.
The following table summarizes the applicable margins under the Revolving Loan Agreement, as amended:
Ratio of Total Debt to EBITDA
|
LIBOR Margin |
Base Rate Margin |
Commitment Fee |
|||||||
|---|---|---|---|---|---|---|---|---|---|---|
Greater than or equal to 6.00:1.00 |
5.750 | % | 4.750 | % | 0.875 | % | ||||
Greater than or equal to 5.00:1.00 and less than 6.00:1.00 |
5.250 | % | 4.250 | % | 0.750 | % | ||||
Greater than or equal to 4.50:1.00 and less than 5.00:1.00 |
4.750 | % | 3.750 | % | 0.625 | % | ||||
Greater than or equal to 3.50:1.00 and less than 4.50:1.00 |
4.250 | % | 3.250 | % | 0.500 | % | ||||
Greater than or equal to 2.50:1.00 and less than 3.50:1.00 |
3.750 | % | 2.750 | % | 0.450 | % | ||||
Greater than or equal to 1.50:1.00 and less than 2.50:1.00 |
3.250 | % | 2.250 | % | 0.375 | % | ||||
Less than 1.50:1.00 |
2.750 | % | 1.750 | % | 0.375 | % | ||||
provided; that commencing January 1, 2011, all pricing associated with a ratio in excess of 6.00:1.00 shall increase by 0.50% and shall continue to increase an additional 0.50% for each fiscal quarter thereafter for each quarter that such ratio exceeds 6.00:1.00.
Interest on a base rate loan is payable monthly over the term of the Revolving Loan Agreement. Interest on a LIBOR-based loan is due, at the Partnership's election, one, two or three months after such loan is made. Outstanding principal amounts are due upon termination of the Revolving Loan Agreement.
F-30
K-SEA TRANSPORTATION PARTNERS L.P.
NOTES TO CONSOLIDATED FINANCIAL STATEMENTS (Continued)
(dollars in thousands, except unit and per unit amounts)
Note 7: Financing (Continued)
As a result of the Revolver Amendment, the minimum fixed charge coverage ratio will decrease from 1.50 to 1.00 to 0.75 to 1.00 at June 30, 2010; 0.50 to 1.00 through December 31, 2010; 0.60 to 1.00 through June 30, 2011; 0.70 to 1.00 through December 31, 2011; 0.75 to 1.00 through March 31, 2012; and 1.05 to 1.00 through June 30, 2012 and thereafter. The definition of the fixed charge coverage ratio was modified to include distributions, all capital expenditures above a certain agree-upon level, and pro forma adjustments for acquisitions and equity issuances. In addition, the Operating Partnership's ratio of total funded debt to EBITDA may not exceed 6.50 to 1.00 at June 30, 2010; 6.90 to 1.00 through December 31, 2010; 6.75 to 1.00 through March 31, 2011; 6.50 to 1.00 through June 30, 2011; 5.75 to 1.00 through September 30, 2011; 5.20 to 1.00 through December 30, 2011; 4.85 to 1.00 through March 31, 2012; and 4.40 to 1.00 through June 30, 2012 and thereafter.
The Revolver Amendment limits quarterly cash distributions to the Partnership's unitholders to $0.45 per unit and requires that, inter alia, the Partnership maintain a minimum liquidity of $17,500 in order to declare any distributions. In general, the Revolver Amendment defines liquidity as the sum of (a) unrestricted cash determined on a consolidated basis plus (b) (i) the lesser of (A) $115,000 and (B) the orderly liquidation value of the vessel collateral divided by 1.50, minus (ii) the aggregate amount outstanding to the lenders as of the date of such determination. The Partnership will be permitted to pay distributions if a) the fixed charge coverage ratio is at least 1.0 times for two consecutive fiscal quarters prior to and after giving effect to such distribution(s); b) the projected fixed charge coverage ratio is equal to or greater than 1.0 times for the next twelve months and is equal to or greater than 1.0 times in three of four of those quarters; and c) the total funded debt to EBITDA ratio is less than 5.0 to 1.0. No such cash distributions shall be paid prior to the March 31, 2011 quarter.
On November 30, 2007, the Partnership entered into agreements with a financial institution to swap the LIBOR-based, variable rate interest payments on $104,850 of its Revolving Loan Agreement borrowings for fixed rates, for a term of three years. The fixed rates to be paid by the Partnership average 4.01% plus the applicable margin. The fair value of the swap contract of ($1,904) as of June 30, 2010 is included in accrued expenses and other current liabilities in the consolidated balance sheets. The aggregate fair value of the swap contract as of June 30, 2009 was ($4,682) of which ($3,484) is included in accrued expenses and other current liabilities and ($1,198) is included in other liabilities in the consolidated balance sheets.
The Partnership also had a separate $5,000 revolver with a commercial bank to support its daily cash management. On January 5, 2010, the Partnership amended and restated this revolver. The amendment reduced the borrowing capacity to $4,000 (subject to a borrowing base limitation of 75% of orderly liquidation value), conformed the financial covenants to the financial covenants of the Revolving Loan Agreement, including future amendments to such financial covenants, and increased the interest rate margin from 1.4% to 4.25%. Advances under this facility bear interest at 30-day LIBOR plus the margin. The outstanding balances on this revolver at June 30, 2010 and June 30, 2009 were $0 and $428, respectively. This revolving credit facility is collateralized by three barges and one tug boat.
F-31
K-SEA TRANSPORTATION PARTNERS L.P.
NOTES TO CONSOLIDATED FINANCIAL STATEMENTS (Continued)
(dollars in thousands, except unit and per unit amounts)
Note 7: Financing (Continued)
Term Loans and Capital Lease Obligation
Term loans and capital lease obligation outstanding at June 30, 2010 and 2009 were as follows. Descriptions of these borrowings are included below:
| |
2010 | 2009 | ||||||
|---|---|---|---|---|---|---|---|---|
| |
(in thousands) |
|||||||
Term loans due: |
||||||||
May 1, 2012 |
$ | 1,772 | $ | 2,619 | ||||
October 1, 2012 |
1,622 | 2,245 | ||||||
December 31, 2012 |
7,530 | 8,317 | ||||||
January 1, 2013 |
11,318 | 11,039 | ||||||
April 30, 2013 |
12,750 | 14,036 | ||||||
May 1, 2013 |
63,143 | 67,661 | ||||||
June 1, 2014 |
15,966 | 17,418 | ||||||
July 1, 2015 |
24,920 | 26,284 | ||||||
November 1, 2015 |
5,244 | 5,601 | ||||||
December 1, 2016 |
56,057 | 46,023 | ||||||
February 28, 2018 |
4,893 | 5,139 | ||||||
April 1, 2018 |
3,905 | 4,096 | ||||||
May 1, 2018 |
14,914 | 15,638 | ||||||
August 1, 2018 |
14,451 | 16,220 | ||||||
Capital lease obligation |
— | 399 | ||||||
|
238,485 | 242,735 | ||||||
Less current portion |
19,024 | 16,820 | ||||||
|
$ | 219,461 | $ | 225,915 | ||||
On October 8, 2008, the Partnership entered into a loan agreement with a financial institution to borrow $5,800, for which it pledged two tug boats as collateral. The proceeds of the loan were used to repay indebtedness under the Partnership's revolving loan agreement. This loan bears interest at a fixed rate of 5.85% per annum. This loan is repayable by one payment of interest only covering the period from the closing date through October 31, 2008, which was paid on November 1, 2008, and 84 monthly installments of $56 commencing December 1, 2008, with the remaining principal balance of $2,900, together with interest, due on November 1, 2015. Outstanding borrowings were $5,244 and $5,601 at June 30, 2010 and 2009, respectively.
On June 5, 2008, the Partnership closed the last of eleven fixed-rate term loans aggregating $72,147, which were entered into between April 30, 2008 and June 5, 2008. These loans were arranged with a financial institution, which assigned all but two to other financial institutions. The proceeds of these loans were used to repay borrowings under the Partnership's revolving loan agreement, except for $15,000 which was used to repay an advance on such loans which was borrowed on March 21, 2008 concurrent with repayment of a separate term loan which came due and was repaid on March 24, 2008. These term loan agreements contain customary events of default, including a cross default to the Partnership's revolving loan agreement, and also the fixed charge coverage ratio requirement that is
F-32
K-SEA TRANSPORTATION PARTNERS L.P.
NOTES TO CONSOLIDATED FINANCIAL STATEMENTS (Continued)
(dollars in thousands, except unit and per unit amounts)
Note 7: Financing (Continued)
included in the revolving loan agreement. In conjunction with the sale-leaseback transactions (see note 6) two of these term loans were repaid in December 2008 and four were repaid in June 2009. The remaining five term loans have a term of ten years maturing between April 1, 2018 and May 1, 2018 and are collateralized by three barges and two tugboats. The remaining five term loans bear a weighted average interest rate of 6.43% and are repayable in an aggregate fixed monthly payment of $180. Final balloon payments on the remaining five term loans aggregate $9,108 between April 1, 2018 and May 1, 2018. Borrowings outstanding on these loans totaled $18,819 and $19,734 at June 30, 2010 and 2009, respectively.
Also on June 5, 2008, in connection with the acquisition of eight tugboats and ancillary equipment described in note 6 above, the Partnership entered into a bridge loan agreement with a financial institution, pursuant and subject to which the lender agreed to extend a bridge loan in the original principal amount of $31,730. The bridge loan was to mature on October 5, 2008; the Partnership has since refinanced $27,465 of the bridge loan with term loans and repaid the balance on July 13, 2008 using its revolving loan agreement. The term loans all have terms of seven years. Two of the loans totaling $19,860 bear a weighted average interest rate of 6.52% and are repayable in an aggregate fixed monthly amount of $182, with final balloon payments of principal totaling $12,141 due at maturity on July 1, 2015. A third term loan bears interest at LIBOR plus 2.0%, is repayable in fixed principal amounts ranging from $31 to $42 monthly, plus interest, and matures on July 1, 2015 at which time a final balloon payment of principal of $4,605 is due. These term loans are collateralized by six tugboats. Borrowings outstanding on these term loans totaled $24,920 and $26,284 at June 30, 2010 and 2009, respectively.
On June 4, 2008, the Partnership entered into a credit agreement (the "ATB Facility") with a financial institution pursuant to which the lender agreed to provide financing during the construction period, and thereafter, for a 185,000-barrel articulated tug-barge unit in an amount equal to 80% of the acquisition costs of the unit, up to a maximum of $57,600. Obligations under the ATB Facility were collateralized during the construction period by an assignment of the Partnership's rights under the construction contract with the shipyard and, after delivery, are collateralized by a first preferred mortgage in the tug-barge unit and a cash security deposit of $3,075. Interest is payable quarterly at the applicable LIBOR rate plus a margin based upon the Partnership's ratio of total funded debt to EBITDA, as defined in the agreement. The margin ranged from 1.05% to 1.85% through December 31, 2009 and 2.75% to 4.75% through June 30, 2010. At the November 2, 2009 delivery date of the unit, the aggregate of the advances taken during the construction period of $57,600 were converted to a term loan ("ATB Loan") repayable in twenty-eight quarterly payments covering 37.5% of the term loan, which approximate $771 each, plus interest at LIBOR plus the applicable margin. The twenty eighth and final payment will also include a balloon payment of $36,000. The ATB Loan contained the same financial covenants as are contained in the Partnership's revolving loan agreement described above, as well as customary events of default. Outstanding borrowings were $56,057 and $46,023 at June 30, 2010 and 2009 respectively, under the agreement. On June 13, 2008, the Partnership also entered into an agreement with the bank to swap the LIBOR-based, variable rate interest payments on the outstanding balance of the ATB Loan to a fixed rate of 5.08% over the same term, resulting in a total fixed interest rate of 5.08% plus the applicable margin. The aggregate fair value of the swap contract as of June 30, 2010 was ($7,987) of which ($2,335) is included in accrued expenses and other current liabilities and ($5,652) is included in other liabilities in the consolidated
F-33
K-SEA TRANSPORTATION PARTNERS L.P.
NOTES TO CONSOLIDATED FINANCIAL STATEMENTS (Continued)
(dollars in thousands, except unit and per unit amounts)
Note 7: Financing (Continued)
balance sheets. The aggregate fair value of the swap contract as of June 30, 2009 was ($4,607) of which ($1,495) is included in accrued expenses and other current liabilities and ($3,112) is included in other liabilities in the consolidated balance sheets.
On December 23, 2009, the Operating Partnership entered into an amendment (the "December Term Loan Amendment") to its ATB Loan. The December Term Loan Amendment amended the financial covenants in the ATB Loan to conform to the financial covenants and LIBOR margins (2.75% - 4.75%) in the December Revolving Loan Agreement. Creditor fees incurred relating to the December Term Loan Amendment were $288 and are being amortized over the remaining term of the agreement.
On June 25, 2010, the Operating Partnership entered into an amendment to the ATB Loan which provided for the temporary waiver of compliance with the financial covenants of the ATB Loan for the period June 30, 2010 through August 31, 2010. On August 31, 2010, the Partnership entered into an amendment ("ATB Amendment") which amends the ATB Loan, (as amended, the "ATB Agreement"). The ATB Amendment amends the financial covenants in the ATB Loan to conform to the financial covenants and LIBOR margins in the Revolving Loan Agreement, as amended by the Revolver Amendment. The ATB Agreement LIBOR margins range from 2.75% to 5.75% and commencing January 1, 2011, all pricing associated with a total funded debt to EBITDA ratio in excess of 6.00:1.00 shall increase by 0.50% and shall continue to increase an additional 0.50% for each fiscal quarter thereafter for each quarter that such ratio exceeds 6.00:1.00. The ATB Amendment required that an amendment fee of 0.5% of the outstanding principal be paid by the Partnership. At August 31, 2010, borrowings outstanding under the ATB Agreement were $55,286.
On February 22, 2008, the Partnership closed a new ten-year, $5,425 term loan to finance the purchase of a tugboat. The loan bears interest at 6.15%, and is repayable in monthly installments of $46 with a final payment at maturity on February 28, 2018 of $2,417. The loan is collateralized by the related tugboat. The principal balance of the loan was $4,893 and $5,139 at June 30, 2010 and 2009, respectively.
On August 14, 2007, in connection with the acquisition of the Smith Maritime Group, the Partnership assumed two term loans totaling $23,511. The first, in the amount of $19,464, bears interest at LIBOR plus 1.25% and is repayable in equal monthly installments of $147, plus interest, through August 2018. The second, in the amount of $4,047, bears interest at LIBOR plus 1.0% and is repayable in monthly installments ranging from $59 to $81, plus interest, through May 2012. These loans are collateralized by three tank barges. The Partnership also agreed with the lender to assume the two existing interest rate swaps relating to these two loans. The LIBOR-based, variable rate interest payments on these loans have been swapped for fixed payments at an average rate of 5.48%, plus a margin, over the same terms as the loans. Borrowings outstanding on the term loans were $16,222 and $18,839 at June 30, 2010 and 2009, respectively. The aggregate fair value of the swap contract as of June 30, 2010 was ($2,083) of which ($736) is included in accrued expenses and other current liabilities and ($1,347) is included in other liabilities in the consolidated balance sheets. The aggregate fair value of the swap contract as of June 30, 2009 was ($1,929) of which ($827) is included in accrued expenses and other current liabilities and ($1,102) is included in other liabilities in the consolidated balance sheets.
F-34
K-SEA TRANSPORTATION PARTNERS L.P.
NOTES TO CONSOLIDATED FINANCIAL STATEMENTS (Continued)
(dollars in thousands, except unit and per unit amounts)
Note 7: Financing (Continued)
Also in connection with the acquisition of the Smith Maritime Group, the Partnership acquired an option to purchase a 50% interest in a joint venture which was exercised in October 2007. The joint venture is consolidated in these financial statements. The joint venture debt consists of a term loan which bears interest at 6.5%, matures on October 1, 2012, and is collateralized by the related tank barge. Borrowings outstanding on this term loan at June 30, 2010 and 2009 were $1,622 and $2,245, respectively.
In May 2006, the Partnership entered into a loan agreement ("Loan Agreement") to borrow up to $23,000 to partially finance construction of two 28,000-barrel and one 100,000-barrel tank barges. The loan bears interest at 30-day LIBOR plus 1.40%, and is repayable in monthly principal payments of $121, plus accrued interest, over seven years, with the remaining principal amount of $10,281 payable at maturity on June 1, 2014. The loan is collateralized by the related tank barges and two other tank vessels. Borrowings outstanding on this loan were $15,966 and $17,418 at June 30, 2010 and 2009, respectively. On December 30, 2009, the Operating Partnership entered into an amendment to the Loan Agreement to amend the Loan Agreement financial covenants to conform to the financial covenants of the Revolving Loan Agreement and incorporate future Revolving Loan Agreement financial covenant amendments.
On April 3, 2006, the Partnership entered into an agreement with a lending institution to borrow $80,000, for which it pledged six tugboats and six tank barges as collateral. The proceeds of these loans were used to repay indebtedness under the Partnership's revolving loan agreement. Borrowings are represented by six notes which have been assigned to other lending institutions. These loans bear interest at a rate equal to LIBOR plus 1.40%, and are repayable in 84 monthly installments with the remaining principal payable at maturity on May 1, 2013. The agreement contains certain prepayment premiums. Borrowings outstanding on these loans totaled $63,143 and $67,661 as of June 30, 2010 and 2009, respectively. Also on April 3, 2006, the Partnership entered into an agreement with the lending institution to swap the one-month, LIBOR-based, variable interest payments on the $80,000 of loans for a fixed payment at a rate of 5.2275% plus the applicable margin, over the same terms as the loans. The aggregate fair value of the swap contract as of June 30, 2010 was ($6,674) of which ($2,849) is included in accrued expenses and other current liabilities and ($3,825) is included in other liabilities in the consolidated balance sheets. The aggregate fair value of the swap contract as of June 30, 2009 was ($6,399) of which ($2,953) is included in accrued expenses and other current liabilities and ($3,446) is included in other liabilities in the consolidated balance sheets.
The interest rate swap contracts referred to above have all been designated as cash flow hedges and, therefore, the unrealized gains and losses resulting from the change in fair value of each of the contracts are being reflected in other comprehensive income (See note 3).
On December 19, 2005, one of the Partnership's subsidiaries entered into a seven year Canadian dollar (CDN $) term loan to refinance the purchase of an integrated tug-barge unit. The proceeds of US $13,000 were used to repay borrowings under the revolving loan agreement which had been used to finance the purchase of the unit. The loan bears interest at a fixed rate of 6.59%, is repayable in 60 monthly installments of CDN $136 and 23 monthly installments of CDN $216 with the remaining principal amount of CDN $7,688 payable at maturity on January 1, 2013. This loan is collateralized by the related tug-barge unit and one other tank barge. Borrowings outstanding on this loan total US $11,318 and US $11,039 as of June 30, 2010 and 2009, respectively.
F-35
K-SEA TRANSPORTATION PARTNERS L.P.
NOTES TO CONSOLIDATED FINANCIAL STATEMENTS (Continued)
(dollars in thousands, except unit and per unit amounts)
Note 7: Financing (Continued)
In June 2005, the Partnership entered into an agreement to borrow up to $18,000 to finance the purchase of an 80,000-barrel double-hull tank barge and construction of two 28,000-barrel double-hull tank barges. The loan bears interest at 30-day LIBOR plus 1.71%, and is repayable in monthly principal installments of $107 with the remaining principal amount of $9,000 payable at maturity on April 30, 2013. The loan is collateralized by the related tank barges. Borrowings outstanding on this loan were $12,750 and $14,036 at June 30, 2010 and 2009, respectively.
In March 2005, the Partnership entered into an agreement to borrow up to $11,000 to partially finance construction of a 100,000-barrel tank barge. The loan bears interest at 30-day LIBOR plus 1.05%, and is repayable in monthly principal installments of $66 with the remaining principal amount of $5,500 payable at maturity on December 31, 2012. The loan is collateralized by the related tank barge. Borrowings outstanding on this loan totaled $7,530 and $8,317 at June 30, 2010 and 2009, respectively.
The capital lease obligation, which had a balance outstanding of $399 at June 30, 2009, matured in April 2010.
Other amendments
During December 2009, the Partnership obtained consents to seven operating lease agreements to conform the lease financial covenants to the terms of the Revolving Loan Agreement. Fees incurred in connection with the consents of $92 were expensed. On June 29, 2010, the Partnership entered into amendments to eliminate the financial covenants in two of its operating lease agreements and one term loan agreement. On August 31, 2010, the Partnership obtained consents on five operating leases to incorporate by reference the financial covenants in the Revolver Amendment. The Partnership incurred fees of $0.2 million relating to such consents.
On January 21, 2010, the Partnership entered into an amendment effective as of December 23, 2009 (the "Charter Amendment") to a certain Bareboat Charter Agreement dated as of June 23, 2009 (the "Bareboat Charter") with the Partnership as charterer. The Charter Amendment amended certain financial covenants in the Bareboat Charter to conform to the terms in the Revolver Amendment. In addition, an amount of $919 representing an additional security deposit was required and an amendment fee of $71 was paid by the Partnership. The Partnership obtained a waiver of compliance with the Bareboat Charter financial covenants as of June 30, 2010. On August 31, 2010 the Bareboat Charter was terminated in conjunction with the sale of the vessel by the original lessor to a third party (the "New Lessor"). The Partnership was required to pay the original lessor a termination fee of $706. The Partnership entered into an eight year operating lease with the New Lessor which requires monthly charter payments of approximately $140.
Restrictive Covenants
The agreements governing the revolving loan and credit agreements, the term loans and the operating lease agreements contain restrictive covenants, some of which were amended as a result of the amendments and consents described above. The restrictive covenants, among other things, (a) prohibit any distributions prior to March 31, 2011, (b) limit quarterly cash distributions to our unit holders to $0.45 per unit and requires that we maintain a minimum liquidity of $17,500 and meet
F-36
K-SEA TRANSPORTATION PARTNERS L.P.
NOTES TO CONSOLIDATED FINANCIAL STATEMENTS (Continued)
(dollars in thousands, except unit and per unit amounts)
Note 7: Financing (Continued)
certain financial covenants in order to declare any distributions, (c) prohibit distributions if a default has occurred and is continuing, (d) restrict capital expenditures, permitted acquisitions, investments and sales of assets, and (e) require the Partnership to adhere to certain financial covenants, including defined ratios of (i) Asset Coverage of at least 1.50 to 1.00, (ii) Fixed Charge Coverage of at least 0.75 to 1.00 at June 30, 2010; 0.50 to 1.00 through December 31, 2010; 0.60 to 1.00 through June 30, 2011; 0.70 to 1.00 through December 31, 2011; 0.75 to 1.00 through March 31, 2012; and 1.05 to 1.00 through June 30, 2012 and thereafter, (iii) Total Funded Debt to EBITDA may not exceed 6.50 to 1.00 at June 30, 2010; 6.90 to 1.00 through December 31, 2010; 6.75 to 1.00 through March 31, 2011; 6.50 to 1.00 through June 30, 2011; 5.75 to 1.00 through September 30, 2011; 5.20 to 1.00 through December 31, 2011; 4.85 to 1.00 through March 31, 2012; and 4.40 to 1.00 through June 30, 2012 and thereafter (each ratio as defined in the agreements). As of June 30, 2009, the Partnership was in compliance with all of its financial and debt covenants. As a result of the August 31, 2010 amendments described above, as of June 30, 2010 the Partnership was in compliance with all of its financial and debt covenants. Without these amendments, the Partnership would have been in violation of the minimum fixed charge coverage ratio and the total funded debt to EBITDA ratio requirements at June 30, 2010.
Interest
Interest expense, net of amounts capitalized, and interest income, was as follows:
| |
For the Years Ended June 30, | |||||||||
|---|---|---|---|---|---|---|---|---|---|---|
| |
2010 | 2009 | 2008 | |||||||
Interest costs incurred |
$ | 24,302 | $ | 24,069 | $ | 22,955 | ||||
Less interest capitalized |
1,535 | 2,436 | 1,592 | |||||||
Interest expense |
22,767 | 21,633 | 21,363 | |||||||
Interest income |
(179 | ) | (130 | ) | (88 | ) | ||||
Interest expense, net |
$ | 22,588 | $ | 21,503 | $ | 21,275 | ||||
The weighted average interest rate on the term loans was 6.3%, 4.8% and 5.9% at June 30, 2010, 2009, and 2008, respectively. All but one term loan is subject to either a prepayment or breakage fee. Interest payable totaled $1,904 and $1,213 as of June 30, 2010 and 2009, respectively, and is included in accrued expenses and other current liabilities in the consolidated balance sheets. At June 30, 2010 and 2009, accounts payable included book overdrafts of $1,310 and $1,695, respectively, representing outstanding checks.
F-37
K-SEA TRANSPORTATION PARTNERS L.P.
NOTES TO CONSOLIDATED FINANCIAL STATEMENTS (Continued)
(dollars in thousands, except unit and per unit amounts)
Note 7: Financing (Continued)
Maturities of Long-Term Debt
As of June 30, 2010, maturities of long-term debt for each of the next five years were as follows:
2011 |
$ | 19,024 | ||
2012 |
20,165 | |||
2013 |
232,088 | |||
2014 |
20,144 | |||
2015 |
8,763 |
Preferred Unit Investment
On September 10, 2010, the Partnership issued 15,653,775 Series A Preferred Units to KA First Reserve, LLC in exchange for approximately $85,000. In addition, KA First Reserve has agreed to purchase an additional 2,762,431 preferred units for approximately $15,000 upon clearance of a Hart-Scott-Rodino review. The preferred units are convertible at any time into common units on a one-for-one basis, subject to certain adjustments in the event of certain dilutive issuances of common units. The preferred units have a coupon of 13.5%, with payment-in-kind distributions through the quarter ended June 30, 2012 or, if earlier, when the Partnership resumes cash distributions on its common units. The Partnership has an option to force the conversion of the preferred units after three years if (1) the price of its common units is 150% of the conversion price on average for 20 consecutive days on a volume-weighted basis, and (2) the average daily trading volume of its common units for such 20 day period exceeds 50,000 common units. The preferred units were priced at $5.43 per unit, which represents a 10% premium to the 5-day volume weighted average price of the Partnership's common units as of August 26, 2010. The Partnership will use the net proceeds from the sale of the preferred units to KA First Reserve, and will use the net proceeds from the sale of any additional preferred units to KA First Reserve, to reduce outstanding indebtedness and pay fees and expenses related to the transaction.
In connection with the Series A Preferred Unit investment, KA First Reserve, LLC has also been granted the right to acquire a 35% interest in the entity that owns the Partnership's incentive distribution rights. This right expires on September 10, 2011.
Common Unit Offerings
On August 12, 2009, the Partnership completed a public offering of 2,900,000 common units at a price to the public of $19.15 per unit. On August 21, 2009 the underwriters exercised a portion of their over-allotment option to purchase additional common units resulting in the issuance of an additional 344,500 common units at $19.15 per unit. The net proceeds of $59,167 from the offering, after payment of underwriting discounts and commissions and other transaction costs, were used to repay borrowings of approximately $35,000 under the Partnership's revolving loan and credit agreements and will be used to make construction progress payments in connection with the Partnership's vessel new-building program.
On August 20, 2008, the Partnership completed a public offering of 2,000,000 common units representing limited partner interests at a price to the public of $25.80 per unit. The net proceeds of
F-38
K-SEA TRANSPORTATION PARTNERS L.P.
NOTES TO CONSOLIDATED FINANCIAL STATEMENTS (Continued)
(dollars in thousands, except unit and per unit amounts)
Note 7: Financing (Continued)
$49,805 from the offering, after payment of underwriting discounts and commissions and other transaction costs, were used to repay borrowings under the Partnership's revolving loan and credit agreements and to make construction progress payments in connection with the Partnership's vessel newbuilding program.
On September 26, 2007, the Partnership completed a public offering of 3,500,000 common units at a price to the public of $39.50 per unit. The net proceeds of $131,918 from the offering, after payment of underwriting discounts and commissions and other transaction costs, were used to repay borrowings under the revolving loan agreement, including the $45,000 364-day facility, and also the $60,000 bridge loan facility described above. In addition, as described in note 4, the Partnership issued 250,000 common units to the sellers in the Smith Maritime Group acquisition, valued at $11,298, in a transaction not involving a public offering.
Note 8: Derivative Financial Instruments
The Partnership is exposed to certain financial risks relating to its ongoing business operations. Currently, the only risk managed by using derivative instruments is interest rate risk. Interest rate swaps are used to manage interest rate risk associated with the Partnership's floating-rate borrowings. As of June 30, 2010 the Partnership had seven interest rate swap contracts, three relating to the revolving loan agreement that expire in December 2010 and four that expire during the period from May 2012 to August 2018 concurrently with the hedged term loans. As of June 30, 2010, the total notional amount of the Partnership's seven receive-variable/pay-fixed interest rate swaps was $240,272. The seven interest rate contracts have fixed interest rates, including applicable margins, ranging from 5.87% to 9.33%, with a weighted average rate of 7.98%. Interest rate swaps having a notional amount of $135,422 at June 30, 2010 decrease as principal payments on the debt are made. Information on the location and amounts of derivative fair values in the consolidated balance sheets and derivative gains and losses in the consolidated statements of operations is shown below:
Fair Values of Derivative Instruments
| |
Liability Derivatives | ||||||||||
|---|---|---|---|---|---|---|---|---|---|---|---|
| |
June 30, 2010 | June 30, 2009 | |||||||||
Derivatives designated as hedging instruments under ASC 815 |
Balance Sheet Location | Fair Value | Balance Sheet Location | Fair Value | |||||||
Interest rate contracts |
Accrued expense and other current liabilities | $ | 7,824 | Accrued expense and other current liabilities | $ | 8,759 | |||||
Interest rate contracts |
Other liabilities |
$ |
10,824 |
Other liabilities |
$ |
8,858 |
|||||
Total derivatives designated as hedging instruments under ASC 815 |
$ | 18,648 | $ | 17,617 | |||||||
F-39
K-SEA TRANSPORTATION PARTNERS L.P.
NOTES TO CONSOLIDATED FINANCIAL STATEMENTS (Continued)
(dollars in thousands, except unit and per unit amounts)
Note 8: Derivative Financial Instruments (Continued)
The Effect of Derivative Instruments on the Statement of Operations
For the Years Ended June 30, 2010, 2009 and 2008
| |
|
|
|
|
Amount of Gain or (Loss) Reclassified From Accumulated OCI into Income (Effective Portion) For the Year Ended June 30, |
||||||||||||||||
|---|---|---|---|---|---|---|---|---|---|---|---|---|---|---|---|---|---|---|---|---|---|
| |
Amount of Gain or (Loss) Recognized in OCI* on Derivatives (Effective Portion) For the Year ended June 30, |
|
|||||||||||||||||||
| |
Location of Gain (Loss) Reclassified from Accumulated OCI into Income (Effective Portion) |
||||||||||||||||||||
Derivatives in ASC 815 Cash Flow Hedging Relationships |
|||||||||||||||||||||
| 2010 | 2009 | 2008 | 2010 | 2009 | 2008 | ||||||||||||||||
Interest rate contracts |
$ | (1,031 | ) | $ | (10,910 | ) | $ | (6,811 | ) | Interest expense | $ | (10,023 | ) | $ | (3,221 | ) | $ | 20 | |||
Total |
$ | (1,031 | ) | $ | (10,910 | ) | $ | (6,811 | ) | $ | (10,023 | ) | $ | (3,221 | ) | $ | 20 | ||||
*—OCI is defined as other comprehensive income in accordance with ASC 220
Interest payments made on the underlying debt instruments will result in the reclassification of gains and losses that are reported in accumulated other comprehensive income. The estimated amount of the existing losses at June 30, 2010 that are expected to be reclassified into earnings within the next 12 months is $7,824. The maximum length of time over which the Partnership is hedging its exposure to variability in future cash flows relating to floating rate interest payments is approximately eight years.
The Partnership does not obtain collateral or other security to support financial instruments subject to credit risk. The Partnership monitors the credit risk of our counterparties and enters into agreements only with established banking institutions. The financial stability of those institutions is subject to current and future global and national economic conditions, and governmental support.
Note 9: Fair Value Measurements
The following methods and assumptions were used to estimate the fair value of financial instruments:
Cash and cash equivalents, accounts receivable and claims receivable
The carrying amount reported in the accompanying consolidated balance sheets for cash and cash equivalents, accounts receivable and claims receivable, which is included in prepaid expenses and other current assets in the consolidated balance sheets, approximates their fair value due to their current maturities.
Long-term debt
As of June 30, 2010, the carrying value of all long term debt was $382,935 and the fair value was approximately $401,453, based on the borrowing rates currently available to the Partnership for bank loans with similar terms and average maturities. Long term debt with a carrying amount of $82,711 approximates fair value due to the variable interest rates on bank borrowings and based on the current rates offered to the Partnership for debt of the same remaining maturities. Long term debt with fixed interest rates had a carrying amount of $300,224 of which $240,272 relates to debt for which the interest rates were fixed through swap agreements. Such debt is effectively recorded on the balance
F-40
K-SEA TRANSPORTATION PARTNERS L.P.
NOTES TO CONSOLIDATED FINANCIAL STATEMENTS (Continued)
(dollars in thousands, except unit and per unit amounts)
Note 9: Fair Value Measurements (Continued)
sheet at its fair value since the fair values of the related swap agreements of $18,648 is included in the consolidated balance sheet as described in note 8.
Interest Rate Swaps
The Partnership utilizes certain derivative financial instruments to manage interest rate risk. Derivative instruments are entered into for periods consistent with related underlying exposures and do not constitute positions independent of those exposures. The Partnership does not enter into contracts for speculative purposes, nor is it a party to any leveraged derivative instruments. The Partnership is exposed to credit loss in the event of nonperformance by the counterparties on derivative contracts. The Partnership minimizes its credit risk on these transactions by dealing with several financial institutions and does not anticipate nonperformance.
The Codification relating to fair value measurements defines fair value and established a framework for measuring fair value. The Codification fair value hierarchy distinguishes between market participant assumptions developed based on market data obtained from sources independent of the reporting entity and the reporting entity's own assumptions about market participant assumptions developed based on the best information available in the circumstances. The Codification defines fair value as the price that would be received to sell an asset or paid to transfer a liability in an orderly transaction between market participants at the measurement date, essentially an exit price. In addition, the fair value of assets and liabilities should include consideration of non-performance risk, which for the liabilities described below includes the Partnership's own credit risk.
The levels of the fair value hierarchy established by FAS 157 are as follows:
Level 1—Quoted prices in active markets for identical assets or liabilities
Level 2—Quoted prices for similar assets and liabilities in active markets or inputs that are observable
Level 3—Inputs that are unobservable (for example cash flow modeling inputs based on assumptions)
The following table summarizes assets and liabilities measured at fair value on a recurring basis at June 30, 2010. This amount includes fair value adjustments relating to the Partnership's own credit risk:
| |
Level 1 | Level 2 | Level 3 | ||||||||
|---|---|---|---|---|---|---|---|---|---|---|---|
Liabilities |
|||||||||||
Interest rate swap contracts |
$ | — | $ | 18,648 | $ | — | |||||
The Partnership's interest rate swap contracts are not traded in any market. The fair value is determined using inputs that use as their basis readily observable market data that are actively quoted and can be validated through external sources.
F-41
K-SEA TRANSPORTATION PARTNERS L.P.
NOTES TO CONSOLIDATED FINANCIAL STATEMENTS (Continued)
(dollars in thousands, except unit and per unit amounts)
Note 9: Fair Value Measurements (Continued)
The following table summarizes assets and liabilities measured at fair value on a nonrecurring basis at June 30, 2010:
Description
|
For the year ended June 30, 2010 |
Quoted Prices in Active Markets for Identical Assets (Level 1) |
Significant Other Observable Inputs (Level 2) |
Significant Unobservable Inputs (Level 3) |
Total Losses | |||||||||||
|---|---|---|---|---|---|---|---|---|---|---|---|---|---|---|---|---|
Long lived assets held and used |
$ | 25,959 | $ | 25,959 | $ | 11,763 | ||||||||||
Long lived assets held for sale |
$ | 4,256 | $ | 4,256 | $ | 2,564 | ||||||||||
Long lived assets held and used for which a charge was recorded in the fiscal year ended June 30, 2010 relate to the following: (1) a $1,697 loss on the acquisition of land and buildings for the fiscal year ended June 30, 2010 relating to the purchase of land and building on October 30, 2009 at a cost of $4,242 based upon a purchase option in the Partnership's lease agreement. The land and building, which were acquired to continue the Partnership's waste water treatment operations in Norfolk, Virginia, have been written down to fair value based on management's consideration of comparable land sales and replacement cost data, and (2) vessels and equipment with a carrying amount of $33,481, were written down to their fair value of $23,414, resulting in an impairment charge of $10,066, which was included in depreciation and amortization expense for the fiscal year ended June 30, 2010. The Partnership estimated the fair value of such long lived assets based on cash flow forecasts developed using the Partnership's own data. In determining whether an asset is impaired the Partnership made assumptions relating to the intended use of the asset, asset utilization, estimated average daily rates and other related factors. If these estimates or their related assumptions change, the Partnership may be required to record an additional impairment charge for these assets.
Vessels and equipment held for sale with a carrying amount of $6,820 were written down to their estimated recoverable value of $4,256 resulting in an impairment charge of $2,564 which was included in depreciation and amortization expense for the year ended June 30, 2010.
Note 10: Retirement Plan
The Partnership's 401(k) Savings Plan (the "401(k) Plan") is a defined contribution plan that qualifies under Section 401(k) of the Internal Revenue Code. The 401(k) Plan covers all eligible employees. The 401(k) Plan provides that eligible employees may make contributions, subject to Internal Revenue Code limitations, and the Partnership will match the first two percent of employee compensation contributed, subject to a maximum amount. In addition, the 401(k) Plan allows for an annual discretionary employer contribution up to five percent of an employee's annual compensation. Employer contribution expense under the 401(k) Plan totaled $4,771, $4,839 and $3,743 for the years ended June 30, 2010, 2009 and 2008, respectively.
Accrued expenses for the 401(k) Plan totaled $3,559 and $3,506 as of June 30, 2010 and 2009, respectively, and are included in accrued expenses and other current liabilities in the consolidated balance sheets. Additionally, accrued expenses for payroll-related costs totaled $3,564 and $3,279 as of June 30, 2010 and 2009, respectively, which are also included in accrued expenses and other current liabilities in the consolidated balance sheets.
F-42
K-SEA TRANSPORTATION PARTNERS L.P.
NOTES TO CONSOLIDATED FINANCIAL STATEMENTS (Continued)
(dollars in thousands, except unit and per unit amounts)
Note 11: Long-term Incentive Plan
In January 2004, K-Sea General Partner GP LLC, the general partner of the Partnership's general partner, adopted the K-Sea Transportation Partners L.P. Long-term Incentive Plan (the "Plan") for directors and employees of K-Sea General Partner GP LLC and its affiliates. The Plan currently permits the grant of awards covering an aggregate of 440,000 common units in the form of restricted units and unit options and is administered by the Compensation Committee of the Board of Directors of K-Sea General Partner GP LLC. The Board of Directors of K-Sea General Partner GP LLC, in its discretion, may terminate the Plan at any time with respect to any restricted units for which a grant has not yet been made, and also reserves the right to alter or amend the Plan from time to time, including increasing the number of common units with respect to which awards may be granted subject to unitholder approval as required by the New York Stock Exchange. No change in any outstanding grant may be made, however, which would materially impair the rights of the participant without the consent of such participant. Subject to certain exceptions, restricted units are subject to forfeiture if employment is terminated prior to vesting. As the restricted units vest, K-Sea General Partner GP LLC has the option to either acquire common units in the open market for delivery to the recipient or distribute newly issued common units from the Partnership. In all cases, K-Sea General Partner GP LLC is reimbursed by the Partnership for such expenditures.
The Partnership follows the provisions of ASC 718, which states "equity instruments awarded to employees is to be estimated at fair value at the grant date." There is only a service condition ("vesting period") in respect to the awards; they are not conditional upon any performance or market conditions. The vesting period for the restricted units ranges from approximately three to five years. The Partnership estimated forfeitures over the vesting period to be zero. Therefore, the fair value estimate is based solely upon the unit price at the grant dates.
Unit compensation expense amounted to $1,104, $1,324 and $1,411 for the years ended June 30, 2010, 2009 and 2008, respectively. The total fair value of units vested during the years ended June 30, 2010, 2009 and 2008 were $1,291, $983 and $725, respectively. As of June 30, 2010 and 2009 there was $1,588 and $2,766, respectively, of unamortized compensation cost related to non-vested restricted units, which is expected to be recognized over a remaining weighted-average vesting period of 2.4 years. A summary of the status of the Partnership's restricted unit awards as of June 30, 2010 and 2009, and of changes in restricted units outstanding under the Partnership's long-term incentive plan during the year ended June 30, 2010, is as follows:
| |
Number of units | Weighted-average grant price |
|||||
|---|---|---|---|---|---|---|---|
Restricted unit awards outstanding at June 30, 2009 |
121,304 | $ | 32.76 | ||||
Units granted |
|||||||
Forfeitures |
(2,910 | ) | $ | 31.77 | |||
Units vested and issued |
(39,428 | ) | $ | 32.74 | |||
Restricted unit awards outstanding at June 30, 2010 |
78,966 | $ | 32.81 | ||||
F-43
K-SEA TRANSPORTATION PARTNERS L.P.
NOTES TO CONSOLIDATED FINANCIAL STATEMENTS (Continued)
(dollars in thousands, except unit and per unit amounts)
Note 12: Income Taxes
The components of the provision for income taxes for the fiscal years ended June 30, 2010, 2009 and 2008 are as follows:
| |
2010 | 2009 | 2008 | ||||||||
|---|---|---|---|---|---|---|---|---|---|---|---|
Current: |
|||||||||||
Federal |
$ | — | $ | — | $ | — | |||||
State and local |
314 | 43 | 36 | ||||||||
Foreign |
119 | 358 | 15 | ||||||||
|
433 | 401 | 51 | ||||||||
Deferred: |
|||||||||||
Federal |
(541 | ) | (54 | ) | 380 | ||||||
State and local |
(110 | ) | 203 | 310 | |||||||
Foreign |
— | (263 | ) | (212 | ) | ||||||
|
(651 | ) | (114 | ) | 478 | ||||||
Provision for (benefit of) income taxes |
$ | (218 | ) | $ | 287 | $ | 529 | ||||
A reconciliation of income tax expense, as computed using the federal statutory income tax rate of 34%, to the Partnership provision for income taxes for the fiscal years ended June 30, 2010, 2009 and 2008 is as follows:
| |
2010 | 2009 | 2008 | ||||||||
|---|---|---|---|---|---|---|---|---|---|---|---|
Tax (benefit) at federal statutory rate of 34% |
$ | (29,648 | ) | $ | 4,839 | 8,906 | |||||
Entities not subject to federal income taxes |
28,128 | (5,036 | ) | (8,517 | ) | ||||||
State and local income taxes, net of federal benefit |
(127 | ) | 238 | 312 | |||||||
Foreign taxes, net of federal benefit |
18 | 75 | (187 | ) | |||||||
Valuation allowance |
1,254 | 97 | — | ||||||||
Other |
157 | 74 | 15 | ||||||||
Total |
$ | (218 | ) | $ | 287 | $ | 529 | ||||
F-44
K-SEA TRANSPORTATION PARTNERS L.P.
NOTES TO CONSOLIDATED FINANCIAL STATEMENTS (Continued)
(dollars in thousands, except unit and per unit amounts)
Note 12: Income Taxes (Continued)
Significant components of deferred income tax liabilities and assets as of June 30, 2010 and 2009 are as follows:
| |
2010 | 2009 | |||||||
|---|---|---|---|---|---|---|---|---|---|
Deferred tax liabilities: |
|||||||||
Book basis of vessels and equipment in excess of tax basis |
$ | 6,649 | $ | 6,506 | |||||
Total deferred tax liabilities |
$ | 6,649 | $ | 6,506 | |||||
Deferred tax assets: |
|||||||||
Allowance for doubtful accounts |
$ | 546 | $ | 49 | |||||
Accrued expenses |
872 | 852 | |||||||
Goodwill and intangibles |
1,166 | 52 | |||||||
Net operating loss carry-forwards |
3,421 | 2,962 | |||||||
Valuation allowance |
(1,351 | ) | (97 | ) | |||||
Other |
158 | 188 | |||||||
Total deferred tax assets |
$ | 4,812 | $ | 4,006 | |||||
The Partnership had temporary differences at June 30, 2010 primarily related to the excess of the book basis of vessels and equipment over the related tax basis in the amount of $198,869. This amount will result in taxable income, in the years these differences reverse, that will be included in the overall allocation of taxable income to the unitholders of the Partnership.
ASC 740 requires the Partnership to establish a valuation allowance against deferred tax assets when it is more likely than not that the Partnership will be unable to realize those deferred tax assets in the future. Based on the Partnership's current and past performance, cumulative losses in recent years resulting from its Canadian operations, the market environment in which the Partnership operates, and the utilization of past tax attributes, the Partnership has established a valuation allowance of $1,351 against the net deferred tax assets of its Canadian subsidiary and the net deferred tax assets of its domestic corporate subsidiaries.
The Partnership expects to maintain such valuation allowance against its Canadian subsidiary net deferred tax assets and its domestic corporate subsidiaries net deferred tax assets, subject to the consideration of all prudent and feasible tax planning strategies, until such time as the Partnership attains an appropriate level of future Canadian or domestic corporate subsidiaries profitability and the Partnership is able to conclude that it is more likely than not that all of its Canadian deferred tax assets or all of its domestic corporate subsidiaries deferred tax assets are realizable. The change in the valuation allowance for the years ended June 30, 2010 and June 30, 2009 was $1,254 and $97, respectively.
At June 30, 2010, the Partnership's corporate subsidiaries had federal net operating losses of $3,675, which begin to expire in 2024; state and local net operating losses of $3,911 which begin to expire in 2028, and foreign net operating losses of $6,918, which begin to expire in 2026.
F-45
K-SEA TRANSPORTATION PARTNERS L.P.
NOTES TO CONSOLIDATED FINANCIAL STATEMENTS (Continued)
(dollars in thousands, except unit and per unit amounts)
Note 13: Related Party Transactions, Commitments and Contingencies
The Partnership leases its New York office and pier facilities from and chartered certain vessels to an affiliate of an employee who is not an executive officer or a director. Terms of the lease agreement provide for annual rental payments of $400 through April 2019. This lease is cancellable with 30 days notice from the lessee. Rent expense was $400 for the fiscal years ended June 30, 2010, 2009 and 2008. Bareboat charter revenue related to vessels chartered to an affiliate of an employee who is not an executive officer or director was $0, $309 and $514 for the fiscal years ended June 30, 2010, 2009 and 2008, respectively. Non-bareboat charter revenue from an affiliate of an employee who is not an executive officer or director was $297, $548 and $465 for the fiscal years ended June 30, 2010, 2009 and 2008, respectively. The Partnership also utilizes such affiliate for tank cleaning services at a cost of $1,129, $1,314 and $1,601 for the years ended June 30, 2010, 2009 and 2008 respectively. Included in accounts receivable at June 30, 2010 and June 30, 2009 is $61 and $110, respectively, due from this affiliate. Included in accounts payable at June 30, 2010 and June 30, 2009 is $75 and $100, respectively, due to this affiliate.
The Partnership leases a parcel of land used for the storage of vessel parts and equipment from the President of the Pacific Region for $12 per month. Included in accounts payable is $12 at both June 30, 2010 and June 30, 2009, respectively, due to the President of the Pacific Region.
In addition, a subsidiary of the Partnership leased office and pier facilities and a water treatment facility in Virginia under an agreement with a third party that extended through January 2010. The Virginia lease agreement required annual rental payments of $250 through January 8, 2010. The subsidiary received $84 from sublease of a portion of the Virginia property which extended to December 31, 2009. The subsidiary exercised its option to purchase the Virginia premises during October 2009 as described in note 6. Rent expense for the Virginia property was $83, $250 and $250 for the fiscal years ended June 30, 2010, 2009 and 2008, respectively. Sublease payments received for the fiscal years ended June 30, 2010, 2009 and 2008 were $43, $84 and $84, respectively. Effective July 1, 2006, the Partnership also leases office space in New Jersey under an agreement with a third party that extends through December 2013. Such lease agreement was amended in March 2008 to reflect an expansion of leased office space which the Partnership occupied at the end of the 2008 fiscal year. The New Jersey lease requires annual rental payments of $392 through December 2009, $408 through December 2010 and $423 through December 2013. Rent expense was $414, $400 and $260 for the fiscal years ended June 30, 2010, 2009 and 2008, respectively.
In connection with an acquisition, the Partnership assumed agreements with the port authority in Seattle, Washington covering the lease of terminal facilities and docking rights for its vessels. The lease expired in October 2008 and was renewed until October 2013; there is an option for one additional five-year term. The lease requires monthly payments of $34 with escalation each year based on the consumer price index. In October 2007, the Partnership entered into a five year lease with the port authority in Seattle, Washington relating to the expansion of leased office and warehouse space that requires monthly rental payments of $3. Rent expense for these leases for the years ended June 30, 2010, 2009 and 2008 was $384, $308 and $239 respectively.
The partnership leases equipment which consists of copy machines and a forklift. The equipment lease expense for the years ended June 30, 2010, 2009 and 2008 was $118, $106 and $80, respectively.
F-46
K-SEA TRANSPORTATION PARTNERS L.P.
NOTES TO CONSOLIDATED FINANCIAL STATEMENTS (Continued)
(dollars in thousands, except unit and per unit amounts)
Note 13: Related Party Transactions, Commitments and Contingencies (Continued)
In addition to the eight vessel operating lease agreements described in note 6, the Partnership leased one barge and one tugboat, whose leases expired July 28, 2009 and October 31, 2009, respectively, and three barges under non-cancelable operating leases which expire February 2011 through March 2020. Charter expenses were $9,367, $3,826 and $2,724 for the tug and barge operating leases for the years ended June 30, 2010, 2009 and 2008, respectively. The future minimum operating lease payments for the one tug and eleven barges, as well as the aforementioned property and equipment leases, as of June 30, 2010 are as follows:
| |
Vessels | Property | Equipment | (Sub Lease) | Total | ||||||||||||
|---|---|---|---|---|---|---|---|---|---|---|---|---|---|---|---|---|---|
Year ending June 30, |
|||||||||||||||||
2011 |
$ | 10,272 | $ | 1,051 | $ | 79 | $ | (55 | ) | $ | 11,347 | ||||||
2012 |
10,079 | 1,057 | 66 | (52 | ) | 11,150 | |||||||||||
2013 |
10,079 | 1,037 | 39 | (52 | ) | 11,103 | |||||||||||
2014 |
10,079 | 522 | 12 | (17 | ) | 10,596 | |||||||||||
2015 and thereafter |
47,821 | 648 | 48,469 | ||||||||||||||
Total |
$ | 88,330 | $ | 4,315 | $ | 196 | $ | (176 | ) | $ | 92,665 | ||||||
Additionally, the Partnership has a lease agreement with a shipyard for one 50,000-barrel barge, with expected delivery in the third quarter of fiscal year 2011. Aggregate rent for the ten year term of this lease is $17,280.
Included in total revenues are time charter and bareboat charter revenues of $143,340, $196,528 and $157,209 for the fiscal years ended June 30, 2010, 2009 and 2008, respectively. The Partnership's time charters and bareboat charters extend over various periods which expire between 2010 and April 2017. At June 30, 2010, minimum contractually agreed future revenue under time and bareboat charters was as follows:
Year ending June 30,
|
|
||||
|---|---|---|---|---|---|
2011 |
$ | 113,415 | |||
2012 |
62,104 | ||||
2013 |
45,532 | ||||
2014 |
41,894 | ||||
2015 and thereafter |
78,949 | ||||
Total |
$ | 341,894 | |||
The Partnership has entered into employment agreements with certain of its executive officers. Each of the employment agreements had an initial term of one year, which is automatically extended for successive one-year terms unless either party gives 30-days written notice prior to the end of the term that such party desires not to renew the employment agreement. These executive officers currently receive aggregate base annual salaries of $740. In addition, each employee is eligible to receive an annual bonus award based upon the performance of the Partnership and individual performance. If the employee's employment is terminated without cause or if the employee resigns for good reason, the employee will be entitled to severance in an amount equal to the greater of (a) the product of 1.3125 (1.75 multiplied by 0.75) multiplied by the employee's base salary at the time of termination or
F-47
K-SEA TRANSPORTATION PARTNERS L.P.
NOTES TO CONSOLIDATED FINANCIAL STATEMENTS (Continued)
(dollars in thousands, except unit and per unit amounts)
Note 13: Related Party Transactions, Commitments and Contingencies (Continued)
resignation and (b) the product of 1.75 multiplied by the remaining term of the employee's non-competition provisions multiplied by the employee's base salary at the time of termination or resignation.
The European Union has been working toward a new directive for the insurance industry, called "Solvency 2", with a proposed implementation date of November 1, 2012 and which requires increases in the level of free, or unallocated, reserves required to be maintained by insurance entities, including protection and indemnity clubs that provide coverage for the maritime industry. The West of England Ship Owners Insurance Services Ltd. ("WOE"), a mutual insurance association based in Luxembourg, provides the Partnership's protection and indemnity insurance coverage and would be impacted by the Solvency 2 directive. In anticipation of the Solvency 2 regulatory requirements, the WOE has assessed its members an additional capital call which it believes will contribute to achievement of the projected required free reserve increases. The Partnership's capital call of $1,119 was paid during calendar 2007. A further request for capital may be made in the future; however, the amount of such further assessment, if any, cannot be reasonably estimated at this time. As a shipowner member of the WOE, the Partnership has an interest in the WOE's free reserves, and therefore has recorded the additional $1,119 capital call as an investment, at cost, subject to periodic review for impairment. This amount is included in other assets in the June 30, 2010 and 2009 consolidated balance sheets.
In December 2008, the Partnership received an additional call from its mutual insurance carrier. The call was primarily retrospective for policy years covering February 2006 through February 2009. The decision to make the call was based primarily on falling investment returns and projected underwriting losses. Although such additional calls are uncommon, the Partnership's insurance carrier has the right to make these calls when it believes the level of its reserves will be insufficient to meet certain regulatory requirements. The Partnership's insurance carrier scheduled the payment of these calls in four installments due over a two year period, to reassess at various points whether the calls were necessary. The additional calls, which were based upon the information available in mid-November 2008, initially totaled $3,377. The Partnership received updated information from its insurance carrier reflecting improved investment returns and underwriting results. Based on the information provided, the Partnership's financial statements reflected additional insurance expense, included in vessel operating expenses, of $2,470 for the year ended June 30, 2009. The Partnership was notified in May 2010 that the insurance carrier had reassessed its investment returns and projected underwriting losses and determined the final installment was required to be paid. Based on the updated information, the Partnership's financial statements reflected additional insurance expense, included in vessel operating expenses, of $1,402 for the year ended June 30, 2010.
In November 2005 one of the Partnership's tank barges, the DBL 152, struck submerged debris in the U.S. Gulf of Mexico, causing significant damage which resulted in the barge eventually capsizing. The Partnership's insurers responded to the pollution-related costs and environmental damages resulting from the incident, paying approximately $65,000 less $60 in total deductibles. In December 2007, a court made a final determination of liability in this case, resulting in a financial recovery by the Partnership's insurers, and also by the Partnership. As a result of the ruling, the Partnership was awarded a reimbursement of certain expenses totaling $2,073, which is included in other expense (income) in the Partnership's consolidated statements of operations for the fiscal year ended June 30, 2008. The Partnership received payment in January 2008.
F-48
K-SEA TRANSPORTATION PARTNERS L.P.
NOTES TO CONSOLIDATED FINANCIAL STATEMENTS (Continued)
(dollars in thousands, except unit and per unit amounts)
Note 13: Related Party Transactions, Commitments and Contingencies (Continued)
The Partnership is the subject of various claims and lawsuits in the ordinary course of business for monetary relief arising principally from personal injuries, collisions and other casualties. Although the outcome of any individual claim or action cannot be predicted with certainty, the Partnership believes that any adverse outcome, individually or in the aggregate, would be substantially mitigated by applicable insurance or indemnification from previous owners of the Partnership's assets, and would not have a material adverse effect on the Partnership's financial position, results of operations or cash flows.
On July 7, 2010, one of our tug boats towing a third party barge was involved in a collision with an amphibious passenger vessel off of Penn's Landing in the Delaware River which resulted in the sinking of the passenger vessel. At the time of the collision, there were 35 passengers and two crew members on board the passenger vessel. Two of the passengers were fatally injured and several others were treated for minor injuries. The National Transportation Safety Board and United States Coast Guard are conducting a joint investigation of the incident. We have been notified of potential claims and have been named in several lawsuits relating to this incident. Although the outcome of these potential claims or actions cannot be predicted with certainty, we believe that any adverse outcome, individually or in the aggregate, would be substantially mitigated by applicable insurance and would not have a material adverse effect on our financial position, results of operations or cash flows.
The Partnership is also subject to deductibles with respect to its insurance coverage that range from $10 to $250 per incident and provides on a current basis for estimated payments thereunder. Insurance claims receivable outstanding totaled $11,659 and $7,459 at June 30, 2010 and 2009, respectively, and is included in prepaid expenses and other current assets. Insurance claims payable at June 30, 2010 and 2009 totaled $13,261 and $7,206, respectively, and is included in accrued expenses and other current liabilities.
As discussed in note 6, the Partnership has an agreement with a shipyard for the lease of one 50,000-barrel tank barge.
F-49
K-SEA TRANSPORTATION PARTNERS L.P.
NOTES TO CONSOLIDATED FINANCIAL STATEMENTS (Continued)
(dollars in thousands, except unit and per unit amounts)
Note 14: Quarterly Results of Operations (Unaudited)
The following summarizes certain quarterly results of operations for each of the fiscal years ended June 30, 2010 and 2008:
| |
Three Months Ended | |||||||||||||
|---|---|---|---|---|---|---|---|---|---|---|---|---|---|---|
| |
September 30 | December 31 | March 31 | June 30 | ||||||||||
| |
(in thousands, except per unit amounts) |
|||||||||||||
Fiscal 2010 |
||||||||||||||
Total revenues |
$ | 70,602 | $ | 68,586 | $ | 59,583 | $ | 66,654 | ||||||
Operating income (loss) |
$ |
(1,274 |
) |
$ |
1,316 |
$ |
(5,297 |
) |
$ |
(59,891 |
) |
|||
Net loss |
$ |
(5,143 |
) |
$ |
(4,101 |
) |
$ |
(11,308 |
) |
$ |
(66,429 |
) |
||
Less net income attributable to non-controlling interest |
$ | 99 | $ | 100 | $ | 98 | $ | 101 | ||||||
Net loss of K-Sea |
$ | (5,242 | ) | $ | (4,201 | ) | $ | (11,406 | ) | $ | (66,530 | ) | ||
General partners' interest in net loss of K-Sea |
$ | (55 | ) | $ | (44 | ) | $ | (120 | ) | $ | (697 | ) | ||
Limited partners' interest in net loss of K-Sea |
$ | (5,187 | ) | $ | (4,157 | ) | $ | (11,286 | ) | $ | (65,833 | ) | ||
Net loss of K-Sea per limited partner unit: |
||||||||||||||
Basic |
$ | (0.29 | ) | $ | (0.22 | ) | $ | (0.59 | ) | $ | (3.43 | ) | ||
Diluted |
$ | (0.29 | ) | $ | (0.22 | ) | $ | (0.59 | ) | $ | (3.43 | ) | ||
As discussed in note 2, in fiscal year 2010 the Partnership adopted the provisions of two new accounting standards which affect the calculation of earnings per unit. Such standards are required to be reported retrospectively. Therefore the quarterly information for fiscal years 2009 and 2008 reflect the retrospective application of the accounting standards. For fiscal year 2009, adoption of these standards (1) increased the net income of K-Sea allocated to the general partner by $1,071, $1,074, $1,074 and $1,073, for the three months ended September 30, 2008, December 31, 2008, March 31, 2009 and June 30, 2009, respectively; (2) decreased the net income of K-Sea allocated to the limited partners by $(1,071), $(1,074), $(1,074) and $(1,073), for the three months ended September 30, 2008, December 31, 2008, March 31, 2009 and June 30, 2009, respectively; (3) decreased net income per basic limited partner unit by $(0.07) for each of the three months ended September 30, 2008, December 31, 2008, March 31, 2009 and June 30, 2009; and (4) decreased net income per fully diluted limited partner unit by $(0.07), $(0.06), $(0.06), $(0.07), for the three months ended September 30, 2008, December 31, 2008, March 31, 2009 and June 30, 2009, respectively.
Effective July 1, 2008, the Partnership prospectively increased the estimated useful lives of double-hulled tank barges and tugboats to a range of ten to thirty years, from the previous ranges of ten to twenty five years and ten to twenty years, respectively, and increased salvage values for double-hulled tank barges. These changes in accounting estimates increased operating income and net income by $1,552 and $1,533, respectively, and net income per fully diluted limited partner unit by $0.10, for the three months ended June 30, 2009; increased operating income and net income by $1,587 and $1,567, respectively, and net income per fully diluted limited partner unit by $0.10, for the three months ended March 31, 2009; increased operating income and net income by $1,633 and $1,613, respectively, and net income per fully diluted limited partner unit by $0.10, for the three months ended December 31, 2008; and increased operating income and net income by $1,633 and $1,613, respectively, and net income per fully diluted limited partner unit by $0.11, for the three months ended September 30, 2008.
F-50
K-SEA TRANSPORTATION PARTNERS L.P.
NOTES TO CONSOLIDATED FINANCIAL STATEMENTS (Continued)
(dollars in thousands, except unit and per unit amounts)
Note 14: Quarterly Results of Operations (Unaudited) (Continued)
During the fiscal year 2009 third quarter financial reporting process, the Partnership identified an accounting adjustment related to the December 31, 2008 carrying value of one of its fixed assets. The impact is a reduction to the net income for the quarter ended December 31, 2008 of $274 which is not considered material. This adjustment has been reflected in net income for the quarter ended March 31, 2009 as further described in note 6 vessels and equipment to the Partnership's Quarterly Report on Form 10-Q for the period ended March 31, 2009.
| |
Three Months Ended | |||||||||||||
|---|---|---|---|---|---|---|---|---|---|---|---|---|---|---|
| |
September 30 | December 31 | March 31 | June 30 | ||||||||||
| |
(in thousands, except per unit amounts) |
|||||||||||||
Fiscal 2009 |
||||||||||||||
Total revenues |
$ | 91,494 | $ | 88,259 | $ | 78,438 | $ | 72,271 | ||||||
Operating income |
$ |
9,893 |
$ |
9,353 |
$ |
8,926 |
$ |
8,284 |
||||||
Net income |
$ |
3,856 |
$ |
3,730 |
$ |
4,001 |
$ |
2,677 |
||||||
Less net income attributable to non-controlling interest |
$ | 2 | $ | 127 | $ | 93 | $ | 95 | ||||||
Net income of K-Sea |
$ | 3,854 | $ | 3,603 | $ | 3,908 | $ | 2,582 | ||||||
General partners' interest in net income of K-Sea |
$ | 1,124 | $ | 1,120 | $ | 1,124 | $ | 1,106 | ||||||
Limited partners' interest in net income of K-Sea |
$ | 2,730 | $ | 2,483 | $ | 2,784 | $ | 1,476 | ||||||
Net income per limited partner unit: |
||||||||||||||
Basic |
$ | 0.19 | $ | 0.16 | $ | 0.18 | $ | 0.09 | ||||||
Diluted |
$ | 0.19 | $ | 0.16 | $ | 0.18 | $ | 0.09 | ||||||
Note 15: New Accounting Pronouncements
In December 2009, the FASB issued amendments to an accounting standard to improve financial reporting by enterprises involved with variable interest entities, which is effective for fiscal years and interim periods within those fiscal years for fiscal years beginning after November 15, 2009. These amendments are to replace the quantitative-based risks and rewards calculation for determining which reporting entity, if any, has a controlling financial interest in a variable interest entity with an approach focused on identifying which reporting entity has the power to direct the activities of a variable interest entity that most significantly impact the entity's economic performance and (1) the obligation to absorb losses of the entity or (2) the right to receive benefits from the entity. The amendments also require additional disclosures about a reporting entity's involvement in variable interest entities. The Partnership is currently analyzing the impact of these amendments.
Note 16: Subsequent Event
Amendment of Partnership Agreement
Effective September 10, 2010, in connection with the issuance of the Series A Preferred Units, the Partnership entered into the Fourth Amended and Restated Agreement of Limited Partnership ("Restated Partnership Agreement") to, among other things, designate the terms of the preferred units.
F-51
K-SEA TRANSPORTATION PARTNERS L.P.
NOTES TO CONSOLIDATED FINANCIAL STATEMENTS (Continued)
(dollars in thousands, except unit and per unit amounts)
Note 16: Subsequent Event (Continued)
Under the Restated Partnership Agreement, except with respect to certain matters, the preferred units have voting rights that are identical to the voting rights of the common units and vote with the common units as a single class, with each preferred unit entitled to one vote for each common unit into which such preferred unit is convertible. The preferred units also have class voting rights on any matter, including a merger, consolidation or business combination, that adversely affects, amends or modifies any of the rights, preferences, privileges or terms of the preferred units.
The preferred units have a coupon of 13.5% with payment-in-kind distributions through the quarter ended June 30, 2012 or, if earlier, when the Partnership resumes cash distributions on its common units. The common unit holders will not receive any distribution with respect to any common units in any quarter in which the preferred units do not receive a quarterly distribution in full in cash. If the Partnership fails to pay in full any quarterly distribution with respect to the preferred units, the amount of such unpaid distribution will accrue and accumulate from the last day of the quarter for which such distribution is due until paid in full and such unpaid amounts will accrue interest at the coupon rate of 13.5%.
In December 2009, the FASB issued an accounting standard update "Fair Value Measurements and Disclosures (Topic 820) Improving Disclosures about Fair Value Measurements" that requires disclosures about 1) the different classes of assets and liabilities measured at fair value, 2) the valuation techniques and inputs used, 3) the activity in Level 3 fair value measurements and 4) the transfers between Levels 1, 2 and 3. Certain disclosures required by the standard update were effective for interim and annual reporting periods beginning after December 15, 2009 and therefore were included in the Partnership's interim consolidated financial statements upon adoption of this standard by the Partnership effective January 1, 2010. Other disclosures regarding purchases, sales, issuances, and settlements in the roll forward of activity in Level 3 fair value measurements are effective for fiscal years beginning after December 15, 2010, and for interim periods within those fiscal years. The Partnership is currently analyzing the impact of the Level 3 amendments.
F-52