Attached files
Table of Contents
UNITED STATES
SECURITIES AND EXCHANGE COMMISSION
Washington, D.C. 20549
FORM 10-K
| x | ANNUAL REPORT PURSUANT TO SECTION 13 OR 15(d) OF THE SECURITIES EXCHANGE ACT OF 1934 |
For the fiscal year ended June 27, 2010
or
| ¨ | TRANSITION REPORT PURSUANT TO SECTION 13 OR 15(d) OF THE SECURITIES EXCHANGE ACT OF 1934 |
For the transition period from to
Commission file number 0-02287
SYMMETRICOM, INC.
(Exact name of registrant as specified in its charter)
| Delaware | No. 95-1906306 | |
| (State or Other Jurisdiction of Incorporation or Organization) |
(I.R.S. Employer Identification No.) | |
| 2300 Orchard Parkway, San Jose, California |
95131-1017 | |
| (Address of Principal Executive Offices) | (Zip Code) | |
Registrant’s telephone number, including area code: (408) 433-0910
| Securities registered pursuant to Section 12(b) | Name of each exchange on which registered | |
| Common Stock, $0.0001 Par Value (including associated Series A Participating Preferred Stock Purchase Rights) |
The NASDAQ Stock Market LLC |
Securities registered pursuant to Section 12(g) of the Act:
None
Indicate by check mark if the registrant is a well-known seasoned issuer, as defined in Rule 405 of the Securities Act. Yes ¨ No x
Indicate by check mark if the registrant is not required to file reports pursuant to Section 13 or Section 15(d) of the Act. Yes ¨ No x
Indicate by check mark whether the registrant (1) has filed all reports required to be filed by Section 13 or 15(d) of the Securities Exchange Act 1934 during the preceding 12 months (or for such shorter period that the registrant was required to file such reports), and (2) has been subject to such filing requirements for the past 90 days. Yes x No ¨
Indicate by check mark whether the registrant has submitted electronically and posted on its corporate Web site, if any, every Interactive Data File required to be submitted and posted pursuant to Rule 405 of Regulation S-T (§232.405 of this chapter) during the preceding 12 months (or for such shorter period that the registrant was required to submit and post such files). Yes ¨ No ¨
Indicate by check mark if disclosure of delinquent filers pursuant to Item 405 of Regulation S-K (§29.405 of this chapter) is not contained herein, and will not be contained, to the best of registrant’s knowledge, in definitive proxy or information statements incorporated by reference in Part III of this Form 10-K or any amendment to this Form 10-K. ¨
Indicate by check mark whether the registrant is a large accelerated filer, an accelerated filer, a non-accelerated filer or a smaller reporting company. See definition of “large accelerated filer, “accelerated filer” and “smaller reporting company” in Rule 12b-2 of the Exchange Act. (Check one):
| Large accelerated filer | ¨ | Accelerated filer | x | Non-accelerated filer | ¨ | Smaller reporting company | ¨ |
Indicate by check mark whether the registrant is a shell company (as defined in Rule 12b-2 of the Exchange Act). Yes ¨ No x
The aggregate market value of the voting and non-voting common stock held by non-affiliates of the Registrant, computed by reference to the closing price at which the Common Stock was sold on December 27, 2009, as reported on The NASDAQ Stock Market LLC was approximately $228,392,175. This calculation does not reflect a determination that such persons are affiliates of the Registrant for any other purpose.
As of August 20, 2010, there were approximately 43,502,587 shares of Registrant’s Common Stock outstanding.
DOCUMENTS INCORPORATED BY REFERENCE
Portions of the Proxy Statement for the Registrant’s 2010 Annual Meeting of Stockholders are incorporated by reference in Part III of this Form 10-K.
Table of Contents
SYMMETRICOM, INC.
FORM 10-K
For the Fiscal Year Ended June 27, 2010
| Page | ||||
| PART I | ||||
| Item 1. |
3 | |||
| Item 1A. |
13 | |||
| Item 1B. |
24 | |||
| Item 2. |
24 | |||
| Item 3. |
24 | |||
| Item 4. |
24 | |||
| PART II | ||||
| Item 5. |
25 | |||
| Item 6. |
27 | |||
| Item 7. |
Management’s Discussion and Analysis of Financial Condition and Results of Operations |
28 | ||
| Item 7A. |
47 | |||
| Item 8. |
48 | |||
| Item 9. |
Changes in and Disagreements with Accountants on Accounting and Financial Disclosure |
87 | ||
| Item 9A. |
87 | |||
| Item 9B. |
87 | |||
| PART III | ||||
| Item 10. |
89 | |||
| Item 11. |
89 | |||
| Item 12. |
Security Ownership of Certain Beneficial Owners and Management and Related Stockholder Matters |
89 | ||
| Item 13. |
Certain Relationships and Related Transactions, and Director Independence |
90 | ||
| Item 14. |
90 | |||
| PART IV | ||||
| Item 15. |
91 | |||
| 95 | ||||
2
Table of Contents
PART I
FORWARD-LOOKING INFORMATION
When used in this discussion, the words “expect,” “anticipate,” “estimate,” “believe,” “plan,” “will,” “may,” “intend,” “can,” “project” and similar expressions are intended to identify forward-looking statements. These statements in “Fiscal 2011 Outlook” and elsewhere are subject to risks and uncertainties that could cause actual results to differ materially from those projected.
These risks and uncertainties include, but are not limited to, risks relating to general economic conditions in the markets we address and the telecommunications market in general, risks related to the development of our new products and services, the transition of our manufacturing operations in Puerto Rico to our contract manufacturer, the effects of increasing competition and competitive pricing pressure, uncertainties associated with changing intellectual property laws, developments in and expenses related to litigation, inability to obtain sufficient amounts of key components, the rescheduling or cancellations of key customer orders, the loss of a key customer, the effects of new and emerging technologies, the risk that excess inventory may result in write-offs, price erosion and decreased demand, fluctuations in the rate of exchange of foreign currency, changes in our effective tax rate, market acceptance of our new products and services, technological advancements, undetected errors or defects in our products, the risks associated with our international sales, potential short-term investment losses and other risks due to credit market dislocation, geopolitical risks and risk of terrorist activities, the risks associated with attempting to integrate other companies and businesses we acquire, and the risks set forth below in Item 1A, “Risk Factors.”
These forward-looking statements speak only as of the date hereof. We expressly disclaim any obligation or undertaking to release publicly any updates or revisions to any forward-looking statements contained herein to reflect any change in our expectations with regard thereto or any change in events, conditions or circumstances on which any such statement is based.
In the sections of this report entitled “Business” and “Management’s Discussion and Analysis of Financial Condition and Results of Operations” all references to “Symmetricom,” “we,” “us,” and “our” mean Symmetricom, Inc. and its subsidiaries, except where it is made clear that the term means only the parent company.
TimeSource, SMARTCLOCK, BesTime, GoLong, GoWide, TimeHub, TimePictra, TimeCesium, TimeProvider, TimeCreator, TimeScan and, PackeTime are our trademarks. We also refer to trademarks of other corporations and organizations in this document.
| Item 1. | Business |
Overview
Symmetricom, a world leader in precise time solutions, sets the world’s standard for time. We generate, distribute and apply precise time for the communications, aerospace/defense, IT infrastructure and metrology industries. Our customers, from communications service providers and network equipment manufacturers to governments and their suppliers worldwide, are able to build more reliable networks and systems by using our advanced timing technologies, synchronization systems, atomic clocks, services and solutions. Our products support today’s precise timing standards, including GPS-based timing, IEEE 1588 (PTP), Network Time Protocol (NTP), Synchronous Ethernet Building Integrated Timing Supply (BITS) and Data Over Cable Service Interface Specifications (DOCSIS(R)) timing.
We manufacture precision time products that allow our customers to keep accurate time to within 40 billionths of a second over a 24-hour period. Our clocks tell us the time of day and allow us to measure the time interval between when an event starts and when it stops. The difference between conventional time
3
Table of Contents
measuring devices and our precise time products lies in their accuracy. To place the accuracy or resolution of our clocks in perspective, if a clock accumulates a 40 billionth of a second time error over a 24-hour period, it will require more than 60,000 years to accumulate an error of one second. This same “time of day” precision enables our time products to offer very precise frequency sources and references.
General Information
Symmetricom was incorporated in California in 1956 and reincorporated in Delaware in 2002. Our principal executive offices are located at 2300 Orchard Parkway, San Jose, California 95131-1017, and our telephone number is (408) 433-0910.
Our website is located at www.symmetricom.com. We make available, free of charge on or through our website, our recorded conference calls, our annual report on Form 10-K, quarterly reports on Form 10-Q, current reports on Form 8-K, and amendments to those reports filed or furnished pursuant to Section 13(a) or 15(d) of the Exchange Act as soon as reasonably practicable after we electronically file such material with, or furnish it to, the SEC. Information contained or referenced on our website is not incorporated by reference into and does not form a part of this Form 10-K.
Industry Background
The markets we serve include:
| • | Communications service providers; |
| • | Network equipment manufacturers (base stations, routers, aggregation systems) and silicon suppliers; |
| • | Aerospace/Defense; |
| • | IT infrastructure; and |
| • | Science and metrology. |
Reportable Segments
Symmetricom is organized into two reportable segments corresponding to two business units, the Communications business unit and the Government business unit.
Net revenue, gross profit, and operating income (loss) attributable to each of these reportable segments for each year in the three-year period ended June 27, 2010, is contained in Note 15 of the consolidated financial statements. We do not allocate assets, corporate operating expenses (which includes restructuring and integration charges) interest and other income, interest and other expense, and taxes to these individual reportable segments.
Communications
Our Communications business unit provides timing technologies and services for worldwide communications infrastructure. Product families include primary reference sources, synchronization distribution systems, embedded components and software, and test and measurement equipment, all of which support the time and synchronization requirements of communications networks and equipment. Specific products include primary reference sources; edge clocks and distribution products for synchronization outside the network core; Building Integrated Timing Supply (BITS) and Sync Supply Unit (SSU) for the central office; the PackeTime™ product suite based on technologies such as IEEE 1588 (PTP) and NTP; Data Over Cable Service Interface Specifications (DOCSIS) timing interface systems; network management and monitoring software; timing test equipment; and embedded hardware and software solutions for OEM integration. Symmetricom holds numerous patents in advanced control algorithms for various types of deployments.
Network service providers are driven by economics and competitive forces to evolve their infrastructures toward packet-based technologies. In fiscal 2010, we participated in the deployments and modernization of
4
Table of Contents
several synchronization networks with certain service providers and helped others develop future plans for such efforts. Our products also enabled multiple cable multi-service operators worldwide to expand the performance of their broadband offering.
We continue to build a strong portfolio of precise time and frequency solutions to address the growing synchronization requirements of all layers of existing circuit switched network and next-generation packet networks. The addition of a broader range of embedded solutions enables network equipment manufacturers and silicon solution developers to provide robust synchronization solutions as part of their own offerings.
Government
Symmetricom’s Government business unit provides time technology products for aerospace/defense, IT infrastructure and science and metrology applications. Precision time and frequency systems enable a range of critical operations, including the international time scale, global navigation, the management of power grids, synchronization of complex control systems, and signals intelligence for securing communications in remote and hostile environments.
Product families include timescale clock sources, network time servers, network time displays, time code generators, bus level timing cards, primary reference standards such as rubidium and cesium oscillator standards, high stability masers, ruggedized crystal oscillators, and custom time & frequency systems. Customer applications include synchronization of government communication networks, synchronization of computer networks, reference timing for radar, ranging, fire-control and other defense electronic systems, calibration of lab equipment, GNSS (Global Navigation Satellite Systems), and subsystem master timing. To support both a diverse customer and product base, the business unit provides strong application engineering capabilities that allow for the tailoring of standard product platforms to meet a customer’s unique system requirements.
During fiscal 2010, the business unit continued to emphasize government program business in secure mobile, satellite, and wireline communications, as well as other defense platform upgrades including destroyers, submarines, and unmanned aerial vehicles (UAVs).
Communications Business Unit Markets and Products
Communications Business Unit Markets:
Within our Communications business, we serve the wireless, wireline and cable infrastructure markets.
Communications Business Unit Products:
Synchronization Products
We sell our synchronization products to wireless, wireline and cable service provider markets. Commonly, our products are used to synchronize wireline communications; to provide the precise timing needed for DOCSIS 3.0 broadband services; and to provide synchronization and timing support to wireless base station deployments.
The telecommunications network consists of a series of interconnected switching equipment and other components that route information (i.e., voice, video, and data) through the network. For these networks to function efficiently, each network must be synchronized to a traceable time reference, and the individual nodes within the network must operate within precise tolerances. Precision synchronization equipment throughout these networks provides a frequency reference which enables digital switching, routing and transmission systems to operate at a common, synchronized clock rate, thereby aligning time slots, which increases bandwidth utilization while minimizing signal degradation and reducing errors throughout a network.
5
Table of Contents
Our core system products are built on atomic clock and GPS technologies and provide for the generation, distribution, and management of communications synchronization infrastructure.
| • | Primary Reference Sources (PRS)—consists of the GPS-based TimeSource® family, and the cesium-based TimeCesium® family of products. |
| • | Building Integrated Timing Supplies (BITS) or Synchronization Supply Units (SSUs)—consists of the carrier-class SSU 2000 and TimeHub®, both intelligent sync distribution systems, and carrier class Network Time Protocol (NTP) & IEEE 1588 (PTP) plug-in server cards supporting critical applications for next generation networks. Other key products include the TP5000 PTP Grandmaster, the Time Provider 1000, the industry’s first node clock (hybrid SSU & PRS), TimeCreator®, the first DOCSIS Timing Interface (DTI) server qualified by CableLabs, and other products currently under development to address emerging needs in the wireless, wireline and cable markets. |
| • | Element Management Systems—consists of TimePictra, the carrier class HP-UX based system, TimeScan, the PC-based system, and TimeCraft, the advanced GUI management tool. |
Embedded Products
Our software, component and sub-system (module) products enable network equipment manufacturers to achieve stable timing for applications requiring high precision frequency and timing information, such as wireless base stations, digital television transmission and instrumentation.
Specific embedded products we provide include:
| • | 1588 soft client technologies that can be embedded into various generations of base stations, femto cells and network devices to provide time and frequency capabilities to interoperate with 1588 grand masters; this packet-based protocol (PTP 1588) enables NGN-based services when operators transition from legacy networks to IP-based infrastructures. |
| • | Rubidium atomic oscillators with various performance levels. |
| • | GPS accessory components, which include receiving antennas, timing antennas, splitters, amplifiers, and lightning protectors. |
| • | Sub-system cards or modules used within another manufacturer’s equipment such as wireless base stations or broadband wireless solutions. These are customized for each manufacturer, using a combination of GPS, quartz oscillators, rubidium atomic oscillators, input/output signals and control algorithms. Some of the control algorithms are contained in our BesTime® technology. |
| • | Time module synchronization sub-systems, which are flexible GPS-disciplined time and frequency platforms optimized for WiMAX and other applications that require precise frequency or time. Our Time module is designed to be integrated into existing communications and transmission equipment used in WiMAX mobile base station timing, broadcast (DVB, DVB-H, DAB, DTV), satellite communications equipment, and cellular base stations (CDMA, TDMA, UMTS for GPS based timing). |
Services
We also provide lifecycle services for Symmetricom product lines. Service offerings fall into five main categories:
| • | Engineering and installation—Our engineering and installation services help customers implement new Symmetricom product purchases. |
| • | Operations and support programs—Our operations and support programs, such as Sync Office Audits, assist customers in maintenance of their sync networks, help ensure power and alarm diversity to avoid service outages and identify system capacity. |
6
Table of Contents
| • | Maintenance—Our maintenance offerings are designed to help customers minimize staff and expenses necessary for ongoing support of their Symmetricom products. These include 24 x 7 technical support, traditional return-to-factory repair services, and on-site repair labor. |
| • | Training, certification programs and professional development courses—Our training courses enable customer personnel to successfully utilize and maintain our products. These programs are also available under license for customers who maintain their own training centers. |
| • | Consulting and other professional services—Our consulting services assist customers in planning new sync communications networks and developing growth or disaster recovery plans for existing sync networks. |
Government Business Unit Markets and Products
Government Business Unit Markets:
The aerospace, defense, metrology, timekeeping, and IT infrastructure markets require precision time and frequency instruments and reference standards. Time and frequency solutions include GPS and time code instrumentation products, bus level timing cards, and precision frequency references (atomic standards). IP network timing products include dedicated network time servers and management and monitoring software that synchronizes the timing on enterprise networks. Space, defense, and avionics applications include highly reliable and ruggedized components and systems designed to address specific customer requirements.
Government Business Unit Products:
We offer a wide variety of precision time and frequency products sold primarily to the aerospace and defense, metrology and IT infrastructure sectors. These products can generally be divided into the following broad categories:
| • | Precision frequency references—Precision Frequency References form the basis of absolute time and frequency in many systems and applications. Our products include active hydrogen masers, cesium frequency standards, rubidium frequency standards, and quartz frequency standards. Our primary reference source instruments provide stand-alone dependability, ease of use, and ease of installation that make them suitable for the critical time or frequency systems found in telecommunications timing, calibration and metrology laboratories, satellite tracking stations and space-based master time standards. |
| • | Bus level timing—We manufacture a broad line of precision timing products in the form of plug-in cards for computers. These cards provide precise timing capabilities to computers equipped with common bus components. We also offer software development tools to speed the integration of these cards into software applications. |
| • | Enterprise network time servers—We manufacture several products for enterprise network time distribution. These bring entire networks of computers into precise time synchronization. |
| • | GPS & time code instrumentation products—We manufacture a wide variety of general purpose and secure GPS receivers, time code generation, translation, measurement, and distribution products. A time code is a data format for recording and processing time measurements. |
| • | Space, defense and avionics—We provide ruggedized and militarized quartz and atomic clock platforms for the most demanding military applications. Our designs are vibration isolated with low sensitivity to acceleration. For space applications such as GPS, where there is a high degree of exposure to radiation, our products are protected by radiation-hardened designs. |
| • | Test & measurement equipment—We provide a line of time and frequency test solutions including a family of Phase Noise and Allan Deviation test sets designed to measure critical performance specifications of precision time and frequency signals and sources. |
7
Table of Contents
| • | Custom time & frequency systems—We design and build custom time and frequency systems to address critical applications in aerospace/defense and government markets. Time scale systems for national time keeping and two way time transfer system for GPS autonomy are examples of systems we deliver to our customers |
Sales Operations
We sell our products directly to customers, through domestic and international distributors, through systems integrators, and manufacturer sales representatives. In the United States, our Communications products are primarily sold through our sales force and manufacturer sales’ representatives to network service operators and network equipment manufacturers. Our Government business unit’s instrumentation products are primarily sold through manufacturer sales representatives and our enterprise products are primarily sold through telesales and the Internet. Internationally, we market and sell our products through our internal sales force, independent sales representatives, distributors, and systems integrators.
Licenses, Patents, Trademarks and Copyrights
We use a combination of trademark rights, copyrights and patent rights, as well as associated registrations, contractual restrictions, and internal security to establish and protect our proprietary rights. As of June 27, 2010, we had 53 active United States patents. The active patents issued will expire between September 2010 and September 2028. We believe that our patents have value, but we rely primarily on innovation, technological expertise, and marketing competence to maintain our competitive advantage. The telecommunications industry is characterized by the existence of a large number of patents and frequent litigation based on allegations of patent infringement. We intend to continue our efforts to obtain patents whenever possible, but there can be no assurance that patents will be issued or that any existing patents or patents that are obtained will not be challenged, invalidated or circumvented, or that the rights granted will provide any commercial benefit to us. Additionally, if any of our processes or designs are identified as infringing upon patents held by others, there can be no assurance that a license will be available, or that the terms of obtaining any such license will be acceptable to us. In addition, the laws of certain countries in which our products may be developed, manufactured or sold may not protect our products and intellectual property rights to the same extent as the laws of the United States. In addition, we use technology licensed from others.
We generally enter into confidentiality agreements with our employees, consultants, and third parties in connection with our technology. These confidentiality agreements generally seek to control access to, and distribution of, our technology, documentation and other proprietary information. Despite these precautions, it may be possible for a third party to obtain and use our proprietary information without authorization or to develop similar technology independently.
In addition, we use trademarks to help identify and market our products and services. We have a number of trademark registrations and pending applications both in the United States and around the world. We rely on these trademark registrations and applications as one of the tools to protect our rights in our trademarks and brands. We also rely on our common law trademark rights in those countries that recognize such rights, such as the United States. We can provide no assurance, however, that any of our trademark applications will be successful, or that our existing registrations will not be challenged or invalidated. Likewise, we can provide no assurance that our registrations, applications or common law rights will enable us to stop others from infringing upon our trademarks, or enable us to successfully defend against claims of trademark infringement. Furthermore, effective trademark protection may not be available in every country in which our products and services are distributed.
We also have copyrights on our software products, product documentation, marketing materials, and other documentation and materials. We rely on these copyrights to protect our rights in our copyrighted materials. We can provide no assurance, however, that our copyrighted materials will not be infringed. In addition, effective copyright protection may not be available in every country in which our products are distributed.
8
Table of Contents
Manufacturing
Our manufacturing process primarily consists of assembly, test, configuration and logistics at our manufacturing sites in Aguadilla, Puerto Rico; Beverly, Massachusetts; and Tuscaloosa, Alabama. In addition, custom and semi-custom instrumentation products are developed, assembled, and tested in Santa Rosa, California and Boulder, Colorado. The Boulder, Colorado and Santa Rosa, California facilities are registered to ISO9000:2000, while our Beverly, Massachusetts; Aguadilla, Puerto Rico and San Jose, California (engineering processes) have been upgraded to meet the TL 9000 quality system standard (an advanced telecommunications standard for manufacturing and engineering). Our Beverly, Massachusetts facility is also registered to AS9100 which certifies the design, development, and production of high precision time and frequency references for commercial military and space markets.
We use various contract manufacturers to build our printed board assemblies and in some cases full product fabrication. During fiscal 2008 and 2009, we outsourced all of our printed circuit board assemblies from our Puerto Rico facility to Sanmina-SCI Corporation (Sanmina-SCI), which has facilities in China, the United States, and other regions, in order to lower manufacturing costs and take advantage of best-in-class production processes.
In the fourth quarter of fiscal 2010, we announced a plan to transfer product fabrication processes and related activities from our Aguadilla, Puerto Rico facility to Sanmina-SCI facilities. As part of the plan, we plan to eliminate approximately 150 positions, or about 20% of our total workforce. The plan is underway and expected to be completed by the end of the third quarter of fiscal 2011.
Seasonality
Our business tends to generate stronger revenues in the second half of the fiscal year as communications service providers release their capital budgets for the calendar year.
Backlog
Our backlog consists of firm orders that have yet to be shipped to the customer. Our total backlog was $42.5 million as of June 27, 2010, compared with $46.9 million as of June 28, 2009. Most orders included in backlog can be rescheduled or cancelled by customers without significant penalty. Historically, a substantial portion of net revenue in any fiscal period has been derived from orders received during that fiscal period. Our backlog may also be affected by the cancellation or delay of customer orders, the overall condition of the telecommunications industry, overall worldwide economic conditions and the cyclical nature of customer demand in each of our markets.
Key Customers and Export Sales
During fiscal 2010, no single customer accounted for more than 10% of our net revenue. Our export sales outside the United States accounted for 33%, 36% and 33% of our net revenue in fiscal 2010, 2009, and 2008 respectively. For additional information regarding our export sales, see Note 15 to our consolidated financial statements.
Sales and purchase obligations denominated in foreign currencies have not been significant. We do not currently engage in currency hedging activities or derivative arrangements but may do so in the future to the extent that foreign currency transactions become more significant.
Competition
Competition in the communications industry is intense. Some of our competitors or potential competitors are well established and have significant financial, manufacturing, technical and marketing resources. Competitors of our synchronization products include Brilliant Telecommunications, Emrise Corp., Frequency
9
Table of Contents
Electronics, Inc., Huawei Technologies Co. Ltd., and Oscilloquartz SA. Competitors of our embedded components and software products include Frequency Electronics, Inc. and Trimble Navigation, Ltd. Competitors of our Government business unit products include Brandywine Communications, EndRun Technologies, Frequency Electronics, Inc., Meinberg, Orolia and Trak Systems, Inc. (a Veritas Corporation subsidiary).
Research and Development
Our development efforts include designing and developing hardware and software products, and providing enhanced functionality to our existing products. We also do primary research in fundamental time and frequency components and systems paid for by the U.S. government. In addition to our research and development programs listed below, we utilize domestic and international contractors (primarily in India) to assist us in our research and development activities. Our product development programs include:
| • | Communications synchronization |
| • | Network management software |
| • | Network time servers |
| • | Ruggedized time and frequency component for space, defense and avionic applications |
| • | Precision time and frequency references |
| • | Primary frequency references |
| • | GPS-based time and frequency instruments and bus cards |
| • | Time and frequency distribution products |
| • | Phase noise test sets |
| • | Timescale systems |
| • | Time and frequency reference systems |
In fiscal 2010, we enhanced our Communications portfolio by expanding our IEEE 1588 (PTP) offering to include the TimePictra 4.0 end-to-end synchronization management platform, a line of embedded sync software solutions, TimeAnalyzer test and measurement tools, and a client reference design for network equipment manufacturers implementing Carrier Ethernet. For Government markets, we introduced an IEEE 1588 PTP v.2 grandmaster clock for ultra-precise time over Ethernet networks, PCI time and frequency computer plug-in cards, a commercial time-scale system, and an enhanced time and frequency receiver.
In fiscal 2010, 2009 and 2008, overall research and development expenditures were $23.7, $23.4 million and $22.7 million; respectively. We expensed all research and development expenditures as they were incurred. We expect to continue to support research and development efforts in order to enhance existing products and to design and develop new technologies and products.
Our primary product development centers are in San Jose, California; Santa Rosa, California; Boulder, Colorado; Beijing, China and Beverly, Massachusetts.
Government Regulation
The telecommunications industry is subject to domestic and foreign regulatory policies regarding pricing, taxation and tariffs, which may adversely impact the demand for our products. These policies are continuously reviewed and subject to change by the various governmental agencies. We are also subject to government regulations and standards for our products, as well as import and export regulations. We must comply with and are affected by laws and regulations relating to the award, administration and performance of U.S. government
10
Table of Contents
contracts. Government contract laws and regulations affect how we do business and, in some instances, impose added costs on our business. A violation of specific laws and regulations could result in the imposition of fines and penalties or the termination of our contracts or debarment from bidding on contracts. See Item 1A, “Risk Factors,” for more information.
Environmental Regulation
Our operations are subject to numerous foreign, federal, state and local environmental regulations related to the storage, use, discharge and disposal of toxic, volatile or otherwise hazardous chemicals and materials used in our manufacturing processes and products. Failure to comply with such regulations could result in a suspension or cessation of our operations, or could subject us to significant future liabilities. See “Item 3. Legal Proceedings” and “Item 1A. Risk Factors—Our sales and operating results may be adversely affected as a result of our required compliance with the adopted European Union Directives on Waste Electrical and Electronic Equipment, the Restriction of the Use of Hazardous Substances in electrical and electronic equipment and the Registration, Evaluation, Authorization and Restriction of Chemicals, as well as other standards around the world.”
Sources and Availability of Raw Materials
We endeavor to use standard parts and components, which are generally available from multiple sources. We make significant purchases of parts and components from third-party suppliers. Certain parts used in our manufacturing process are single sourced and may have extended lead times.
Employees
At June 27, 2010, we had approximately 700 employees. We believe that our employee relations are good.
11
Table of Contents
Executive Officers of Symmetricom
Following is a list of our executive officers as of August 31, 2010 and brief summaries of their business experience over the last five years. All officers, including executive officers, are appointed annually by the Board of Directors at its meeting following the annual meeting of stockholders. We are not aware of any officer who was appointed to the office pursuant to any arrangement or understanding with another person.
| Name |
Age | Position | ||
| David G. Côté |
56 | President and Chief Executive Officer | ||
| Justin R. Spencer |
39 | Chief Financial Officer | ||
| James Armstrong |
44 | Executive Vice President & General Manager, Communications Business Unit | ||
| Daniel Scharre |
59 | Executive Vice President & General Manager, Government Business Unit | ||
| Philip Bourekas |
46 | Executive Vice President, Marketing | ||
| Juan Dewar |
49 | Executive Vice President, Global Sales & Support |
Mr. Côté was appointed as President and Chief Executive Officer of Symmetricom in August 2009. Prior to joining Symmetricom, Mr. Côté was Chief Executive Officer and President at Packeteer, Inc., a leading provider of Internet application infrastructure systems, from 2002 to 2008.
Mr. Spencer has served as Chief Financial Officer of Symmetricom since September 2008. Prior to joining Symmetricom, Mr. Spencer served as Chief Financial Officer at Covad Communications, a provider of broadband integrated voice and data communications, from June 2007 until April 2008. From November 2002 until May 2007, Mr. Spencer served in various positions at Covad including Interim Chief Financial Officer, Vice President of Finance, and corporate development and product management roles.
Dr. Armstrong has served as Executive Vice President and General Manager, Communications Business Unit, since February 2008. Mr. Armstrong joined Symmetricom in September 2006 and served as Vice President of Engineering for the Communications Business Unit from September 2006 to January 2008. From July 2002 to May 2006, Mr. Armstrong was the Vice President of Engineering and later President of Movidis, Inc., a developer of network equipment for the OEM and enterprise markets.
Dr. Scharre has served as Executive Vice President and General Manager, Government Business Unit, since August 2010. Dr. Scharre joined Symmetricom in April 2010 and served as Vice President of Marketing and Business Development for the Government Business Unit from April 2010 to August 2010. From August 2007 to November 2009, Dr. Scharre was the Chief Executive Officer of Calient Networks, a manufacturer of fiber optic cross-connection systems for telecommunications service providers; from November 2006 to August 2007, he was the Chief Operations Officer of Teak Technologies, a provider of Ethernet switching solutions; and from December 2004 to June 2006, he was the Chief Executive Officer of Loea Corporation, a developer of high-bandwidth, wireless point-to-point networking solutions.
Mr. Bourekas joined Symmetricom as Executive Vice President, Marketing, in November 2009. Prior to joining Symmetricom, Mr. Bourekas served in a variety of roles at Integrated Device Technology, Inc., a developer of mixed signal semiconductor solutions for digital media, from August 1988 to April 2009, including as VP of Worldwide Marketing, VP and GM of the Audio Products Division, and VP of Strategic Marketing for Computing and Consumer Products.
Mr. Dewar joined Symmetricom as Executive Vice President, Worldwide Sales in March 2010. Prior to joining Symmetricom, Mr. Dewar served as Vice President Worldwide Sales of Pureenergy Solutions, a provider of wire-free power and energy storage solutions, during 2009. From 2006 to 2008, Mr. Dewar served as CEO and Senior Vice President, Global Sales and Services at Tira Wireless, a mobile content porting company. Mr. Dewar served in various positions at Sun Microsystems, Inc. from 1997 to 2006.
12
Table of Contents
| Item 1A. | Risk Factors |
Our quarterly and annual operating results have fluctuated in the past and will likely continue to fluctuate in the future, which could cause our stock price to be volatile and result in losses to our investors
We believe that period-to-period comparisons of our operating results may not be a good indication of our future performance. Our quarterly and annual operating results have fluctuated in the past and will likely continue to fluctuate in the future. Some of the factors that could cause our future operating results to fluctuate include:
| • | the resumption of recent adverse economic conditions, particularly within the telecommunications equipment industry, which may result in revenue declines; |
| • | our dependence upon obtaining orders during a quarter and shipping those orders in the same quarter to achieve our revenue objectives; |
| • | our ability to manage increased competition and competitive pricing pressures; |
| • | our ability to accurately anticipate the volume and timing of customer orders or customer cancellations; |
| • | the gain or loss of significant customers; |
| • | changes in our products or mix of sales to customers; |
| • | the possibility that, despite our having been approved as a supplier in requests for proposals from several major Communications customers, these proposals will not result in any purchases; |
| • | timing of purchases from customers on projects may be impacted due to spending delays, availability of resources for installation, and delays in new product availability; |
| • | market acceptance of new or enhanced versions of our products and our competitors’ products; |
| • | our ability to manage the long sales cycle associated with our products; |
| • | customer delays in upgrading their old equipment with our new products; |
| • | our ability to obtain sufficient supplies of sole or limited source components at commercially reasonable prices; |
| • | our ability to introduce new products in new and existing markets on a timely and cost-effective basis; |
| • | customer delays in qualification of new products; |
| • | fluctuations in government spending for infrastructure investment; |
| • | increased industry consolidation among our customers, which may lead to decreased demand for, and downward pricing pressure on the prices of, our products; |
| • | our ability to manage cyclical conditions in the telecommunications industry; |
| • | reduced rates of growth of telecommunications services; |
| • | our ability to manage the level and value of our inventories in relation to sales volume; |
| • | our ability to manage fluctuations in the average selling prices of our products; |
| • | our ability to retain key employees, which could affect our ability to sell, develop and deliver our products; |
| • | our ability to manage fluctuations in manufacturing yields of rubidium oscillators and cesium tubes; |
| • | our ability to timely implement changes developed as a result of our process improvement projects without negatively impacting operations; |
13
Table of Contents
| • | customers in the Communications market may switch from buying rubidium-based products, which we internally manufacture, to quartz-based products, which we purchase and sell at a lower price point, which may result in lower revenue and gross margins; |
| • | customer labor strikes, which could result in reduced sales volume; |
| • | our ability to collect receivables from our customers; |
| • | deferring revenue for orders shipped in a period, especially for new markets; |
| • | our ability to establish in a timely fashion subsidiaries in new geographic regions, which our customers or potential customers may require to do business with us in those regions; |
| • | foreign currency fluctuations; |
| • | our ability to manage complex transactions with customers in new geographic regions; |
| • | restructuring and integration-related charges; and |
| • | intangible assets impairment charges related to acquisitions and related long-term assets. |
A significant portion of our operating and manufacturing expenses are relatively fixed in nature, and planned expenditures are based in part on anticipated orders. If we are unable to adjust spending in a timely manner to compensate for any unexpected future sales shortfall, our operating results will be negatively impacted. Our operations entail a high level of fixed costs and require an adequate volume of production and sales to achieve and maintain reasonable gross profit margins and net earnings. Significant decreases in demand for our products or reduction in our average selling prices, or any material delay in customer orders may negatively harm our business, financial condition and results of operations. Our future results depend in large part on growth in the markets for our products.
The growth in each of these markets may depend on changes in general economic and regulatory conditions, conditions related to the markets in which we compete, changes in regulatory conditions, legislation, export rules or conditions, interest rates and fluctuations in the business cycle for any particular market segment. If our quarterly or annual operating results do not meet the expectations of securities analysts and investors, the trading price of our common stock could decline significantly.
If we fail to properly transition our manufacturing currently performed at our Puerto Rico facility to our contract manufacturer, we may experience shipment delays, cost overruns, excess inventory and/or other problems, which may adversely impact our business and operating results, and we will be dependent on this contract manufacturer
Prior to the fourth quarter of fiscal 2010, we contracted with Sanmina-SCI to produce sub-assemblies as part of our outsourced manufacturing strategy. In a significant expansion of this agreement, we announced in the fourth quarter of fiscal 2010 that we were transitioning all manufacturing at our Puerto Rico facility, which is our largest manufacturing facility, to Sanmina-SCI.
We expect to complete this transition by the fourth quarter of fiscal 2011. If the transition does not go as expected, it could result in the following in addition to other potential issues, each of which could have an adverse effect on our business and operating results and our business reputation:
| • | delay of shipments; |
| • | unexpected cost overruns; |
| • | overstock of inventory as a result of building excessive buffer stock; and |
| • | quality issues with outsourced products. |
14
Table of Contents
Once the transition is complete, our reliance on one primary contract manufacturer to produce a significant portion of our products could expose us to the following potential risks in addition to others, each of which could have an adverse effect on our business and operating results:
| • | less control over product quality, leading to product reliability problems; |
| • | increased costs and/or product shipment delays; and |
| • | any financial problems at Sanmina-SCI either limiting supply or increasing our costs. |
In addition, we cannot assure you that Sanmina-SCI will continue to be willing and able to meet our requirements for our outsourced operations, which could have an adverse effect on our business and operating results.
A substantial portion of our quarterly revenue is attributable to shipments made in the latter part of each respective quarter
Typically, approximately 50% or more of our quarterly shipments occur in the last month of the quarter. In addition, a substantial portion of these quarterly shipments are ordered by our customers and shipped within the same quarter. If these orders or shipments are either delayed or the orders are not received, material fluctuations in our quarterly revenues and operating results will occur, and could cause our quarterly profitability to fall significantly short of our predictions.
The telecommunications and government markets are highly competitive, and if we are unable to compete successfully in our markets, our revenue could decline
Competition in the telecommunications industry, in general, and in the markets we serve, is intense and likely to increase substantially. We face competition in all of our markets. Competitors of our synchronization products include Brilliant Telecommunications, Emrise Corp., Frequency Electronics, Inc., Huawei Technologies Co. Ltd., and Oscilloquartz SA. Competitors of our embedded components products include Frequency Electronics, Inc. and Trimble Navigation, Ltd. Competitors of our Government business unit products include Brandywine Communications, EndRun Technologies, Frequency Electronics, Inc., Meinberg, Orolia and Trak Systems, Inc. (a Veritas Corporation subsidiary). In addition, the Telecommunications Act of 1996 permits ILECs to manufacture telecommunications equipment, which may result in increased competition. Our ability to compete successfully in the future will depend on many factors including:
| • | the cost-effectiveness, quality, price, service and market acceptance of our products; |
| • | our response to the entry of new competitors into our markets or the introduction of new products by our competitors; |
| • | the average selling prices for our products; |
| • | increased industry consolidation among our customers, which may lead to decreased demand for, and downward pricing pressure on the prices of, our products; |
| • | our ability to keep pace with changing technology and customer requirements; |
| • | our continued improvement of existing products; |
| • | the timely development or acquisition of new or enhanced products; |
| • | the timing of new product introductions by our competitors or us; and |
| • | changes in worldwide market and economic conditions. |
Some of our competitors or potential competitors are well established and have significant financial, manufacturing, technical and marketing resources. These competitors may be able to respond more quickly to
15
Table of Contents
new and emerging technologies and changes in customer requirements, to devote greater resources to the development, promotion and sale of products, or to deliver competitive products at lower prices. We expect to continue to experience pricing pressures from our competitors in all of our markets. If we are unable to compete by delivering new products or by delivering competitive products at lower prices, we could lose market share and our revenue could decline.
We have relied and may continue to rely on a limited number of customers for a significant portion of our net revenue, and our revenue could decline due to lower orders, the delay of customer orders or cancellation of existing orders
During fiscal 2010 and 2009, no single customer accounted for more than 10% of our revenue. During fiscal 2008, two customers each accounted for more than 10% of our revenue. Nevertheless, we expect that we will continue to depend on a relatively small number of customers for a substantial portion of our net revenue for the foreseeable future. The timing and level of sales to our largest customers have fluctuated significantly in the past and are expected to continue to fluctuate significantly in the future. The loss of one or more of our significant customers, or a significant reduction or delay in sales to any customer, may harm our business and operating results. Major customers also have significant leverage and may attempt to change the terms, including pricing, upon which we do business, which could also harm our business and operating results.
We have direct or indirect sales pursuant to contracts with U.S. government agencies, which can be terminated at the convenience of the government, and our revenue would decline if the government terminated these contracts
Approximately 15% to 20% of our net revenue has been generated from sales to U.S. government agencies either directly or indirectly through subcontracts. Government-related contracts and subcontracts are subject to standard provisions for termination at the convenience of the government. In such event, however, we are generally entitled to reimbursement of costs incurred on the basis of work completed plus other amounts specified in each individual contract. These contracts and subcontracts are either fixed-price or cost reimbursable contracts. Fixed-price contracts provide fixed compensation for specified work. Under cost reimbursable contracts, we agree to perform specified work in return for reimbursement of costs (to the extent allowable under government regulations) and a specified fee. In general, while the risk of loss is greater under fixed-price contracts than under cost reimbursable contracts, the potential for profit under fixed-price contracts is greater than under cost reimbursable contracts. In addition, delays in approvals of the annual defense budget or supplemental funding bills may also impact government sales.
If we are unable to develop new products, or we are delayed in production startup, our sales could decline
The markets for our products are characterized by:
| • | rapidly changing technology; |
| • | evolving industry standards; and |
| • | changes in end-user requirements. |
Technological advancements could render our products obsolete and unmarketable. Our success will depend on our ability to respond to changing technologies and customer requirements, and our ability to develop and introduce new and enhanced products in a cost-effective and timely manner. The development of new or enhanced products is a complex and uncertain process requiring the accurate anticipation of technological and market trends. We may experience design, manufacturing, marketing, and other difficulties that could delay or prevent the development, introduction or marketing of our new products and enhancements.
The introduction of new or enhanced products also requires that we manage a smooth transition from older products to new products. Delays in new product development or delays in production startup could reduce our sales.
16
Table of Contents
Our customers may be subject to governmental regulations, which, if changed, could negatively impact our business results
Federal and state regulatory agencies, including the United States Federal Communications Commission and the various state public utility commissions and public service commissions, regulate most of our domestic telecommunications customers. Similar government oversight also exists in the international market. While we are not directly affected by this legislation, such regulation of our customers may negatively impact our business. For instance, the sale of our products may be affected by the imposition upon certain of our customers of common carrier tariffs and the taxation of telecommunications services. These regulations are continuously reviewed and changed by the various governmental agencies. Changes in current or future laws or regulations, in the United States or elsewhere, could negatively impact our business results.
We perform increasing amounts of research and development and manufacturing offshore to lower costs; these efforts may impact our ability to deliver products to our customers, complete research and development projects on a timely basis, and cause potential misappropriation of our intellectual property
We depend upon research and development and manufacturing activities outside of the United States, and as our international research and development and manufacturing activities increase, we will be increasingly exposed to various legal, business, political and economic risks associated with these international operations. In particular, over the past few years, we have developed a research and development facility in Beijing, China and outsourced a portion of our manufacturing to a contract manufacturer at a facility in Southern China. While these activities have allowed us to reduce costs, they have and will continue to expose us to risks inherent in doing business in the People’s Republic of China. We cannot assure you that labor disruptions, currency fluctuations, and misappropriation of our intellectual property and other risks will not occur, any of which could materially adversely impact our ability to deliver products to our customers and our operating results.
We purchase certain key components from single or limited sources and could lose sales if these sources fail to fulfill our needs
We have limited or single source suppliers for a number of our components. If single source components were to become unavailable on satisfactory terms, we would be required to purchase comparable components from other sources. If for any reason we could not obtain comparable replacement components from other sources in a timely manner, our business, results of operations and financial condition could be harmed. In addition, some of our suppliers require long lead times to deliver requested quantities of components. If we are unable to obtain sufficient quantities of components, we could experience delays or reductions in product shipments, which could also have a material adverse effect on our business, results of operations and financial condition. Due to rapid changes in technology, on occasion, one or more of the components used in our products could become unavailable, resulting in unanticipated redesign and related delays in shipments.
As a U.S. government contractor, we are subject to a number of rules and regulations
We must comply with and are affected by laws and regulations relating to the award, administration and performance of U.S. government contracts. Government contract laws and regulations affect how we do business and, in some instances, impose added costs on our business. A violation of specific laws and regulations could result in the imposition of fines and penalties or the termination of our contracts or debarment from bidding on contracts. In order to administer certain U.S. government contracts we are required to have employees with Top Secret Security Clearance. Because we have a limited number of employees with such clearance, the loss of these employees could adversely affect our ability to administer these contracts. We must also have auditors from our independent registered public accounting firm with proper security clearance levels to perform an annual audit of revenue for these transactions.
17
Table of Contents
We may pursue acquisitions and investments that could harm our operating results and may disrupt our business
We have engaged in acquisitions in the past, including the acquisitions of TrueTime, Datum, QoSmetrics, S.A. and TSC, and may pursue other acquisition and investment opportunities that could provide additional product or service offerings, technologies or additional industry expertise. Acquisitions involve risks, which include the following:
| • | we may be exposed to unknown liabilities of the acquired business; |
| • | we may not realize the revenue, cost savings or profits that we expect the acquired business to generate and incur significant write-offs; |
| • | we may encounter unanticipated acquisition or integration costs that could cause our quarterly or annual operating results to fluctuate; |
| • | our management’s attention may be diverted from our core business; and |
| • | we may not be successful in entering new markets in which we have no or limited experience. |
If we fail to successfully integrate acquisitions or to achieve any anticipated benefits of an acquisition, our operations and business could be harmed.
Sales of a significant portion of our products to customers outside of the United States subjects us to business, economic and political risks
Our export sales to Europe, Latin America, Asia, and Canada continue to account for a significant portion of our revenue. We anticipate that sales to customers located outside of the United States will continue to be a significant part of our net revenue for the foreseeable future. Because significant portions of our sales are to customers outside of the United States we are subject to risks, including:
| • | foreign currency fluctuations; |
| • | the effects of terrorist activity and armed conflict, which may disrupt general economic activity and result in revenue shortfalls; |
| • | export restrictions; |
| • | longer payment cycles; |
| • | unexpected changes in regulatory requirements or tariffs; |
| • | protectionist laws and business practices that favor local competition; |
| • | dependence on local vendors; |
| • | reduced or limited protection of intellectual property rights; and |
| • | political and economic instability. |
To date, very few of our international revenue and cost obligations have been denominated in foreign currencies. As a result, an increase in the value of the United States dollar relative to foreign currencies could make our products more expensive, and thus, less competitive in foreign markets. A portion of our international revenues may be denominated in foreign currencies in the future, including the Euro, which will subject us to risks associated with fluctuations in these foreign currencies. We do not currently engage in foreign currency hedging activities or derivative arrangements, but may do so in the future to the extent that such obligations become more significant.
In many foreign countries, particularly in those with developing economies, it is common to engage in business practices that are prohibited by laws and regulations applicable to us, such as the Foreign Corrupt
18
Table of Contents
Practices Act. Although we implement policies and procedures designed to facilitate compliance with these laws, our employees, contractors and agents, as well as those companies to which we outsource certain of our business operations, may take actions in violation of our policies. Any such violation, even if prohibited by our policies, could have a material adverse effect on our business.
If we have significant inventories that become obsolete or cannot be sold at acceptable prices, our results may be negatively impacted
Although we believe that we currently have made adequate adjustments for inventory that has declined in value, become obsolete, or is in excess of anticipated demand, there can be no assurance that such adjustments will be adequate. If significant inventories of our products become obsolete, or are otherwise not able to be sold at favorable prices, our results of operations could be materially affected.
Our sales and operating results may be adversely affected as a result of our required compliance with the adopted European Union Directives on Waste Electrical and Electronic Equipment, the Restriction of the Use of Hazardous Substances in electrical and electronic equipment and the Registration, Evaluation, Authorization and Restriction of Chemicals, as well as other standards around the world
In January 2003, the European Union enacted Directive 2002/96/EC on the Waste Electrical and Electronic Equipment Directive, known as the WEEE Directive. The WEEE Directive requires producers of certain electrical and electronic equipment to be financially responsible for the future disposal costs of this equipment. Some of our products fall within the scope of this Directive, and, as such, we will incur some financial responsibility for the collection, recycling, treatment and disposal of both new product sold, and product already sold prior to the WEEE Directive’s enforcement date, to customers within the European Union.
At the same time, the European Union also enacted Directive 2002/95/EC on the Restriction of the use of Hazardous Substances in electrical and electronic equipment, known as the RoHS Directive. This Directive restricts the use of certain hazardous substances, including mercury, lead, cadmium, hexavalent chromium and certain flame retardants, used in the construction of component parts of electrical and electronic equipment. We may need to change our manufacturing processes, redesign or reformulate some of our products, and change some components to eliminate these hazardous substances in our products, in order to be able to continue to offer them for sale within the European Union.
Recently, the European Union launched the Registration, Evaluation, Authorization and Restriction of Chemicals (REACH) initiative that will require parties throughout the supply chain to register, assess and disclose information regarding many chemicals in their products. Depending on the types, applications, forms and uses of chemical substances in various products, REACH could lead to restrictions and/or bans on certain chemical usage.
Individual European Union member states are required to transpose the Directives into national legislation. Although not all European Union member states have enacted legislation to implement these two Directives, we continue to review the applicability and impact of both Directives on the sale of our products within the European Union. If we fail to comply with these laws, we may be forced to recall products and cease their manufacture and distribution, and we could be subject to civil or criminal penalties. We may incur increased manufacturing costs, and some products may be subject to production delays to comply with future legislation which implements these Directives, but we cannot currently estimate the extent of such increased costs or production delays, if any. However, to the extent that any such cost increases or delays are substantial, our operating results could be materially adversely affected. Also, we are aware that lead times for new, compliant components are longer and that older, non-compliant components are being discontinued at a fast pace. In addition, we are aware of similar legislation that may be enacted in other countries and possible new federal and state legislation in the United States, the cumulative impact of which could significantly increase our operating costs and adversely affect our operating results.
19
Table of Contents
Our products are complex and may contain errors or design flaws, which could be costly to correct
Our products are complex and often use state-of-the-art components, processes and techniques. When we release new products, or new versions of existing products, they may contain undetected or unresolved errors or defects. Despite testing, errors or defects may be found in new products or upgrades after the commencement of commercial shipments. Undetected errors and design flaws have occurred in the past and could occur in the future. These errors could result in delays, loss of market acceptance and sales, diversion of development resources, damage to our reputation, legal action by our customers, failure to attract new customers, and increased service and warranty costs. The occurrence of any of these factors could cause our net revenue to decline.
If we fail to protect our intellectual property, our competitive position could be weakened and our revenues may decline
We believe our success will depend in a large part on our ability to protect trade secrets, obtain or license patents, and operate without infringing on the rights of others. We rely on a combination of trademark, copyright and patent registration, contractual restrictions and internal security to establish and protect our proprietary rights. These measures may not provide sufficient protection for our trade secrets or other proprietary information. We have United States and international patents and patent applications pending that cover certain technology used by our operations. However, while we believe that our patents have value, we rely primarily on innovation, technological expertise and marketing competence to maintain our competitive position. While we intend to continue our efforts to obtain patents whenever possible, there can be no assurance that patents will be issued, or that new, or existing patents will not be challenged, invalidated or circumvented, or that the rights granted will provide us with any commercial benefit.
We are subject to environmental regulations that could result in costly environmental liability
Our operations are subject to numerous international, federal, state and local environmental regulations related to the storage, use, labeling, discharge, disposal and human exposure to toxic, volatile or otherwise hazardous chemicals used in our manufacturing process. While we have not experienced any significant effects on our operations from environmental regulations, changes in these regulations may require additional capital expenditures or restrict our ability to expand our operations. Failure to comply with such regulations could result in suspension or cessation of our operations or could subject us to significant liabilities. We could also be subject to fines and civil or criminal sanctions, third-party property damage or personal injury claims, or could be required to incur substantial investigation or remediation costs, if we were to violate or become liable under environmental laws. Liability under environmental laws can be joint and several and without regard to comparative fault. Although, we periodically review our facilities and internal operations for compliance with applicable environmental regulations, these reviews are necessarily limited in scope and frequency and may not reveal all potential instances of noncompliance, possible injury or possible contamination. There can be no assurance that violations of environmental laws or regulations will not occur in the future as a result of the inability to obtain permits, human error, equipment failure or other causes. The liabilities arising from any noncompliance with environmental regulations, or liability resulting from accidental contamination or injury from toxic or hazardous chemicals could result in liability that exceeds our resources. The risk of liabilities increases as we acquire other companies, such as Datum, which use, or have used, hazardous substances at various current or former facilities.
A manufacturing facility previously operated by Datum in Austin, Texas is undergoing remediation for known subsurface contamination at that facility and adjoining properties. We believe that we will incur monitoring costs for years to come in connection with this subsurface contamination. Further, we have received a demand from adjoining landowner and may be subject to claims from other adjoining landowners, in addition to claims for remediation, and the amount of these costs and the extent of our exposure to these demands and claims cannot be determined at this time.
20
Table of Contents
The determination of the existence and cost of any additional contamination could involve costly and time-consuming negotiations and litigation. Remediation activities and subsurface contamination may require us to incur additional unreimbursed costs and could harm on-site operations and the future use and value of the property. The remediation efforts, the property owner’s claims and any related governmental action may expose us to material liability and could significantly harm our business.
Third parties may assert intellectual property infringement claims, which would be costly to defend and may result in our loss of significant rights
The technology industry is characterized by the existence of a large number of patents and frequent litigation based on allegations of patent infringement. We are subject to the risk of adverse claims and litigation alleging infringement of the intellectual property rights of others. From time to time we have received claims asserting that we have infringed the proprietary rights of others. We cannot assure you that third parties will not assert infringement claims against us in the future, or that any such claims will not result in costly litigation or require us to obtain a license for such intellectual property rights regardless of the merit of such claims. No assurance can be given that any necessary licenses will be available or that, if available, such licenses can be obtained on commercially reasonable terms. In the event any necessary licenses are not available, we may not be able to sell or distribute our products, which may have a material adverse effect on our business.
We are subject to other significant domestic and foreign regulations relating to health and safety, packaging, product content and labor regulations
Our business is subject to various other significant international, federal, state and local, health and safety, packaging, product content and labor regulations. These regulations are complex, change frequently and have become more stringent over time. We may be required to incur significant expenses to comply with these regulations or to remedy past violations of these regulations. Any failure by us to comply with applicable government regulations could also result in cessation of our operations or portions of our operations, product recalls or impositions of fines and restrictions on our ability to carry on or expand our operations. In addition, because many of our products are regulated or sold into regulated industries, we must comply with additional regulations in marketing our products. Our products and operations are also often subject to the rules of industrial standards bodies, like the International Standards Organization, as well as regulation of other agencies such as the United States Federal Communications Commission. If we fail to adequately address any of these regulations, our business may suffer.
We may be subject to additional taxes from tax reviews by foreign authorities
Although we believe that we have made adequate reserves for foreign tax provisions, there can be no assurance that such reserves will be adequate until the foreign authorities have reviewed the foreign tax filings.
Our critical business and manufacturing facilities in Beverly, Massachusetts; San Jose, California; Santa Rosa, California; Puerto Rico; Tuscaloosa, Alabama, and Boulder, Colorado, as well as many of our customers and suppliers, are located near known hurricane zones, earthquake fault zones, tornado zones, and flood plains, and the occurrence of these events or other catastrophic disasters could cause damage to our facilities and equipment, which could require us, as well as our customers and suppliers to cease, curtail or disrupt operations
Capacity constraints, systems failures or security breaches could prevent access to our computer systems, which could interrupt our business and harm our daily operations
Our business goals of performance, reliability and availability require that we have adequate capacity in our computer systems to support our operations. As our operations grow in size and scope, we will need to improve and upgrade our systems and infrastructure to offer internal personnel enhanced services, capacity, features and
21
Table of Contents
functionality. Our ability to provide high-quality service depends on the efficient and uninterrupted operation of our computer and communications systems. Our computer system has experienced system interruptions from time to time and could experience periodic system interruptions in the future. Our systems and operations are also vulnerable to damage or interruption from human error, natural disasters, power loss, telecommunication failures, break-ins, sabotage, computer viruses, design defects, vandalism, denial-of-service attacks and similar events. Even though we have a formal disaster recovery plan, it may not completely prevent any system failure or security breach that causes an interruption in our business and daily operations.
We may be impacted by disruptions and liquidity issues in the credit market, which may unfavorably impact our financial condition and results of operations
We invest excess funds in specific instruments and issuers approved for inclusion in our cash and short-term investment accounts. Our investment criteria are to invest only in top tier quality investments or federally sponsored investments. Top tier quality investments are determined by our investment advisor in conjunction with ratings of those investments provided by outside ratings agencies as well as our investment advisor’s internal credit specialists. Our cash consists of overnight instruments and instruments that will mature within ninety days from the date of purchase. Our short-term investment portfolio consists of instruments that mature between ninety-one days and three years after the end of our fiscal quarter.
Based upon recent events in the credit market, we may be impacted by the following risks:
| • | We may experience temporary or permanent declines in the value of certain instruments which would be reflected in our consolidated financial statements. During fiscal 2009, we recorded $1.4 million in losses related to short-term investments; |
| • | We may experience rating agency downgrades of instruments we currently own which may degrade our portfolio quality and cause us to take impairment charges; |
| • | We may not be able to reasonably value our investments if there is not a liquid resale market for those instruments; and, |
| • | We may experience losses on the sale of certain instruments if we do not have sufficient operating cash to run our business and are required to sell short-term investments to meet cash flow requirements |
In addition to the above risks, the recent events in the credit market may also impact our customers, and we may be impacted by the following risks:
| • | We may experience lower revenues if our customers decide to reduce their capital spending plans; |
| • | Customers may delay payments to us reducing our operating cash flow; and |
| • | We may experience an increase in accounts receivable write-offs if customers are unable to pay their obligations. |
Public confidence and share value may be adversely impacted by material weaknesses in our internal controls over financial reporting
Section 404 of the Sarbanes-Oxley Act of 2002 requires us to evaluate the effectiveness of our internal controls over financial reporting and to include a management report assessing the effectiveness of our internal controls over financial reporting in all annual reports. Section 404 also requires our independent registered public accounting firm to attest to the effectiveness of our internal controls over financial reporting.
In past years, we have identified material weaknesses that have led us to restate our consolidated financial statements. Because of inherent limitations, our internal control over financial reporting may not prevent or detect misstatements, errors or omissions, and any projections of any evaluation of effectiveness of internal
22
Table of Contents
controls to future periods are subject to the risk that controls may become inadequate because of changes in conditions or that the degree of compliance with our policies or procedures may deteriorate. We cannot be certain in future periods that other control deficiencies that may constitute one or more “significant deficiencies” (as defined by the relevant auditing standards), or material weaknesses in our internal control over financial reporting, will not be identified. If we fail to maintain the adequacy of our internal controls, including any failure to implement or difficulty in implementing required new or improved controls, our business and results of operations could be harmed, the results of operations we report could be subject to adjustments, we could fail to be able to provide reasonable assurance as to our financial results or the effectiveness of our internal controls or meet our reporting obligations, and there could be a material adverse effect on our stock price.
If we incur net losses or substantially lower profit in the future, we may have to record a valuation allowance against some of our deferred tax assets, which would significantly increase our tax expense and harm our net earnings
Future losses or low profitability may create uncertainty about the realizability of our $43.7 million net deferred tax assets. If we record a valuation allowance against our deferred tax assets, we would record an additional tax expense, which would reduce net income. In addition, uncertainties about the realizability of our deferred tax assets could limit our ability to recognize future deferred tax assets on our balance sheet and correspondingly reduce net earnings. At the end of each fiscal quarter, our management reviews the results of operations for that quarter and forecasts for the remainder of the fiscal year and future years to determine if it is more likely than not that a valuation allowance for the deferred tax assets is needed.
23
Table of Contents
| Item 1B. | Unresolved Staff Comments |
None.
| Item 2. | Properties |
The following are our principal facilities as of June 27, 2010:
| Location |
Primary Use |
Owned/Leased |
Segments Used by | |||
| San Jose, CA | Headquarters, Manufacturing | Leased | All | |||
| Aguadilla, Puerto Rico | Manufacturing | Leased | All | |||
| Beverly, MA | Manufacturing | Owned (no encumbrances)/ Leased | All | |||
| Santa Rosa, CA | Manufacturing | Leased | Government Business Unit | |||
| Boulder, CO | Manufacturing | Leased | Government Business Unit | |||
| Beijing, China | Research and Development, Sales | Leased | Communications Business Unit | |||
We also lease other facilities in the United States, Europe, and Asia to support research and development, sales and customer service. We believe that our current facilities are suitable and adequate to meet our anticipated needs for the foreseeable future, and we periodically evaluate whether additional facilities are necessary.
| Item 3. | Legal Proceedings |
We formerly leased a tract of land for our operations in Texas. Those operations involved the use of solvents and, at the end of the lease, we remediated an area where the solvents had been deposited on the ground and obtained regulatory approval for that remedial activity. In 1996, an environmental investigation of the property detected those same contaminants in groundwater in excess of then current regulatory standards. The groundwater contamination has migrated to some adjacent properties. We have entered into the Texas Natural Resource Conservation Commission’s Voluntary Cleanup Program (the “Voluntary Cleanup Program”) to obtain regulatory approval for closure of this site and a release from liability to the State of Texas for subsequent landowners and lenders. We have notified adjacent property owners affected by the contamination of our participation in the Voluntary Cleanup Program. On May 20, 2004, we received a demand from the owner of several adjacent lots for damages in the amount of $1.3 million, as well as seeking an indemnity for the contamination and a promise to remediate the contamination. On March 14, 2006, the adjacent property owner filed suit in Probate Court No. 1, Travis County, Texas (Anna B. Miller, Individually and as Executrix of the Estate of Robert L. Miller, et al. vs. Austron, Inc., et al.), seeking damages. We have not yet been served in this matter. We are continuing to work on the remediation of the formerly leased site as well as the adjacent properties and intend to defend this lawsuit vigorously. As of June 27, 2010, we had an accrual of $85,000 for remediation costs and other ongoing monitoring costs.
We are also a party to certain other claims in the normal course of our operations. While the results of these claims cannot be predicted with any certainty, we believe that the final outcome of these matters will not have a material adverse effect on our financial position and results of operations.
| Item 4. | Removed and Reserved |
24
Table of Contents
PART II
| Item 5. | Market for the Registrant’s Common Equity, Related Stockholder Matters and Issuer Purchases of Equity Securities |
Our common stock is traded on The NASDAQ Stock Market LLC, under the symbol “SYMM”. We had approximately 945 stockholders of record as of August 31, 2010.
The following table sets forth the high and low per share sale prices reported on The NASDAQ Stock Market LLC for our common stock for the periods indicated.
| High | Low | |||||
| Year ended June 28, 2009 |
||||||
| First Quarter |
$ | 5.18 | $ | 3.84 | ||
| Second Quarter |
4.97 | 3.00 | ||||
| Third Quarter |
4.29 | 2.58 | ||||
| Fourth Quarter |
5.99 | 3.45 | ||||
| Year ended June 27, 2010 |
||||||
| First Quarter |
$ | 6.54 | $ | 4.91 | ||
| Second Quarter |
5.46 | 4.39 | ||||
| Third Quarter |
6.49 | 4.86 | ||||
| Fourth Quarter |
7.12 | 5.01 | ||||
Symmetricom has never declared nor paid cash dividends on its capital stock and does not anticipate paying any cash dividends in the foreseeable future.
The information required by this item regarding equity compensation plans is incorporated by reference to the information in Item 12 of this Form 10-K.
Stock Repurchase Program
As of June 27, 2010, the total number of shares available for repurchase under the repurchase program authorized by the Board of Directors was approximately 1.3 million.
During fiscal 2010, we repurchased 0.3 million shares of common stock pursuant to our repurchase program for an aggregate price of approximately $1.3 million.
A further 0.1 million shares were repurchased by us in fiscal 2010 for an aggregate price of approximately $0.5 million to cover the cost of taxes on vested restricted stock.
The following table provides monthly detail regarding our share repurchases during the three months ended June 27, 2010:
| Period |
Total Number of Shares Purchased |
Average Price Paid per Share |
Total Number of Shares Purchased as Part of Publicly Announced Plans or Programs |
Approximate Number of Shares That May Yet Be Purchased Under the Plans or Programs | |||||
| March 29, 2010 through April 25, 2010 |
— | $ | — | — | 1,495,338 | ||||
| April 26, 2010 through May 23, 2010 |
1,100 | $ | 5.01 | — | 1,495,338 | ||||
| May 24, 2010 through June 27, 2010 |
171,178 | $ | 5.32 | 171,178 | 1,324,160 | ||||
| Total |
172,278 | $ | 5.32 | 171,178 | |||||
25
Table of Contents
Comparative Stock Performance
The graph below compares the cumulative total stockholders’ return on our common stock for the last five fiscal years with the total return on the S&P 500 Index and the S&P Information Technology Index over the same period (assuming the investment of $100 in our common stock, the S&P 500 Index and the S&P Information Technology Index, and reinvestment of all dividends).
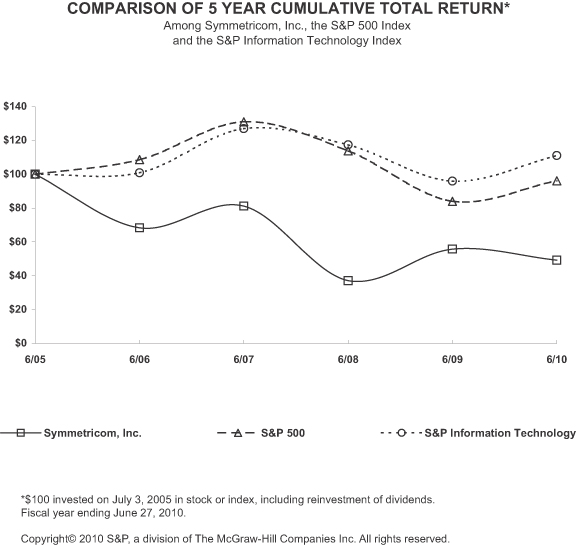
26
Table of Contents
| Item 6. | Selected Financial Data |
The following selected consolidated financial data for the fiscal years ended June 27, 2010, June 28, 2009, June 29, 2008, July 1, 2007, and July 2, 2006 should be read in conjunction with our consolidated financial statements, the related notes and “Management’s Discussion and Analysis of Financial Condition and Results of Operations” included elsewhere in this Form 10-K. The historical results are not necessarily indicative of the results to be expected for any future period.
| Year ended | ||||||||||||||||||||
| June 27, 2010 |
June 28, 2009 |
June 29, 2008 |
July 1, 2007 |
July 2, 2006 |
||||||||||||||||
| (In thousands, except per share amounts) | ||||||||||||||||||||
| Consolidated Statement of Operations Data: |
||||||||||||||||||||
| Net revenue |
$ | 221,316 | $ | 219,746 | $ | 206,386 | $ | 207,878 | $ | 176,112 | ||||||||||
| Operating income (loss)(1),(2),(3) |
12,129 | (32,713 | ) | 6,947 | 14,704 | (4,166 | ) | |||||||||||||
| Income (loss) from continuing operations before income taxes(4) |
2,043 | (43,218 | ) | 1,089 | 14,450 | (5,823 | ) | |||||||||||||
| Income (loss) from continuing operations |
2,546 | (43,806 | ) | (805 | ) | 10,423 | (3,472 | ) | ||||||||||||
| Income (loss) from discontinued operations, net of tax(5),(6),(7) |
(20 | ) | (1,951 | ) | (16,942 | ) | (7,058 | ) | 921 | |||||||||||
| Net income (loss) |
2,526 | (45,757 | ) | (17,747 | ) | 3,365 | (2,551 | ) | ||||||||||||
| Basic income (loss) per share from continuing operations |
0.06 | (1.01 | ) | (0.02 | ) | 0.22 | (0.08 | ) | ||||||||||||
| Basic income (loss) per share from discontinued operations |
— | (0.04 | ) | (0.38 | ) | (0.15 | ) | 0.02 | ||||||||||||
| Basic net income (loss) per share |
0.06 | (1.05 | ) | (0.40 | ) | 0.07 | (0.06 | ) | ||||||||||||
| Diluted income (loss) per share from continuing operations |
0.06 | (1.01 | ) | (0.02 | ) | 0.22 | (0.07 | ) | ||||||||||||
| Diluted income (loss) per share from discontinued operations |
— | (0.04 | ) | (0.38 | ) | (0.15 | ) | 0.02 | ||||||||||||
| Diluted net income (loss) per share |
0.06 | (1.05 | ) | (0.40 | ) | 0.07 | (0.05 | ) | ||||||||||||
| June 27, 2010 |
June 28, 2009 |
June 29, 2008 |
July 1, 2007 |
July 2, 2006 |
||||||||||||||||
| (In thousands) | ||||||||||||||||||||
| Consolidated Balance Sheet Data: |
||||||||||||||||||||
| Total assets |
$ | 231,387 | $ | 272,387 | $ | 367,672 | $ | 396,158 | $ | 377,484 | ||||||||||
| Long-term obligations(8),(9) |
8,296 | 51,769 | 46,301 | 92,050 | 88,307 | |||||||||||||||
| Stockholders’ equity |
183,852 | 179,528 | 233,331 | 256,807 | 247,928 | |||||||||||||||
| (1) | During fiscal 2010, we recorded $10.3 million in restructuring charges related to lease loss and facility related charges, one-time termination benefits, and other restructuring related charges. |
| (2) | During fiscal 2009, we recorded an impairment charge of $48.1 million in goodwill, $9.7 million in restructuring charges related to lease loss and facility related charges and one time termination benefits. |
| (3) | During fiscal 2006, we recorded an impairment charge of $7.0 million in goodwill and $1.2 million in intangible assets related to our Communications business unit. |
| (4) | During fiscal 2009 and 2010, we recorded $5.6 million and $7.0 million, respectively, in non-cash charges related to repayment of convertible notes. |
| (5) | Reflects amounts related to gains (losses) on discontinued operations. The Specialty Manufacturing /Other business segment was discontinued in the third quarter of fiscal 2007. Quality of Experience Assurance business segment was discontinued and sold in fiscal 2010. |
| (6) | During fiscal 2008, we recorded an impairment charge of $6.5 million in goodwill and $7.8 million in intangible assets related to our Quality of Experience Assurance business. |
| (7) | During fiscal 2007, we recorded an expense of $3.4 million for the income tax effect of the liquidations of QoSmetrics, S.A. and QoSmetrics, Inc., which were acquired on January 2, 2007. |
| (8) | During fiscal 2010, we repurchased our outstanding $56.9 million principal amount of convertible notes, which had a carrying value of $48.7 million. |
| (9) | During fiscal 2009, we repurchased a principal amount of $63.1 million our outstanding convertible notes which had a carrying value of $48.6 million. |
27
Table of Contents
| Item 7. | Management’s Discussion and Analysis of Financial Condition and Results of Operations |
The following discussion and analysis of our financial condition and results of operations should be read together with the accompanying consolidated financial statements and related notes included elsewhere in this report on Form 10-K.
Overview
Symmetricom, a world leader in precise time solutions, sets the world’s standard for time. We generate, distribute and apply precise time for the communications, aerospace/defense, IT infrastructure and metrology industries. Symmetricom’s customers, from communications service providers and network equipment manufacturers to governments and their suppliers worldwide, are able to build more reliable networks and systems by using our advanced timing technologies, atomic clocks, services and solutions. Our products support today’s precise timing standards, including GPS-based timing, IEEE 1588 (PTP), Network Time Protocol (NTP), Synchronous Ethernet, Building Integrated Timing Supply (BITS) and Data Over Cable Service Interface Specifications (DOCSIS(R)) timing.
Our fiscal year is the 52 or 53 weeks ending on the Sunday closest to June 30. Fiscal years 2008 through 2010 were 52-week fiscal years.
Fiscal Year 2010 Summary and Outlook
During fiscal 2010, Symmetricom made several key organizational changes and started a number of initiatives aimed at driving growth and creating a more efficient business model.
In terms of organizational changes, Greg Ruebusch was appointed Executive Vice President of Global Operations, Juan Dewar was appointed Executive Vice President of Global Sales and Support and Dan Scharre was appointed Executive Vice President and General Manager of our Government business unit. We also created the new role of Executive Vice President of Marketing, appointing Phil Bourekas, to focus on strengthening our corporate branding and market development efforts and on the strategic goal of extending our value proposition into additional markets that depend on time and frequency.
In connection with our initiatives focused on building a more efficient organization, we made the decision to transition our Puerto Rico manufacturing operations to Sanmina-SCI to improve our supply chain and cost model. Once fully implemented, this change will support the cost-effective production of our key timing products and technologies, and free up additional dollars to accelerate current growth initiatives and invest in new ones.
We also improved our strategic positioning and cost structure with the sale of our Quality of Experience (QoE) product line, which enabled an enhanced focus on our core time and frequency business.
Our key initiatives started in fiscal 2010 and aimed at driving growth include:
| • | Growing our international and services revenue. In terms of international growth, we have added sales personnel in India and Japan. In terms of services growth, we are emphasizing our marketing and sales focus on our contract services business to maximize revenues and gross margins. |
| • | We continue to invest in the development and marketing of our new PackeTime product family and in expanding our line of embedded solutions. |
Expansion of Our Outsourcing Arrangement with Sanmina-SCI
On April 6, 2010, we announced a restructuring plan to transfer product fabrication processes and related activities from our Aguadilla, Puerto Rico facility to Sanmina-SCI facilities. As part of the plan, approximately
28
Table of Contents
150 positions will be eliminated or about 20% of our total workforce. We expect to incur restructuring charges of approximately $15.0 million in connection with the plan. Total restructuring charges are expected to include approximately $7.0 million in one-time termination benefits, approximately $5.7 million in facility shutdown charges and approximately $2.3 million in transfer and other restructuring related charges. As part of this restructuring, we incurred $3.4 million restructuring charges as of June 27, 2010. Total cash expenditures associated with the restructuring plan are expected to be approximately $13.5 million. Total non-cash charges associated with the restructuring plan are expected to be approximately $1.5 million, and mainly relate to additional depreciation charges for assets with shorter economic lives. We plan to build approximately $5.0 million in buffer inventory to support the transition. Upon completion, we expect the restructuring and other actions to reduce annual costs by approximately $6.0 million.
Sale of QoE
During the third quarter of fiscal 2010, we completed the sale of our video QoE business to Cheetah Technologies, L.P. (Cheetah). Cheetah acquired the assets related to the QoE product line and hired the remaining QoE employees. The total purchase price was $2.3 million, including $0.4 million held in escrow as of March 28, 2010. The escrowed funds are subject to forfeiture to satisfy indemnification and other obligations, if any, to Cheetah. The period of escrow for the $0.4 million will expire on July 1, 2011. As a result of this transaction, we recognized a gain on sale of discontinued operations of $0.9 million, net of income taxes, in fiscal 2010. This gain reflects $1.9 million in cash received in the third quarter of fiscal 2010, less transaction costs, the net carrying value of assets and liabilities transferred, and other related costs, resulting in a $1.4 million gain on sales of discontinued operations, before income taxes. During fiscal year 2010, we also recognized a loss of $1.5 million on the operating results of QoE during this period. In addition, QoE will no longer be shown as a reportable segment within continuing operations and all comparative information from prior periods has been updated to reflect this change.
Selected financial information related to discontinued operations follows:
| Year Ended | ||||||||||||
| June 27, 2010 |
June 28, 2009 |
June 29, 2008 |
||||||||||
| (In thousands) | ||||||||||||
| Revenue |
$ | 691 | $ | 1,085 | $ | 1,655 | ||||||
| Loss on discontinued operations |
$ | (1,454 | ) | $ | (3,184 | ) | $ | (26,367 | ) | |||
| Gain on sale of discontinued operations |
1,423 | — | — | |||||||||
| Loss before income taxes |
(31 | ) | (3,184 | ) | (26,367 | ) | ||||||
| Income tax benefit |
(11 | ) | (1,233 | ) | (9,425 | ) | ||||||
| Loss on discontinued operations, net of tax |
$ | (20 | ) | $ | (1,951 | ) | $ | (16,942 | ) | |||
Segment Reporting Change
In the third quarter of fiscal 2010, we changed our segment reporting structure from four operating and reporting segments to two operating and reporting segments. This change was affected to better reflect how the Chief Operating Decision Maker (CODM) makes decisions about resource allocation and segment performance. The CODM, as defined by authoritative accounting guidance on Segment Reporting, is our President and Chief Executive Officer (CEO). Our CEO allocates resources to and assesses the performance of each operating segment using information about its revenue and operating income (loss) before interest and taxes. Operating income (loss) before income interest and taxes by operating segment excludes certain corporate related costs including selling, general and administrative costs not directly identifiable to the two operating costs as well as our restructuring costs. Symmetricom is now organized into two operating segments corresponding to our two divisions: Communications and Government. For each of these segments, we have separate financial
29
Table of Contents
information, including operating income (loss) amounts, which are evaluated regularly by our CEO. The comparative information from prior periods related to segments in the following section, Results of Operations, has been updated to reflect this change.
Convertible Notes
During the fourth quarter of fiscal 2010, we agreed to purchase approximately $56.9 million aggregate principal amount of our contingent convertible subordinated notes (Notes) in privately negotiated transactions, for a purchase price of $57.7 million, representing the par value principal amount of the Notes plus accrued and unpaid interest. This repurchase represented the repayment of all outstanding convertible notes prior to June 27, 2010. The purchased Notes will be retired and cancelled by the Company.
As a result of the full redemption of the Notes in the fourth quarter of fiscal 2010, we recognized a pre-tax loss of $7.0 million, which represents the difference between the carrying value of the liability component of the redeemed amount and its fair value at the date of redemption in the fourth quarter of fiscal 2010.
Effective June 29, 2009, we adopted new authoritative guidance on accounting for our Notes. This guidance applies to certain convertible debt instruments that may be settled in cash or other assets, or partially in cash, upon conversion and is required to be applied retrospectively. The adoption impacted the accounting for the Notes by requiring the initial proceeds to be allocated between a liability and an equity component based on the fair value of the liability component as of the issuance date.
We determined that the initial liability component of the Notes was valued at $77.0 million, with the equity component representing the residual amount of the Notes proceeds. As a result, for fiscal 2005, we retrospectively recorded $43.0 million as a component of equity and a corresponding debt discount as of the date of issuance, and a deferred tax liability of $15.9 million.
In addition, we allocated $0.9 million, net of tax, of the total issuance costs of $4.0 million to the equity component of the Notes and the remaining $2.6 million of the issuance costs remained classified as long-term other assets. The issuance costs were allocated pro rata based on the relative carrying amounts of the liability and equity components. The debt discount and the issuance costs allocated to the liability component are amortized using the effective interest method as additional interest expense over a seven-year period ending June 2012 at which point the Notes may be redeemed by the holders or by us. The equity component of the issuance costs of $1.4 million is included in common stock as additional paid-in-capital.
As a result of the partial redemption of the Notes in the first quarter of fiscal 2009, we recognized a pre-tax loss on partial redemption of $5.6 million, which represents the difference between the carrying value of the liability component of the redeemed amount and its fair value at the date of redemption in the first quarter of fiscal 2009.
Upon adoption, interest expense increased on our Notes by adding a non-cash component to amortize a debt discount calculated based on the difference between the cash coupon rate (3.25% per year) of the Notes and the effective interest rate on the debt borrowing (10.69% per year). For the year ended June 27, 2010, the total interest expense relating to our Notes was $4.7 million, including $1.9 million related to the contractual interest coupon and $2.8 million related to amortization of the discount on the liability component. For the year ended June 28, 2009, the total interest expense relating to our Notes was $5.3 million, including $2.2 million related to the contractual interest coupon and $3.1 million related to amortization of the discount on the liability component.
Known Trends and Uncertainties Impacting Future Results of Operations: Global Market and Economic Conditions
In the second half of calendar year 2008, the financial markets in the U.S. and abroad experienced a severe downturn arising from a multitude of factors, including concerns about the systemic impact of large financial
30
Table of Contents
institutions experiencing acute credit crises, geopolitical issues, broad adverse credit conditions, higher energy costs, lower corporate profits and capital spending, and declining real estate and mortgage markets, combined with volatile oil prices, decreased business and consumer confidence and increased unemployment. While some of these conditions have abated in recent months, general concerns about the stability of the markets and the strength of counterparties specifically has led many lenders and institutional investors to reduce, and in some cases cease, to provide funding to borrowers.
While there has been some improvement in general macro-economic conditions since late calendar year 2009 and 2010, the current macro-economic factors remain dynamic and uncertain and are likely to remain so into calendar 2011. If difficult economic conditions or the constrained credit environment markedly continue, our customers may delay or reduce capital expenditures. This could result in reductions in sales of our products, longer sales cycles, difficulties in collecting accounts receivable, additional excess and obsolete inventory, potential impairment charges related to our intangible assets, gross margin deterioration, slower adoption of new technologies, increased price competition and supplier difficulties.
Critical Accounting Estimates
Our consolidated financial statements have been prepared in accordance with accounting principles generally accepted in the United States, which require us to make estimates and judgments that affect the reported amounts of assets, liabilities, revenue and expenses, and related disclosures at the date of our financial statements. On an ongoing basis, management evaluates its estimates and judgments. Management bases its estimates and judgments on historical experience and on various other factors that are believed to be reasonable under the circumstances, the results of which form the basis for making judgments about the carrying values of assets and liabilities that are not readily apparent from other sources. Actual results may differ from these estimates under different assumptions or conditions. We consider the following accounting policies to be critical accounting policies due to their subjective nature and judgments involved in each:
Revenue Recognition
We recognize revenue when persuasive evidence of an arrangement exists, delivery has occurred or services have been rendered, our price is fixed or determinable and collectability is reasonably assured. Our standard arrangement for our domestic and international customers includes a signed purchase order or contract and no right of return of delivered products. Revenue is recognized net of any taxes collected from customers and subsequently remitted to governmental authorities.
We assess collectability based on the creditworthiness of the customer and past transaction history. We perform periodic credit evaluations of our customers and do not require collateral from our customers. However, for many of our international customers, we require an irrevocable letter of credit to be issued by the customer before the purchase order is accepted. If we determine that collection of the invoice is not reasonably assured, we recognize the revenue at the time that collection becomes reasonably assured, which is generally upon the receipt of cash.
Generally, product revenue is generated from the sale of synchronization and timing equipment with embedded software that is incidental to product functionality. For instances where embedded software is more than incidental to product functionality, we account for the transactions in accordance with the rules applicable to software revenue recognition. Service revenue is recognized as the services are performed, provided collection of the related receivable is reasonably assured. Our sales to distributors are made under agreements allowing for returns or credits under certain circumstances. Accordingly, we defer an estimate of returns from distributors based on a historical average of distributor returns. We record commission expense both when orders are received and shipped, at which times the commission is both earned and payable.
Revenue from contracts that require development and manufacture in accordance with customer specifications and have a lengthy development period may be categorized into two types: firm fixed price and cost-plus reimbursement. Revenue is recognized under the fixed price contracts using the percentage of
31
Table of Contents
completion method (cost-to-cost basis), principally based upon the costs incurred relative to the total estimated costs at completion on the individual contracts. Any anticipated losses on contracts are charged to operations as soon as they are determinable. Revenue recognized under cost-plus contracts is recognized on the basis of direct and indirect costs incurred plus a negotiated profit calculated as a percentage of costs or as a performance based award fee. Revenue from long-term contracts is reviewed periodically, with adjustments recorded in the period in which the revisions are made.
Inventory Valuation
Inventories are valued at the lower of cost or market, cost being determined on a first-in, first-out basis. We assess the valuation of all inventories, including raw materials, work-in-process, finished goods and spare parts on a periodic basis. Obsolete inventory or inventory in excess of management’s estimated usage is written down to its estimated market value less costs to sell, if less than its cost. Inherent in the estimates of market value are management’s estimates related to current economic trends, future demand and technological obsolescence. If actual market conditions are less favorable than those projected by management, additional inventory write-downs may be required. If the inventory value is written down to its net realizable value, and subsequently there is an increased demand for the inventory at a higher value, the increased value of the inventory is not realized until the inventory is sold.
Warranty
Our standard warranty agreement is one year from shipment. However, our warranty agreements are contract and component specific and can range to twenty years for selected components. We offer extended warranty contracts on products that are less than eight years old. The extended warranty contract is applicable for a maximum of nine years after the expiration of the standard one-year warranty. The revenue from extended warranty contracts is recognized ratably over the period of contract.
We accrue for anticipated warranty costs upon shipment. Our warranty reserve is based on the number of installed units, historical analysis of the volume of product returned to us under the warranty program, management’s judgment regarding anticipated rates of warranty claims and associated repair costs. We use the historical data to forecast our anticipated future warranty obligations. This analysis is updated on a quarterly basis.
Accounting for Income Taxes
We provide for income taxes using the asset and liability method. Deferred tax assets and liabilities are recognized for the future tax consequences attributable to differences between the financial statement carrying amounts of existing assets and liabilities and their respective tax basis. Deferred tax assets and liabilities are measured using enacted tax rates expected to apply to taxable income in the years in which those temporary differences are expected to be realized. The effect on deferred tax assets and liabilities from a change in tax rates is recognized in the consolidated financial statements in the period that includes the enactment date.
The carrying value of our net deferred tax assets, which are made up of tax deductions, net operating loss carryforwards and tax credits, assumes that we will be able to generate sufficient future income to fully realize these assets. We evaluate the weight of all available evidence in determining whether it is more likely than not that some portion of the deferred tax assets will not be realized. If we do not generate sufficient future income, the realization of these deferred tax assets may be impaired, resulting in an additional income tax expense. A portion of our tax credits are related to stock options and have a valuation allowance because of uncertainty regarding their realization. If these tax credits are realized, the benefit will be credited to common stock.
In fiscal 2008, we adopted Financial Accounting Standards Board (“FASB”) authoritative guidance on accounting for uncertainty in income taxes, which provides a financial statement recognition threshold and
32
Table of Contents
measurement attribute for a tax position taken or expected to be taken in a tax return. Under this guidance, we may recognize the tax benefit from an uncertain tax position only if it is more likely than not that the tax position will be sustained on examination by the taxing authorities, based on the technical merits of the position. The tax benefits recognized in the financial statements from such a position are measured based on the largest benefit that has a greater than 50% likelihood of being realized upon ultimate settlement.
Short-term Investments
Short-term investments consist of government securities, mutual funds and corporate debt securities that mature between three and 36 months. All of our short-term investments, except the deferred compensation plan assets, are classified as available-for-sale. During fiscal 2009, we reclassified the deferred compensation plan assets from available-for-sale to trading securities in order to maintain consistency with the method in which we account for the deferred compensation obligation. Available-for-sale securities are carried at fair value with temporary unrealized gains and losses, net of taxes, reported as a component of stockholders’ equity. Unrealized gains and losses related to trading securities are included in interest income in our consolidated statements of operations.
Short-term investments are considered to be impaired when a decline in fair value is judged to be other-than-temporary. We consult with our investment manager and consider available quantitative and qualitative evidence in evaluating potential impairment of our investments on a quarterly basis. If the cost of an investment exceeds its fair value, we evaluate, among other factors, general market conditions, the duration and extent to which the fair value is less than cost, and our intent and ability to hold the investment. Once a decline in fair value is determined to be other-than-temporary, an impairment charge is recorded to operations and a new cost basis in the investment is established.
During fiscal years 2009 and 2008, we recorded losses related to short-term investments of $1.4 million and $3.7 million, respectively. There were no losses related to short-term investments recorded in fiscal 2010.
Business Combinations
We allocate the purchase price of acquired companies to the tangible and intangible assets acquired, liabilities assumed, as well as in-process research and development based on their estimated fair values. We engage an independent third-party appraisal firm to assist us in determining the fair values of the assets acquired and the liabilities assumed. Such valuations require management to make significant estimations and assumptions, especially with respect to intangible assets.
Critical estimates in valuing certain intangible assets include but are not limited to: future expected cash flows from customer contracts, customer lists, distribution agreements, acquired developed technologies and patents; expected costs to develop the in-process research and development into commercially viable products and estimating cash flows from the projects when completed; and the brand awareness and the market position of the acquired products and assumptions about the period of time the brand will continue to be used in the combined company’s product portfolio. Management’s estimates of fair value are based upon assumptions believed to be reasonable, but which are inherently uncertain and unpredictable.
Valuation of Goodwill
During the third quarter of fiscal 2009, due to a decline in our stock price and a lowered business outlook, we determined that indicators of a potential goodwill impairment existed. Accordingly, we completed a step one goodwill impairment test to determine whether the decline in market capitalization and business outlook revisions indicated that the carrying value of our reporting units were in excess of fair value.
A step one goodwill impairment test compares the fair value of a reporting unit to its carrying value to determine if a step two test is required. We estimate our reporting unit’s fair values using a weighted average of
33
Table of Contents
values determined under an income approach and a market approach. We weighed these approaches at approximately 67% and 33% for the income approach and the market approach, respectively. We applied a lower weighting to the market approach as there are a limited number of highly comparable companies, which are a key component of the market approach. Under the income approach, fair value is determined by discounting estimated future cash flows. The income approach is dependent on several significant assumptions, including our earnings projections and our cost of capital. Under the market approach, we estimate the fair value of each reporting unit based on pricing multiples of certain financial parameters observed in comparable companies.
Based on the results of our step one test, we determined that the fair values of the Communications and Government reporting units were less than their respective carrying amounts, and therefore the second step of the goodwill impairment test was performed to measure the amount of impairment loss for the each reporting unit. As a result, we recorded a goodwill impairment charge of approximately $48.1 million in the third quarter of fiscal 2009, consisting of $28.0 million related to the Communications reporting segment and $20.1 million related to the Government reporting segment.
Valuation of Long-Lived Assets Including Intangible Assets Subject to Amortization
Long-lived assets are reviewed for impairment whenever events or changes in circumstances indicate that the carrying amount of such assets may not be recoverable. Intangible assets primarily include purchased technology and trademarks. Factors we consider important that could trigger an impairment review include significant under-performance relative to historical or projected future operating results, significant changes in the manner of our use of the acquired assets or the strategy for our overall business, or significant negative industry or economic trends. If these criteria indicate that the value of the intangible asset may be impaired, an evaluation of the recoverability of the net carrying value of the asset over its remaining useful life is made. If this evaluation indicates that the intangible asset is not recoverable, the net carrying value of the related intangible asset will be reduced to fair value. Any such impairment charge could be significant and could have a material adverse effect on our financial statements if and when an impairment charge is recorded. If an impairment charge were recognized, the amortization related to intangible assets would decrease during the remainder of the life of the asset.
In the third quarter of fiscal 2009, because of the identification of goodwill impairment indicators (See above—Valuation of Goodwill), we first reviewed our other intangible and long-lived assets for impairment and determined there was no impairment.
34
Table of Contents
Results of Operations
The following table presents the percentage of total revenue for the respective line items in our consolidated statement of operations:
| Year ended | |||||||||
| June 27, 2010 | June 28, 2009 | June 29, 2008 | |||||||
| Net revenue |
|||||||||
| Communications |
61.4 | % | 61.7 | % | 62.6 | % | |||
| Government |
38.6 | % | 38.3 | % | 37.4 | % | |||
| Total net revenue |
100.0 | % | 100.0 | % | 100.0 | % | |||
| Cost of products and services |
52.8 | % | 50.6 | % | 54.9 | % | |||
| Amortization of purchased technology |
0.6 | % | 0.7 | % | 0.9 | % | |||
| Restructuring charges |
2.5 | % | 1.8 | % | 0.3 | % | |||
| Gross profit |
44.1 | % | 47.0 | % | 43.9 | % | |||
| Operating expenses: |
|||||||||
| Research and development |
10.7 | % | 10.7 | % | 11.0 | % | |||
| Selling, general and administrative |
25.6 | % | 26.4 | % | 28.9 | % | |||
| Amortization of intangible assets |
0.1 | % | 0.2 | % | 0.2 | % | |||
| Restructuring charges |
2.1 | % | 2.7 | % | 0.4 | % | |||
| Impairment of goodwill |
— | % | 21.9 | % | — | % | |||
| Operating income (loss) |
5.5 | % | (14.9) | % | 3.4 | % | |||
| Gain on sale of asset |
— | % | — | % | 0.3 | % | |||
| Loss on repayment of convertible notes, net |
(3.2) | % | (2.6) | % | — | % | |||
| Loss on short-term investments, net |
— | % | (0.6) | % | (1.8) | % | |||
| Interest income |
0.7 | % | 0.8 | % | 3.5 | % | |||
| Interest expense |
(2.1) | % | (2.4) | % | (4.8) | % | |||
| Income (loss) from continuing operations before taxes |
0.9 | % | (19.7) | % | 0.5 | % | |||
| Income tax provision (benefit) |
(0.2) | % | 0.3 | % | 0.9 | % | |||
| Income (loss) from continuing operations |
1.2 | % | (19.9) | % | (0.4) | % | |||
| Loss from discontinued operations, net of tax |
— | % | (0.9) | % | (8.2) | % | |||
| Net Income (loss) |
1.1 | % | (20.8) | % | (8.6) | % | |||
Fiscal Years Ended June 27, 2010 and June 28, 2009
| Year ended | $ Change | % Change | ||||||||||||
| June 27, 2010 | June 28, 2009 | |||||||||||||
| Net Revenue (dollars in thousands): |
||||||||||||||
| Communications |
$ | 135,809 | $ | 135,496 | $ | 313 | 0.2 | % | ||||||
| Government |
85,507 | 84,250 | 1,257 | 1.5 | ||||||||||
| Total Net Revenue |
$ | 221,316 | $ | 219,746 | $ | 1,570 | 0.7 | % | ||||||
| Percentage of Revenue |
100.0 | % | 100.0 | % | ||||||||||
Net revenue consists of sales of products, services and software licenses. Net revenue increased by $1.6 million or 0.7% in fiscal 2010 compared to fiscal 2009. Communications revenue was flat in fiscal 2010 compared to fiscal 2009. Revenue declines from our DOCSIS Timing Interface (DTI) products and international sales of our traditional sync products were offset by higher revenues from our new PackeTime products, higher sales of embedded timing systems for WiMax base stations, and higher installations services. Government revenue increased by $1.3 million, or 1.5%, compared to the same period for the prior year, due to higher sales of atomic clocks and hydrogen masers offset by lower sales of government communication and signal intelligence systems.
35
Table of Contents
| Year ended | $ Change | % Change | |||||||||||||
| June 27, 2010 | June 28, 2009 | ||||||||||||||
| Gross Profit (dollars in thousands): |
|||||||||||||||
| Communications |
$ | 67,192 | $ | 69,627 | $ | (2,435 | ) | (3.5 | )% | ||||||
| Government |
35,953 | 37,461 | (1,508 | ) | (4.0 | ) | |||||||||
| Corporate related |
(5,625 | ) | (3,866 | ) | (1,759 | ) | 45.5 | ||||||||
| Total Gross Profit |
$ | 97,520 | $ | 103,222 | $ | (5,702 | ) | (5.5 | )% | ||||||
| Percentage of Revenue |
44.1 | % | 47.0 | % | |||||||||||
Gross profit decreased $5.7 million or 5.5% during fiscal 2010 compared to the prior year. Gross profit as a percentage of revenue declined by 2.9%. Gross profit for Communications decreased by $2.4 million, or 3.5%, despite a revenue increase of 0.2%, primarily due to a change in product mix towards lower margin products, including installation services. Gross profit for Government decreased by $1.5 million, or 4.0%, despite a revenue increase of 1.5%, primarily due to product mix toward lower margin products within our government communication and signal intelligence products.
Corporate related restructuring charges increased $1.8 million, or 45.5%, due to severance and other charges related to the planned closure of our Puerto Rico manufacturing facility, announced in the fourth quarter of fiscal 2010.
| Year ended | $ Change | % Change | |||||||||||||
| June 27, 2010 | June 28, 2009 | ||||||||||||||
| Operating Income (Loss) (dollars in thousands): |
|||||||||||||||
| Communications |
$ | 30,055 | $ | 3,079 | $ | 26,976 | 876.1 | % | |||||||
| Government |
14,587 | (3,550 | ) | 18,137 | (510.9 | ) | |||||||||
| Corporate related |
(32,513 | ) | (32,242 | ) | (271 | ) | 0.8 | ||||||||
| Total operating income (loss) |
$ | 12,129 | $ | (32,713 | ) | $ | 44,842 | (137.1 | )% | ||||||
| Percentage of Revenue |
5.5 | % | (14.9 | )% | |||||||||||
Operating income: Operating income for Communications increased by $27.0 million or 876.1% due to a $28.0 million goodwill impairment charge taken in the third quarter of fiscal 2009. Operating income for Government increased $18.1 million or 510.9% due to a $20.1 million goodwill impairment charge taken in the third quarter of fiscal 2009. Corporate related operating expenses in fiscal 2010 were flat when compared to fiscal 2009.
| Year ended | $ Change | % Change | ||||||||||||
| June 27, 2010 | June 28, 2009 | |||||||||||||
| Research and development expense (dollars in thousands) |
$ | 23,701 | $ | 23,421 | $ | 280 | 1.2 | % | ||||||
| Percentage of Revenue |
10.7 | % | 10.7 | % | ||||||||||
Research and development expenses consist primarily of salaries and benefits, prototype expenses and fees paid to outside consultants and facility costs. Research and development expense in fiscal 2010 increased $0.3 million, or 1.2%, compared to the same period of fiscal 2009 due to higher incentive compensation, stock based compensation, and fringe benefit costs.
| Year ended | $ Change | % Change | |||||||||||||
| June 27, 2010 | June 28, 2009 | ||||||||||||||
| Selling, general and administrative (dollars in thousands) |
$ | 56,743 | $ | 58,119 | $ | (1,376 | ) | (2.4 | )% | ||||||
| Percentage of Revenue |
25.6 | % | 26.4 | % | |||||||||||
Selling, general and administrative expense consists primarily of salaries, benefits, sales commissions and travel-related expenses for our sales and services, marketing, finance, human resources, information technology
36
Table of Contents
and facilities departments. Selling, general and administrative expenses decreased by 2.4% to $56.7 million compared to $58.1 million for fiscal 2009. The decrease in expenses consisted primarily of lower salary expenses as a result of headcount reductions and lower outside services and consulting expenses.
| Year ended | $ Change | % Change | |||||||||||||
| June 27, 2010 | June 28, 2009 | ||||||||||||||
| Amortization of intangible assets (dollars in thousands) |
$ | 281 | $ | 411 | $ | (130 | ) | (31.6 | )% | ||||||
| Percentage of Revenue |
0.1 | % | 0.2 | % | |||||||||||
Amortization of intangible assets decreased in fiscal 2010 compared to fiscal 2009 due to certain assets becoming fully amortized during fiscal 2010.
| Year ended | $ Change | % Change | |||||||||||||
| June 27, 2010 | June 28, 2009 | ||||||||||||||
| Restructuring charges (dollars in thousands) |
$ | 4,666 | $ | 5,840 | $ | (1,174 | ) | (20.1 | )% | ||||||
| Percentage of Revenue |
2.1 | % | 2.7 | % | |||||||||||
Restructuring charges decreased in fiscal 2010 compared to fiscal 2009 due to lower severance costs recognized in fiscal 2010 that were related to the restructuring activities announced in the second half of fiscal 2009.
| Year ended | $ Change | % Change | |||||||||||||
| June 27, 2010 | June 28, 2009 | ||||||||||||||
| Impairment of goodwill (dollars in thousands) |
$ | — | $ | 48,144 | $ | (48,144 | ) | (100.0 | )% | ||||||
| Percentage of Revenue |
— | % | 21.9 | % | |||||||||||
Impairment of goodwill: In the third quarter of fiscal 2009, we recognized goodwill impairment charges of $28.0 million and $20.1 million related to our Communications and Government reporting segments, respectively.
| Year ended | $ Change | % Change | |||||||||||||
| June 27, 2010 | June 28, 2009 | ||||||||||||||
| Loss on repayment of convertible notes, net (dollars in thousands) |
$ | (7,026 | ) | $ | (5,623 | ) | $ | (1,403 | ) | 25.0 | % | ||||
| Percentage of Revenue |
(3.2 | )% | (2.6 | )% | |||||||||||
Loss on repayment of convertible notes: In the first quarter of fiscal 2009, we repaid $62.5 million principal amount of our convertible notes and incurred a loss of $5.6 million mostly related to the difference in the carrying value of the liability component of the redeemed amount compared to its fair value at redemption in the first quarter of fiscal 2009. Similarly, in the fourth quarter of fiscal 2010 we repaid the remaining principal amount of $56.9 million of our convertible notes and incurred a loss of $7.0 million.
| Year ended | $ Change | % Change | ||||||||||||
| June 27, 2010 | June 28, 2009 | |||||||||||||
| Loss on short-term investments, net (dollars in thousands) |
$ | — | $ | (1,368 | ) | $ | 1,368 | (100.0 | )% | |||||
| Percentage of Revenue |
— | % | (0.6 | )% | ||||||||||
Loss on short-term investments: The net loss on short-term investments recognized in fiscal 2009 is attributable to an “other than temporary” loss of $1.5 million related to corporate debt securities and mutual funds related to our deferred compensation plan, partially offset by a gain of $0.1 million related to a recovery on an investment for which we previously recognized an “other than temporary” loss in fiscal 2008.
37
Table of Contents
| Year ended | $ Change | % Change | |||||||||||||
| June 27, 2010 | June 28, 2009 | ||||||||||||||
| Interest income (dollars in thousands) |
$ | 1,594 | $ | 1,807 | $ | (213 | ) | (11.8 | )% | ||||||
| Percentage of Revenue |
0.7 | % | 0.8 | % | |||||||||||
Interest income decreased by $0.2 million in fiscal 2010 compared to the same period in the prior year due to lower interest rates.
| Year ended | $ Change | % Change | ||||||||||||
| June 27, 2010 | June 28, 2009 | |||||||||||||
| Interest expense (dollars in thousands) |
$ | (4,654 | ) | $ | (5,321 | ) | $ | 667 | (12.5 | )% | ||||
| Percentage of Revenue |
(2.1 | )% | (2.4 | )% | ||||||||||
Interest expense consists primarily of interest on our Notes. Interest expense decreased $0.7 million in fiscal 2010 compared to the same period in the prior year due to the repayment of $62.5 million in convertible notes in the first quarter of fiscal 2009. Late in the fourth quarter of fiscal 2010, we repaid the remaining principal amount of $56.9 million of our convertible notes. Further, in the first quarter of fiscal 2010, we adopted FASB authoritative guidance on accounting for our contingent convertible subordinated notes. As a result of this adoption, interest expense includes non-cash interest costs of $2.8 million in fiscal 2010 and $3.1 million in fiscal 2009.
| Year ended | $ Change | % Change | |||||||||||||
| June 27, 2010 | June 28, 2009 | ||||||||||||||
| Income tax provision (benefit) (dollars in thousands) |
$ | (503 | ) | $ | 588 | $ | (1,091 | ) | (185.5 | )% | |||||
| Percentage of Revenue |
(0.2 | )% | 0.3 | % | |||||||||||
Income tax provision (benefit): Our income tax benefit was $0.5 million in fiscal 2010, compared to a $0.6 million provision in fiscal 2009. Our effective tax rate in the fiscal 2010 was (24.6)% on earnings before income taxes of $2.0 million, compared to an effective tax rate of 1.4% on losses before income taxes of $43.2 million in the corresponding period of fiscal 2009. The tax rate in fiscal 2009 was impacted by the impairment of goodwill, which provided little tax benefit. The tax rate and provision are not readily comparable because the prior year goodwill impairment generated a large non-deductible loss before income taxes, while in fiscal 2010, we reported $2.0 million as earnings before income taxes. Fiscal 2010 income taxes benefited favorably from various tax credits.
| Year ended | $ Change | % Change | ||||||||||||
| June 27, 2010 | June 28, 2009 | |||||||||||||
| Loss from discontinued operations, net of tax (in thousands) |
$ | (20 | ) | $ | (1,951 | ) | $ | 1,931 | (99.0 | )% | ||||
| Percentage of Revenue |
(0.0 | )% | (0.9 | )% | ||||||||||
Discontinued Operations: In the third quarter of fiscal 2010, we completed the sale of our QoE business. The $1.9 million increase in income from discontinued operations in fiscal 2010 compared to fiscal 2009 was mainly attributable to the gain on sale of discontinued operations of $0.9 million, net of income taxes.
Fiscal Years Ended June 28, 2009 and June 29, 2008
| Year ended | $ Change | % Change | ||||||||||||
| June 28, 2009 | June 29, 2008 | |||||||||||||
| Net Revenue (dollars in thousands): |
||||||||||||||
| Communications |
$ | 135,496 | $ | 129,141 | $ | 6,355 | 4.9 | % | ||||||
| Government . |
84,250 | 77,245 | 7,005 | 9.1 | ||||||||||
| Total Net Revenue |
$ | 219,746 | $ | 206,386 | $ | 13,360 | 6.5 | % | ||||||
| Percentage of Revenue |
100.0 | % | 100.0 | % | ||||||||||
38
Table of Contents
Net revenue increased by $13.4 million or 6.5% in fiscal 2009 compared to fiscal 2008. Revenue from Communications increased $6.4 million or 4.9% primarily due to higher sales of cable products and shipments to a new international customer, offset by a decline in legacy technology investments by wireless carriers for OEM products and lower installation revenue from a major customer. Revenue from the Government unit increased $7.0 million or 9.1% primarily due to higher sales to the government communication and electronic system programs.
| Year ended | $ Change | % Change | |||||||||||||
| June 28, 2009 | June 29, 2008 | ||||||||||||||
| Gross Profit (dollars in thousands): |
|||||||||||||||
| Communications |
$ | 69,627 | $ | 56,937 | $ | 12,690 | 22.3 | % | |||||||
| Government . |
37,461 | 34,280 | 3,181 | 9.3 | |||||||||||
| Corporate related |
(3,866 | ) | (634 | ) | (3,232 | ) | 509.8 | ||||||||
| Total Gross Profit |
$ | 103,222 | $ | 90,583 | $ | 12,639 | 14.0 | % | |||||||
| Percentage of Revenue |
47.0 | % | 43.9 | % | |||||||||||
Gross profit increased $12.6 million or 14.0% during fiscal 2009 compared to the prior year. Gross profit as a percentage of revenue increased by 3.1%. Gross profit for Communications increased by $12.7 million, or 22.3%. This increase was higher than the revenue increase of 4.9% and was primarily due to a favorable sales mix of cable products with higher gross margin, and lower costs as a result of the initial phase of outsourcing certain manufacturing capacity to a subcontractor. This was partially offset by lower revenue from OEM products due to a reduction in price to a major customer. Gross profit for Government increased by $3.2 million or 9.3%, in line with the 9.1% increase in revenue.
Corporate related restructuring charges increased $3.2 million or 509.8% due to severance and facility shutdown costs announced in the second half of fiscal 2009.
| Year ended | $ Change | % Change | |||||||||||||
| June 28, 2009 | June 29, 2008 | ||||||||||||||
| Operating Income (Loss) (dollars in thousands): |
|||||||||||||||
| Communications |
$ | 3,079 | $ | 19,654 | $ | (16,575 | ) | (84.3 | )% | ||||||
| Government |
(3,550 | ) | 14,459 | (18,009 | ) | (124.6 | ) | ||||||||
| Corporate related |
(32,242 | ) | (27,166 | ) | (5,076 | ) | 18.7 | ||||||||
| Total operating income (loss) |
$ | (32,713 | ) | $ | 6,947 | $ | (39,660 | ) | (570.9 | )% | |||||
| Percentage of Revenue |
(14.9 | )% | 3.4 | % | |||||||||||
Operating income (loss) related to Communications decreased $16.6 million or 84.3% primarily due to a $28.0 million goodwill impairment charge taken in the third quarter of fiscal 2009. Operating income for Government decreased $18.0 million or 124.6% due to a $20.1 million goodwill impairment charge taken in the third quarter of fiscal 2009. Corporate related operating expenses increased $5.1 million or 18.7% due to higher restructuring charges in fiscal 2009.
| Year ended | $ Change | % Change | ||||||||||||
| June 28, 2009 | June 29, 2008 | |||||||||||||
| Research and development expense (dollars in thousands) |
$ | 23,421 | $ | 22,711 | $ | 710 | 3.1 | % | ||||||
| Percentage of Revenue |
10.7 | % | 11.0 | % | ||||||||||
Research and development expenses increased $0.7 million, or 3.1%, compared to fiscal 2008, due primarily to increased salary and consulting expenses.
39
Table of Contents
| Year ended | $ Change | % Change | |||||||||||||
| June 28, 2009 | June 29, 2008 | ||||||||||||||
| Selling, general and administrative (dollars in thousands) |
$ | 58,119 | $ | 59,709 | $ | (1,590 | ) | (2.7 | )% | ||||||
| Percentage of Revenue |
26.4 | % | 28.9 | % | |||||||||||
Selling, general and administrative expense decreased by 2.7% to $58.1 million compared to $59.7 million for fiscal 2008. The decrease in expenses consisted primarily of a reduction in compensation-related expenses including stock-based compensation and deferred compensation costs, a reduction of $0.4 million for a change in estimate for the allowance for doubtful accounts to correspond to our current bad debt write-off experience, and a $1.3 million reduction in professional fees related to the restatement of our consolidated financial statements for fiscal 2008. This decrease was partially offset by $1.0 million in CEO post-employment compensation and a $2.2 million increase in the bonus accrual.
| Year ended | $ Change | % Change | |||||||||||||
| June 28, 2009 | June 29, 2008 | ||||||||||||||
| Amortization of intangible assets (dollars in thousands) |
$ | 411 | $ | 422 | $ | (11 | ) | (2.6 | )% | ||||||
| Percentage of Revenue |
0.2 | % | 0.2 | % | |||||||||||
Amortization of intangible assets was essentially flat in fiscal 2009 compared to fiscal 2008.
| Year ended | $ Change | % Change | ||||||||||||
| June 28, 2009 | June 29, 2008 | |||||||||||||
| Restructuring charges (dollars in thousands) |
$ | 5,840 | $ | 794 | $ | 5,046 | 635.5 | % | ||||||
| Percentage of Revenue |
2.7 | % | 0.4 | % | ||||||||||
Restructuring charges, including employee severance and lease loss, increased due to the company-wide restructurings announced in January and June 2009.
| Year ended | $ Change | % Change | ||||||||||||
| June 28, 2009 | June 29, 2008 | |||||||||||||
| Impairment of goodwill (dollars in thousands) |
$ | 48,144 | $ | — | $ | 48,144 | 100.0 | % | ||||||
| Percentage of Revenue |
21.9 | % | — | % | ||||||||||
Impairment of goodwill charges of $48.1 million in fiscal 2009 were related to our Communications and Government reporting segments.
| Year ended | $ Change | % Change | |||||||||||||
| June 28, 2009 | June 29, 2008 | ||||||||||||||
| Gain on sale of asset (dollars in thousands) |
$ | — | $ | 700 | $ | (700 | ) | (100.0 | )% | ||||||
| Percentage of Revenue |
— | % | 0.3 | % | |||||||||||
Gain on sale of asset: In the second quarter of fiscal 2008 we sold a domain name, which was not previously used, for a gain of $0.7 million.
| Year ended | $ Change | % Change | |||||||||||||
| June 28, 2009 | June 29, 2008 | ||||||||||||||
| Loss on repayment of convertible notes, net (dollars in thousands) |
$ | (5,623 | ) | $ | — | $ | (5,623 | ) | 100.0 | % | |||||
| Percentage of Revenue |
(2.6 | )% | — | % | |||||||||||
40
Table of Contents
Loss on repayment of convertible note: In the first quarter of fiscal 2009 we repaid $62.5 million principal amount of our convertible notes and incurred a loss of $5.6 million mostly related to the difference in the carrying value of the liability component of the redeemed amount compared to its fair value at redemption in the first quarter of fiscal 2009.
| Year ended | $ Change | % Change | ||||||||||||
| June 28, 2009 | June 29, 2008 | |||||||||||||
| Loss on short-term investments, net (dollars in thousands) |
$ | (1,368 | ) | $ | (3,728 | ) | $ | 2,360 | (63.3 | )% | ||||
| Percentage of Revenue |
(0.6 | )% | (1.8 | )% | ||||||||||
Loss on short-term investments: The net loss on short-term investments recognized in fiscal 2009 is attributable to an other-than-temporary loss of $1.5 million related to corporate debt securities and mutual funds related to our deferred compensation plan, partially offset by a gain of $0.1 million related to a recovery on an investment for which we previously recognized an other-than-temporary loss in fiscal 2008. The net loss on short-term investments recognized in fiscal 2008 is attributable to an other-than-temporary loss of $3.2 million and a realized loss of $0.5 million related to the sale of a short-term investment.
| Year ended | $ Change | % Change | |||||||||||||
| June 28, 2009 | June 29, 2008 | ||||||||||||||
| Interest income (dollars in thousands) |
$ | 1,807 | $ | 7,123 | $ | (5,316 | ) | (74.6 | )% | ||||||
| Percentage of Revenue |
0.8 | % | 3.5 | % | |||||||||||
Interest income decreased $5.3 million in fiscal 2009 compared to the prior year due to lower interest rates and lower cash and short-term investment balances.
| Year ended | $ Change | % Change | ||||||||||||
| June 28, 2009 | June 29, 2008 | |||||||||||||
| Interest expense (dollars in thousands) |
$ | (5,321 | ) | $ | (9,953 | ) | $ | 4,632 | (46.5 | )% | ||||
| Percentage of Revenue |
(2.4 | )% | (4.8 | )% | ||||||||||
Interest expense consists primarily of interest on our Notes. Interest expense decreased in fiscal 2009 compared to fiscal 2008 due to the repurchase of $63.1 million aggregate principal amount of our Convertible Notes in the first quarter of fiscal 2009.
| Year ended | $ Change | % Change | |||||||||||||
| June 28, 2009 | June 29, 2008 | ||||||||||||||
| Income tax provision (dollars in thousands) |
$ | 588 | $ | 1,894 | $ | (1,306 | ) | (69.0 | )% | ||||||
| Percentage of Revenue |
0.3 | % | 0.9 | % | |||||||||||
Income tax provision: Our income tax provision was $0.6 million in fiscal 2009, compared to a $1.9 million provision in fiscal 2008. Our effective tax rate in fiscal 2009 was 1.4%, compared to an effective tax rate of 173.9% in the prior year. The lower effective tax rate and tax provision in fiscal 2009 was primarily attributable to the non-tax deductible nature of the goodwill impairment.
| Year ended | $ Change | % Change | ||||||||||||
| June 28, 2009 | June 29, 2008 | |||||||||||||
| Income (loss) from discontinued operations, net of tax (in thousands) |
$ | (1,951 | ) | $ | (16,942 | ) | $ | 14,991 | (88.5 | )% | ||||
| Percentage of Revenue |
(0.9 | )% | (8.2 | )% | ||||||||||
Loss from discontinued operations: The $15.0 million decrease in loss from discontinued operations is primarily due to $14.3 million in goodwill and intangible asset impairment charges related to our QoE business that occurred in fiscal 2008.
41
Table of Contents
Key Operating Metrics
Key operating metrics for measuring our performance include sales backlog and contract revenue. These metrics, which compare fiscal year 2010 with fiscal year 2009, are listed below.
Sales backlog:
Our backlog consists of firm orders that have yet to be shipped to the customer, or may not be shippable to a customer until a future period. Most orders included in backlog can be rescheduled or cancelled by customers without significant penalty. Historically, a substantial portion of net revenue in any fiscal period has been derived from orders received during that fiscal period. Our total backlog amounted to $42.5 million as of June 27, 2010, compared to $46.9 million as of June 28, 2009. The $4.4 million reduction in backlog between June 27, 2010 and June 28, 2009 was primarily due to an improvement in product lead times, resulting in more product that is booked and shipped within the same quarter. Our backlog, which is shippable within the next six months, was $28.7 million as of June 27, 2010, compared to $42.1 million as of June 28, 2009.
Contract revenue:
Revenue from contracts that require development and manufacture in accordance with customer specifications and have a lengthy development period may be categorized into two types: firm fixed price and cost-plus reimbursement. Revenue is recognized under the fixed price contracts using the percentage of completion method, (cost-to-cost basis) principally based upon the costs incurred relative to the total estimated costs at completion on the individual contracts. Any anticipated losses on contracts are charged to operations as soon as they are determinable. Revenue recognized under cost-plus contracts is recognized on the basis of direct and indirect costs incurred plus a negotiated profit calculated as a percentage of costs or as performance based award fee. Revenue from long-term contracts is reviewed periodically, with adjustments recorded in the period in which the revisions are made. As of June 27, 2010, we had approximately $9.5 million in contract revenue to be performed and recognized within the next 36 months, compared to approximately $6.4 million in contract revenue that was to be performed and recognized within the following 36 months as of June 28, 2009. These amounts have been accounted for as part of our sales backlog discussed above.
Liquidity and Capital Resources
As of June 27, 2010, working capital was $129.1 million, compared to $169.1 million as of June 28, 2009. Cash and cash equivalents and short term investments as of June 27, 2010 were $75.6 million, a decrease of $37.2 million from $112.8 million as of June 28, 2009. This decrease was primarily the result of the repayment of $56.9 million of our Notes offset by the $27.7 million of cash and cash equivalents generated by operating activities.
Net cash provided by operating activities in fiscal 2010 was $27.7 million. The net cash provided by operating activities was driven by the net income of $2.5 million, in addition to non-cash charges of $20.0 million including $7.0 million of loss on repurchase of convertible notes, $6.9 million of depreciation and amortization expenses, $3.7 million of stock-based compensation expense, $2.8 million of non-cash interest on our Notes, $1.0 million of provisions for excess and obsolete inventories, $0.5 million for other non-cash adjustments, offset by $1.0 million of deferred income taxes and $0.9 million for gain on sale of discontinued operations. Requirements for working capital assets and liabilities drove cash provided in operations of approximately $5.2 million, comprised of a $2.9 million increase in other accrued liabilities, $2.1 million decrease in accounts receivable, a $2.1 million decrease in prepaids and other assets, and a $0.2 million decrease in inventory, partially offset by a $1.6 million decrease in accounts payable and a $0.5 million decrease in accrued compensation. The $20.9 million net cash used for investing activities in fiscal 2010 was attributable to $86.9 million in purchases of short-term investments and $8.1 million in purchases of capital equipment, partially offset by $72.2 million in maturities of short-term investments and $1.9 million of cash proceeds from sale of
42
Table of Contents
discontinued operations. The $56.7 million net cash used for financing activities was attributable to $56.9 million used to repay our Notes in full, and $1.8 million used to repurchase common stock, partially offset by $2.0 million of proceeds from issuance of common stock.
Our total capital spending commitments outstanding as of June 27, 2010 were approximately $1.2 million. Days sales outstanding in accounts receivable was 66 days as of June 27, 2010, compared to 64 days as of June 28, 2009.
We believe that our existing cash resources will be sufficient to meet our anticipated operating and working capital expenditure needs in the ordinary course of business for at least the next 12 months and the foreseeable future. We base our expense levels in part on our expectation of future revenue levels. If our revenue for a particular period is lower than we expect, we may take steps to reduce our operating expenses accordingly. If cash generated from operations is insufficient to satisfy our liquidity requirements or if we require additional capital resources to grow our business or to acquire complementary technologies and businesses in the future, we may seek to issue additional equity securities or obtain additional debt financing. Additional financing may not be available at all or on terms acceptable to us. Additional financing may also be dilutive to our existing stockholders. We do not have any arrangements or relationships with entities that are not consolidated into our financial statements that are reasonably likely to materially affect our liquidity or the availability of our capital resources.
Convertible Subordinated Notes
On June 8, 2005, we sold $120.0 million of contingent convertible subordinated notes (the “Notes”), which were to mature on June 15, 2025 and paid interest at the rate of 3.25% per annum. Interest on the Notes was payable semi-annually in June and December of each year beginning on December 15, 2005. The Notes are unsecured obligations and were subordinated in right of payment to all of our existing and future senior debt. The Notes were structurally subordinated to all indebtedness and liabilities of our subsidiaries.
The Notes were convertible, at the holder’s option, prior to the maturity date into cash and, if applicable, shares of our common stock in the following circumstances:
| • | Prior to June 15, 2023, if the common stock price for at least 20 trading days in the period of 30 consecutive days ending on the last trading day of the calendar quarter preceding the quarter in which the conversion occurs was more than 125% of the conversion price of the Notes in effect on that 30th trading day; |
| • | On or after June 15, 2023, at all times on or after any date on which the common stock price was more than 125% of the then current conversion price; |
| • | During the five consecutive business-day period following any five consecutive trading-day period in which the trading price for the Notes for each such trading day was less than 95% of the average of the sale price of our common stock during such five trading-day period multiplied by the then current conversion rate; |
| • | If we had called the particular Notes for redemption and the redemption had not yet occurred; or |
| • | Upon the occurrence of specified corporate transactions. |
Holders could convert any outstanding Notes into cash and, if applicable, shares of our common stock at an initial conversion price per share of $12.49, which was determined based on the reported closing price of our common stock of $9.91 per share on June 2, 2005.
Also, on or after June 20, 2012, we could redeem some or all of the Notes at any time or from time to time at a redemption price of 100% of the principal amount of the Notes, plus accrued and unpaid interest (including liquidated damages, if any) up to but not including the date of redemption, payable in cash. Holders could require
43
Table of Contents
us to repurchase all or a portion of their Notes on June 15, 2012, 2015 and 2020 or at any date in the event of certain change of control events related to us for a repurchase price equal to 100% of the principal amount of the Notes, plus accrued and unpaid interest (including liquidated damages, if any) up to but not including the date of repurchase, payable in cash.
Convertible Subordinated Notes—Redemption—Fiscal 2009
On May 7, 2008, we received a notice of acceleration from the trustee under the indenture governing the Notes. The notice stated that our failure to file our Quarterly Report on Form 10-Q for the quarter ended December 30, 2007 violated certain provisions of the indenture. The acceleration letter declared that the principal amount outstanding under the Notes, together with any accrued and unpaid interest, and fees and expenses, was immediately due and payable. This notice of acceleration related to the trustee’s and certain bondholders’ previous notice received by the Company on or about March 3, 2008 stating that our failure to file our Quarterly Report on Form 10-Q for the quarter ended December 30, 2007 with the Securities and Exchange Commission (“SEC”) violated provisions of the indenture.
On June 17, 2008, we filed our Form 10-Q for the quarter ended December 30, 2007 and our Form 10-Q for the quarter ended March 30, 2008, as well as other filings related to our restatement of financial results for fiscal years and interim periods from June 30, 2002 to July 1, 2007 and for the first quarter of fiscal 2008 ended September 30, 2007.
On June 30, 2008, we offered to purchase for cash, on a pro rata basis, $63.1 million aggregate principal amount of the Notes, at a purchase price equal to $990 per $1,000 of the principal amount of the Notes, plus accrued and unpaid interest. The tender offer cap was equal to 52.6% of the $120.0 million aggregate principal amount outstanding. As of July 30, 2008, pursuant to the offer, Symmetricom accepted for payment $63.1 million aggregate principal amount of the Notes. The aggregate purchase price for the Notes surrendered was approximately $62.5 million, which included interest of $0.3 million. After the purchase pursuant to the offer, approximately $56.9 million aggregate principal amount of the Notes remained outstanding. In connection with the completion of the tender offer, the holder of a majority of the outstanding notes prior to the offer waived certain defaults alleged to have occurred under the indenture and rescinded the acceleration notice received by Symmetricom on May 7, 2008.
As a result of the partial redemption of the Notes in the first quarter of fiscal 2009, we recognized a pre-tax loss of $5.6 million, which represents the difference between the carrying value of the liability component of the redeemed amount and its fair value at the date of redemption in the first quarter of fiscal 2009.
Convertible Subordinated Notes—Redemption—Fiscal 2010
During the fourth quarter of fiscal 2010, we agreed to purchase all outstanding $56.9 million aggregate principal amount of our Notes in privately negotiated transactions, for a purchase price of $57.7 million, representing the par value principal amount of the Notes plus accrued and unpaid interest. The purchased Notes were retired and cancelled.
As a result of the full redemption of the Notes in the fourth quarter of fiscal 2010, we recognized a pre-tax loss of $7.0 million, which represents the difference between the carrying value of the liability component of the redeemed amount and its fair value at the date of redemption in the fourth quarter of fiscal 2010.
Contractual Obligations
We operate in multiple locations domestically and internationally. As such, certain facilities and equipment are leased under operating lease agreements. Due to excess capacity on several non-cancelable leases as a result of the economic downturn, we subleased certain facilities and recognized lease loss liabilities for the remainder.
44
Table of Contents
We incur purchase commitments during our normal course of business. As of June 27, 2010, our principal commitments totaled $28.8 million and related primarily to commitments to purchase inventory.
The following table summarizes our contractual cash obligations as of June 27, 2010, and the effect such obligations are expected to have on liquidity and cash flow in future periods.
| Payments due by period | |||||||||||||||
| Total | Less than 1 year |
1-3 years | 3-5 years | More than 5 years | |||||||||||
| (In thousands) | |||||||||||||||
| Contractual Obligations |
|||||||||||||||
| Operating leases obligations(1) |
21,092 | 3,998 | 7,078 | 7,133 | 2,883 | ||||||||||
| Purchase obligations |
28,793 | 28,136 | 389 | 268 | — | ||||||||||
| Post-retirement benefits liabilities(2) |
265 | 37 | 67 | 57 | 104 | ||||||||||
| Lease loss accrual |
5,541 | 1,063 | 1,990 | 1,875 | 613 | ||||||||||
| Total . |
$ | 55,691 | $ | 33,234 | $ | 9,524 | $ | 9,333 | $ | 3,600 | |||||
| (1) | Operating lease obligation is net of the lease loss accrual |
| (2) | Relates to a post-retirement health care benefits plan, assumed during an acquisition in fiscal 2003. The plan was curtailed in fiscal 2003, and only existing retired participants and employees of the acquired company, now employed by Symmetricom and meeting the retirement eligibility requirements by December 31, 2004, are eligible for participation. The health care plan is a contributory plan. |
Uncertain tax positions of $15.4 million consist of amounts included in the net deferred tax asset balance of $43.7 million at June 27, 2010 which would affect our income tax expense if recognized. Due to the high degree of uncertainty regarding the settlement of these liabilities, we are unable to estimate the year in which the future cash flows may occur and therefore have not included them in the above table.
Recent Accounting Pronouncements
In January 2010, the FASB issued authoritative guidance to amend the disclosure requirements related to recurring and nonrecurring fair value measurements. The guidance requires new disclosures on the transfers of assets and liabilities between Level 1 (quoted prices in active market for identical assets or liabilities) and Level 2 (significant other observable inputs) of the fair value measurement hierarchy, including the reasons and the timing of the transfers. Additionally, the guidance requires a roll forward of activities on purchases, sales, issuance, and settlements of the assets and liabilities measured using significant non-observable inputs (Level 3 fair value measurements). The guidance became effective for us in the quarter ended March 28, 2010. The adoption of this new guidance did not have a material impact on our consolidated financial statements.
In October 2009, the FASB issued authoritative guidance on revenue recognition that will become effective for us beginning June 28, 2010. Under the new guidance on arrangements that include software elements, tangible products that have software components that are essential to the functionality of the tangible product will no longer be within the scope of the software revenue recognition guidance, and software-enabled products will now be subject to other relevant revenue recognition guidance. Additionally, the FASB issued authoritative guidance on revenue arrangements with multiple deliverables that are outside the scope of the software revenue recognition guidance. Under the new guidance, when vendor specific objective evidence or third party evidence for deliverables in an arrangement cannot be determined, a best estimate of the selling price is required to separate deliverables and allocate arrangement consideration using the relative selling price method. The new guidance includes new disclosure requirements on how the application of the relative selling price method affects the timing and amount of revenue recognition. Under this guidance, we will be required to determine the relative selling price for all deliverables in a multiple element arrangement based on the hierarchy identified in the new standard. We are currently evaluating the impact this new guidance may have on our consolidated financial statements.
45
Table of Contents
In June 2009, the FASB issued authoritative guidance codifying a single source of authoritative nongovernmental U.S. GAAP. This guidance does not change current U.S. GAAP, but is intended to simplify user access to all authoritative U.S. GAAP by providing all authoritative literature related to a particular topic in one place. All existing accounting standard documents will be superseded and all other accounting literature not included in the FASB Codification will be considered non-authoritative. These provisions are effective for interim and annual periods ending after September 15, 2009 and, accordingly, are currently effective for us. The adoption of this pronouncement did not have an impact on our condensed consolidated financial statements, but has impacted our financial reporting process by eliminating all references to pre-codification standards. On the effective date, the Codification superseded all then-existing non-SEC accounting and reporting standards, and all other non-grandfathered non-SEC accounting literature not included in the Codification became non-authoritative.
46
Table of Contents
| Item 7A. | Quantitative and Qualitative Disclosures About Market Risk |
Interest Rate Exposure
As of June 27, 2010, we had short-term investments of $53.8 million. These investments are mainly in government sponsored enterprise and corporate debt securities that have maturity dates of greater than three months. These securities are subject to interest rate risk in as much as their fair value will fall if market interest rates increase. If market interest rates were to increase immediately and uniformly by 10% from the levels prevailing at June 27, 2010, the fair value of the portfolio would not decline by a material amount. Additionally, a 10% decrease in the market interest rates would not materially impact the fair value of the portfolio. We do not use derivative financial instruments to mitigate the risks inherent in these securities. However, we do attempt to reduce these risks by typically limiting the maturity date of such securities to no more than 36 months, placing our investments with high credit quality issuers and limiting the amount of credit exposure with any one issuer. The possibility exists that some of these issues may be downgraded as a result of disruptions in the credit market; however, we believe that we currently have the ability and currently intend to hold these investments until maturity, or until they recover their value at par or face value, and therefore, believe that reductions in the value of these securities attributable to short-term fluctuations in interest rates would not materially harm our business.
Foreign Currency Exchange Rate Exposure
Our exposure to market risk due to fluctuations in currency exchange rates relates primarily to the intercompany balances with our subsidiaries in the United Kingdom and Germany. Although we transact business in various countries, settlement amounts are usually based on United States currency. Transaction gains or losses have not been significant in the past and we do not presently engage in hedging activity. A hypothetical 10% adverse change in sterling or Euro against United States dollars would not result in a material foreign exchange loss. Consequently, we do not expect that a sudden or significant fluctuation in foreign exchange rates would have a direct material impact on our business.
Notwithstanding the foregoing analysis of the direct effects of interest rate and currency exchange rate fluctuations on the value of certain of our investments and accounts, the indirect effects of such fluctuations could have a materially harmful effect on our business. For example, international demand for our products is affected by foreign currency exchange rates. In addition, interest rate fluctuations may affect the buying patterns of our customers. Furthermore, interest rate and currency exchange rate fluctuations have broad influence on the general condition of the United States, foreign and global economies which could materially harm our business.
47
Table of Contents
| Item 8. | Consolidated Financial Statements and Supplementary Data |
Supplementary quarterly financial data (unaudited):
The following table shows our unaudited condensed, consolidated quarterly statements of operations data for each of the quarters in the years ended June 27, 2010 and June 28, 2009. This information has been derived from our unaudited financial information, which, in the opinion of management, has been prepared on the same basis as our audited financial statements and includes all adjustments necessary for the fair presentation of the financial information for the quarters presented.
| First Quarter |
Second Quarter |
Third Quarter |
Fourth Quarter |
|||||||||||||
| (In thousands, except per share amounts) | ||||||||||||||||
| Fiscal Year 2010 |
||||||||||||||||
| Net revenue |
$ | 52,268 | $ | 56,862 | $ | 56,526 | $ | 55,660 | ||||||||
| Gross profit |
21,501 | 24,679 | 27,433 | 23,907 | ||||||||||||
| Operating income . |
1,677 | 3,710 | 6,304 | 438 | ||||||||||||
| Income (loss) from continuing operations before taxes |
864 | 2,945 | 5,336 | (7,102 | ) | |||||||||||
| Income (loss) from continuing operations |
549 | 1,890 | 3,688 | (3,581 | ) | |||||||||||
| Income (loss) from discontinued operations, net of tax |
(375 | ) | (391 | ) | 804 | (58 | ) | |||||||||
| Net income (loss) |
174 | 1,499 | 4,492 | (3,639 | ) | |||||||||||
| Basic income (loss) per share from continuing operations |
0.01 | 0.04 | 0.08 | (0.08 | ) | |||||||||||
| Basic income (loss) per share from discontinued operations |
(0.01 | ) | (0.01 | ) | 0.02 | — | ||||||||||
| Basic net income (loss) per share |
— | 0.03 | 0.10 | (0.08 | ) | |||||||||||
| Diluted income (loss) per share from continuing operations |
0.01 | 0.04 | 0.08 | (0.08 | ) | |||||||||||
| Diluted income (loss) per share from discontinued operations |
(0.01 | ) | (0.01 | ) | 0.02 | — | ||||||||||
| Diluted net income (loss) per share |
— | 0.03 | 0.10 | (0.08 | ) | |||||||||||
| Fiscal Year 2009 |
||||||||||||||||
| Net revenue |
$ | 55,672 | $ | 47,646 | $ | 56,168 | $ | 60,260 | ||||||||
| Gross profit |
28,818 | 22,442 | 24,580 | 27,382 | ||||||||||||
| Operating income (loss) . |
6,805 | 3,421 | (45,537 | ) | 2,598 | |||||||||||
| Income (loss) from continuing operations before taxes |
(177 | ) | 1,812 | (46,458 | ) | 1,605 | ||||||||||
| Income (loss) from continuing operations |
(218 | ) | 1,154 | (46,750 | ) | 2,009 | ||||||||||
| Loss from discontinued operations, net of tax |
(958 | ) | (112 | ) | (358 | ) | (523 | ) | ||||||||
| Net income (loss) |
(1,176 | ) | 1,042 | (47,108 | ) | 1,486 | ||||||||||
| Basic income (loss) per share from continuing operations |
(0.01 | ) | 0.02 | (1.08 | ) | 0.05 | ||||||||||
| Basic loss per share from discontinued operations |
(0.02 | ) | — | (0.01 | ) | (0.01 | ) | |||||||||
| Basic net income (loss) per share |
(0.03 | ) | 0.02 | (1.09 | ) | 0.04 | ||||||||||
| Diluted income (loss) per share from continuing operations |
(0.01 | ) | 0.02 | (1.08 | ) | 0.05 | ||||||||||
| Diluted loss per share from discontinued operations |
(0.02 | ) | — | (0.01 | ) | (0.01 | ) | |||||||||
| Diluted net income (loss) per share |
(0.03 | ) | 0.02 | (1.09 | ) | 0.04 | ||||||||||
48
Table of Contents
SYMMETRICOM, INC.
INDEX TO CONSOLIDATED FINANCIAL STATEMENTS
| Page | ||
| 50 | ||
| Consolidated Balance Sheets at June 27, 2010 and June 28, 2009 |
51 | |
| 52 | ||
| 53 | ||
| 54 | ||
| 55 | ||
49
Table of Contents
REPORT OF INDEPENDENT REGISTERED PUBLIC ACCOUNTING FIRM
To the Board of Directors and Stockholders of
Symmetricom, Inc.
San Jose, California
We have audited the accompanying consolidated balance sheets of Symmetricom, Inc. and subsidiaries (the “Company”) as of June 27, 2010 and June 28, 2009, and the related consolidated statements of operations, stockholders’ equity and comprehensive income (loss), and cash flows for each of the three years in the period ended June 27, 2010. Our audits also included the financial statement schedule listed in the Index at Item 15(a)2. These consolidated financial statements and financial statement schedule are the responsibility of the Company’s management. Our responsibility is to express an opinion on the consolidated financial statements and financial statement schedule based on our audits.
We conducted our audits in accordance with the standards of the Public Company Accounting Oversight Board (United States). Those standards require that we plan and perform the audit to obtain reasonable assurance about whether the financial statements are free of material misstatement. An audit includes examining, on a test basis, evidence supporting the amounts and disclosures in the financial statements. An audit also includes assessing the accounting principles used and significant estimates made by management, as well as evaluating the overall financial statement presentation. We believe that our audits provide a reasonable basis for our opinion.
In our opinion, such consolidated financial statements present fairly, in all material respects, the financial position of Symmetricom, Inc. and subsidiaries as of June 27, 2010 and June 28 2009, and the results of their operations and their cash flows for each of the three years in the period ended June 27, 2010, in conformity with accounting principles generally accepted in the United States of America. Also, in our opinion, such financial statement schedule, when considered in relation to the basic consolidated financial statements taken as a whole, presents fairly, in all material respects, the information set forth therein.
We have also audited, in accordance with the standards of the Public Company Accounting Oversight Board (United States), the Company’s internal control over financial reporting as of June 27, 2010, based on the criteria established in Internal Control—Integrated Framework issued by the Committee of Sponsoring Organizations of the Treadway Commission and our report dated September 10, 2010 expressed an unqualified opinion on the Company’s internal control over financial reporting.
/s/ Deloitte & Touche LLP
San Jose, California
September 10, 2010
50
Table of Contents
CONSOLIDATED BALANCE SHEETS
(In thousands, except par value)
| June 27, 2010 | June 28, 2009 | |||||||
| ASSETS |
||||||||
| Current assets: |
||||||||
| Cash and cash equivalents |
$ | 21,794 | $ | 72,064 | ||||
| Short-term investments |
53,825 | 40,737 | ||||||
| Accounts receivable, net of allowance for doubtful accounts of $427 in 2010 and $361 in 2009 |
40,075 | 42,389 | ||||||
| Inventories |
37,229 | 38,566 | ||||||
| Prepaids and other current assets |
15,108 | 16,143 | ||||||
| Total current assets |
168,031 | 209,899 | ||||||
| Property, plant and equipment, net |
23,077 | 20,749 | ||||||
| Intangible assets, net |
3,745 | 5,308 | ||||||
| Deferred taxes and other assets |
36,534 | 36,431 | ||||||
| Total assets |
$ | 231,387 | $ | 272,387 | ||||
| LIABILITIES AND STOCKHOLDERS’ EQUITY |
||||||||
| Current liabilities: |
||||||||
| Accounts payable |
$ | 6,768 | $ | 8,116 | ||||
| Accrued compensation |
18,731 | 19,093 | ||||||
| Accrued warranty |
2,900 | 3,737 | ||||||
| Other accrued liabilities |
10,506 | 9,810 | ||||||
| Total current liabilities |
38,905 | 40,756 | ||||||
| Long-term obligations |
8,296 | 51,769 | ||||||
| Deferred income taxes |
334 | 334 | ||||||
| Total liabilities |
47,535 | 92,859 | ||||||
| Commitments and contingencies (Notes 6 and 10) |
||||||||
| Stockholders’ equity: |
||||||||
| Preferred stock, $0.0001 par value; 500 shares authorized, none issued |
— | — | ||||||
| Common stock, $0.0001 par value; 70,000 shares authorized, 49,933 shares issued and 43,699 outstanding in 2010; 49,442 shares issued and 43,556 outstanding in 2009 |
202,450 | 200,152 | ||||||
| Accumulated other comprehensive income (loss) |
(356 | ) | 144 | |||||
| Accumulated deficit |
(18,242 | ) | (20,768 | ) | ||||
| Total stockholders’ equity |
183,852 | 179,528 | ||||||
| Total liabilities and stockholders’ equity |
$ | 231,387 | $ | 272,387 | ||||
See notes to the consolidated financial statements.
51
Table of Contents
CONSOLIDATED STATEMENTS OF OPERATIONS
(In thousands, except per share amounts)
| Year ended | ||||||||||||
| June 27, 2010 | June 28, 2009 | June 29, 2008 | ||||||||||
| Net revenue |
$ | 221,316 | $ | 219,746 | $ | 206,386 | ||||||
| Cost of products and services |
116,889 | 111,184 | 113,331 | |||||||||
| Amortization of purchased technology |
1,282 | 1,474 | 1,838 | |||||||||
| Restructuring charges |
5,625 | 3,866 | 634 | |||||||||
| Total cost of sales |
123,796 | 116,524 | 115,803 | |||||||||
| Gross profit |
97,520 | 103,222 | 90,583 | |||||||||
| Operating expenses: |
||||||||||||
| Research and development |
23,701 | 23,421 | 22,711 | |||||||||
| Selling, general and administrative |
56,743 | 58,119 | 59,709 | |||||||||
| Amortization of intangible assets |
281 | 411 | 422 | |||||||||
| Restructuring charges |
4,666 | 5,840 | 794 | |||||||||
| Impairment of goodwill |
— | 48,144 | — | |||||||||
| Total operating expenses |
85,391 | 135,935 | 83,636 | |||||||||
| Operating income (loss) |
12,129 | (32,713 | ) | 6,947 | ||||||||
| Gain on sale of asset |
— | — | 700 | |||||||||
| Loss on repayment of convertible notes, net |
(7,026 | ) | (5,623 | ) | — | |||||||
| Loss on short-term investments, net |
— | (1,368 | ) | (3,728 | ) | |||||||
| Interest income |
1,594 | 1,807 | 7,123 | |||||||||
| Interest expense |
(4,654 | ) | (5,321 | ) | (9,953 | ) | ||||||
| Income (loss) from continuing operations before taxes |
2,043 | (43,218 | ) | 1,089 | ||||||||
| Income tax provision (benefit) |
(503 | ) | 588 | 1,894 | ||||||||
| Income (loss) from continuing operations |
2,546 | (43,806 | ) | (805 | ) | |||||||
| Loss from discontinued operations, net of tax |
(20 | ) | (1,951 | ) | (16,942 | ) | ||||||
| Net income (loss) |
$ | 2,526 | $ | (45,757 | ) | $ | (17,747 | ) | ||||
| Earnings (loss) per share—basic: |
||||||||||||
| Income (loss) from continuing operations |
$ | 0.06 | $ | (1.01 | ) | $ | (0.02 | ) | ||||
| Loss from discontinued operations, net of tax |
— | (0.04 | ) | (0.38 | ) | |||||||
| Net income (loss) |
$ | 0.06 | $ | (1.05 | ) | $ | (0.40 | ) | ||||
| Weighted average shares outstanding—basic |
43,380 | 43,500 | 44,461 | |||||||||
| Earnings (loss) per share—diluted: |
||||||||||||
| Income (loss) from continuing operations |
$ | 0.06 | $ | (1.01 | ) | $ | (0.02 | ) | ||||
| Loss from discontinued operations, net of tax |
— | (0.04 | ) | (0.38 | ) | |||||||
| Net Income (loss) |
$ | 0.06 | $ | (1.05 | ) | $ | (0.40 | ) | ||||
| Weighted average shares outstanding—diluted |
43,897 | 43,500 | 44,461 | |||||||||
See notes to the consolidated financial statements.
52
Table of Contents
CONSOLIDATED STATEMENTS OF STOCKHOLDERS’ EQUITY
AND COMPREHENSIVE INCOME (LOSS)
(In thousands)
| Common Stock | Accumulated Other Comprehensive Income (loss) |
Retained Earnings (accumulated deficit) |
Total Stock- holders’ Equity |
Total Comprehensive Income (loss) |
|||||||||||||||||||
| Shares | Amount | ||||||||||||||||||||||
| Balance at July 1, 2007 |
46,528 | $ | 213,271 | $ | 403 | $ | 43,133 | $ | 256,807 | $ | 3,505 | ||||||||||||
| Issuance of common stock: |
|||||||||||||||||||||||
| Stock option exercises, net of shares tendered upon exercise |
50 | 205 | — | — | 205 | ||||||||||||||||||
| Restricted stock issued |
510 | — | — | — | — | ||||||||||||||||||
| Repurchase of common stock |
(2,037 | ) | (9,549 | ) | — | — | (9,549 | ) | |||||||||||||||
| Restricted stock canceled |
(126 | ) | — | — | — | — | |||||||||||||||||
| Stock option income tax expense |
— | (480 | ) | — | — | (480 | ) | ||||||||||||||||
| Stock-based compensation |
— | 4,955 | — | — | 4,955 | ||||||||||||||||||
| Adjustment for FIN 48 adoption (See Note 9) |
— | — | — | (397 | ) | (397 | ) | ||||||||||||||||
| Comprehensive income: |
|||||||||||||||||||||||
| Loss from continuing operations |
— | — | — | (805 | ) | (805 | ) | (805 | ) | ||||||||||||||
| Loss from discontinued operations, net of tax |
(16,942 | ) | (16,942 | ) | (16,942 | ) | |||||||||||||||||
| Unrealized loss on short-term investments, net of taxes |
— | — | (338 | ) | — | (338 | ) | (338 | ) | ||||||||||||||
| Cumulative adjustments to foreign currency translation, net of taxes |
— | — | (125 | ) | — | (125 | ) | (125 | ) | ||||||||||||||
| Balance at June 29, 2008 |
44,925 | $ | 208,402 | $ | (60 | ) | $ | 24,989 | $ | 233,331 | $ | (18,210 | ) | ||||||||||
| Issuance of common stock: |
|||||||||||||||||||||||
| Stock option exercises, net of shares tendered upon exercise |
151 | 595 | — | — | 595 | ||||||||||||||||||
| Restricted stock issued |
30 | — | — | — | — | ||||||||||||||||||
| Repurchase of common stock |
(1,416 | ) | (5,785 | ) | — | — | (5,785 | ) | |||||||||||||||
| Restricted stock canceled |
(134 | ) | — | — | — | — | |||||||||||||||||
| Stock option income tax expense |
— | (670 | ) | — | — | (670 | ) | ||||||||||||||||
| Stock-based compensation |
— | 3,292 | — | — | 3,292 | ||||||||||||||||||
| Adjustment for repayment of convertible notes, net |
— | (5,682 | ) | — | — | (5,682 | ) | ||||||||||||||||
| Comprehensive income: |
|||||||||||||||||||||||
| Loss from continuing operations |
— | — | — | (43,806 | ) | (43,806 | ) | (43,806 | ) | ||||||||||||||
| Loss from discontinued operations, net of tax |
(1,951 | ) | (1,951 | ) | (1,951 | ) | |||||||||||||||||
| Unrealized gain on short-term investments, net of taxes |
— | — | 372 | — | 372 | 372 | |||||||||||||||||
| Cumulative adjustments to foreign currency translation, net of taxes |
— | — | (168 | ) | — | (168 | ) | (168 | ) | ||||||||||||||
| Balance at June 28, 2009 |
43,556 | $ | 200,152 | $ | 144 | $ | (20,768 | ) | $ | 179,528 | $ | (45,553 | ) | ||||||||||
| Issuance of common stock: |
|||||||||||||||||||||||
| Stock option exercises, net of shares tendered upon exercise |
439 | 1,968 | — | — | 1,968 | ||||||||||||||||||
| Restricted stock issued |
127 | — | — | — | — | ||||||||||||||||||
| Repurchase of common stock |
(348 | ) | (1,824 | ) | — | — | (1,824 | ) | |||||||||||||||
| Restricted stock canceled |
(75 | ) | — | — | — | — | |||||||||||||||||
| Stock option income tax expense |
— | (949 | ) | — | — | (949 | ) | ||||||||||||||||
| Stock-based compensation |
— | 3,714 | — | — | 3,714 | ||||||||||||||||||
| Adjustment for repayment of convertible notes, net |
— | (611 | ) | — | — | (611 | ) | ||||||||||||||||
| Comprehensive income: |
|||||||||||||||||||||||
| Income from continuing operations |
— | — | — | 2,546 | 2,546 | 2,546 | |||||||||||||||||
| Loss from discontinued operations, net of tax |
— | — | — | (20 | ) | (20 | ) | (20 | ) | ||||||||||||||
| Unrealized loss on short-term investments, net of taxes |
— | — | (213 | ) | — | (213 | ) | (213 | ) | ||||||||||||||
| Cumulative adjustments to foreign currency translation, net of taxes |
— | — | (287 | ) | — | (287 | ) | (287 | ) | ||||||||||||||
| Balance at June 27, 2010 |
43,699 | $ | 202,450 | $ | (356 | ) | $ | (18,242 | ) | $ | 183,852 | $ | 2,026 | ||||||||||
See notes to the consolidated financial statements.
53
Table of Contents
CONSOLIDATED STATEMENTS OF CASH FLOWS
(In thousands)
| Year ended | ||||||||||||
| June 27, 2010 |
June 28, 2009 |
June 29, 2008 |
||||||||||
| Cash flows from operating activities: |
||||||||||||
| Net income (loss) |
$ | 2,526 | $ | (45,757 | ) | $ | (17,747 | ) | ||||
| Adjustments to reconcile net income (loss) to net cash provided by operating activities: |
||||||||||||
| Impairment of goodwill |
— | 48,144 | 14,275 | |||||||||
| Depreciation and amortization |
6,913 | 8,948 | 10,649 | |||||||||
| Deferred income taxes |
(1,042 | ) | (2,565 | ) | (8,494 | ) | ||||||
| Non-cash interest on convertible bonds |
2,845 | 3,075 | 5,411 | |||||||||
| Gain on sale of discontinued operations |
(915 | ) | — | — | ||||||||
| Loss on short-term investments |
— | 1,368 | 3,728 | |||||||||
| Loss on repayment of convertible notes, net |
7,026 | 5,623 | — | |||||||||
| Loss on disposal of fixed assets |
265 | 786 | 180 | |||||||||
| Allowance for doubtful accounts |
178 | (328 | ) | 173 | ||||||||
| Provision for excess and obsolete inventory |
971 | 2,619 | 3,393 | |||||||||
| Gain on sale of asset |
— | — | (700 | ) | ||||||||
| Stock-based compensation |
3,714 | 3,292 | 4,955 | |||||||||
| Stock option excess income tax benefit |
— | — | (2 | ) | ||||||||
| Changes in assets and liabilities: |
||||||||||||
| Accounts receivable |
2,102 | (5,379 | ) | 513 | ||||||||
| Inventories |
241 | (2,912 | ) | (2,709 | ) | |||||||
| Prepaids and other assets |
2,057 | (1,260 | ) | 1,062 | ||||||||
| Accounts payable |
(1,568 | ) | (780 | ) | (3,715 | ) | ||||||
| Accrued compensation |
(494 | ) | 5,511 | (570 | ) | |||||||
| Other accrued liabilities |
2,870 | 1,296 | 1,785 | |||||||||
| Net cash provided by operating activities |
27,689 | 21,681 | 12,187 | |||||||||
| Cash flows from investing activities: |
||||||||||||
| Purchase of intangible assets |
— | — | (1,455 | ) | ||||||||
| Purchases of short-term investments |
(86,956 | ) | (26,371 | ) | (25,945 | ) | ||||||
| Maturities of short-term investments |
72,245 | 7,262 | 137,349 | |||||||||
| Purchases of plant and equipment |
(8,075 | ) | (3,685 | ) | (5,153 | ) | ||||||
| Proceeds from note receivable from employee |
— | — | 500 | |||||||||
| Proceeds from sale of asset |
— | — | 700 | |||||||||
| Cash proceeds from sale of discontinued operations |
1,850 | — | — | |||||||||
| Net cash provided by (used for) investing activities |
(20,936 | ) | (22,794 | ) | 105,996 | |||||||
| Cash flows from financing activities: |
||||||||||||
| Repayment of long-term obligations |
— | (1,395 | ) | (3,884 | ) | |||||||
| Proceeds from issuance of common stock |
1,968 | 595 | 205 | |||||||||
| Stock option excess income tax benefit |
— | — | 2 | |||||||||
| Repurchase of common stock |
(1,824 | ) | (5,785 | ) | (9,549 | ) | ||||||
| Repayment of convertible notes |
(56,880 | ) | (62,489 | ) | — | |||||||
| Net cash used for financing activities |
(56,736 | ) | (69,074 | ) | (13,226 | ) | ||||||
| Effect of exchange rate changes in cash |
(287 | ) | (168 | ) | (125 | ) | ||||||
| Net increase (decrease) in cash and cash equivalents |
(50,270 | ) | (70,355 | ) | 104,832 | |||||||
| Cash and cash equivalents at beginning of year |
72,064 | 142,419 | 37,587 | |||||||||
| Cash and cash equivalents at end of year |
$ | 21,794 | $ | 72,064 | $ | 142,419 | ||||||
| Non-cash investing and financing activities: |
||||||||||||
| Unrealized gain (loss) on securities, net |
$ | (213 | ) | $ | 372 | $ | (338 | ) | ||||
| Plant and equipment purchases included in accounts payable |
133 | 48 | 170 | |||||||||
| Cash payments for: |
||||||||||||
| Interest |
$ | 1,733 | $ | 2,125 | $ | 4,116 | ||||||
| Income taxes |
835 | 1,008 | 1,829 | |||||||||
See notes to the consolidated financial statements.
54
Table of Contents
NOTES TO CONSOLIDATED FINANCIAL STATEMENTS
Note 1—Summary of Significant Accounting Policies
Business
Symmetricom, a world leader in precise time solutions, sets the world’s standard for time. The Company generates, distributes and applies precise time for the communications, aerospace/defense, IT infrastructure and metrology industries. Symmetricom’s customers, from communications service providers and network equipment manufacturers to governments and their suppliers worldwide, are able to build more reliable networks and systems by using the Company’s advanced timing technologies, atomic clocks, services and solutions. All products support today’s precise timing standards, including GPS-based timing, IEEE 1588 (PTP), Network Time Protocol (NTP), Synchronous Ethernet and DOCSIS(R) timing.
Principles of Consolidation
The consolidated financial statements include the accounts of Symmetricom, Inc., and its wholly owned subsidiaries (“Symmetricom,” “we,” “our” or the “Company”). All significant intercompany accounts and transactions are eliminated.
Fiscal Year
Our fiscal year is the 52 or 53 weeks ending on the Sunday closest to June 30. Fiscal years 2008 through 2010 were all 52-week fiscal years.
Adoption of New Accounting Standard for Convertible Notes
The Financial Accounting Standards Board (FASB) issued authoritative guidance, which became effective for us June 29, 2009, on accounting for contingent convertible subordinated notes, which requires retrospective adoption to previously disclosed consolidated financial statements. As such, certain prior period amounts have been revised in the condensed consolidated financial statements to reflect the adoption of the standard for all periods presented. See Note 12 for a discussion of the impact of the implementation of this standard.
Discontinued Operations
During the third quarter of fiscal 2010, we completed the sale of our video Quality of Experience (QoE) business to Cheetah Technologies, L.P. (Cheetah). This has been accounted for as a discontinued operation and, accordingly, the results of operations have been excluded from continuing operations in the consolidated statements of operations. See Note 3 for a discussion of this transaction.
Use of Estimates
The preparation of financial statements in conformity with generally accepted accounting principles in the United States of America requires management to make estimates and assumptions that affect the amounts reported in the financial statements and accompanying notes. These estimates include:
| • | Fair value of convertible notes |
| • | Revenue recognition |
| • | Valuation of short-term investments |
| • | Allowance for doubtful accounts |
55
Table of Contents
SYMMETRICOM, INC.
NOTES TO CONSOLIDATED FINANCIAL STATEMENTS—(Continued)
| • | Inventory valuation |
| • | Valuation of long-lived assets including goodwill and intangible assets |
| • | Accounting for income taxes |
| • | Stock based compensation |
| • | Warranty accrual |
| • | Accruals for contingent liabilities (including restructuring charges) |
These estimates are based on available information as of the date of these consolidated financial statements and actual results could differ from these estimates.
Cash and Cash Equivalents
We consider all highly liquid debt investments with a remaining maturity of three months or less when purchased to be cash and cash equivalents.
Short-term Investments
Short-term investments consist of government securities, mutual funds and corporate debt securities that mature between three and 36 months. All of our short-term investments, except the deferred compensation plan assets, are classified as available-for-sale. During fiscal 2009, we reclassified the deferred compensation plan assets from available-for-sale to trading securities in order to maintain consistency with the method in which we account for the deferred compensation obligation. Available-for-sale securities are carried at fair value with temporary unrealized gains and losses, net of taxes, reported as a component of stockholders’ equity. Unrealized gains and losses related to trading securities are included in interest income in our consolidated statements of operations.
Short-term investments are considered to be impaired when a decline in fair value is judged to be other-than-temporary. We consult with our investment manager and consider available quantitative and qualitative evidence in evaluating potential impairment of our investments on a quarterly basis. If the cost of an investment exceeds its fair value, we evaluate, among other factors, general market conditions, the duration and extent to which the fair value is less than cost, and our intent and ability to hold the investment. Once a decline in fair value is determined to be other-than-temporary, an impairment charge is recorded to operations and a new cost basis in the investment is established.
Fair Values of Financial Instruments
The estimated fair value of our financial instruments, which include cash and cash equivalents, short-term investments, accounts receivable, accounts payable, approximate their carrying amount.
Concentrations of Credit Risk
Financial instruments, which potentially subject us to concentrations of credit risk, consist principally of cash and cash equivalents, short-term investments, and accounts receivable. We place our investments with high-credit-quality corporations and financial institutions. Accounts receivable are derived primarily from sales to telecommunications service providers, original equipment manufacturers, government agencies, defense contractors, and distributors. Management believes that its credit evaluation, approval, and monitoring processes
56
Table of Contents
SYMMETRICOM, INC.
NOTES TO CONSOLIDATED FINANCIAL STATEMENTS—(Continued)
mitigate potential credit risks. However, we still have significant credit risks as our customers currently tend to consolidate by mergers or acquisitions, which could impact their ability to pay.
Inventories
Inventories are stated at the lower-of-cost (first-in, first-out) or market. We assess the valuation of all inventories, including raw materials, work-in-process, finished goods and spare parts on a periodic basis. Obsolete inventory or inventory in excess of management’s estimated usage is written down to its estimated market value less costs to sell, if less than its cost. Inherent in the estimates of market value are management’s estimates related to current economic trends, future demand and technological obsolescence. Inventories consist of:
| June 27, 2010 | June 28, 2009 | |||||
| (In thousands) | ||||||
| Raw materials |
$ | 19,419 | $ | 19,992 | ||
| Work-in-process |
8,593 | 10,231 | ||||
| Finished goods |
9,217 | 8,343 | ||||
| Inventories. |
$ | 37,229 | $ | 38,566 | ||
Property, Plant and Equipment, Net
Property, plant and equipment are stated at cost. Depreciation and amortization are computed using the straight-line method based on the estimated useful lives of the assets except for land as follows:
| Buildings and improvements |
15 - 39 years | |
| Leasehold improvements |
5 - 15 years, or life of lease, if shorter | |
| Machinery, equipment and computer software |
3 - 7 years |
Property, plant and equipment, net consist of the following:
| June 27, 2010 | June 28, 2009 | |||||||
| (In thousands) | ||||||||
| Property, plant and equipment, net: |
||||||||
| Land |
$ | 200 | $ | 200 | ||||
| Buildings and improvements |
16,193 | 15,898 | ||||||
| Machinery and equipment |
27,334 | 31,008 | ||||||
| Computer software |
10,607 | 10,447 | ||||||
| Leasehold improvements |
19,956 | 18,351 | ||||||
| 74,290 | 75,904 | |||||||
| Accumulated depreciation and amortization |
(51,213 | ) | (55,155 | ) | ||||
| $ | 23,077 | $ | 20,749 | |||||
Accounting for Income Taxes
We provide for income taxes using the asset and liability method. Deferred tax assets and liabilities are recognized for the future tax consequences attributable to differences between the financial statement carrying
57
Table of Contents
SYMMETRICOM, INC.
NOTES TO CONSOLIDATED FINANCIAL STATEMENTS—(Continued)
amounts of existing assets and liabilities and their respective tax basis. Deferred tax assets and liabilities are measured using enacted tax rates expected to apply to taxable income in the years in which those temporary differences are expected to be realized. The effect on deferred tax assets and liabilities from a change in tax rates is recognized in the financial statements in the period that includes the enactment date.
The carrying value of our net deferred tax assets, which are made up of tax deductions, net operating loss carryforwards and tax credits, assumes that we will be able to generate sufficient future income to fully realize these assets. We evaluate the weight of all available evidence in determining whether it is more likely than not that some portion of the deferred tax assets will not be realized. If we do not generate sufficient future income, the realization of these deferred tax assets may be impaired, resulting in an additional income tax expense. A portion of our tax credits are related to stock options and have a valuation allowance because of uncertainty regarding their realization. If these tax credits are realized, the benefit will be credited to common stock.
In fiscal 2008, we adopted the provisions of FASB guidance on accounting for uncertainty in income taxes which provides a financial statement recognition threshold and measurement attribute for a tax position taken or expected to be taken in a tax return. Under this guidance, we may recognize the tax benefit from an uncertain tax position only if it is more likely than not that the tax position will be sustained on examination by the taxing authorities, based on the technical merits of the position. The tax benefits recognized in the financial statements from such a position are measured based on the largest benefit that has a greater than 50% likelihood of being realized upon ultimate settlement.
Goodwill and Intangible Assets
We allocate the purchase price of acquired companies to the tangible and intangible assets acquired and liabilities assumed, as well as in-process research and development based on their estimated fair values. Such allocations require management to make significant estimates and assumptions, especially with respect to intangible assets.
Our accounting policy is to perform impairment tests in accordance with the FASB guidance on Goodwill and Other Intangible Assets, on an annual basis, and between annual tests in certain circumstances, for each reporting unit using a discounted cash flow valuation method. Critical estimates in valuing certain intangible assets include, but are not limited to: future expected cash flows from customer contracts, customer lists, distribution agreements, acquired developed technologies and patents; expected costs to develop the in-process research and development into commercially viable products and estimating cash flows from the projects when completed; and the brand awareness and the market position of the acquired products and assumptions about the period of time the brand will continue to be used in the combined company’s product portfolio. Management’s estimates of fair value are based upon assumptions believed to be reasonable, but which are inherently uncertain and unpredictable.
In the third quarter of fiscal 2009, due to a decline in our stock price and a lowered business outlook, we determined that indicators of a potential goodwill impairment existed. Based on the results of our tests of impairment, we recorded a goodwill impairment charge of approximately $48.1 million in the third quarter of fiscal 2009, consisting of $28.0 million related to the Communications business segment and $20.1 million related to the Government business segment.
Long-lived Assets Including Other Intangible Assets Subject to Amortization
The carrying value of long-lived assets is evaluated whenever events or changes in circumstances indicate that the carrying value of the asset may be impaired. An impairment loss is recognized when estimated
58
Table of Contents
SYMMETRICOM, INC.
NOTES TO CONSOLIDATED FINANCIAL STATEMENTS—(Continued)
undiscounted future cash flows expected to result from the use of the asset, including disposition, is less than the carrying value of the asset. An impairment loss is measured as the amount by which the carrying amount exceeds the fair value.
In the third quarter of fiscal 2009, because of the identification of goodwill impairment indicators (See above—Goodwill and Other Intangible Assets), we first reviewed our other intangible and long-lived assets for impairment and determined there was no impairment.
Comprehensive Income
FASB issued authoritative guidance on reporting comprehensive income, establishes standards for reporting and display of comprehensive income and its components. It also requires companies to report comprehensive income that includes unrealized holding gains and losses and other items that have previously been excluded from net income and reflected instead in stockholders’ equity.
Accumulated other comprehensive income (loss), consists of the following:
| June 27, 2010 | June 28, 2009 | June 29, 2008 | ||||||||||
| (in thousands) | ||||||||||||
| Foreign currency translation adjustments, net of taxes |
$ | (318 | ) | $ | (31 | ) | $ | 137 | ||||
| Unrealized gain (loss) on investments, net of taxes |
(38 | ) | 175 | (197 | ) | |||||||
| Total accumulated other comprehensive income (loss) |
$ | (356 | ) | $ | 144 | $ | (60 | ) | ||||
Warranty
Our standard warranty agreement is one year from shipment. However, our warranty agreements are contract and component specific and can range to twenty years for selected components. We offer extended warranty contracts to our customers. The extended warranty is offered on products that are less than eight years old. The extended warranty contract is applicable for a maximum of nine years after the expiration of the standard one-year warranty. The revenue from extended warranty contracts is recognized ratably over the period of contract.
We accrue for anticipated warranty costs upon shipment. Our warranty reserve is based on the number of installed units, historical analysis of the volume of product returned to us under the warranty program, management’s judgment regarding anticipated rates of warranty claims and associated repair costs. We use the historical data to forecast our anticipated future warranty obligations.
Software Development Costs
Costs for the development of new software and substantial enhancements to existing software are expensed as incurred until technological feasibility has been established, at which time any additional development costs would be capitalized in accordance with FASB issued authoritative guidance on Accounting for the Cost of Computer Software to Be Sold, Leased, or Otherwise Marketed. We believe the current process for developing software is essentially completed concurrently with the establishment of technological feasibility; accordingly, no costs have been capitalized to date.
59
Table of Contents
SYMMETRICOM, INC.
NOTES TO CONSOLIDATED FINANCIAL STATEMENTS—(Continued)
Foreign Currency Translation
The functional currency of each of our international subsidiaries in the United Kingdom and China is the U.S. dollar, while in Germany, it is the Euro.
For our subsidiaries in which the U.S. Dollar is the functional currency, foreign currency denominated assets and liabilities are translated at the period-end exchange rates, except for inventories, prepaid expenses, and property and equipment, which are translated at historical exchange rates. Statements of operations are translated at the average exchange rates during the year except for those expenses related to the balance sheet amounts, which are translated using historical exchange rates. Net gains (losses) from these foreign exchange transactions have not been material to our consolidated operating results for any of the periods presented.
For our subsidiary in Germany, foreign currency denominated assets and liabilities are translated at the period-end exchange rates, while revenue and expenses are translated at average rates prevailing during the year. Translation adjustments are reported in other comprehensive income (loss).
Revenue Recognition
We recognize revenue when persuasive evidence of an arrangement exists, delivery has occurred or services have been rendered, our price is fixed or determinable and collectibility is reasonably assured. Our standard arrangement for our domestic and international customers includes a signed purchase order or contract and no right of return of delivered products. Revenue is recognized net of any taxes collected from customers and subsequently remitted to governmental authorities.
We assess collectibility based on the creditworthiness of the customer and past transaction history. We perform periodic credit evaluations of our customers and do not require collateral from our customers. However, for many of our international customers, we require an irrevocable letter of credit to be issued by the customer before the purchase order is accepted. If we determine that collection of the invoice is not reasonably assured, we recognize the revenue at the time that collection becomes reasonably assured, which is generally upon the receipt of cash.
Generally, product revenue is generated from the sale of synchronization and timing equipment with embedded software that is incidental to product functionality. For instances where embedded software is more than incidental to product functionality, we account for the transactions in accordance with the rules applicable to software revenue recognition. Service revenue is recognized as the services are performed, provided collection of the related receivable is reasonably assured. Our sales to distributors are made under agreements allowing for returns or credits under certain circumstances. Accordingly, we defer an estimate of returns from distributors based on a historical average of distributor returns. We record commission expense both when orders are received and shipped, at which times the commission is both earned and payable.
Revenue from contracts that require development and manufacture in accordance with customer specifications and have a lengthy development period may be categorized into two types: firm fixed price and cost-plus reimbursement. Revenue is recognized under the fixed price contracts using the percentage of completion method (cost-to-cost basis), principally based upon the costs incurred relative to the total estimated costs at completion on the individual contracts. Any anticipated losses on contracts are charged to operations as soon as they are determinable. Revenue recognized under cost-plus contracts is recognized on the basis of direct and indirect costs incurred plus a negotiated profit calculated as a percentage of costs or as a performance based award fee. Revenue from long-term contracts is reviewed periodically, with adjustments recorded in the period in which the revisions are made.
60
Table of Contents
SYMMETRICOM, INC.
NOTES TO CONSOLIDATED FINANCIAL STATEMENTS—(Continued)
Unbilled receivables totaled $4.3 million as of June 27, 2010 compared to $5.1 million as of June 28, 2009. All unbilled receivables as of June 27, 2010 are expected to be collected in fiscal 2011.
Stock-Based Compensation
We account for stock-based compensation in accordance with FASB issued authoritative guidance on share-based compensation. Under this guidance, share-based compensation cost is measured at the grant date based on the fair value of the award using the black-scholes option pricing model. The use of the black-scholes option pricing model requires that we determine subjective variables including estimated term of the award and the estimated volatility in addition to other less subjective variables. The identified fair value resulting from this model is recognized as expense, net of estimated forfeitures, over the applicable vesting period of the stock award using the accelerated method.
Net Earnings (Loss) Per Share
Basic earnings (loss) per share is computed by dividing net income (loss) by the weighted average number of common shares outstanding during the period. Diluted earnings (loss) per share is calculated by dividing net income (loss) by the weighted average number of common shares outstanding and common equivalent shares from dilutive stock options and restricted stock using the treasury method, except when antidilutive.
A reconciliation of the denominator used in the calculation of basic and diluted net earnings (loss) per share is as follows:
| Year ended | ||||||||||||
| June 27, 2010 | June 28, 2009 | June 29, 2008 | ||||||||||
| (In thousands, except per share amounts) | ||||||||||||
| Numerator: |
||||||||||||
| Net income (loss) from continuing operations |
$ | 2,546 | $ | (43,806 | ) | $ | (805 | ) | ||||
| Loss from discontinued operations |
(20 | ) | (1,951 | ) | (16,942 | ) | ||||||
| Net income (loss) |
$ | 2,526 | $ | (45,757 | ) | $ | (17,747 | ) | ||||
| Shares (Denominator): |
||||||||||||
| Weighted average common shares outstanding |
43,705 | 44,167 | 45,512 | |||||||||
| Weighted average common shares outstanding subject to repurchase |
(325 | ) | (667 | ) | (1,051 | ) | ||||||
| Weighted average shares outstanding—basic |
43,380 | 43,500 | 44,461 | |||||||||
| Weighted average dilutive share equivalents from stock options |
278 | — | — | |||||||||
| Weighted average dilutive common shares subject to repurchase |
239 | — | — | |||||||||
| Weighted average shares outstanding—diluted |
43,897 | 43,500 | 44,461 | |||||||||
| Earnings (loss) per share—basic: |
||||||||||||
| Income (loss) from continuing operations |
$ | 0.06 | $ | (1.01 | ) | $ | (0.02 | ) | ||||
| Loss from discontinued operations |
— | (0.04 | ) | (0.38 | ) | |||||||
| Net income (loss) |
$ | 0.06 | $ | (1.05 | ) | $ | (0.40 | ) | ||||
| Earnings (loss) per share—diluted: |
||||||||||||
| Income (loss) from continuing operations |
$ | 0.06 | $ | (1.01 | ) | $ | (0.02 | ) | ||||
| Loss from discontinued operations |
— | (0.04 | ) | (0.38 | ) | |||||||
| Net income (loss) |
$ | 0.06 | $ | (1.05 | ) | $ | (0.40 | ) | ||||
61
Table of Contents
SYMMETRICOM, INC.
NOTES TO CONSOLIDATED FINANCIAL STATEMENTS—(Continued)
Unvested restricted stock is subject to repurchase by the Company and therefore is not included in the calculation of the weighted-average shares outstanding for basic earnings (loss) per share.
The following common stock equivalents were excluded from the net earnings (loss) per share calculation, as their effect would have been antidilutive:
| Year ended | ||||||
| June 27, 2010 | June 28, 2009 | June 29, 2008 | ||||
| (In thousands) | ||||||
| Stock options |
4,128 | 5,678 | 5,218 | |||
| Common shares subject to repurchase |
— | 667 | 1,051 | |||
| Total shares of common stock excluded from diluted net earnings (loss) per share calculation |
4,128 | 6,345 | 6,269 | |||
We accounted for our contingent convertible notes in accordance FASB issued authoritative guidance on the effect of contingently convertible debt on diluted earnings per share, which required us to include the dilutive effect of the shares of our common stock issuable upon conversion of the outstanding convertible notes in our diluted earnings per share calculation regardless of whether the market price trigger or other contingent conversion feature would have been met. Because our contingent convertible notes included a mandatory cash settlement feature for the principal payment, we applied the treasury stock method. This method results in incremental dilutive shares when the average fair value of our common stock for a reporting period exceeds the initial conversion price per share of $12.49. However, because our share price did not exceed $12.49, no shares associated with the contingent convertible notes were included in our diluted earnings per share for fiscal years 2010, 2009, and 2008. In the fourth quarter of fiscal 2010 we repurchased the remainder of our convertible notes. See Note 12—Long Term Obligations.
Note 2—Recent Accounting Pronouncements
In January 2010, the FASB issued authoritative guidance to amend the disclosure requirements related to recurring and nonrecurring fair value measurements. The guidance requires new disclosures on the transfers of assets and liabilities between Level 1 (quoted prices in active market for identical assets or liabilities) and Level 2 (significant other observable inputs) of the fair value measurement hierarchy, including the reasons and the timing of the transfers. Additionally, the guidance requires a roll forward of activities on purchases, sales, issuance, and settlements of the assets and liabilities measured using significant non-observable inputs (Level 3 fair value measurements). The guidance became effective for us in the quarter ended March 28, 2010. The adoption of this new guidance did not have a material impact on our consolidated financial statements.
In October 2009, the FASB issued authoritative guidance on revenue recognition that will become effective for us beginning June 28, 2010. Under the new guidance on arrangements that include software elements, tangible products that have software components that are essential to the functionality of the tangible product will no longer be within the scope of the software revenue recognition guidance, and software-enabled products will now be subject to other relevant revenue recognition guidance. Additionally, the FASB issued authoritative guidance on revenue arrangements with multiple deliverables that are outside the scope of the software revenue recognition guidance. Under the new guidance, when vendor specific objective evidence or third party evidence for deliverables in an arrangement cannot be determined, a best estimate of the selling price is required to separate deliverables and allocate arrangement consideration using the relative selling price method. The new guidance includes new disclosure requirements on how the application of the relative selling price method affects the timing and amount of revenue recognition. Under this guidance, we will be required to determine the relative
62
Table of Contents
SYMMETRICOM, INC.
NOTES TO CONSOLIDATED FINANCIAL STATEMENTS—(Continued)
selling price for all deliverables in a multiple element arrangement based on the hierarchy identified in the new standard. We are currently evaluating the impact this new guidance may have on our consolidated financial statements.
In June 2009, the FASB issued authoritative guidance codifying a single source of authoritative nongovernmental U.S. GAAP. This guidance does not change current U.S. GAAP, but is intended to simplify user access to all authoritative U.S. GAAP by providing all authoritative literature related to a particular topic in one place. All existing accounting standard documents will be superseded and all other accounting literature not included in the FASB Codification will be considered non-authoritative. These provisions are effective for interim and annual periods ending after September 15, 2009 and, accordingly, are currently effective for us. The adoption of this pronouncement did not have an impact on our condensed consolidated financial statements, but has impacted our financial reporting process by eliminating all references to pre-codification standards. On the effective date, the Codification superseded all then-existing non-SEC accounting and reporting standards, and all other non-grandfathered non-SEC accounting literature not included in the Codification became non-authoritative.
Note 3—Discontinued Operations
During the third quarter of fiscal 2010, we completed the sale of our video QoE business to Cheetah Technologies, L.P. (Cheetah). Cheetah acquired the assets related to the QoE product line and hired the remaining QoE employees. The total purchase price was $2.3 million, including $0.4 million held in escrow as of March 28, 2010. The escrowed funds are subject to forfeiture to satisfy indemnification and other obligations, if any, to Cheetah. The period of escrow for the $0.4 million will expire on July 1, 2011. As a result of this transaction, we recognized a gain on sale of discontinued operations of $0.9 million, net of income taxes, in fiscal 2010. This gain reflects $1.9 million in cash received in the third quarter of fiscal 2010, less transaction costs, the net carrying value of assets and liabilities transferred, and other related costs, resulting in a $1.4 million gain on sales of discontinued operations, before income taxes. During fiscal year 2010, we also recognized a loss of $1.5 million on the operating results of QoE during this period. In addition, QoE will no longer be shown as a reportable segment within continuing operations and all comparative information from prior periods has been updated to reflect this change.
Selected financial information related to discontinued operations follows:
| Year Ended | ||||||||||||
| June 27, 2010 | June 28, 2009 | June 29, 2008 | ||||||||||
| (In thousands) | ||||||||||||
| Revenue |
$ | 691 | $ | 1,085 | $ | 1,655 | ||||||
| Loss on discontinued operations |
$ | (1,454 | ) | $ | (3,184 | ) | $ | (26,367 | ) | |||
| Gain on sale of discontinued operations |
1,423 | — | — | |||||||||
| Loss before income taxes |
(31 | ) | (3,184 | ) | (26,367 | ) | ||||||
| Income tax benefit |
(11 | ) | (1,233 | ) | (9,425 | ) | ||||||
| Loss on discontinued operations, net of tax |
$ | (20 | ) | $ | (1,951 | ) | $ | (16,942 | ) | |||
63
Table of Contents
SYMMETRICOM, INC.
NOTES TO CONSOLIDATED FINANCIAL STATEMENTS—(Continued)
Note 4—Other Accrued Liabilities
Other accrued liabilities consist of the following:
| June 27, 2010 | June 28, 2009 | |||||
| (In thousands) | ||||||
| Other accrued liabilities: |
||||||
| Deferred revenue |
$ | 4,841 | $ | 3,108 | ||
| Accrued expenses |
3,292 | 4,043 | ||||
| Manufacturing sales representative commissions payable |
1,168 | 1,085 | ||||
| Accrued lease loss |
1,070 | 788 | ||||
| Income taxes payable |
135 | 786 | ||||
| Total |
$ | 10,506 | $ | 9,810 | ||
Note 5—Warranties
Changes in our accrued warranty liability are as follows:
| Year ended | ||||||||||||
| June 27, 2010 | June 28, 2009 | June 29, 2008 | ||||||||||
| (In thousands) | ||||||||||||
| Beginning balance |
$ | 3,737 | $ | 3,801 | $ | 3,374 | ||||||
| Provision for warranty for the year |
2,035 | 2,869 | 3,446 | |||||||||
| Accruals related to changes in estimate |
(478 | ) | (15 | ) | (39 | ) | ||||||
| Less: Actual warranty costs |
(2,394 | ) | (2,918 | ) | (2,980 | ) | ||||||
| Ending balance |
$ | 2,900 | $ | 3,737 | $ | 3,801 | ||||||
Note 6—Commitments
Operating Leases
We lease certain other facilities and equipment under operating lease agreements. Net rental expense charged to operations was $3.9 million in 2010, $3.3 million in 2009 and $3.3 million in 2008. Future minimum lease payments as of June 27, 2010 are as follows:
| Operating Lease | |||
| (In thousands) | |||
| For the fiscal year: |
|||
| 2011 |
$ | 5,061 | |
| 2012 |
4,591 | ||
| 2013 |
4,477 | ||
| 2014 |
4,565 | ||
| 2015 |
4,443 | ||
| Thereafter |
3,496 | ||
| Total minimum lease payments |
$ | 26,633 | |
64
Table of Contents
SYMMETRICOM, INC.
NOTES TO CONSOLIDATED FINANCIAL STATEMENTS—(Continued)
Lease loss liabilities were recorded as a result of discontinuing operations and facility consolidations related to our restructuring activities. As of June 27, 2010 and June 28, 2009, the accrued lease loss liabilities were approximately $5.9 million and $2.5 million, respectively. The balances of accrued lease loss liabilities are included in Other Accrued Liabilities (See Note 4) and Long-Term Obligations (See Note 12).
The total of minimal rentals to be received in the future under non-cancelable subleases as of June 27, 2010 was $0.9 million.
Purchase Orders
We had $19.3 million in non-cancelable purchase commitments with our suppliers as of June 27, 2010.
Note 7—Financial Instruments
We adopted FASB issued authoritative guidance on fair value measurements and disclosures on June 30, 2008 for all financial assets and liabilities and nonfinancial assets and liabilities that are recognized or disclosed at fair value in the financial statements on a recurring basis (at least annually). This guidance defines fair value, establishes a framework for measuring fair value, and expands disclosures about fair value measurements.
Guidance also defines fair value as the price that would be received upon sale of an asset or paid upon transfer of a liability in an orderly transaction between market participants at the measurement date and in the principal or most advantageous market for that asset or liability. The fair value should be calculated based on assumptions that market participants would use in pricing the asset or liability, not on assumptions specific to the entity. In addition, the fair value of liabilities should include consideration of non-performance risk including our own credit risk.
In addition to defining fair value, the above guidance expands the disclosure requirements around fair value and establishes a fair value hierarchy for valuation inputs. The hierarchy prioritizes the inputs into three levels based on the extent to which inputs used in measuring fair value are observable in the market. Each fair value measurement is reported in one of the three levels which is determined by the lowest level input that is significant to the fair value measurement in its entirety. These levels are:
| • | Level 1—inputs are based upon unadjusted quoted prices for identical instruments traded in active markets; |
| • | Level 2—inputs are based upon quoted prices for similar instruments in active markets, quoted prices for identical or similar instruments in markets that are not active, and model-based valuation techniques for which all significant assumptions are observable in the market or can be corroborated by observable market data for substantially the full term of the assets or liabilities; and |
| • | Level 3—inputs are generally unobservable and typically reflect management’s estimates of assumptions that market participants would use in pricing the asset or liability. The fair values are therefore determined using model-based techniques that include option pricing models, discounted cash flow models, and similar techniques. |
65
Table of Contents
SYMMETRICOM, INC.
NOTES TO CONSOLIDATED FINANCIAL STATEMENTS—(Continued)
Financial assets measured at fair value on a recurring basis consisted of the following types of instruments as of June 27, 2010 and June 28, 2009:
| Balance as of June 27, 2010 |
Quoted Prices in Active Markets for Identical Assets (Level 1) |
Significant
Other Observable Inputs (Level 2) | |||||||
| (In thousands) | |||||||||
| Assets: |
|||||||||
| Money market funds |
$ | 9,729 | $ | 9,729 | $ | — | |||
| Short-term investments: |
|||||||||
| Corporate debt securities |
37,264 | — | 37,264 | ||||||
| Government sponsored enterprise debt securities |
13,336 | 13,336 | — | ||||||
| Mutual funds |
3,225 | 2,500 | 725 | ||||||
| Total short-term investments |
53,825 | 15,836 | 37,989 | ||||||
| Total financial assets |
$ | 63,554 | $ | 25,565 | $ | 37,989 | |||
| Balance as of June 28, 2009 |
Quoted Prices in Active Markets for Identical Assets (Level 1) |
Significant
Other Observable Inputs (Level 2) | |||||||
| (In thousands) | |||||||||
| Assets: |
|||||||||
| Money market funds |
$ | 72,064 | $ | 72,064 | $ | — | |||
| Short-term investments: |
|||||||||
| Corporate debt securities |
19,854 | — | 19,854 | ||||||
| Government sponsored enterprise debt securities |
18,571 | 18,571 | — | ||||||
| Mutual funds |
2,312 | 1,570 | 742 | ||||||
| Total short-term investments |
40,737 | 20,141 | 20,596 | ||||||
| Total financial assets |
$ | 112,801 | $ | 92,205 | $ | 20,596 | |||
The fair values of our money market funds, government sponsored enterprise debt securities, and certain mutual funds were derived from quoted market prices as active markets for these instruments exist. The fair values of corporate debt securities and certain mutual funds were derived from non-binding market consensus prices that are corroborated by observable market data.
In fiscal 2009, we reclassified the deferred compensation plan assets from available-for-sale to trading securities in order to maintain consistency with the method in which we account for our deferred compensation obligations. As a result, all unrealized gains and losses related to the deferred compensation plan assets have been included in earnings since conversion to trading securities.
66
Table of Contents
SYMMETRICOM, INC.
NOTES TO CONSOLIDATED FINANCIAL STATEMENTS—(Continued)
The following table summarizes Symmetricom’s available-for-sale and trading securities recorded as cash and cash equivalents or short-term investments:
| Cost Basis | Gross Unrealized Gains (Losses) |
Fair Value | ||||||||||
| (In thousands) | ||||||||||||
| June 27, 2010 | ||||||||||||
| Short-term investments and money market funds |
$ | 60,265 | $ | 64 | $ | 60,329 | ||||||
| Less amounts classified as cash equivalents |
(9,729 | ) | — | (9,729 | ) | |||||||
| Deferred compensation plan assets |
2,854 | — | 3,225 | |||||||||
| Total short-term investments |
$ | 53,390 | $ | 64 | $ | 53,825 | ||||||
| June 28, 2009 | ||||||||||||
| Short-term investments and money market funds |
$ | 92,270 | $ | (273 | ) | $ | 91,997 | |||||
| Less amounts classified as cash equivalents |
(53,572 | ) | — | (53,572 | ) | |||||||
| Deferred compensation plan assets |
4,131 | — | 2,312 | |||||||||
| Total short-term investments |
$ | 42,829 | $ | (273 | ) | $ | 40,737 | |||||
Loss on Investments
In the fourth quarter of fiscal 2007, we purchased asset-backed commercial paper with a $7.8 million par value maturing on March 13, 2008, and we classified this as a short-term investment. At the time of purchase, the investment’s portfolio consisted primarily of triple-A rated assets, with sub-prime loan assets making up approximately 23% of the investment. Subsequently, the structured investment vehicle (“SIV”) issuing the commercial paper was declared insolvent and entered receivership. On January 8, 2008, our investment manager advised us that the fair value of this investment had declined, and that the impairment loss should be considered other-than-temporary in accordance with discussions with the receiver as well as potential options that were expected to be made available to senior debt holders including Symmetricom. Our investment manager determined the fair value of the investment using pricing levels of the underlying portfolio by three different broker/dealers. Management then made an independent valuation assessment of similar securities using the ABX index (which is an index to track the performance of mortgage-backed securities) to confirm that the valuation results from our investment manager were reasonable. Based on this assessment of fair value, Symmetricom recognized a loss of $3.2 million related to this investment during fiscal year 2008. After the receivers sold the SIV to an investment bank, we received a cash distribution of $1.4 million, relating to the cash portion of the fund, in the fourth quarter of fiscal 2008. In the first quarter of fiscal 2009, the investment bank offered investors the option of cashing out of the fund or reinvesting in a new investment vehicle. We elected to cash out and received a final capital distribution of $3.3 million in the first quarter of fiscal 2009. As a result of the final settlement with this investment, including a recovery on previously recognized losses, we recognized a $0.1 million gain in the first quarter of fiscal 2009.
In the first quarter of fiscal 2009, we determined that three corporate debt instruments, the market values of which had declined, were other than temporarily impaired. We made this determination based on the uncertainty and volatility of the market, particularly since these debt instruments were related to financial institutions, the failure of several other large financial institutions and the continued downgrades from credit rating agencies. As a result of this assessment, we recognized a $0.6 million other than temporary loss in the first quarter of fiscal 2009. This amount was partially offset by the previously mentioned $0.1 million gain, resulting in net loss on short-term investments of $0.5 million for the first quarter of fiscal 2009.
67
Table of Contents
SYMMETRICOM, INC.
NOTES TO CONSOLIDATED FINANCIAL STATEMENTS—(Continued)
In the second quarter of fiscal 2009, we determined that mutual funds related to our deferred compensation plan, whose market values had declined, were other than temporarily impaired. We made this determination based on the overall decline in the value of the mutual funds and the uncertainty as to whether they would recover. As a result of this assessment, we recognized a $0.9 million other than temporary loss in the second quarter of fiscal 2009.
Note 8—Goodwill and Intangible Assets
Goodwill
Changes in the carrying value of goodwill for the years ended June 27, 2010 and June 28, 2009 are as follows for our reportable segments where applicable:
| Communications Business Unit |
Government Business Unit |
Total | ||||||||||
| (In thousands) | ||||||||||||
| Balances as of June 29, 2008 |
$ | 28,032 | $ | 20,112 | $ | 48,144 | ||||||
| Impairment of goodwill |
(28,032 | ) | (20,112 | ) | (48,144 | ) | ||||||
| Balances as of June 28, 2009 and June 27, 2010 |
$ | — | $ | — | $ | — | ||||||
During the third quarter of fiscal 2009, due to a decline in our stock price and a lowered business outlook, we determined that indicators of a potential goodwill impairment existed. Accordingly, we completed a step one goodwill impairment test to determined whether the decline in market capitalization and business outlook revisions indicated that the carrying value of our reporting units were in excess of fair value.
A step one goodwill impairment test compares the fair value of a reporting unit to its carrying value to determine if a step two test is required. We estimate our reporting unit’s fair values using a weighted average of values determined under an income approach and a market approach. We weighed these approaches at approximately 67% and 33% for the income approach and the market approach, respectively. We applied a lower weighting to the market approach as there are a limited number of highly comparable companies, which are a key component of the market approach. Under the income approach, fair value is determined by discounting estimated future cash flows. The income approach is dependent on several significant assumptions, including our earnings projections and our cost of capital. Under the market approach, we estimate the fair value of each reporting unit based on pricing multiples of certain financial parameters observed in comparable companies.
Based on the results of our step one test, we determined that the fair values of the Communications and Government reporting units were less than their respective carrying amounts, and therefore the second step of the goodwill impairment test was performed to measure the amount of impairment loss for the each reporting unit. As a result, we recorded a goodwill impairment charge of approximately $48.1 million in the third quarter of fiscal 2009, consisting of $28.0 million related to the Communications reporting segment and $20.1 million related to the Government reporting segment.
68
Table of Contents
SYMMETRICOM, INC.
NOTES TO CONSOLIDATED FINANCIAL STATEMENTS—(Continued)
Intangible Assets, net
Intangible assets are recorded at cost, less accumulated amortization. Other intangible assets as of June 27, 2010 and June 28, 2009 consist of:
| Gross Carrying Amount |
Accumulated Amortization |
Net Intangible Assets | ||||||||
| (in thousands) | ||||||||||
| Purchased technology |
$ | 24,357 | $ | (20,861 | ) | $ | 3,496 | |||
| Customer lists and trademarks |
7,025 | (5,213 | ) | 1,812 | ||||||
| Total as of June 28, 2009 |
$ | 31,382 | $ | (26,074 | ) | $ | 5,308 | |||
| Purchased technology |
$ | 24,357 | $ | (22,150 | ) | $ | 2,207 | |||
| Customer lists and trademarks |
7,025 | (5,487 | ) | 1,538 | ||||||
| Total as of June 27, 2010 |
$ | 31,382 | $ | (27,637 | ) | $ | 3,745 | |||
The estimated future amortization expense is as follows:
| (in thousands) | |||
| Fiscal year: |
|||
| 2011 |
$ | 1,313 | |
| 2012 |
726 | ||
| 2013 |
502 | ||
| 2014 |
502 | ||
| 2015 |
232 | ||
| Thereafter |
470 | ||
| Total amortization |
$ | 3,745 | |
Intangible asset amortization expense for fiscal 2010, 2009, and 2008 was approximately $1.6 million, $1.9 million, and $4.3 million, respectively.
69
Table of Contents
SYMMETRICOM, INC.
NOTES TO CONSOLIDATED FINANCIAL STATEMENTS—(Continued)
Note 9—Income Taxes
The provision of federal, state and foreign income tax expense on income (loss) from continuing operations consists of the following:
| Year ended | ||||||||||||
| June 27, 2010 |
June 28, 2009 |
June 29, 2008 |
||||||||||
| (In thousands) | ||||||||||||
| Income (loss) from continuing operations before income taxes: |
||||||||||||
| Domestic |
$ | 1,243 | $ | (44,218 | ) | $ | 289 | |||||
| Foreign |
800 | 1,000 | 800 | |||||||||
| Total |
$ | 2,043 | $ | (43,218 | ) | $ | 1,089 | |||||
| Provision for income taxes: |
||||||||||||
| Current: |
||||||||||||
| Federal |
$ | 106 | $ | (348 | ) | $ | (779 | ) | ||||
| State |
105 | 130 | 117 | |||||||||
| Puerto Rico |
(257 | ) | 593 | 347 | ||||||||
| Foreign |
297 | 667 | 210 | |||||||||
| Total |
251 | 1,042 | (105 | ) | ||||||||
| Deferred: |
||||||||||||
| Federal |
(92 | ) | (638 | ) | 1,942 | |||||||
| State |
(586 | ) | 37 | (76 | ) | |||||||
| Puerto Rico |
(76 | ) | 58 | (15 | ) | |||||||
| Foreign |
— | 89 | 148 | |||||||||
| Total |
(754 | ) | (454 | ) | 1,999 | |||||||
| Total income tax provision (benefit) on continuing operations |
$ | (503 | ) | $ | 588 | $ | 1,894 | |||||
The tax provision (benefit) attributable to continuing operations and discontinued operations, included in the consolidated statements of operations, is as follows:
| Year ended, | ||||||||||||
| June 27, 2010 |
June 28, 2009 |
June 29, 2008 |
||||||||||
| (In thousands) | ||||||||||||
| Tax provision (benefit) from: |
||||||||||||
| Continuing operations |
$ | (503 | ) | $ | 588 | $ | 1,894 | |||||
| Discontinued operations |
(11 | ) | (1,233 | ) | (9,425 | ) | ||||||
| Total provision (benefit) |
$ | (514 | ) | $ | (645 | ) | $ | (7,531 | ) | |||
70
Table of Contents
SYMMETRICOM, INC.
NOTES TO CONSOLIDATED FINANCIAL STATEMENTS—(Continued)
The effective income tax rate differs from the federal statutory income tax rate as follows:
| Year ended | |||||||||
| June 27, 2010 |
June 28, 2009 |
June 29, 2008 |
|||||||
| Federal statutory income tax (benefit) expense rate |
35.0 | % | (35.0 | )% | 35.0 | % | |||
| Puerto Rico taxes |
(16.3 | ) | 1.5 | 30.5 | |||||
| State income taxes, net of federal benefit |
(26.2 | ) | 0.3 | — | |||||
| Foreign taxes |
— | — | 29.5 | ||||||
| Capital losses not benefited |
— | — | 95.8 | ||||||
| Goodwill |
— | 35.3 | — | ||||||
| Federal research and development credit |
(16.2 | ) | (1.6 | ) | (15.6 | ) | |||
| Other |
(0.9 | ) | 0.9 | (1.3 | ) | ||||
| Effective income tax rate on continuing operations |
(24.6 | )% | 1.4 | % | 173.9 | % | |||
The principal components of deferred tax assets and liabilities are as follows:
| June 27, 2010 |
June 28, 2009 |
|||||||
| (In thousands) | ||||||||
| Deferred tax assets: |
||||||||
| Net operating loss carryforwards |
$ | 9,361 | $ | 10,314 | ||||
| Tax credit carryforwards |
15,469 | 14,921 | ||||||
| Reserves and accruals |
8,615 | 8,509 | ||||||
| Depreciation and amortization |
14,597 | 14,459 | ||||||
| 48,042 | 48,203 | |||||||
| Valuation allowance |
(3,974 | ) | (4,337 | ) | ||||
| Total deferred tax assets |
44,068 | 43,866 | ||||||
| Deferred tax liabilities— |
||||||||
| Unremitted foreign earnings |
334 | 334 | ||||||
| Net deferred tax assets |
$ | 43,734 | $ | 43,532 | ||||
Net deferred tax assets are comprised of the following:
| June 27, 2010 |
June 28, 2009 |
|||||||
| (In thousands) | ||||||||
| Current assets |
$ | 8,146 | $ | 8,334 | ||||
| Non-current assets |
35,922 | 35,532 | ||||||
| Non-current liabilities |
(334 | ) | (334 | ) | ||||
| Net deferred tax assets |
$ | 43,734 | $ | 43,532 | ||||
As of June 27, 2010, for federal income tax purposes, we had regular net operating loss carryforwards of approximately $31.3 million which will expire in years 2023 through 2025. We had California regular net operating loss carryforwards of approximately $5.4 million which will expire in years 2014 through 2019.
Also, we had federal research and development tax credit carryforwards of approximately $7.0 million that will expire in the years 2011 through 2030, alternative minimum tax credit carryforwards of approximately $3.9
71
Table of Contents
SYMMETRICOM, INC.
NOTES TO CONSOLIDATED FINANCIAL STATEMENTS—(Continued)
million that have no expiration date, and approximately $1.2 million of foreign tax credits that will expire in 2017 through 2020. Additionally, for state income tax purposes, we had research and development tax credit carryforwards of approximately $4.0 million that have no expiration date.
We have provided a valuation allowance for certain deferred tax assets because we have determined that it is more likely than not that we will not have sufficient taxable income to realize these tax assets. At June 27, 2010, $2.1 million of the valuation allowance was attributable to the tax benefit of potentially expiring tax credits stemming from stock option transactions, which will be credited to common stock if realized rather than as a reduction of the tax provision. We have $0.2 million of the valuation allowance attributable to other potentially expiring tax credits. Also, $1.6 million of the valuation allowance was attributable to fiscal 2008 and fiscal 2009 short-term investment losses incurred which have a limited carryforward period. The valuation allowance decreased by $0.4 million in fiscal 2010 due to the expiration of the statute of limitations on certain federal research and development credits which had a full valuation allowance.
As of June 27, 2010, we had $15.4 million of unrecognized tax benefits, of which $15.4 million, if recognized, would impact our effective tax rate. We do not anticipate any material change in the total amount of unrecognized tax benefits to occur within the next twelve months. Our policy is to include material interest and penalties related to unrecognized tax benefits in income tax expense. As of June 28, 2009 and June 27, 2010, we had no accrued interest or penalties on our consolidated balance sheet.
The aggregate changes in the balance of unrecognized tax benefits were as follows:
| Year ended | ||||||||||
| June 27, 2010 |
June 28, 2009 |
June 29, 2008 | ||||||||
| (in millions) | ||||||||||
| Beginning balance |
$ | 14.3 | $ | 14.3 | $ | 13.9 | ||||
| Additions based on tax position related to the current year |
0.1 | 0.2 | 0.4 | |||||||
| Additions for tax positions of prior years |
1.0 | 0.1 | — | |||||||
| Settlements |
— | (0.3 | ) | — | ||||||
| Ending balance |
$ | 15.4 | $ | 14.3 | $ | 14.3 | ||||
We are subject to income tax in the United States and a number of state and foreign jurisdictions. The tax years ended June 2006 forward remain open to examination by major taxing jurisdictions in which we operate which include the United States, The State of California, Puerto Rico and Germany. We are not currently under examination in any major tax jurisdiction.
Note 10—Contingencies
Former Texas Facility Environmental Cleanup
We formerly leased a tract of land in Texas for our operations. Those operations involved the use of solvents and, at the end of the lease, we remediated an area where the solvents had been deposited on the ground and obtained regulatory approval for that remedial activity. In 1996, an environmental investigation of the property detected those same contaminants in groundwater in excess of then current regulatory standards. The groundwater contamination has migrated to some adjacent properties. We have entered into the Texas Natural Resource Conservation Commission’s Voluntary Cleanup Program (the “Voluntary Cleanup Program”) to obtain regulatory approval for closure of this site and a release from liability to the State of Texas for subsequent
72
Table of Contents
SYMMETRICOM, INC.
NOTES TO CONSOLIDATED FINANCIAL STATEMENTS—(Continued)
landowners and lenders. We have notified adjacent property owners affected by the contamination of participation in the Voluntary Cleanup Program. On May 20, 2004, we received a demand from the owner of several adjacent lots for damages in the amount of $1.3 million, as well as seeking an indemnity for the contamination and a promise to remediate the contamination. On March 14, 2006, the adjacent property owner filed suit in Probate Court No. 1, Travis County, Texas (Anna B. Miller, Individually and as Executrix of the Estate of Robert L. Miller, et al. vs. Austron, Inc., et al.), seeking damages. Symmetricom has not yet been served in this matter, but we intend to defend this lawsuit vigorously. We are continuing to work on the remediation of the formerly leased site as well as the adjacent properties, and have also taken steps to begin work on the Miller property. As of June 27, 2010, we had an accrual of $85,000 for remediation costs and other ongoing monitoring costs.
Shipments of Product with Lead-free Solder
In the fourth quarter of fiscal 2007 until the third quarter of fiscal 2008, we inadvertently shipped certain products that included lead-free solder in the product backplanes to two customers whose contracts specified that the products would be made with lead solder. As of June 28, 2009, we have received a waiver from one customer to use lead-free solder but not the other. The total sales value of product shipped with lead-free solder to the customer that has not as yet granted us the waiver is $1.2 million. Management believes that this customer will not request that the parts be replaced and that our existing warranty accrual is adequate to cover any potential product failures. Also, since March 2008, new product shipments to this customer include lead solder.
Other
Under the indemnification provisions of our standard sales contracts, we agree to defend the customer against third party claims asserting infringement of certain intellectual property rights, which may include patents, copyrights, trademarks or trade secrets, and to pay any judgments entered on such claims against the reseller/customer. The exposure to us under these indemnification provisions is generally limited to the total amount paid by the customer under the agreement. However, certain agreements include indemnification provisions that could potentially expose us to losses in excess of the amount received under the agreement. To date, there have been no claims under such indemnification provisions. We believe the estimated fair value of these indemnification agreements is not material.
We are also a party to certain other claims in the normal course of our operations. While the results of these claims cannot be predicted with any certainty, we believe that the final outcome of these matters will not have a material adverse effect on our consolidated financial position and results of operations.
Note 11—Related Party Transactions
In March 1998, we loaned an officer $500,000 in the form of an interest-free full-recourse promissory note, secured by a deed of trust for the officer’s personal residence. In fiscal 2008, the entire principal balance was repaid.
73
Table of Contents
SYMMETRICOM, INC.
NOTES TO CONSOLIDATED FINANCIAL STATEMENTS—(Continued)
Note 12—Long-Term Obligations
| June 27, 2010 |
June 28, 2009 | |||||
| (In thousands) | ||||||
| Long-term obligations: |
||||||
| Lease loss accrual, net |
$ | 4,784 | $ | 1,749 | ||
| Deferred revenue |
1,919 | 2,125 | ||||
| Rent accrual |
1,066 | 966 | ||||
| Income tax |
300 | 300 | ||||
| Post-retirement benefits |
227 | 228 | ||||
| Convertible subordinated notes |
— | 46,401 | ||||
| Total |
$ | 8,296 | $ | 51,769 | ||
Convertible Subordinated Notes
On June 8, 2005, we sold $120.0 million of contingent convertible subordinated notes (the “Notes”), which were to mature on June 15, 2025 and paid interest at the rate of 3.25% per annum. Interest on the Notes was payable semi-annually in June and December of each year beginning on December 15, 2005. The Notes are unsecured obligations and were subordinated in right of payment to all of our existing and future senior debt. The Notes were structurally subordinated to all indebtedness and liabilities of our subsidiaries.
The Notes were convertible, at the holder’s option, prior to the maturity date into cash and, if applicable, shares of our common stock in the following circumstances:
| • | Prior to June 15, 2023, if the common stock price for at least 20 trading days in the period of 30 consecutive days ending on the last trading day of the calendar quarter preceding the quarter in which the conversion occurs was more than 125% of the conversion price of the Notes in effect on that 30th trading day; |
| • | On or after June 15, 2023, at all times on or after any date on which the common stock price was more than 125% of the then current conversion price; |
| • | During the five consecutive business-day period following any five consecutive trading-day period in which the trading price for the Notes for each such trading day was less than 95% of the average of the sale price of our common stock during such five trading-day period multiplied by the then current conversion rate; |
| • | If we had called the particular Notes for redemption and the redemption had not yet occurred; or |
| • | Upon the occurrence of specified corporate transactions. |
Holders could convert any outstanding Notes into cash and, if applicable, shares of our common stock at an initial conversion price per share of $12.49, which was determined based on the reported closing price of our common stock of $9.91 per share on June 2, 2005.
Also, on or after June 20, 2012, we could redeem some or all of the Notes at any time or from time to time at a redemption price of 100% of the principal amount of the Notes, plus accrued and unpaid interest (including liquidated damages, if any) up to but not including the date of redemption, payable in cash. Holders could require us to repurchase all or a portion of their Notes on June 15, 2012, 2015 and 2020 or at any date in the event of
74
Table of Contents
SYMMETRICOM, INC.
NOTES TO CONSOLIDATED FINANCIAL STATEMENTS—(Continued)
certain change of control events related to us for a repurchase price equal to 100% of the principal amount of the Notes, plus accrued and unpaid interest (including liquidated damages, if any) up to but not including the date of repurchase, payable in cash.
Convertible Subordinated Notes—Redemption—Fiscal 2009
On May 7, 2008, we received a notice of acceleration from the trustee under the indenture governing the Notes. The notice stated that our failure to file our Quarterly Report on Form 10-Q for the quarter ended December 30, 2007 violated certain provisions of the indenture. The acceleration letter declared that the principal amount outstanding under the Notes, together with any accrued and unpaid interest, and fees and expenses, was immediately due and payable. This notice of acceleration related to the trustee’s and certain bondholders’ previous notice received by the Company on or about March 3, 2008 stating that our failure to file our Quarterly Report on Form 10-Q for the quarter ended December 30, 2007 with the Securities and Exchange Commission (“SEC”) violated provisions of the indenture.
On June 17, 2008, we filed our Form 10-Q for the quarter ended December 30, 2007 and our Form 10-Q for the quarter ended March 30, 2008, as well as other filings related to our restatement of financial results for fiscal years and interim periods from June 30, 2002 to July 1, 2007 and for the first quarter of fiscal 2008 ended September 30, 2007.
On June 30, 2008, we offered to purchase for cash, on a pro rata basis, $63.1 million aggregate principal amount of the Notes, at a purchase price equal to $990 per $1,000 of the principal amount of the Notes, plus accrued and unpaid interest. The tender offer cap was equal to 52.6% of the $120.0 million aggregate principal amount outstanding. As of July 30, 2008, pursuant to the offer, Symmetricom accepted for payment $63.1 million aggregate principal amount of the Notes. The aggregate purchase price for the Notes surrendered was approximately $62.5 million, which included interest of $0.3 million. After the purchase pursuant to the offer, approximately $56.9 million aggregate principal amount of the Notes remained outstanding. In connection with the completion of the tender offer, the holder of a majority of the outstanding notes prior to the offer waived certain defaults alleged to have occurred under the indenture and rescinded the acceleration notice received by Symmetricom on May 7, 2008.
As a result of the partial redemption of the Notes in the first quarter of fiscal 2009, we recognized a pre-tax loss of $5.6 million, which represents the difference between the carrying value of the liability component of the redeemed amount and its fair value at the date of redemption in the first quarter of fiscal 2009.
New Accounting for Convertible Subordinated Notes—Fiscal 2010
Effective June 29, 2009, we adopted new authoritative guidance on accounting for our Notes. This guidance applies to certain convertible debt instruments that may be settled in cash or other assets, or partially in cash, upon conversion and is required to be applied retrospectively. The adoption impacted the accounting for the Notes by requiring the initial proceeds to be allocated between a liability and an equity component based on the fair value of the liability component as of the issuance date. The fair value of the liability component of the Notes was valued using the average value of the bond portion using the following two valuation approaches:
| • | Binomial Lattice Approach |
| • | Discounted Cash Flow Analysis |
The key inputs used in the discounted cash flow analysis included the estimated non-convertible borrowing rate as of June 8, 2005—the date the senior subordinated convertible notes were issued, the amount and timing of cash flows, and the expected life of seven years.
75
Table of Contents
SYMMETRICOM, INC.
NOTES TO CONSOLIDATED FINANCIAL STATEMENTS—(Continued)
Based on this valuation analysis, we determined that the initial liability component of the Notes was valued at $77.0 million, with the equity component representing the residual amount of the Notes proceeds. As a result, for fiscal 2005, we retrospectively recorded $43.0 million as a component of equity and a corresponding debt discount as of the date of issuance, and a deferred tax liability of $15.9 million.
In addition, we allocated $0.9 million, net of tax, of the total issuance costs of $4.0 million to the equity component of the Notes and the remaining $2.6 million of the issuance costs remained classified as long-term other assets. The issuance costs were allocated pro rata based on the relative carrying amounts of the liability and equity components. The debt discount and the issuance costs allocated to the liability component are amortized using the effective interest method as additional interest expense over a seven-year period ending June 2012 at which point the Notes may be redeemed by the holders or by us. The equity component of the issuance costs of $1.4 million is included in common stock as additional paid-in-capital.
The adoption of this guidance had no impact on total operating, investing, or financing cash flows in the prior periods’ condensed consolidated statements of cash flows. Adjustments to our tax provision were also recorded to reflect the impact of the foregoing adjustments.
The financial statement line items for the years ended June 28, 2009 and June 29, 2008 that were impacted by the adoption of this guidance are detailed in the tables below:
Fiscal 2009
| As of June 28, 2009 | ||||||||||||
| As Previously Reported |
Adjustments | As Adjusted |
||||||||||
| (in thousands) | ||||||||||||
| Consolidated Balance Sheet Data: |
||||||||||||
| Deferred taxes and other assets |
$ | 40,486 | $ | (4,055 | ) | $ | 36,431 | |||||
| Total assets |
276,442 | (4,055 | ) | 272,387 | ||||||||
| Long-term obligations |
62,248 | (10,479 | ) | 51,769 | ||||||||
| Total liabilities |
103,338 | (10,479 | ) | 92,859 | ||||||||
| Common stock |
179,633 | 20,519 | 200,152 | |||||||||
| Accumulated deficit |
(6,673 | ) | (14,095 | ) | (20,768 | ) | ||||||
| Stockholders’ equity |
173,104 | 6,424 | 179,528 | |||||||||
| Total liabilities and stockholders’ equity |
276,442 | (4,055 | ) | 272,387 | ||||||||
76
Table of Contents
SYMMETRICOM, INC.
NOTES TO CONSOLIDATED FINANCIAL STATEMENTS—(Continued)
| Year Ended June 28, 2009 | ||||||||||||
| As Previously Reported(1) |
Adjustments | As Adjusted |
||||||||||
| (In thousands, except per share amounts) |
||||||||||||
| Consolidated Statement of Operations Data: |
||||||||||||
| Loss on repayment of convertible notes, net |
$ | (522 | ) | $ | (5,101 | ) | $ | (5,623 | ) | |||
| Interest expense |
(2,352 | ) | (2,969 | ) | (5,321 | ) | ||||||
| Loss from continuing operations before taxes |
(35,147 | ) | (8,071 | ) | (43,218 | ) | ||||||
| Income tax provision |
3,573 | (2,985 | ) | 588 | ||||||||
| Loss from continuing operations |
(38,720 | ) | (5,086 | ) | (43,806 | ) | ||||||
| Net loss |
(40,671 | ) | (5,086 | ) | (45,757 | ) | ||||||
| Earnings per share-basic: |
||||||||||||
| Loss from continuing operations |
$ | (0.89 | ) | $ | (1.01 | ) | ||||||
| Net loss |
$ | (0.93 | ) | $ | (1.05 | ) | ||||||
| Weighted average shares outstanding-basic |
43,500 | 43,500 | ||||||||||
| Earnings per share-diluted: |
||||||||||||
| Loss from continuing operations |
$ | (0.89 | ) | $ | (1.01 | ) | ||||||
| Net loss |
$ | (0.93 | ) | $ | (1.05 | ) | ||||||
| Weighted average shares outstanding-diluted |
43,500 | 43,500 | ||||||||||
| (1) | Adjusted for the impact of discontinued operations. See Note 3. |
| Year Ended June 28, 2009 | ||||||||||||
| As Previously Reported |
Adjustments | As Adjusted |
||||||||||
| (In thousands) | ||||||||||||
| Consolidated Statement of Cash Flows Data: |
||||||||||||
| Net loss |
$ | (40,671 | ) | $ | (5,086 | ) | $ | (45,757 | ) | |||
| Deferred income taxes |
420 | (2,985 | ) | (2,565 | ) | |||||||
| Non-cash interest expense |
— | 3,075 | 3,075 | |||||||||
| Loss on repayment of convertible notes |
522 | 5,101 | 5,623 | |||||||||
| Prepaids and other assets |
(1,155 | ) | (105 | ) | (1,260 | ) | ||||||
| Net cash provided by operating activities |
21,681 | — | 21,681 | |||||||||
Fiscal 2008
| As of June 29, 2008 | ||||||||||
| As Previously Reported |
Adjustments | As Adjusted | ||||||||
| (in thousands) | ||||||||||
| Consolidated Balance Sheet Data: |
||||||||||
| Common stock |
$ | 182,201 | $ | 26,201 | $ | 208,402 | ||||
| Retained earnings (deficit) |
33,998 | (9,009 | ) | 24,989 | ||||||
| Stockholders’ equity |
216,139 | 17,192 | 233,331 | |||||||
77
Table of Contents
SYMMETRICOM, INC.
NOTES TO CONSOLIDATED FINANCIAL STATEMENTS—(Continued)
| Year Ended June 29, 2008 | ||||||||||||
| As Previously Reported(1) |
Adjustments | As Adjusted |
||||||||||
| (In thousands, except per share amounts) |
||||||||||||
| Consolidated Statement of Operations Data: |
||||||||||||
| Loss on repayment of convertible notes, net |
$ | — | $ | — | $ | — | ||||||
| Interest expense |
(4,747 | ) | (5,206 | ) | (9,953 | ) | ||||||
| Loss from continuing operations before taxes |
6,295 | (5,206 | ) | 1,089 | ||||||||
| Income tax provision |
3,821 | (1,927 | ) | 1,894 | ||||||||
| Income (loss) from continuing operations |
2,474 | (3,279 | ) | (805 | ) | |||||||
| Net loss |
(14,468 | ) | (3,279 | ) | (17,747 | ) | ||||||
| Earnings per share-basic: |
||||||||||||
| Income (loss) from continuing operations |
$ | 0.06 | $ | (0.02 | ) | |||||||
| Net loss |
$ | (0.33 | ) | $ | (0.40 | ) | ||||||
| Weighted average shares outstanding-basic |
44,461 | 44,461 | ||||||||||
| Earnings per share-diluted: |
||||||||||||
| Income (loss) from continuing operations |
$ | 0.06 | $ | (0.02 | ) | |||||||
| Net loss |
$ | (0.33 | ) | $ | (0.40 | ) | ||||||
| Weighted average shares outstanding-diluted |
44,461 | 44,461 | ||||||||||
| (1) | Adjusted for the impact of discontinued operations. See Note 3. |
| Year Ended June 29, 2008 | ||||||||||||
| As Previously Reported |
Adjustments | As Adjusted |
||||||||||
| (In thousands) | ||||||||||||
| Consolidated Statement of Cash Flows Data: |
||||||||||||
| Net loss |
$ | (14,468 | ) | $ | (3,279 | ) | $ | (17,747 | ) | |||
| Deferred income taxes |
(6,567 | ) | (1,927 | ) | (8,494 | ) | ||||||
| Non-cash interest expense |
— | 5,411 | 5,411 | |||||||||
| Loss on repayment of convertible notes |
— | — | — | |||||||||
| Prepaids and other assets |
1,267 | (205 | ) | 1,062 | ||||||||
| Net cash provided by operating activities |
12,187 | — | 12,187 | |||||||||
Fiscal 2007
| As of July 1, 2007 | ||||||||||
| As Previously Reported |
Adjustments | As Adjusted | ||||||||
| (in thousands) | ||||||||||
| Consolidated Balance Sheet Data: |
||||||||||
| Common stock |
$ | 187,070 | $ | 26,201 | $ | 213,271 | ||||
| Retained earnings (deficit) |
48,863 | (5,730 | ) | 43,133 | ||||||
| Stockholders’ equity |
236,336 | 20,471 | 256,807 | |||||||
78
Table of Contents
SYMMETRICOM, INC.
NOTES TO CONSOLIDATED FINANCIAL STATEMENTS—(Continued)
As of June 28, 2009, the long-term debt and equity component (recorded in Common Stock) consisted of the following:
| June 28, 2009 | ||||
| (In thousands) | ||||
| Convertible subordinated notes: |
||||
| Principal amount |
$ | 56,880 | ||
| Unamortized discount |
(10,479 | ) | ||
| Net carrying amount |
$ | 46,401 | ||
| Equity component, net of income tax |
$ | 21,421 | ||
Upon adoption, interest expense increased on our Notes by adding a non-cash component to amortize the debt discount calculated based on the difference between the cash coupon rate (3.25% per year) of the Notes and the effective interest rate on the debt borrowing (10.69% per year). For the year ended June 27, 2010, the total interest expense relating to our Notes was $4.7 million, including $1.9 million related to the contractual interest coupon and $2.8 million related to amortization of the discount on the liability component. For the year ended June 28, 2009, the total interest expense relating to our Notes was $5.3 million, including $2.2 million related to the contractual interest coupon and $3.1 million related to amortization of the discount on the liability component. For the year ended June 29, 2008, the total interest expense relating to our Notes was $9.3 million, including $3.9 million related to the contractual interest coupon and $5.4 million related to amortization of the discount on the liability component.
Convertible Subordinated Notes—Redemption—Fiscal 2010
During the fourth quarter of fiscal 2010, we purchased all remaining $56.9 million aggregate principal amount of our Notes in privately negotiated transactions, for a purchase price of $57.7 million, representing the par value principal amount of the Notes plus accrued and unpaid interest. The purchased Notes were retired and cancelled.
As a result of the full redemption of the Notes in the fourth quarter of fiscal 2010, we recognized a pre-tax loss of $7.0 million along with the write-off of the unamortized bond issuance costs, which represents the difference between the carrying value of the liability component of the redeemed amount and its fair value at the date of redemption in the fourth quarter of fiscal 2010.
Note 13—Benefit Plans
401(k) Plan
The Company has a 401(k) plan (the “Plan”) that allows eligible U.S. and Puerto Rico employees to contribute up to 50 percent of their annual compensation to the Plan, subject to certain limitations. The employees’ funds can be directly invested in shares of the Company’s common stock, at the election of each employee. Each employee directs the investment of the funds across a series of mutual funds. Effective in fiscal 2004, Symmetricom matched up to $0.50 per $1.00 deferred up to 3% of eligible compensation. An additional match of $1.00 per $1.00 deferred up to 1% of eligible compensation will be made based upon achievement of company profit performance goals. Employee contributions vest immediately. Employer matching contributions vest ratably over three years. Symmetricom made matching contribution payments of $0.7 million in each fiscal year for 2010, 2009, and 2008 respectively.
79
Table of Contents
SYMMETRICOM, INC.
NOTES TO CONSOLIDATED FINANCIAL STATEMENTS—(Continued)
Deferred Compensation Plan
The Company has a deferred compensation plan that allows outside directors and certain U.S. employees to contribute up to 100% of their compensation, provided that their contribution does not reduce their salary to an amount that is less than the amount necessary to pay applicable employment taxes and other withholding obligations. The Board of Directors is authorized to make discretionary contributions to the accounts of participants. No discretionary contributions were made in fiscal 2010, 2009 and 2008.
Note 14—Stockholders’ Equity
Stock Options and Awards
Symmetricom has equity benefit plans under which employees, directors and consultants may be granted non-qualified and incentive options to purchase shares of our common stock and restricted stock. One of these plans was amended in fiscal 2003 to effectively provide that restricted stock could be granted and repurchased for no cash purchase price. Stock appreciation rights may also be granted under this plan; however, none have been granted to date. All options have been granted at the fair market value of our common stock on the date of grant and generally vest over three or four years.
For October 2008 our shareholders approved an update to the 2006 Incentive Award Plan that included an additional 5.5 million shares for future issuance. For the year ended June 27, 2010, we granted non performance-based options to purchase 2.7 million shares of Symmetricom’s common stock, and awarded 127,000 shares of restricted stock. We did not grant any performance-based options during fiscal year 2010. Our right to repurchase restricted shares generally lapses over the same three or four-year term as the vesting period applicable to the stock options. We received $2.0 million from the exercise of stock options during the year ended June 27, 2010.
In the second quarter of fiscal 2009 we changed the contractual life of future option grants from five years to seven years.
We recorded stock-based compensation expense of $3.7 million in fiscal 2010, $3.3 million in fiscal 2009, and $5.0 million in fiscal 2008 respectively. The estimated future annual forfeiture rate used to record stock-based compensation expense was 8%, 10%, and 6% for fiscal 2010, 2009, and 2008, respectively. At June 27, 2010, the total future compensation cost related to unvested stock-based awards granted to employees, directors and consultants under the Company’s stock option plans was approximately $4.2 million, net of estimated forfeitures of $1.0 million. This cost will be amortized on an accelerated basis over a period of approximately 1.3 years and will be adjusted for subsequent changes in estimated forfeitures.
The following table shows total stock-based compensation expense included in the consolidated statements of operations:
| Year ended | |||||||||
| June 27, 2010 |
June 28, 2009 |
June 29, 2008 | |||||||
| (In thousands) | |||||||||
| Cost of sales |
$ | 802 | $ | 630 | $ | 823 | |||
| Research and development |
758 | 627 | 1,446 | ||||||
| Selling, general and administrative |
2,154 | 2,035 | 2,686 | ||||||
| Total |
$ | 3,714 | $ | 3,292 | $ | 4,955 | |||
80
Table of Contents
SYMMETRICOM, INC.
NOTES TO CONSOLIDATED FINANCIAL STATEMENTS—(Continued)
Stock Options
The following table details stock option and award activity for fiscal years 2010, 2009 and 2008:
| Non Performance- based Options Outstanding |
Performance-based Options Outstanding |
Restricted Stock Outstanding | |||||||||||||||||||
| Shares Available For Grant |
Number of Shares |
Weighted Average Exercise Price |
Number of Shares |
Weighted Average Exercise Price |
Number of Shares |
Weighted Average Grant-Date Fair Value | |||||||||||||||
| (In thousands, except per share amounts) | |||||||||||||||||||||
| Balances at July 1, 2007 |
2,940 | 4,897 | $ | 7.66 | 295 | $ | 8.53 | 844 | $ | 8.03 | |||||||||||
| Granted—options |
(1,050 | ) | 1,050 | 4.62 | — | — | — | — | |||||||||||||
| Granted—restricted shares |
(510 | ) | — | — | — | — | 510 | 5.14 | |||||||||||||
| Exercised |
— | (50 | ) | 4.14 | — | — | — | — | |||||||||||||
| Vested |
— | — | — | — | — | (234 | ) | 8.11 | |||||||||||||
| Canceled |
1,033 | (933 | ) | 7.37 | (100 | ) | 8.53 | (126 | ) | 6.95 | |||||||||||
| Expired |
(230 | ) | — | — | — | — | — | — | |||||||||||||
| Balances at June 29, 2008 |
2,183 | 4,964 | $ | 7.10 | 195 | $ | 8.53 | 994 | $ | 6.62 | |||||||||||
| Update of 2006 Plan |
5,500 | — | — | — | — | — | — | ||||||||||||||
| Granted—options |
(1,486 | ) | 1,486 | 4.58 | — | — | — | — | |||||||||||||
| Granted—restricted shares |
(60 | ) | — | — | — | — | 30 | 3.80 | |||||||||||||
| Exercised |
— | (151 | ) | 3.95 | — | — | — | — | |||||||||||||
| Vested |
— | — | — | — | — | (350 | ) | 6.92 | |||||||||||||
| Canceled |
1,079 | (1,009 | ) | 6.88 | (70 | ) | 8.53 | (134 | ) | 6.84 | |||||||||||
| Expired |
(65 | ) | — | — | — | — | — | — | |||||||||||||
| Balances at June 28, 2009 |
7,151 | 5,290 | $ | 6.53 | 125 | $ | 8.53 | 540 | $ | 6.22 | |||||||||||
| Granted—options |
(2,683 | ) | 2,683 | 4.98 | |||||||||||||||||
| Granted—restricted shares |
(254 | ) | — | — | — | — | 127 | 5.25 | |||||||||||||
| Exercised |
— | (439 | ) | 4.48 | |||||||||||||||||
| Vested |
— | — | — | — | — | (373 | ) | 6.69 | |||||||||||||
| Canceled |
1,655 | (1,491 | ) | 7.12 | (125 | ) | 8.53 | (75 | ) | 5.24 | |||||||||||
| Expired |
(172 | ) | — | — | — | ||||||||||||||||
| Balances at June 27, 2010 |
5,697 | 6,043 | $ | 5.84 | — | $ | — | 219 | $ | 5.20 | |||||||||||
Options outstanding, vested and expected to vest, and exercisable as of June 27, 2010 were as follows:
| Option |
Number of Shares |
Weighted Average Remaining Contractual Life |
Weighted Average Exercise Price |
Aggregate Intrinsic Value | ||||||
| (In thousands) | (In years) | (In thousands) | ||||||||
| Outstanding |
6,043 | 4.22 | $ | 5.84 | $ | 2,593 | ||||
| Vested and expected to vest |
5,438 | 4.10 | $ | 5.96 | $ | 2,262 | ||||
| Exercisable |
2,457 | 2.36 | $ | 7.26 | $ | 732 | ||||
81
Table of Contents
SYMMETRICOM, INC.
NOTES TO CONSOLIDATED FINANCIAL STATEMENTS—(Continued)
The aggregate intrinsic value in the preceding table represents the total pre-tax value of stock options outstanding as of June 27, 2010, based on our common stock closing price of $5.35 on June 27, 2010, which would have been received by the option holders had all option holders exercised and sold their options as of that date.
As of June 27, 2010, June 28, 2009, and June 29, 2008, the number of shares and weighted average exercise prices of exercisable options were 2.5 million at $7.26, 3.2 million at $7.49, and 3.2 million at $7.47, respectively.
The total intrinsic value of options exercised during fiscal 2010, 2009, and 2008, was $0.6 million, $0.2 million, and $0.1 million, respectively.
The weighted average grant-date fair value of options granted was $2.46 in 2010, $1.87 in 2009 and $1.73 in 2008. Our calculations were made using the Black-Scholes option-pricing model. The fair value of our stock-based awards to employees was estimated assuming no expected dividend and the following weighted-average assumptions for fiscal 2010, 2009 and 2008:
| Year ended | |||||||||
| June 27, 2010 |
June 28, 2009 |
June 29, 2008 |
|||||||
| Expected life (in years) |
4.9 | 3.8 | 3.7 | ||||||
| Risk-free interest rate |
1.9 | % | 1.7 | % | 3.6 | % | |||
| Volatility |
56.6 | % | 52.3 | % | 44.9 | % | |||
Prior to the second quarter of fiscal 2010, we calculated our expected volatility using a blend of historic and implied volatility. Due to the fact that our publicly traded option activity has declined, we are no longer able to calculate an implied volatility and therefore we began using historic volatility exclusively for calculating our expected volatility beginning in the second quarter of fiscal 2010.
Performance Awards
During fiscal 2007, we granted 0.3 million shares of performance stock options to certain employees. Of this amount, 0.2 million were cancelled due to employee terminations. The number of stock options that will ultimately vest depends on actual business performance measured against certain targets such as backlog, revenue, and profitability for specific areas of the Company’s business. Should any target be met, the options in the related performance tranche would vest immediately. As of June 28, 2009, none of the targets for the performance stock options outstanding were expected to be met and all previously recorded compensation expense had been reversed. In the first quarter of fiscal 2010, the options were cancelled.
Restricted Stock Awards
Our restricted stock awards are grants that entitle the holder to acquire shares of restricted common stock with certain designated prices or at no cost on a time or performance basis. The shares of restricted stock cannot be sold, pledged, or otherwise disposed of until the award vests and any unvested shares may be reacquired by us following the awardees’ termination of service. The restricted stock awards typically vest on the first, second or third anniversary of the grant date or on a graded vesting schedule over the designated service period with certain conditions and restrictions.
82
Table of Contents
SYMMETRICOM, INC.
NOTES TO CONSOLIDATED FINANCIAL STATEMENTS—(Continued)
Stock Repurchase Program
On September 29, 2008, the Company’s Board of Directors authorized management to repurchase an additional 2.0 million shares of Symmetricom common stock. As of June 27, 2010, the total number of shares available for repurchase under the repurchase program authorized by the Board of Directors was approximately 1.3 million.
During fiscal 2010, we repurchased 0.3 million shares of common stock pursuant to our repurchase program for an aggregate price of approximately $1.3 million.
A further 0.1 million shares were repurchased by us in fiscal 2010 for an aggregate price of approximately $0.5 million to withhold the cost of income taxes on vested restricted stock for the recipient.
Preferred Stock
We have 500,000 shares of $0.0001 par value preferred stock authorized, of which 200,000 shares have been reserved for issuance in connection with our preferred stock rights plan. The right entitles the holder to purchase from the Company one one-thousandth of a share of Series A Participating Preferred Stock at a price of $72.82. The rights were distributed at the rate of one right for each share of common stock as a non-taxable dividend and will expire August 2011. The rights will be exercisable only in the event that a person or group acquires 15% or more of our outstanding common stock.
Note 15—Business Segment Information
In the third quarter of fiscal 2010, we changed our segment reporting structure from four operating and reporting segments to two operating and reporting segments. This change was affected to better reflect how the Chief Operating Decision Maker (CODM) makes decisions about resource allocation and segment performance. The CODM, as defined by authoritative accounting guidance on Segment Reporting, is our President and Chief Executive Officer (CEO). Our CEO allocates resources to and assesses the performance of each operating segment using information about its revenue and operating income (loss) before interest and taxes. Symmetricom is now organized into two operating segments corresponding to our two divisions: Communications and Government. Given the measure of profit reviewed by our CEO, we have changed our segment profit measure to operating income (loss). Prior to this change, the CEO used gross margin as the segment profit measure.
With the exception of intangible assets, we do not identify or allocate assets by operating segment, nor does the our CEO evaluate operating segments using discrete asset information. We do not allocate integration and restructuring charges, interest and other income, interest expense, or taxes to operating segments.
During the second quarter of fiscal 2010, we classified our Quality of Experience Assurance (QoE) business as a discontinued operation and its respective assets as held for sale. During the third quarter of fiscal 2010, we sold our QoE business. QoE was a reportable segment within our Telecom Solutions Division segment under previous segment presentation. Due to this sale, the results of QoE have been removed from the Communications segment, shown as discontinued operations, and all comparative information from prior periods has been updated to reflect this change.
The following describes our two reporting segments:
Communications
Our Communications business supplies timing technologies and services for worldwide communications infrastructure. Products include primary reference sources, synchronization distribution systems, embedded
83
Table of Contents
SYMMETRICOM, INC.
NOTES TO CONSOLIDATED FINANCIAL STATEMENTS—(Continued)
components and software, and test and measurement equipment, all of which support the timing and synchronization requirements of communications, networks and equipment.
Government
Our Government business provides time technology products for aerospace/defense, IT infrastructure and science and metrology applications. Precision time and frequency systems enable a range of critical operations, including the international time scale, global navigation, the management of power grids, synchronization of complex control systems, and signals intelligence for securing communications in remote and hostile environments.
The comparative information from prior periods related to the following tables has been updated to reflect our change in segment reporting. Segment revenue, gross profit and operating income (loss) were as follows during the periods presented:
| Year ended June 27, 2010 |
|||||||||||||||
| Communications | Government | Corporate | Total | ||||||||||||
| (In thousands) | |||||||||||||||
| Net revenue |
$ | 135,809 | $ | 85,507 | $ | — | $ | 221,316 | |||||||
| Cost of sales |
68,617 | 49,554 | 5,625 | 123,796 | |||||||||||
| Gross profit |
67,192 | 35,953 | (5,625 | ) | 97,520 | ||||||||||
| Operating expenses |
37,137 | 21,366 | 26,888 | 85,391 | |||||||||||
| Operating income (loss) |
$ | 30,055 | $ | 14,587 | $ | (32,513 | ) | $ | 12,129 | ||||||
| Year ended June 28, 2009 |
|||||||||||||||
| Communications | Government | Corporate | Total | ||||||||||||
| (In thousands) | |||||||||||||||
| Net revenue |
$ | 135,496 | $ | 84,250 | $ | — | $ | 219,746 | |||||||
| Cost of sales |
65,869 | 46,789 | 3,866 | 116,524 | |||||||||||
| Gross profit |
69,627 | 37,461 | (3,866 | ) | 103,222 | ||||||||||
| Operating expenses |
66,548 | 41,011 | 28,376 | 135,935 | |||||||||||
| Operating income (loss) |
$ | 3,079 | $ | (3,550 | ) | $ | (32,242 | ) | $ | (32,713 | ) | ||||
| Year ended June 29, 2008 |
|||||||||||||||
| Communications | Government | Corporate | Total | ||||||||||||
| (In thousands) | |||||||||||||||
| Net revenue |
$ | 129,141 | $ | 77,245 | $ | — | $ | 206,386 | |||||||
| Cost of sales |
72,204 | 42,965 | 634 | 115,803 | |||||||||||
| Gross profit |
56,937 | 34,280 | (634 | ) | 90,583 | ||||||||||
| Operating expenses |
37,283 | 19,821 | 26,532 | 83,636 | |||||||||||
| Operating income (loss) |
$ | 19,654 | $ | 14,459 | $ | (27,166 | ) | $ | 6,947 | ||||||
84
Table of Contents
SYMMETRICOM, INC.
NOTES TO CONSOLIDATED FINANCIAL STATEMENTS—(Continued)
The information in the Corporate category above represents corporate-related costs that are not allocated to either of our two segments for the purpose of evaluating their performance. The following table outlines our major corporate-related costs:
| Year ended | |||||||||
| June 27, 2010 | June 28, 2009 | June 29, 2008 | |||||||
| (In thousands) | |||||||||
| Selling, general and administrative costs |
$ | 22,222 | $ | 22,536 | $ | 25,738 | |||
| Restructuring charges |
10,291 | 9,706 | 1,428 | ||||||
| Corporate-related total |
$ | 32,513 | $ | 32,242 | $ | 27,166 | |||
Our export sales, based on the location of the customer, accounted for 33%, 36%, and 33%, of our net revenue in fiscal 2010, 2009, and 2008 respectively. The geographical components of revenue are as follows:
| Year ended | |||||||||
| June 27, 2010 | June 28, 2009 | June 29, 2008 | |||||||
| United States |
67 | % | 64 | % | 67 | % | |||
| International: |
|||||||||
| Asia |
11 | % | 10 | % | 10 | % | |||
| Europe |
15 | % | 16 | % | 12 | % | |||
| Canada |
2 | % | 4 | % | 3 | % | |||
| Latin America |
3 | % | 4 | % | 6 | % | |||
| Rest of the world |
2 | % | 2 | % | 2 | % | |||
With the exception of property, plant and equipment, we do not identify or allocate our long-lived assets by geographic area. No material amount of property, plant and equipment exists outside the United States.
In fiscal 2010 and 2009, we had no customers that accounted for 10% or more of our net revenue. In fiscal 2008, two customers each accounted for 10.8% of our net revenue, or revenues of $22.4 million and $22.5 million, respectively.
Note 16—Restructuring Charges
During the fiscal 2010, we incurred approximately $5.3 million in lease loss and facility related charges. These expenses included approximately $3.5 million related to our San Jose, CA facility and approximately $1.8 million related to our other facilities for unused space at these respective facilities. The lease loss accruals are subject to periodic revisions based on current market estimates. The balance of these lease loss accruals will be paid over the next eight years.
During fiscal 2010, we also incurred approximately $5.0 million in one-time termination benefits and other restructuring related charges, mainly related to the transfer of our Cesium product line from our San Jose, CA facility to our Beverly, MA facility, and the shutdown of our Aguadilla, Puerto Rico facility. The balance of these accruals will be paid over the next year.
85
Table of Contents
SYMMETRICOM, INC.
NOTES TO CONSOLIDATED FINANCIAL STATEMENTS—(Continued)
The following tables show the details of the restructuring cost accruals, which consist of facilities and severance costs, for the years ended June 27, 2010 and June 28, 2009:
| Balance at June 28, 2009 |
Expense Additions |
Payments | Balance at June 27, 2010 | ||||||||||
| (in thousands) | |||||||||||||
| Lease loss accrual (fiscal 2004) |
$ | 216 | $ | 20 | $ | (38 | ) | $ | 198 | ||||
| All other restructuring changes (fiscal 2004) |
181 | 24 | (120 | ) | 85 | ||||||||
| Lease loss accrual (fiscal 2009) |
2,267 | 3,867 | (804 | ) | 5,330 | ||||||||
| Additional depreciation charges (fiscal 2009) |
— | 948 | (948 | ) | — | ||||||||
| All other restructuring changes (fiscal 2009) |
2,900 | 4,962 | (5,258 | ) | 2,604 | ||||||||
| Lease loss accrual (fiscal 2010) |
— | 470 | (166 | ) | 304 | ||||||||
| Total |
$ | 5,564 | $ | 10,291 | $ | (7,334 | ) | $ | 8,521 | ||||
| Balance at June 29, 2008 |
Expense Additions |
Payments | Balance at June 28, 2009 | ||||||||||
| (in thousands) | |||||||||||||
| Lease loss accrual (fiscal 2004) |
$ | 86 | $ | 377 | $ | (247 | ) | $ | 216 | ||||
| All other restructuring changes (fiscal 2004) |
299 | — | (118 | ) | 181 | ||||||||
| Austin facility shutdown (fiscal 2008) |
588 | 1,051 | (1,639 | ) | — | ||||||||
| Lease loss accrual (fiscal 2009) |
— | 2,449 | (182 | ) | 2,267 | ||||||||
| Additional depreciation charges (fiscal 2009) |
— | 1,294 | (1,294 | ) | — | ||||||||
| All other restructuring changes (fiscal 2009) |
— | 4,535 | (1,635 | ) | 2,900 | ||||||||
| Total |
$ | 973 | $ | 9,706 | $ | (5,115 | ) | $ | 5,564 | ||||
Over the next twelve months, we expect to incur remaining restructuring charges amounting to $11.6 million, including approximately $5.2 million in lease loss and facility related charges and approximately $6.4 million in one-time termination benefits and other restructuring related charges.
86
Table of Contents
| Item 9. | Changes in and Disagreements with Accountants on Accounting and Financial Disclosure |
Not applicable.
| Item 9A. | Controls and Procedures |
Evaluation of Disclosure Controls and Procedures
Our management, with the participation of our Chief Executive Officer and Chief Financial Officer, has evaluated the effectiveness of our disclosure controls and procedures (as such term is defined in Rules 13a-15(e) and 15d-15(e) under the Securities Exchange Act of 1934, as amended (the “Exchange Act”)) as of the end of the period covered by this Annual Report on Form 10-K. Based on this evaluation, our Chief Executive Officer and Chief Financial Officer have concluded that, as of the end of this period, our disclosure controls and procedures are effective in recording, processing, summarizing and reporting, on a timely basis, information required to be disclosed in the reports that we file or submit under the Exchange Act.
Changes in Internal Control Over Financial Reporting
There were no material changes in the Company’s internal control over financial reporting that occurred during the quarter ended June 27, 2010 that have affected, or are reasonably likely to materially affect, our internal control over financial reporting.
Management’s Report on Internal Control Over Financial Reporting
The Company’s management is responsible for establishing and maintaining adequate internal control over financial reporting as defined in Rules 13a-15(f) and 15d-15(f) under the Exchange Act. Under the supervision and with the participation of the Company’s management, including our principal executive officer and principal financial officer, the Company conducted an evaluation of the effectiveness of its internal control over financial reporting based on criteria established in the framework in Internal Control—Integrated Framework issued by the Committee of Sponsoring Organizations of the Treadway Commission. Based on this evaluation, the Company’s management concluded that its internal control over financial reporting was effective as of June 27, 2010.
Because of its inherent limitations, internal control over financial reporting may not prevent or detect misstatements. Also, projections of any evaluation of effectiveness to future periods are subject to the risks that controls may become inadequate because of changes in conditions, or that the degree of compliance with the policies or procedures may deteriorate.
The effectiveness of our internal control over financial reporting as of June 27, 2010 has been audited by Deloitte & Touche LLP, our Independent Registered Public Accounting Firm, as stated in their report dated September 10, 2010.
| Item 9B. | Other Information |
None
87
Table of Contents
REPORT OF INDEPENDENT REGISTERED PUBLIC ACCOUNTING FIRM
To the Board of Directors and Stockholders of
Symmetricom Inc.
San Jose, California
We have audited the internal control over financial reporting of Symmetricom, Inc. and subsidiaries (the “Company”) as of June 27, 2010, based on criteria established in Internal Control—Integrated Framework issued by the Committee of Sponsoring Organizations of the Treadway Commission. The Company’s management is responsible for maintaining effective internal control over financial reporting and for its assessment of the effectiveness of internal control over financial reporting, included in the accompanying Management’s Report on Internal Control Over Financial Reporting. Our responsibility is to express an opinion on the Company’s internal control over financial reporting based on our audit.
We conducted our audit in accordance with the standards of the Public Company Accounting Oversight Board (United States). Those standards require that we plan and perform the audit to obtain reasonable assurance about whether effective internal control over financial reporting was maintained in all material respects. Our audit included obtaining an understanding of internal control over financial reporting, assessing the risk that a material weakness exists, testing and evaluating the design and operating effectiveness of internal control based on the assessed risk, and performing such other procedures as we considered necessary in the circumstances. We believe that our audit provides a reasonable basis for our opinion.
A company’s internal control over financial reporting is a process designed by, or under the supervision of, the company’s principal executive and principal financial officers, or persons performing similar functions, and effected by the company’s board of directors, management, and other personnel to provide reasonable assurance regarding the reliability of financial reporting and the preparation of financial statements for external purposes in accordance with generally accepted accounting principles. A company’s internal control over financial reporting includes those policies and procedures that (1) pertain to the maintenance of records that, in reasonable detail, accurately and fairly reflect the transactions and dispositions of the assets of the company; (2) provide reasonable assurance that transactions are recorded as necessary to permit preparation of financial statements in accordance with generally accepted accounting principles, and that receipts and expenditures of the company are being made only in accordance with authorizations of management and directors of the company; and (3) provide reasonable assurance regarding prevention or timely detection of unauthorized acquisition, use, or disposition of the company’s assets that could have a material effect on the financial statements.
Because of the inherent limitations of internal control over financial reporting, including the possibility of collusion or improper management override of controls, material misstatements due to error or fraud may not be prevented or detected on a timely basis. Also, projections of any evaluation of the effectiveness of the internal control over financial reporting to future periods are subject to the risk that the controls may become inadequate because of changes in conditions, or that the degree of compliance with the policies or procedures may deteriorate.
In our opinion, the Company maintained, in all material respects, effective internal control over financial reporting as of June 27, 2010, based on the criteria established in Internal Control—Integrated Framework issued by the Committee of Sponsoring Organizations of the Treadway Commission.
We have also audited, in accordance with the standards of the Public Company Accounting Oversight Board (United States), the consolidated financial statements and financial statement schedule as of and for the year ended June 27, 2010 of the Company and our report dated September 10, 2010 expressed an unqualified opinion on those financial statements and financial statement schedule.
| /s/ Deloitte & Touche LLP |
| San Jose, California September 10, 2010 |
88
Table of Contents
PART III
| Item 10. | Directors, Executive Officers and Corporate Governance |
| (a) | Executive Officers |
See the section entitled “Executive Officers of Symmetricom” in Part I of this report.
| (b) | Directors |
The information required by this item is incorporated by reference from the information under the caption “Election of Directors—Nominees” contained in the Company’s Proxy Statement to be filed with the Securities and Exchange Commission (the “SEC”) in connection with the solicitation of proxies for the Company’s 2010 Annual Meeting of Shareholders to be held on October 29, 2010 (the “Proxy Statement”).
| (c) | Section 16(a) Beneficial Ownership Reporting Compliance |
Section 16(a) of the Securities Exchange Act of 1934, as amended (the “Exchange Act”), requires a company’s directors, officers and beneficial owners of more than 10% of any class of equity securities of the company registered pursuant to Section 12 of the Exchange Act to file with the SEC initial reports of beneficial ownership and reports of changes in ownership of Common Stock and other equity securities of Symmetricom registered pursuant to Section 12 of the Exchange Act. Information regarding Section 16 reporting compliance is contained in the section called “Other Information—Section 16(a) Beneficial Ownership Reporting Compliance” in the Proxy Statement and is incorporated herein by reference.
| (d) | Code of Ethics |
We have adopted a written code of ethics that applies to all of our employees and to our Board of Directors. A copy of the code is available on our website at http://www.symmetricom.com. If any amendments are made to the Code of Ethics or if any waiver, including any implicit waiver, from a provision of the Code of Ethics is granted to the Company’s Principal Executive Officer, Principal Financial Officer, or Principal Accounting Officer, we intend to disclose the nature of such amendment or waiver on our website.
| (e) | Corporate Governance |
The information required by this item is incorporated by reference from the information under the captions “Election of Directors—Audit Committee” and “Election of Directors—Nominating and Governance Committee” contained in the Proxy Statement.
| Item 11. | Executive Compensation |
The information required by this item is incorporated by reference from the information under the captions “Election of Directors—Nominees,” “Election of Directors—Director Compensation,” “Executive Compensation and Related Information,” “Report of the Compensation Committee of the Board of Directors,” “Employment Contracts, Termination of Employment, Change-in-Control Arrangements” and “Certain Relationships and Related Party Transactions” contained in the Proxy Statement.
| Item 12. | Security Ownership of Certain Beneficial Owners and Management and Related Stockholders Matters |
The information required by this item is incorporated by reference from the information under the caption “Other Information—Share Ownership by Principal Stockholders and Management” and “Securities Authorized for Issuance Under Equity Compensation Plans” contained in the Proxy Statement.
89
Table of Contents
| Item 13. | Certain Relationships and Related Transactions, and Director Independence |
The information required by this item is incorporated by reference from the information under the captions “Certain Relationships and Related Party Transactions” and “Election of Directors—The Board of Directors and its Committees” contained in the Proxy Statement.
| Item 14. | Principal Accounting Fees and Services |
The information required by this item is included in “Ratification of Appointment of Independent Registered Public Accounting Firm of the Company” in our Proxy Statement.
90
Table of Contents
PART IV
| Item 15. | Exhibits and Financial Statement Schedules |
| (a) | Financial Statements and Financial Statement Schedules |
1. Financial Statements. Reference is made to the Index to Consolidated Statements of Symmetricom, Inc. under Item 8 of Part II hereof.
2. Financial Statement Schedules. The following financial statement schedule of Symmetricom for the years ended June 27, 2010, June 28, 2009, and June 29, 2008 is filed as part of this report on Form 10-K and should be read in conjunction with the financial statements: Schedule II—Valuation and Qualifying Accounts and Reserves. All other schedules have been omitted because they are not applicable, not required, or the required information is included in the Consolidated Financial Statements or notes thereto.
3. Exhibits. See Item 15(b) below. Each management contract or compensatory plan or arrangement required to be filed has been identified.
| (b) | Exhibits |
| Exhibit No. |
Description of Exhibits | |
| 3.1(i) | Amended and Restated Certificate of Incorporation of the Registrant (incorporated by reference from Exhibit 3.1 to the Registrant’s current report on Form 8-K (file no. 000-02287) filed January 9, 2002). | |
| 3.1(ii) | Amended and Restated By-Laws of the Registrant (incorporated by reference from Exhibit 99.1 to the Registrant’s current report on Form 8-K (file no. 000-02287) filed February 9, 2009). | |
| 4.1 | Form of Common Stock Certificate (incorporated by reference from Exhibit 4.1 to the Registrant’s annual report on Form 10-K (file no. 000-02287) filed August 30, 2002). | |
| 4.2 | Rights Agreement dated as of August 9, 2001 between the Registrant and Mellon Investor Services (incorporated by reference from Exhibit 4.1 to the Registrant’s registration statement on Form 8-A (file no. 000-02287) filed August 9, 2001). | |
| 10.1# | 1999 Director Stock Option Plan, as amended through December 28, 2005, and forms of agreements thereunder (incorporated by reference from Exhibit 99.3 to the Registrant’s 1999 proxy statement (file no. 000-02287) filed September 23, 1999 and Exhibit 10.2 to the Registrant’s quarterly report on Form 10-Q (file no. 000-02287) filed February 13, 2001). | |
| 10.2# | Amendment to the Symmetricom, Inc. 1999 Director Stock Option Plan effective December 28, 2005 and form of option agreement thereunder (incorporated by reference from Exhibits 10.1 and 10.2 to the Registrant’s quarterly report on Form 10-Q (file no. 000-02287) filed February 8, 2006). | |
| 10.3# | 1999 Employee Stock Option Plan, as amended through October 23, 2001, and forms of agreements thereunder (incorporated by reference from Exhibit 99.1 to the Registrant’s proxy statement (file no. 000-02287) filed September 23, 1999 and Exhibit 10.1 to the Registrant’s quarterly report on Form 10-Q (file no. 000-02287) filed February 13, 2001). | |
| 10.4# | Amendment to the Symmetricom, Inc. 1999 Employee Stock Option Plan effective May 28, 2003 (incorporated by reference from Exhibit (d)(6) to the Registrant’s tender offer statement on Schedule TO (file no. 000-02287) filed May 28, 2003). | |
| 10.5# | 2002 Stock Option Plan (incorporated by reference from Exhibit 4.1 to Registrant’s registration statement on Form S-8 (file no. 333-97599) filed August 2, 2002). | |
91
Table of Contents
| Exhibit No. |
Description of Exhibits | |
| 10.6 | Lease Agreement by and between the Registrant and Nexus Equity, Inc. dated June 10, 1996 (incorporated by reference from Exhibit 10.14 to the Registrant’s annual
report on Form 10-K (file no. 000-02287) filed September 17, 1996). | |
| 10.7 | First Amendment to Lease by and between the Registrant and Nexus Equity II LLC, as successor in interest to Nexus Equity, Inc., dated November 18, 2005, effective as of
October 27, 2005 (incorporated by reference from Exhibit 10.2 to the Registrant’s current report on Form 8-K (file no. 000-02287) filed November 22, 2005). | |
| 10.8 | Form of Indemnification Agreement (incorporated by reference from Exhibit 10.6 to the Registrant’s annual report on Form 10-K (file no. 000-02287) filed August 30, 2002). | |
| 10.9# | Symmetricom, Inc. Deferred Compensation Plan effective October 1, 1999 (incorporated by reference from Exhibit 10.4 to the Registrant’s quarterly report on Form 10-Q (file no. 000-02287) filed May 15, 2001). | |
| 10.10# | Amended and Restated Employment and Executive Severance Agreement between the Registrant and Thomas W. Steipp dated October 30, 2008 (incorporated by reference from Exhibit 10.3 to the Registrant’s quarterly report on Form 10-Q (file no. 000-02287) filed February 6, 2009). | |
| 10.12# | Employment Offer Letter between the Registrant and Justin Spencer dated September 25, 2008 (incorporated by reference from Exhibit 10.1 to the Registrant’s current report on
Form 8-K (file no. 000-02287) filed October 2, 2008). | |
| 10.13# | Form of Second Amended and Restated Executive Severance Benefits Agreement between the Registrant and executive officers party to those certain Amended and Restated Executive Severance Benefits Agreements, dated September 11, 2007 (incorporated by reference from Exhibit 10.1 to the Registrant’s quarterly report on Form 10-Q (file no. 000-02287) filed February 6, 2009). | |
| 10.14# | Form of Executive Severance Benefits Agreement between the Registrant and certain executive officers of the Registrant (incorporated by reference from Exhibit 10.1 to the Registrant’s quarterly report on Form 10-Q (file no. 000-02287) filed February 5, 2010). | |
| 10.15# | Form of Restricted Stock Award Agreement (incorporated by reference from Schedule A to Exhibit (a)(1)(ii) to the Registrant’s tender offer statement on Schedule TO (file no. 000-02287) filed May 28, 2003). | |
| 10.16# | Form of Restricted Stock Award Agreement under the Registrant’s 1999 Employee Stock Option Plan, amended effective August 4, 2005 (incorporated by reference from Exhibit 10.21 to the Registrant’s annual report on Form 10-K (file no. 000-02287) filed September 13, 2006). | |
| 10.24# | Amended and Restated 2006 Incentive Award Plan (incorporated by reference from the Registrant’s quarterly report on Form 10-Q (file no. 000-02287) filed November 6, 2008) and forms of agreements thereunder (incorporated by reference from Exhibit 4.4 to the Registrant’s registration statement on Form S-8 (file no. 333-155566) filed November 21, 2008). | |
| 10.25# | Employment Offer Letter, dated as of July 17, 2009, by and between the Registrant and David G. Côté (incorporated by reference from Exhibit 10.1 to the Registrant’s current report on Form 8-K (file no. 000-02287) filed on July 27, 2009). | |
| 10.26* | Manufacturing Service Agreement, dated March 12, 2010, by and between the Registrant and Sanmina-SCI Corporation (“Sanmina-SCI”); Addendum 1 to Manufacturing Service Agreement, dated September 19, 2009, by and between the Registrant and Sanmina-SCI; Addendum 2 to Manufacturing Service Agreement, dated March 22, 2010, by and between the Registrant and Sanmina-SCI, and Amendment 1 to Addendum 2 to Manufacturing Service Agreement, dated May 20, 2010, by and between the Registrant and Sanmina-SCI. | |
92
Table of Contents
| Exhibit No. |
Description of Exhibits | |
| 21.1 | Subsidiaries of the Registrant. | |
| 23.1 | Consent of Independent Registered Public Accounting Firm. | |
| 24.1 | Power of Attorney (see signature page to this annual report on Form 10-K). | |
| 31 | Certification of Chief Executive Officer and Chief Financial Officer Pursuant to Section 302 of the Sarbanes-Oxley Act of 2002. | |
| 32 | Certification Pursuant to Section 906 of the Sarbanes-Oxley Act of 2002. | |
| # | Management contract or compensatory plan or arrangement |
| * | Certain portions have been omitted pursuant to a confidential treatment request. Omitted information has been filed separately with the Securities and Exchange Commission. |
(c) Financial Statement Schedules
See Item 15(a)(2) above.
93
Table of Contents
SCHEDULE II
SYMMETRICOM, INC.
VALUATION AND QUALIFYING ACCOUNTS
(In thousands)
| Balance at Beginning of Year |
Charged to Costs and Expenses |
Deductions(1) | Balance at End of Year | ||||||||||
| Year ended June 27, 2010: |
|||||||||||||
| Accrued warranty expense |
$ | 3,737 | $ | 1,557 | $ | 2,394 | $ | 2,900 | |||||
| Allowance for doubtful accounts |
$ | 361 | $ | 178 | $ | 112 | $ | 427 | |||||
| Year ended June 28, 2009: |
|||||||||||||
| Accrued warranty expense |
$ | 3,801 | $ | 2,854 | $ | 2,918 | $ | 3,737 | |||||
| Allowance for doubtful accounts |
$ | 731 | $ | (328 | ) | $ | 42 | $ | 361 | ||||
| Year ended June 29, 2008: |
|||||||||||||
| Accrued warranty expense |
$ | 3,374 | $ | 3,407 | $ | 2,980 | $ | 3,801 | |||||
| Allowance for doubtful accounts |
$ | 1,107 | $ | 173 | $ | 549 | $ | 731 | |||||
| (1) | Deductions represent costs charged or amounts written off against the reserve or allowance. |
94
Table of Contents
Pursuant to the requirements of Section 13 or 15(d) of the Securities Exchange Act of 1934, the registrant has duly caused this report to be signed on its behalf by the undersigned, thereunto duly authorized.
| SYMMETRICOM, INC. | ||||||
| Date: September 10, 2010 | By: | /s/ DAVID G. CÔTÉ | ||||
| David G. Côté Chief Executive Officer (Principal Executive Officer) | ||||||
KNOW ALL MEN BY THESE PRESENTS, that each person whose signature appears below constitutes and appoints David G. Côté and Justin R. Spencer, and each of them, his true and lawful attorneys-in-fact, each with full power of substitution, for him or her in any and all capacities, to sign any amendments to this report on Form 10-K and to file the same, with exhibits thereto and other documents in connection therewith, with the Securities and Exchange Commission, hereby ratifying and confirming all that each of said attorneys-in-fact or their substitute or substitutes may do or cause to be done by virtue hereof.
Pursuant to the requirements of the Securities Exchange Act of 1934, this report has been signed below by the following persons on behalf of the registrant and in the capacities and on the dates indicated.
| Signatures |
Title |
Date | ||
| /S/ DAVID G. CÔTÉ David G. Côté |
Chief Executive Officer (Principal Executive Officer) and Director |
September 10, 2010 | ||
| /S/ JUSTIN R. SPENCER Justin R. Spencer |
Executive Vice President Finance and Administration, Chief Financial Officer, and Secretary (Principal Financial and Accounting Officer) |
September 10, 2010 | ||
| /S/ ROBERT T. CLARKSON Robert T. Clarkson |
Chairman of the Board |
September 10, 2010 | ||
| /S/ ALFRED BOSCHULTE Alfred Boschulte |
Director |
September 10, 2010 | ||
| /S/ JAMES CHIDDIX James Chiddix |
Director |
September 10, 2010 | ||
| /S/ ELIZABETH A. FETTER Elizabeth A. Fetter |
Director |
September 10, 2010 | ||
| /S/ ROBERT M. NEUMEISTER JR. Robert M. Neumeister Jr. |
Director |
September 10, 2010 | ||
| /S/ RICHARD W. OLIVER Richard W. Oliver |
Director |
September 10, 2010 | ||
| /S/ RICHARD N. SNYDER Richard N. Snyder |
Director |
September 10, 2010 | ||
| /S/ ROBERT J. STANZIONE Robert J. Stanzione |
Director |
September 10, 2010 | ||
95