Attached files
| file | filename |
|---|---|
| EX-5.1 - FORM OF OPINION OF SHUMAKER, LOOP & KENDRICK, LLP - QUALITY DISTRIBUTION INC | dex51.htm |
| EX-23.1 - CONSENT OF PRICEWATERHOUSECOOPERS LLP - QUALITY DISTRIBUTION INC | dex231.htm |
Table of Contents
As filed with the Securities and Exchange Commission on September 10, 2010
Registration No. 333-166407
UNITED STATES
SECURITIES AND EXCHANGE COMMISSION
Washington, D.C. 20549
Amendment No. 2
to
Form S-1
REGISTRATION STATEMENT
UNDER
THE SECURITIES ACT OF 1933
QUALITY DISTRIBUTION, INC.
(Exact name of registrant as specified in charter)
| Florida | 4213 | 59-3239073 | ||
| (State or other jurisdiction of incorporation or organization) |
(Primary Standard Industrial Classification Code Number) |
(I.R.S. Employer Identification Number) |
4041 Park Oaks Blvd., Suite 200
Tampa, Florida 33610
(813) 630-5826
(Address, including zip code, and telephone number, including area code, of registrant’s principal executive offices)
Jonathan C. Gold
Senior Vice President, General Counsel and Secretary
Quality Distribution, Inc.
4041 Park Oaks Blvd., Suite 200
Tampa, Florida 33610
(813) 630-5826
With copies to:
| Gregory Ezring, Esq. O’Melveny & Myers LLP 7 Times Square New York, New York 10036 (212) 326-2000 |
Michael Kaplan, Esq. Davis Polk & Wardwell LLP 450 Lexington Avenue New York, New York 10017 (212) 450-4000 |
(Name, address, including zip code, and telephone number, including area code, of agent for service of process)
Approximate date of commencement of proposed sale to the public: As soon as practicable after this Registration Statement becomes effective.
If any of the securities being registered on this Form are to be offered on a delayed or continuous basis pursuant to Rule 415 under the Securities Act of 1933 check the following box. ¨
If this Form is filed to register additional securities for an offering pursuant to Rule 462(b) under the Securities Act, please check the following box and list the Securities Act registration statement number of the earlier effective registration statement for the same offering. ¨
If this Form is a post-effective amendment filed pursuant to Rule 462(c) under the Securities Act, check the following box and list the Securities Act registration statement number of the earlier effective registration statement for the same offering. ¨
If this Form is a post-effective amendment filed pursuant to Rule 462(d) under the Securities Act, check the following box and list the Securities Act registration statement number of the earlier effective registration statement for the same offering. ¨
Indicate by check mark whether the registrant is a large accelerated filer, an accelerated filer, a non-accelerated filer, or a smaller reporting company. See the definitions of “large accelerated filer,” “accelerated filer” and “smaller reporting company” in Rule 12b-2 of the Exchange Act.
| Large accelerated filer | ¨ | Accelerated filer | ¨ | |||
| Non-accelerated filer | ¨ (Do not check if a smaller reporting company) | Smaller reporting company | x | |||
CALCULATION OF REGISTRATION FEE
|
Title of each Class of Securities to be Registered |
Proposed Maximum Aggregate Offering Price(1) |
Amount of Registration Fee | ||
| Common Stock, no par value per share |
$65,000,000 | $4,635 | ||
| (1) | Estimated solely for the purpose of calculating the registration fee pursuant to Rule 457(c) under the Securities Act of 1933, as amended. The entire amount of the fee was previously paid by the Registrant. |
The Registrant hereby amends this Registration Statement on such date or dates as may be necessary to delay its effective date until the Registrant shall file a further amendment which specifically states that this Registration Statement shall thereafter become effective in accordance with Section 8(a) of the Securities Act of 1933, as amended, or until the Registration Statement shall become effective on such date as the Commission, acting pursuant to said Section 8(a), may determine.
Table of Contents
The information in this prospectus is not complete and may be changed. We may not sell these securities until the registration statement filed with the Securities and Exchange Commission is effective. This prospectus is not an offer to sell these securities and it is not soliciting an offer to buy these securities in any state where the offer or sale is not permitted.
SUBJECT TO COMPLETION, DATED SEPTEMBER 10, 2010
Shares

Quality Distribution, Inc.
Common Stock
We are selling all of the shares of common stock being offered hereby.
Our common stock is listed on The NASDAQ Global Market under the symbol “QLTY.” The last reported sale price on September 9, 2010 was $5.65 per share.
The underwriters have an option to purchase up to additional shares from us to cover over-allotments of shares. The underwriters can exercise this right at any time and from time to time, in whole or in part, within 30 days after the offering.
Investing in our common stock involves risks. See “Risk Factors” beginning on page 16 of this prospectus.
| Price to Public |
Underwriting |
Proceeds
to | ||||
| Per Share |
$ | $ | $ | |||
| Total |
$ | $ | $ |
Delivery of the shares of common stock will be made on or about , 2010.
Neither the Securities and Exchange Commission nor any state securities commission has approved or disapproved of these securities or determined that this prospectus is truthful or complete. Any representation to the contrary is a criminal offense.
Credit Suisse RBC Capital Markets
BB&T Capital Markets Stephens Inc. Stifel Nicolaus Weisel
Cantor Fitzgerald & Co. Moelis & Company Ladenburg Thalmann & Co. Inc. Sterne Agee
The date of this prospectus is , 2010.
Table of Contents
Prospectus
| Page | ||
| ii | ||
| ii | ||
| 1 | ||
| 16 | ||
| 27 | ||
| 29 | ||
| 29 | ||
| 30 | ||
| 31 | ||
| 32 | ||
| MANAGEMENT’S DISCUSSION AND ANALYSIS OF FINANCIAL CONDITION AND RESULTS OF OPERATIONS |
34 |
| Page | ||
| 68 | ||
| 71 | ||
| 75 | ||
| MATERIAL UNITED STATES FEDERAL INCOME TAX CONSEQUENCES FOR NON-U.S. HOLDERS |
80 | |
| 83 | ||
| 86 | ||
| 87 | ||
| 87 | ||
| 87 | ||
| F-1 |
We have not authorized anyone to provide any information other than that contained or incorporated by reference in this prospectus or in any free writing prospectus prepared by or on behalf of us or to which we have referred you. We take no responsibility for, and can provide no assurance as to the availability of, any other information that others may give you. You should not assume that the information contained in this prospectus is accurate as of any date other than the date of this prospectus or that information contained in any document incorporated or deemed to be incorporated by reference is accurate as of any date other than the date of that document.
The distribution of this prospectus in some jurisdictions may be restricted by law. Persons who receive this prospectus should inform themselves about and observe any such restrictions. This prospectus does not constitute, and may not be used in connection with, an offer or solicitation by anyone in any jurisdiction in which such offer or solicitation is not authorized or in which the person making such offer or solicitation is not authorized or in which the person making such offer or solicitation is not qualified to do so or to any person to whom it is unlawful to make such offer or solicitation.
Our logo and other trademarks mentioned in this prospectus or any document incorporated by reference herein are our property. Solely for convenience, our trademarks referred to in this prospectus are without the ® or ™ symbol, as applicable, but such references are not intended to indicate, in any way, that we will not assert, to the fullest extent under applicable law, our rights to these trademarks. Other brand names or trademarks appearing in this prospectus or any document incorporated by reference herein are the property of the respective owners.
i
Table of Contents
In this prospectus, unless the context otherwise requires or indicates:
| • | the terms “our company,” “Quality Distribution,” “QDI,” “we,” “us” and “our” refer to Quality Distribution, Inc. and its consolidated subsidiaries and their predecessors; the term “QD LLC” refers to our wholly owned subsidiary, Quality Distribution, LLC, and its consolidated subsidiaries and their predecessors; and “QD Capital” means QD Capital Corporation, a Delaware corporation, our wholly owned subsidiary and, together with QD LLC, a co-issuer of the 9% Notes, the 2012 Notes, the 2013 Senior Notes and the 2013 PIK Notes. |
| • | “Apollo” means Apollo Management, L.P., together with its affiliates; |
| • | the “2012 Notes” means our outstanding Senior Floating Rate Notes due 2012, Series A; |
| • | the “9% Notes” means our outstanding 9% Senior Subordinated Notes due 2010; |
| • | the “2013 Senior Notes” means our outstanding 10% Senior Notes due 2013; |
| • | the “2013 PIK Notes” means our outstanding 11.75% Senior Subordinated PIK Notes due 2013; and |
| • | the “ABL Facility” means the asset-based revolving credit facility that we entered into on December 18, 2007, as it may be amended, modified, refinanced or replaced. |
Market and industry data and other statistical information used throughout this prospectus are based on independent industry publications, government publications and other published independent sources, including Bulk Transporter’s Tank Truck Carrier 2009 Annual Gross Revenue Report and publications of the Association of American Railroads (“AAR”). Some data are also based on our good faith estimates, which are derived from our review of management’s knowledge of the industry and independent sources. Although we believe that this information is reliable, we cannot guarantee its accuracy and completeness, nor have we independently verified it. We also obtain certain other market share and industry data from internal company analyses and management estimates, and based on our knowledge of the industry. While we believe such internal company analyses and management estimates are reliable, no independent sources have verified such analyses and estimates. Although we are not aware of any misstatements regarding the market share and the industry data that we present in this prospectus, our estimates involve risks and uncertainties and are subject to change based on various factors, including those discussed under “Risk Factors” and “Forward-Looking Statements and Certain Considerations.”
ii
Table of Contents
This summary may not contain all the information that may be important to you. You should read the entire prospectus and the documents incorporated and deemed to be incorporated by reference herein, including the financial statements and related notes, before making an investment decision. Unless otherwise expressly stated or the context otherwise requires, all information in this prospectus assumes that the over-allotment option granted to the underwriters is not exercised.
Our Company
We operate the largest chemical bulk tank truck network in North America through our wholly owned subsidiary, Quality Carriers, Inc. (“QCI”), and are also the largest provider of intermodal tank container and depot services in North America through our wholly owned subsidiary, Boasso America Corporation (“Boasso”). We service customers across North America through our asset-light network of 30 independent affiliates, 97 trucking terminals (91 of which are operated by independent affiliates), 8 intermodal tank depot services terminals and approximately 2,800 drivers (approximately 2,400 of whom work within our independent affiliate network). We also own approximately 5,000 tank or specialty trailers, the majority of which we lease to our independent affiliates to help facilitate our business. These trailers generally have long useful lives and we believe that increasing their utilization can significantly improve our operating income due to high operating leverage. Given the specialty nature of the services we provide and the size of our existing network, we believe there are significant barriers to entry to our industry.
In 2009, we generated operating revenue of $613.6 million, of which the bulk tank truck business accounted for $460.4 million or 75% and Boasso accounted for $79.5 million or 13%. The remaining $73.7 million consisted primarily of rental revenue and revenue from our tank wash business, which we sold during the fourth quarter of 2009. In the twelve-month period ended June 30, 2010, we generated operating revenue of $653.0 million, of which the bulk tank truck business accounted for $492.0 million or 75% and Boasso accounted for $91.2 million or 14%. The remaining $69.8 million consisted primarily of rental revenue and revenue from our tank wash business, which we sold in the fourth quarter of 2009.
Trucking
In our bulk tank truck business, we primarily transport a broad range of chemical products and provide our customers with logistics and other value-added services. We believe we have the leading market share (estimated at 14% in 2009) in the chemical and food grade bulk transportation market (which we estimated to be $4.0 billion in 2009). We are a core carrier for many of the major companies engaged in chemical processing including Ashland, BASF, Dow, DuPont, ExxonMobil, Georgia-Pacific, Honeywell, PPG Industries, Procter & Gamble, Sunoco and Unilever, and we provide services to most of the top 100 chemical producers with United States operations.
Our independent affiliates generally own or lease their terminals, employ drivers and manage independent owner-operators, pay all tractor operating expenses, lease trailers from us and provide national network capacity. Each affiliate is an independent company that generally has an exclusive contract with us to operate under the Quality Carriers® mark and receive a percentage of gross revenues collected on each shipment they transport. We in turn provide various services to the independent affiliates, including working capital, back office and sales support, technology support, insurance and cash flow management and regulatory compliance oversight. Typically, we receive 15% of the revenue (excluding fuel surcharges) generated by the independent affiliates and we also lease our trailers to the independent affiliates (generating additional revenue above our typical 15% revenue share), who have significant contractual limitations on their ability to lease or purchase trailers from
1
Table of Contents
sources other than us. We view the trailer leasing business as attractive given the low upfront costs, long useful life, limited maintenance and attractive return on investment. Due to several factors, including our ownership of the customer contracts and relationships, the presence of non-compete agreements with the independent affiliates, and our ownership of the trailers, our relationships with the independent affiliates tend to be long-term in nature, with minimal voluntary turnover.
Twenty-seven out of our 30 independent affiliates have been associated with us for more than five years and we derived approximately 77%, 90% and 94% of our operating revenue in 2009, the twelve-month period ended June 30, 2010 and the six-month period ended June 30, 2010, respectively, from independent affiliate operations. We believe that the greater proportion of operating revenue derived from independent affiliate operations during the six-month period ended June 30, 2010 (the first six-month period following the sale of our tank wash business in the fourth quarter of 2009) is likely to be indicative of the proportion of operating revenue derived from independent affiliate operations in the future. This affiliate-based model is an asset-light, variable-cost based model that enables us to leverage our independent affiliates and better serve customers while minimizing fixed costs and maximizing shareholder value. We believe this asset-light business model will enable us to benefit from an economic recovery without incurring substantial capital expenditures.
Our well-established coast-to-coast geographic footprint and our proximity to major chemical production facilities and ports afford us certain advantages that many of our smaller competitors lack. These advantages include the ability to dedicate significant capacity with prompt response times to customers across all of North America, enhanced lane density and efficiencies in driver recruiting.
Our transportation revenue is a function of the volume of shipments by the bulk chemical industry, prices, the average number of miles driven per load, our market share and the allocation of shipments between tank truck transportation and other modes of transportation such as rail. The volume of shipments of chemical products is, in turn, affected by many diverse industries and end-use markets, including consumer and industrial products, paints and coatings, paper and packaging, agriculture and food products, and tends to vary with changing economic conditions. We have recently experienced some year-over-year volume improvements and believe this trend could continue as the economy recovers. For the year-to-date period through August 27, 2010, chemical freight car loads reported by the Association of American Railroads (“AAR”), which we consider to be a key metric indicating the level of chemical transportation activity, is up 10.2% year-on-year over the comparable period.
Container Services
Boasso is the largest North American provider of ISO (International Organization for Standardization) tank container transportation and depot services, with eight terminals located in the eastern half of the United States. In addition to intermodal ISO tank transportation services, Boasso provides tank cleaning, heating, testing, maintenance and storage services to customers. Boasso provides local and over-the-road trucking primarily within proximity of the port cities where its depots are located and also sells equipment that its customers use for portable alternative storage or office space.
Demand for ISO tank containers is driven by the volume of imports and exports of chemicals through United States ports. Boasso’s revenues are accordingly impacted by this import/export volume, in particular the number and volume of shipments through ports at which Boasso has terminals, as well as by Boasso’s market share. Economic conditions and differences among the laws and currencies of nations may impact the volume of shipments as well. We believe this business will continue to benefit from the trend towards globalization of petrochemical production, leading to greater quantities of chemicals being imported into North America.
2
Table of Contents
Recent Strategic Initiatives
During the recent economic slowdown, we implemented several important initiatives designed to enhance our operating flexibility and improve our competitive positioning. As a result, we believe we are well-placed to take advantage of opportunities as the economy recovers and volumes in our industry rebound. These initiatives are summarized below:
| • | Simplification of business model and transition to asset-light independent affiliate network. We transitioned the majority of our company-operated terminals to affiliates, resulting in a highly variable cost structure with relatively minimal capital investment requirements. Our trucking terminals are currently 94% affiliate-operated, compared with 45% as of December 31, 2007. We also moved towards a smaller number of stronger independent affiliates leading to a simpler, more efficient business model with improved customer service. |
| • | Implemented $45 million cost saving programs. During 2008 and 2009, we embarked on a major initiative achieving $45 million in cost savings through reductions in overhead expenses, headcount reductions (including as a result of transitioning company-operated terminals to affiliates), closure of selected facilities, and fuel purchase discounts, among other areas. These savings have been fully implemented and achieved, leading to improved competitive positioning and a more favorable and flexible cost structure. For instance, we reduced corporate headcount by 34%, while our total number of employees decreased by 58%. We also consolidated and rationalized under-performing terminals, reducing total number of terminals by 38% from 169 to 105, while transitioning most of the business from these under-performing terminals to our remaining terminals. We believe that as we grow our business, we will be able to retain a substantial majority of the benefits from our cost savings initiatives, which we believe will lead to increased margins. |
| • | Divestiture of non-core tank wash business. In October 2009, we sold our tank wash business for $13.0 million. The business was non-core to us and the sale enabled us to deploy our resources more efficiently and focus on growing the core transport business. We believe the changes in our business activities as a result of the sale of the tank wash business will reduce our environmental compliance costs going forward. |
| • | Extension of debt maturities. In October 2009, we completed exchange and tender offers for our 9% Notes, which are due in 2010, and our 2012 Notes, extending our principal near-term debt maturities to 2013. The transaction allowed us to leave in place our existing lower cost debt under our ABL Facility with the flexibility of a capital structure that has no maintenance covenants so long as borrowing availability under our ABL Facility exceeds $20 million. At June 30, 2010, we had $47.8 million of borrowing availability under our ABL Facility. |
| • | Increased focus on cash flow generation. As a result of our shift to a more asset-light independent affiliate network, we believe we have created a more cash-efficient business model. With minimal maintenance capital investment requirements, estimated at approximately 1% of sales, we believe our business model allows for significant cash flow generation. As a result of this increased focus on cash flow generation, in the twelve-month period ended June 30, 2010 our net cash provided by operating activities was $11.1 million and Free Cash Flow (as defined below) was $8.7 million. |
3
Table of Contents
Our Competitive Strengths
We believe the following competitive strengths will enable us to sustain our market leadership and continue to grow our business:
Largest Tank Truck Network in a Fragmented Industry
We operate the largest tank truck network in North America with a 14% share of the highly fragmented $4.0 billion for-hire chemical and food grade bulk transport market, in each case estimated by us based on figures contained in Bulk Transporter’s Tank Truck Carrier 2009 Annual Gross Revenue Report. We believe our unique large nationwide network covers all major North American chemical shippers and enables us to serve customers with both international and national requirements better than competitors, the majority of which are regionally focused. Our size allows us, our independent affiliates and our independent owner-operators to benefit from economies of scale in the purchasing of supplies and services, including fuel, tires and insurance coverage. We believe our greater network density allows us to create efficiencies by increasing utilization through reduced “empty miles” with more opportunities to generate backhaul loads.
Asset-Light Business Model
Our extensive use of independent affiliates and independent owner-operators results in a highly variable cost structure with relatively minimal capital investment requirements. Due to our recent transition to a predominantly affiliate-based business model, we expect our capital expenditures to generally amount to approximately 1% of operating revenues annually, compared to the industry average of more than 10% for truckload carrier companies. This model also contributes to the stability of our cash flow and margins and increases our return on capital. The independent affiliates are responsible for capital investments and most of the operating expenses related to the business they service, including the capital costs related to purchasing and maintaining tractors. Typically, independent affiliates purchase or lease tractors for their business directly from the manufacturers and lease trailers from us. Independent owner-operators are independent contractors who supply one or more tractors and drivers for our own or our independent affiliates’ use. As with independent affiliates, independent owner-operators are responsible for most of the operating expenses related to the business they service, including costs related to the acquisition and maintenance of tractors.
We prefer to own the trailers as they provide us with a stable source of lease income, as well as access to attractive capital through the ABL Facility. Through periodic maintenance, we are typically able to extend the useful lives of trailers beyond 15-20 years, leading to operational flexibility.
Core Carrier to Blue Chip Chemical Companies.
We provide services to most of the top 100 chemical producers with U.S. operations, including many Fortune 500 companies and other major companies engaged in chemical processing. Our key customers include Ashland, BASF, Dow, DuPont, ExxonMobil, Procter & Gamble and PPG Industries. In 2009, our top 10 customers accounted for approximately 34% of our trucking revenue, and none of our customers accounted for more than 9% of our trucking revenue in 2009. Our ability to maintain these business relationships reflects our service performance and commitment to safety and reliability. We have established long-term customer relationships with these clients, which help us attract and retain experienced independent affiliate terminal operators and drivers. Our team of national account vice presidents and directors have decades of experience in our industry, which we believe enables them to provide practical solutions to complex customer issues.
Exposure to High Growth International Market.
Through Boasso’s operations, we have significant exposure to high growth international markets. Boasso is the leading provider of ISO tank container over-the-road transportation and depot services in North America. The
4
Table of Contents
ISO tank container transportation market has experienced significant growth recently as international chemical trade has increased and chemical manufacturers move towards greater utilization of ISO tanks and standardized intermodal tank containers to efficiently transport their products around the world via sea, land and air. According to USA Trade® Online, in the ten years from 1999-2009, total chemical imports and exports grew at a 6.3% compound annual growth rate, and for the first six months of 2010, chemical import and export activity is up 18.4% year-over-year. Boasso’s tank container depots, which provide transportation, cleaning, heating, testing, maintenance and storage services, are located at or near ports in Chalmette, LA; Houston, TX; Newark, NJ; Charleston, SC; Chicago, IL; Detroit, MI and Jacksonville, FL.
Diverse Product End-Markets.
We serve customers in a number of different industries, whose products reach a diverse group of end-markets. Many of our customers’ major end-markets, such as refining and water treatment, energy, ink and agriculture typically have volumes that we believe are not highly correlated with economic cycles. In addition, our most recent affiliate addition expands our presence in the dry bulk shipping industry. We believe the diversity of our customer base, geography and end-markets provides a competitive advantage.
Stable Pricing Environment.
We believe yields in the bulk tank truck industry tend to be more stable than yields in the overall trucking industry. We believe the specialized nature of the bulk tank truck industry, including specifically-licensed drivers, specialized equipment, and more stringent safety requirements create barriers to entry which limit the more drastic swings in supply experienced by the broader trucking industry. Additionally, it is common practice in the bulk tank truck industry for customers to pay fuel surcharges, which enables trucking companies to recover fuel price increases from customers.
Safe and Efficient Operations
We have a strong emphasis on safety in our operations and have a relentless focus on improving productivity and efficiency. Over the past three years, we have reduced our Department of Transportation (“DOT”) accident rating from 0.7 to 0.5, which was approximately 30% below the national average of 0.7 in 2009. This proactive approach to safety has resulted in financial benefits by enabling us to reduce our insurance deductibles from $5 million to $2 million and obtain letter of credit reductions of $17 million in the past few years. In addition, our insurance costs have decreased from over $23 million in 2007 to approximately $14 million in 2009. Given the nature of the cargo we haul, which requires a high degree of careful handling, we believe that our strong focus on safety creates a competitive advantage for us. We believe we are well positioned to comply with the expected implementation of the Federal Motor Carrier Safety Administration’s (“FMCSA”) Compliance Safety Analysis (“CSA”) program, which will impose additional safety standards on the industry.
Strong Management Team with a Track Record of Success
Our management team, led by our Chief Executive Officer, Gary Enzor, successfully navigated our business through the recent economic slowdown, by implementing cost savings measures and by leading the transition to an affiliate-based network, among other initiatives. We also extended our principal debt maturities until mid-2013. As a result, we believe we are well positioned to benefit from an economic recovery. Mr. Enzor, as well as our President and Chief Operating Officer, Steve Attwood, and other senior managers have significant managerial and operational experience in our industry and have implemented various operational initiatives to improve productivity. Our management team has also demonstrated its ability to acquire and integrate assets, as well as divest non-core businesses, as evidenced by the acquisition of Boasso in December 2007 and the divestiture of the QSI tank wash business in October 2009.
5
Table of Contents
Our Growth Strategy
Building on the strengths mentioned above, we plan to grow our revenue and increase cash flow and profitability as follows:
Pursue Attractive Growth Opportunities
Grow Business with Blue Chip Customers
We plan to leverage our strong existing relationships with the major chemical shippers to increase our market share of these customers’ volumes. For example, in the past few years, due to our strong commitment to customer service, we have been the sole source provider for one major chemical shipper and have grown revenue from $1 million in 2004 to $16 million in 2009. In addition, we increased our revenue with another major chemical distributor from $3 million in 2004 to $22 million in 2009 by leveraging our national network, solutions approach and customer service. Through our dedicated salesforce, we maintain an active and robust pipeline of potential opportunities to grow our business. We believe our business model allows our existing infrastructure to absorb significant additional volume without the need for major capital expenditures.
Grow Through Acquisitions and New Affiliations
We have strong organizational competence which we believe will allow us to identify and evaluate potential opportunities to acquire assets and businesses and increase our affiliate network. We believe that the various services we provide to our independent affiliates, including working capital, back office and sales support, technology support, insurance and cash flow management and regulatory compliance oversight, make our platform attractive for our affiliates. We believe we can make selective, highly accretive add-on acquisitions on an opportunistic basis to supplement our existing core business. For example, in 2007, we acquired Boasso, the largest North American provider of ISO intermodal tank container transportation and depot services. In addition to acquiring companies, we are able to grow externally by bringing new affiliates onto our platform. For example, on May 1, 2010, we added F.T. Silfies, a dry bulk carrier with annual revenues of approximately $20 million, primarily servicing the east coast markets, to our affiliate network. We are currently analyzing several opportunities and plan to continue to utilize acquisitions and affiliate additions to bolster our growth.
Enhance Independent Affiliate Trucking Operations
We have focused over the last two years and continue to focus on a less capital-intensive business model based on our 30 independent affiliates. We believe these actions reduce certain fixed costs and provide a more flexible, variable cost structure. In 2008 and 2009, we transitioned the majority of our company-operated terminals to independent affiliates. We also moved one-third of our sales representatives to the independent affiliates to better cover key regional accounts. As a result of these actions and the sale of our tank wash business, we generated approximately 90% and 94% of our revenue in the twelve-month period ended June 30, 2010 and the six-month period ended June 30, 2010, respectively, from independent affiliates. We believe that the greater proportion of operating revenue derived from independent affiliate operations during the six-month period ended June 30, 2010 (the first six-month period following the sale of our tank wash business in the fourth quarter of 2009) is likely to be indicative of the proportion of operating revenue derived from independent affiliate operations in the future. At the same time, due to our ownership of the customer contracts and relationships, presence of non-compete agreements with the independent affiliates, and our ownership of the trailers, our relationships with the independent affiliates tend to be long-term in nature, with minimal voluntary turnover. We also monitor volume performance of each affiliate on a regular basis to ensure operating performance is in line with management’s expectations. We work proactively with our affiliates to take corrective action or render assistance where appropriate and have certain contractual mechanisms in place to remedy sustained underperformance. We believe our selected independent affiliates are also generally well-financed and have the capacity to increase their revenue base while maintaining a high level of customer service.
6
Table of Contents
Focus on Driver Recruitment and Retention
We are committed to being a driver-focused company that provides both technical support and personal respect to these professionals. We believe we offer competitive compensation at a premium compared to most commercial driving opportunities. With an average haul length of 300 miles, the drivers are also generally home more frequently. Our driver organization contains field-based recruiters who augment the friendly, small business environment provided by our business model. As the overall economy improves, we believe our ability to attract drivers could prove to be a significant competitive advantage to us.
Increase Trailer Utilization
At June 30, 2010, we owned approximately 5,000 trailers, the majority of which we lease to affiliates. Trailer leasing is a key component of our business model. Through periodic maintenance, we are typically able to extend the useful lives of trailers beyond 15-20 years, leading to operational flexibility. Our independent affiliates have significant contractual limitations on their ability to lease or purchase trailers from sources other than us, helping ensure their continued utilization. Based on our current trailer fleet, we believe we have the ability to capture any additional business volume with minimal capital expenditures. To increase our trailer utilization, we also actively pursue opportunities to lease our trailers to third parties other than our independent affiliates. The operating leverage inherent in our business model allows a significant portion of any incremental revenue generated through increased trailer utilization to flow through to our operating income.
Increase Equity Returns Through Debt Paydown
We intend to use the net proceeds from this offering to repay certain of our existing indebtedness and to use cash generated from operations to further reduce our indebtedness as appropriate. Given our relatively low levels of maintenance capital expenditures, we believe that we will continue to generate significant free cash flow to continue to reduce our indebtedness and to make targeted acquisitions.
Our Industry
Trucking
The bulk tank truck market in North America includes all products shipped by bulk tank truck carriers and consists mainly of liquid and dry bulk chemicals (including plastics) and bulk dry and liquid food-grade products. We estimate, based on industry sources, that the highly fragmented North American for-hire segment of the bulk transport market generated revenues of approximately $5.3 billion in 2009. We specifically operate in the for-hire chemical and food grade bulk transport market (which we estimated to be $4.0 billion in 2009). We believe we have the leading market share (estimated at 14% in 2009) in this sector based on revenues. We operate the largest for-hire chemical bulk tank truck network in North America comprising terminals, tractors and trailers. We believe being a larger carrier facilitates customer service and lane density, and provides a more favorable cost structure. As such, we believe we are well-positioned to expand our business by increasing our market share.
The chemical bulk tank truck industry growth is generally dependent on volume growth in the industrial chemical industry, the rate at which chemical companies outsource their transportation needs, the overall capacity of the rail system and, in particular, the extent to which chemical companies make use of the rail system for their bulk chemical transportation needs.
We consider U.S. rail carloads of chemicals (calculated using the data reported by AAR on a weekly basis) a key metric since we believe it has historically been indicative of transportation activity involving chemicals. As summarized in the chart below, this metric has been trending positively recently, posting 41 consecutive weeks of growth through August 27, 2010, which we believe can be considered a positive sign for our business prospects in this sector.
7
Table of Contents
Carloads of Chemicals on U.S. Railroads per Week
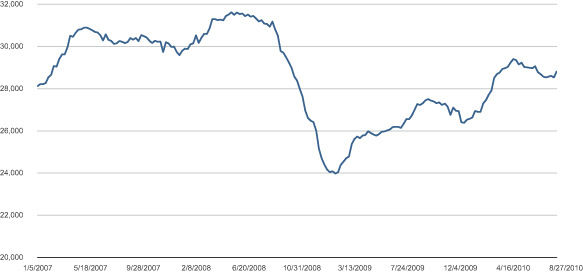
Source: Association of American Railroads (AAR).
Note: Data as of August 27, 2010.
We believe the most significant factors relevant to our future business growth are the ability to obtain additional business from existing customers, add new customers, improve the utilization of our trailer fleet and add and retain qualified drivers.
Our industry is characterized by high barriers to entry such as the time and cost required to develop the operational infrastructure necessary to handle sensitive chemical cargo, the financial and managerial resources required to recruit and train drivers, substantial industry regulatory requirements, strong customer relationships and the significant capital investments required to build a fleet of equipment and establish a network of terminals.
The tank truck business is competitive and fragmented. We compete primarily with other tank truck carriers and dedicated private fleets in various states within the United States and Canada. Competition from for-hire carriers is composed of fewer than ten large carriers, most of which have other businesses that do not compete with ours, and more than 200 smaller, primarily regional carriers. With respect to certain aspects of our business, we also compete with intermodal transportation and railroads. Intermodal transportation has increased in recent years. Competition for the bulk tank truck services is based primarily on rates and service. We believe that we enjoy significant competitive advantages over other tank truck carriers because of our asset-light model, variable cost structure, overall fleet size and national terminal network.
Container Services
We estimate that the North American ISO tank container transportation and depot services market generated revenues of approximately $230 million in 2009. The ISO tank container business generally provides services that facilitate the global movement of liquid and dry bulk chemicals, pharmaceuticals and food grade products.
The proliferation of global import/export of bulk liquid chemicals has driven the movement of basic manufacturing out of the United States and has resulted in an increase in chemical plant infrastructure to service these off-shore industries. Driven by this globalization, the ISO tank container market is a growing sector of the overall liquid bulk chemical transportation sector. Furthermore, chemical manufacturers have sought to efficiently transport their products by utilizing ISO tank containers. The resulting demand for distributors that
8
Table of Contents
can offer a broad range of services within the supply chain will drive future growth in this sector. We believe that Boasso will benefit from these trends because of its market leadership, experience and track record.
Boasso competes primarily with other national, regional and local tank truck carriers and dedicated private fleets as well as local and regional dry container transporters. Competition in our ISO container services business depends on which competitors have facilities that are proximate to the ports serviced by Boasso. Among competitors for a port location, competition is based primarily on rates and service.
Our Formation and Ownership
We were formed in 1994 as a holding company known as MTL Inc., which consummated its initial public offering on September 17, 1994. On June 9, 1998, MTL Inc. was recapitalized through a merger with a corporation controlled by Apollo Investment Fund III, L.P. As a result of the recapitalization, MTL Inc. became a private company. On August 28, 1998, we completed our acquisition of Chemical Leaman Corporation and its subsidiaries, or CLC. Through the 1998 acquisition, we combined two of the then-leading bulk transportation service providers, namely, Montgomery Tank Lines, Inc. and Chemical Leaman Tank Lines, Inc., under one operating company, Quality Carriers, Inc., or QCI. In 1999, we changed our name from “MTL Inc.” to “Quality Distribution, Inc.” On May 30, 2002, as part of a corporate reorganization, we transferred substantially all of our assets to QD LLC, consisting principally of the capital stock of our operating subsidiaries. On November 13, 2003, we consummated the initial public offering of 7,875,000 shares of our common stock. Boasso became our wholly owned subsidiary in December 2007, when we acquired all of its outstanding capital stock from a third party.
As of June 30, 2010, affiliates of Apollo owned or controlled approximately 48.9% of our common stock, or approximately 44.3% on a fully diluted basis. Following this offering, affiliates of Apollo will own approximately % of our common stock and approximately % on a fully diluted basis.
Corporate Information
Our company is a Florida corporation formed in 1994. Our principal executive offices are located at 4041 Park Oaks Blvd., Suite 200, Tampa, Florida, 33610, and our telephone number is (813) 630-5826. We are a holding company with no significant assets or operations other than the ownership of 100% of the membership units of QD LLC. Our website address is http://www.qualitydistribution.com. The contents of and information contained on our website do not form a part of and are not incorporated by reference into this prospectus.
9
Table of Contents
THE OFFERING
| Issuer |
Quality Distribution, Inc. |
| Common stock offered by us: |
shares |
| Common stock to be outstanding after the offering |
shares |
| Underwriters’ over-allotment option |
We have granted the underwriters an option to purchase up to shares of our common stock. If the underwriters exercise in full this right, we will have approximately shares of our common stock outstanding after this offering. |
| Use of proceeds |
We intend to use $15.0 million of the net proceeds from our sale of shares in this offering to repay outstanding borrowings under the ABL Facility (without reducing commitments). We intend to use the remainder of such proceeds to retire a portion of our outstanding notes, either through redemption at par, plus accrued and unpaid interest, or opportunistically at prices below par, through tender offers and/or open market repurchases. Pending such use of the remainder of the proceeds, we may temporarily further repay outstanding borrowings under the ABL Facility. See “Use of Proceeds.” |
| Dividend Policy |
We do not currently anticipate paying any dividends on our common stock in the foreseeable future. See “Dividend Policy.” |
| The NASDAQ Global Market symbol |
QLTY |
The last reported sale price on September 9, 2010 was $5.65 per share.
| Risk Factors |
You should carefully consider all of the information set forth in this prospectus and, in particular, the information under the heading “Risk Factors” beginning on page 11, prior to purchasing the shares of common stock offered hereby. |
| Conflicts of interest |
Affiliates of Credit Suisse Securities (USA) LLC and BB&T Capital Markets, a division of Scott & Stringfellow, LLC, which are underwriters, are lenders under the ABL Facility and may receive more than five percent of the net proceeds of this offering as a result of our intention to repay outstanding borrowings under the ABL Facility. Thus, Credit Suisse Securities (USA) LLC and BB&T Capital Markets, a division of Scott & Stringfellow, LLC, may be deemed to have a “conflict of interest” under the applicable provisions of Rule 2720 of the Conduct Rules of the Financial Industry Regulatory Authority, Inc. Accordingly, this offering will be made in compliance with the applicable provisions of Rule 2720 of the Conduct Rules. Rule 2720 currently requires that a “qualified independent underwriter” participate in the preparation of the registration statement and the prospectus and exercise the usual standards of due diligence in respect thereto. RBC Capital Markets Corporation is acting as the qualified independent underwriter. See “Conflicts of Interest.” |
10
Table of Contents
Unless otherwise indicated, all share information in this prospectus is based on the number of shares of common stock outstanding as of June 30, 2010 and excludes 3.1 million shares of common stock reserved for issuance under our stock option plans, 2.2 million outstanding stock options, 623,483 shares of unvested restricted stock and outstanding warrants representing 445,929 shares of common stock as of June 30, 2010.
Unless we specifically state otherwise, all information in this prospectus assumes no exercise by the underwriters of their over-allotment option.
11
Table of Contents
SUMMARY FINANCIAL AND OTHER OPERATING DATA
The following table sets forth our summary historical financial information. The historical statement of operations data for the fiscal years ended December 31, 2009, 2008 and 2007 and the historical balance sheet data as of December 31, 2009 and 2008 are derived from, and should be read in conjunction with, our audited consolidated financial statements and related notes included elsewhere in this prospectus. The historical statement of operations data for the six months ended June 30, 2010 and June 30, 2009 and the historical balance sheet data as of June 30, 2010 and June 30, 2009 are derived from our unaudited financial statements included elsewhere in this prospectus. The unaudited financial statements have been prepared on the same basis as the audited financial statements and, in the opinion of management, include all adjustments, consisting only of normal recurring adjustments, necessary to present fairly the data for the period. The results of operations for the interim period are not necessarily indicative of the operating results for the entire year or any future period.
The summary historical financial data for the 12-month period ended June 30, 2010 was derived by (i) combining our historical consolidated statement of operations for fiscal 2009 with (ii) our historical consolidated statement of operations for the six months ended June 30, 2010 and (iii) subtracting our historical consolidated statement of operations for the six months ended June 30, 2009.
The information contained in this table should also be read in conjunction with “Capitalization,” “Selected Historical Financial and Other Data” and “Management’s Discussion and Analysis of Financial Condition and Results of Operations” appearing elsewhere in this prospectus.
| Year Ended December 31, | Six Months Ended June 30, |
Twelve Months Ended June 30, 2010 |
||||||||||||||||||||||||||
| (Dollars in thousands, except per share data) | 2009 | 2008 | 2007 | 2010 | 2009 | |||||||||||||||||||||||
| (unaudited) | (unaudited) | |||||||||||||||||||||||||||
| Statement of Operations Data(1) |
||||||||||||||||||||||||||||
| Operating revenues |
$ | 613,609 | $ | 815,290 | $ | 751,558 | $ | 338,885 | $ | 299,518 | $ | 652,976 | ||||||||||||||||
| Operating expenses: |
||||||||||||||||||||||||||||
| Purchased transportation |
373,539 | 466,823 | 471,531 | 233,975 | 170,876 | 436,638 | ||||||||||||||||||||||
| Depreciation and amortization |
20,218 | 21,002 | 17,544 | 8,310 | 10,639 | 17,889 | ||||||||||||||||||||||
| Impairment charge(2) |
148,630 | — | — | — | 148,630 | — | ||||||||||||||||||||||
| Other operating expenses |
186,398 | 294,487 | 238,630 | 76,693 | 106,611 | 156,480 | ||||||||||||||||||||||
| Operating (loss) income |
(115,176 | ) | 32,978 | 23,853 | 19,907 | (137,238 | ) | 41,969 | ||||||||||||||||||||
| Interest expense, net |
28,047 | 35,120 | 30,524 | 16,990 | 13,332 | 31,705 | ||||||||||||||||||||||
| Write-off of debt issuance costs |
20 | 283 | 2,031 | — | — | 20 | ||||||||||||||||||||||
| Gain on extinguishment of debt |
(1,870 | ) | (16,532 | ) | — | — | (675 | ) | (1,195 | ) | ||||||||||||||||||
| Other expense (income) |
1,912 | (2,945 | ) | 940 | 226 | (276 | ) | 2,414 | ||||||||||||||||||||
| (Loss) income before taxes |
(143,285 | ) | 17,052 | (9,642 | ) | 2,691 | (149,619 | ) | 9,025 | |||||||||||||||||||
| Provision for (benefit from) income taxes |
37,249 | 4,940 | (2,079 | ) | (163 | ) | 36,910 | 176 | ||||||||||||||||||||
| Net (loss) income |
$ | (180,534 | ) | $ | 12,112 | $ | (7,563 | ) | $ | 2,854 | $ | (186,529 | ) | $ | 8,849 | |||||||||||||
| Net (loss) income per common share: |
||||||||||||||||||||||||||||
| Basic |
$ | (9.28 | ) | $ | 0.63 | $ | (0.39 | ) | $ | 0.14 | $ | (9.65 | ) | 0.45 | ||||||||||||||
| Diluted |
(9.28 | ) | 0.62 | (0.39 | ) | 0.13 | (9.65 | ) | 0.42 | |||||||||||||||||||
| Weighted average common shares outstanding: |
||||||||||||||||||||||||||||
| Basic |
19,449 | 19,379 | 19,336 | 19,880 | 19,331 | 19,668 | ||||||||||||||||||||||
| Diluted |
19,449 | 19,539 | 19,336 | 21,585 | 19,331 | 20,908 | ||||||||||||||||||||||
12
Table of Contents
| Year Ended December 31, | Six Months Ended June 30, |
Twelve Months Ended June 30, 2010 |
||||||||||||||||||||||||||
| (Dollars in thousands, except per share data) | 2009 | 2008 | 2007 | 2010 | 2009 | |||||||||||||||||||||||
| (unaudited) | (unaudited) | |||||||||||||||||||||||||||
| Other Financial Data(1) |
||||||||||||||||||||||||||||
| Cash paid for interest |
$ | 22,704 | $ | 30,690 | $ | 28,850 | $ | 15,563 | $ | 12,620 | $ | 25,647 | ||||||||||||||||
| Net cash provided by operating activities |
39,756 | 19,593 | 14,052 | (6,134 | ) | 22,498 | 11,124 | |||||||||||||||||||||
| Net cash provided by (used in) investing activities |
9,577 | (8,524 | ) | (63,399 | ) | (2,366 | ) | (611 | ) | 7,822 | ||||||||||||||||||
| Net cash (used in) provided by financing activities |
(50,515 | ) | (13,485 | ) | 52,194 | 5,759 | (25,756 | ) | (19,000 | ) | ||||||||||||||||||
| Consolidated EBITDA(3) |
51,550 | 58,040 | 48,635 | 31,283 | 24,384 | 58,449 | ||||||||||||||||||||||
| Pro forma cash paid for interest(4) |
||||||||||||||||||||||||||||
| Ratio of pro forma Consolidated EBITDA (as defined) to pro forma cash paid for interest |
||||||||||||||||||||||||||||
| Free cash flow (as defined)(5) |
39,067 | 11,150 | 9,889 | (8,500 | ) | 21,887 | 8,680 | |||||||||||||||||||||
| Other Operating Data(1) |
||||||||||||||||||||||||||||
| Number of terminals at end of period |
108 | 149 | 169 | 105 | 139 | |||||||||||||||||||||||
| Number of trailers operated at end of period |
6,410 | 7,115 | 7,506 | 6,478 | 6,586 | |||||||||||||||||||||||
| Number of tractors operated at end of period |
2,839 | 3,224 | 3,927 | 3,031 | 3,036 | |||||||||||||||||||||||
| Transportation billed miles (in thousands) |
108,302 | 136,234 | 154,340 | 58,396 | 53,484 | 113,214 | ||||||||||||||||||||||
| Balance Sheet Data (at end of period)(1) |
||||||||||||||||||||||||||||
| Working capital |
$ | 19,016 | $ | 44,967 | $ | 67,093 | $ | 35,263 | $ | 32,388 | ||||||||||||||||||
| Total assets |
279,616 | 502,103 | 493,976 | 291,700 | 295,685 | |||||||||||||||||||||||
| Total indebtedness, including current maturities |
321,284 | 362,586 | 349,271 | 331,185 | 341,954 | |||||||||||||||||||||||
| Shareholders’ (deficit) equity |
(140,736 | ) | 31,020 | 27,300 | (136,138 | ) | (154,568 | ) | ||||||||||||||||||||
| (1) | On December 17, 2007, we acquired 100% of the stock of Boasso. The results of Boasso have been included in our results since the date of the acquisition. |
| (2) | The impairment charge resulted from an impairment analysis of goodwill and intangible assets performed during the quarter ended June 30, 2009. Refer to Note 12 to the consolidated financial statements for the fiscal year ended December 31, 2009 included elsewhere in this prospectus. |
| (3) | Consolidated EBITDA in this prospectus corresponds to “Consolidated EBITDA” in the indentures governing our 2013 Senior Notes and our 2013 PIK Notes. Consolidated EBITDA is defined in the indentures as the net income (loss) before interest expense, provision for (benefit from) income taxes, depreciation and amortization, adverse insurance claims development, refinancing costs, gain on early debt extinguishment which includes the write-off of deferred financing charges, costs related to unconsummated financial transactions, gain on pension settlement, gain on asset sales, restructuring costs which includes corporate office relocation costs, impairment of goodwill and intangibles and employee non-cash compensation. We believe that financial information based on United States generally accepted accounting principles (“GAAP”) for highly leveraged businesses, such as ours, should be supplemented by Consolidated EBITDA so that investors better understand our financial information in connection with their analysis of our business. Consolidated EBITDA is a component of the measure used by our management to facilitate internal comparisons to competitors’ results and the bulk transportation industry in general. This measure is especially important given the recent trends of increased merger and acquisition activity and financial restructurings within the industry, which has led to significant variations among companies with respect to capital structures and cost of capital (which affect interest expense) and differences in taxation and book depreciation of facilities and equipment (which affect relative depreciation expense), including significant differences in the depreciable lives of similar assets among various companies, as well as non-operating and one-time charges to earnings, such as the effect of debt restructurings. Accordingly, Consolidated EBITDA allows analysts, investors and other interested parties in the bulk transportation industry to facilitate company |
13
Table of Contents
| to company comparisons by eliminating some of the foregoing variations. Consolidated EBITDA as used in this prospectus may not, however, be directly comparable to similarly titled measures reported by other companies due to differences in accounting policies and items excluded or included in the adjustments, which limits its usefulness as a comparative measure. Consolidated EBITDA is not a measure of financial performance or liquidity under GAAP. Consolidated EBITDA should not be considered in isolation or as a substitute for consolidated statement of income and cash flow data prepared in accordance with GAAP as an indication of our operating performance or liquidity. |
The following table presents the calculation of Consolidated EBITDA for the periods presented:
| Year Ended December 31, | Six Months Ended June 30, | Twelve Months
Ended June 30, 2010 |
||||||||||||||||||||||||||
| (Dollars in thousands) | 2009 | 2008 | 2007 | 2010 | 2009 | |||||||||||||||||||||||
| CONSOLIDATED EBITDA |
||||||||||||||||||||||||||||
| Net income (loss) |
$ | (180,534 | ) | $ | 12,112 | $ | (7,563 | ) | $ | 2,854 | $ | (186,529 | ) | $ | 8,849 | |||||||||||||
| Interest expense, net |
28,047 | 35,120 | 30,524 | 16,990 | 13,332 | 31,705 | ||||||||||||||||||||||
| Provision for (benefit from) income taxes |
37,249 | 4,940 | (2,079 | ) | (163 | ) | 36,910 | 176 | ||||||||||||||||||||
| Depreciation and amortization |
20,218 | 21,002 | 17,544 | 8,310 | 10,639 | 17,889 | ||||||||||||||||||||||
| EBITDA |
(95,020 | ) | 73,174 | 38,426 | 27,991 | (125,648 | ) | 58,619 | ||||||||||||||||||||
| Adverse insurance claims development |
— | — | 4,800 | — | — | |
— |
| ||||||||||||||||||||
| Refinancing costs |
2,323 | — | — | — | — | 2,323 | ||||||||||||||||||||||
| (Gain) loss on early debt extinguishment |
(1,850 | ) | (16,249 | ) | 2,031 | — | (675 | ) | (1,175 | ) | ||||||||||||||||||
| Costs related to unconsummated financial transactions |
— | — | 1,556 | — | — |
|
— |
| ||||||||||||||||||||
| Gain on pension settlement |
— | (3,410 | ) | — | — | — | — | |||||||||||||||||||||
| Gain on asset sales |
(7,130 | ) | (2,128 | ) | — | — | — | (7,130 | ) | |||||||||||||||||||
| Restructuring costs |
3,496 | 5,325 | 259 | 2,215 | 1,765 | 3,946 | ||||||||||||||||||||||
| Impairment of goodwill and intangibles |
148,630 | — | — | — | 148,630 | — | ||||||||||||||||||||||
| Employee non-cash compensation |
1,101 | 1,328 | 1,563 | 1,077 | 312 | 1,866 | ||||||||||||||||||||||
| Consolidated EBITDA |
$ | 51,550 | $ | 58,040 | $ | 48,635 | $ | 31,283 | $ | 24,384 | $ | 58,449 | ||||||||||||||||
| (4) | Pro forma cash paid for interest reflects adjustments to historic interest expense data to give effect to this offering and the application of the net proceeds as set forth in “Use of Proceeds” as if they occurred on January 1, 2009 using average interest rate calculations for the $15.0 million repayment of outstanding borrowings under the ABL Facility. |
| (5) | Free Cash Flow is used by management to evaluate the Company’s financial performance independent of cash used to maintain or expand its asset base. Net cash provided by operating activities is adjusted for capital expenditures net of proceeds from sales of property and equipment to arrive at Free Cash Flow. Free Cash Flow is not a measure of financial performance or liquidity under GAAP. Free Cash Flow should not be considered in isolation or as a substitute for the consolidated statement of income and cash flow data prepared in accordance with GAAP as an indication of the Company’s operating performance or liquidity. |
14
Table of Contents
The following table presents the calculation of Free Cash Flow for the periods presented:
| Year Ended December 31, | Six Months Ended June 30, | Twelve Months
Ended June 30, 2010 |
||||||||||||||||||||||||
| (Dollars in thousands) | 2009 | 2008 | 2007 | 2010 | 2009 | |||||||||||||||||||||
| FREE CASH FLOW |
||||||||||||||||||||||||||
| Net cash provided by (used in) operating activities |
$ | 39,756 | $ | 19,593 | $ | 14,052 | $ | (6,134 | ) | $ | 22,498 | $ | 11,124 | |||||||||||||
| Adjustments to cash from operating activities: |
||||||||||||||||||||||||||
| Net capital expenditures |
(689 | ) | (8,443 | ) | (4,163 | ) | (2,366 | ) | (611 | ) | (2,444 | ) | ||||||||||||||
| Free Cash Flow |
$ | 39,067 | $ | 11,150 | $ | 9,889 | $ | (8,500 | ) | $ | 21,887 | $ | 8,680 | |||||||||||||
15
Table of Contents
You should carefully consider the risks described below, in addition to the other information set forth or incorporated by reference in this prospectus, before investing in our common stock. Although the risks described below are all of the risks that we believe are material, they are not the only risks relating to our business. Additional risks and uncertainties not currently known to us or that we currently deem not to be material may also materially and adversely affect our business operations. Any of the following risks could materially adversely affect our business, financial condition or results of operations. In such case, you may lose all or part of your investment.
Risks Related to Our Business
Our business is subject to general and industry specific economic factors that are largely out of our control and could affect our operations and profitability.
Our business is dependent on various economic factors over which we have little control, that include:
| • | the availability of qualified drivers; |
| • | access to the credit and capital markets; |
| • | changes in regulations concerning shipment and storage of material we transport and depot; |
| • | increases in fuel prices, taxes and tolls; |
| • | interest rate fluctuations; |
| • | excess capacity in the tank trucking industry; |
| • | changes in license and regulatory fees; |
| • | potential disruptions at U.S. ports of entry; |
| • | downturns in customers’ business cycles; and |
| • | reductions in customers’ shipping requirements. |
As a result, we may experience periods of overcapacity, declining prices, lower profit margins and less availability of cash in the future. We have a large number of customers in the chemical-processing and consumer-goods industries. If these customers experience fluctuations in their business activity due to an economic downturn, work stoppages or other industry conditions, the volume of freight transported by us or container services provided by us on behalf of those customers may decrease. The volume of shipments of chemical products is, in turn, affected by many other industries and end use markets, including consumer and industrial products, paints and coatings, paper and packaging, agriculture and food products, and tends to vary with changing economic conditions.
The trucking industry, in general, has experienced a slowdown due to lower demand resulting from slowing economic conditions through 2008 and 2009, which, to a certain extent, has continued thus far in 2010.
Our debt agreements contain restrictions that could limit our flexibility in operating our business.
Our ABL Facility and the indentures governing the 2013 Senior Notes and the 2013 PIK Notes contain covenants that limit or prohibit our ability, among other things, to:
| • | incur or guarantee additional indebtedness or issue certain preferred shares; |
| • | redeem, repurchase, make payments on or retire subordinated indebtedness or make other restricted payments; |
| • | make certain loans, acquisitions, capital expenditures or investments; |
| • | sell certain assets, including stock of our subsidiaries; |
16
Table of Contents
| • | enter into sale and leaseback transactions; |
| • | create or incur liens; |
| • | consolidate, merge, sell, transfer or otherwise dispose of all or substantially all of our assets; and |
| • | enter into certain transactions with our affiliates. |
These covenants may prohibit or impair us from taking actions that we believe are best for our business. Furthermore, under the ABL Facility we may be required to satisfy and maintain specified financial ratios. Our ability to meet those financial ratios can be affected by events beyond our control, and we may not meet those ratios. In addition, covenants in our debt agreements limit our use of proceeds from our ordinary operations and from extraordinary transactions. These limits may require us to apply proceeds in a certain manner or prohibit us from utilizing the proceeds in our operations or from prepaying or retiring indebtedness that we desire.
A failure to comply with any of the covenants contained in the ABL Facility or our other indebtedness could result in an event of default, which, if not cured or waived, could have a material adverse effect on our business, financial condition and results of operations. In the event of any default, the lenders of the defaulted indebtedness:
| • | will not be required to lend any additional amounts to us under the ABL Facility; |
| • | could elect to declare all borrowings outstanding, together with accrued and unpaid interest and fees, to be due immediately and terminate all commitments to extend further credit; or |
| • | require us to apply all of our available cash to repay these borrowings. |
Such actions by the lenders could cause cross defaults under our other indebtedness. If we were unable to repay amounts under the ABL Facility, the lenders under the ABL Facility could proceed against the collateral granted to them to secure that indebtedness. If any of our indebtedness is accelerated, there can be no assurance that our assets would be sufficient to repay such indebtedness in full.
We have substantial indebtedness and may not be able to make required payments on our indebtedness.
At June 30, 2010, we had consolidated long-term indebtedness and capital lease obligations, including current maturities, of $331.2 million, most of which matures during the next five years. We must make regular payments under the ABL Facility and our capital leases, and semi-annual and quarterly interest payments under our outstanding notes. In addition, subject to certain conditions, we are required to make regular redemptions of our 2013 Senior Notes.
Our 2013 Senior Notes and 2013 PIK Notes issued in the quarter ended December 31, 2009 carry higher rates of interest and higher cash rates of interest than the notes for which they were exchanged. In addition, interest on amounts borrowed under our ABL Facility is variable and will increase as market rates of interest increase. Our higher interest expense may reduce our future profitability. Our future higher interest expense and future redemption obligations could have other important consequences with respect to our ability to manage our business successfully, including the following:
| • | it may make it more difficult for us to satisfy our obligations for our indebtedness, and any failure to comply with these obligations could result in an event of default; |
| • | using a portion of our cash flow to make interest or redemption payments on our indebtedness will reduce the availability of our cash flow to fund working capital, capital expenditures and other business activities; |
| • | it increases our vulnerability to adverse economic and industry conditions; |
| • | it limits our flexibility in planning for, or reacting to, changes in our business and the industry in which we operate; |
17
Table of Contents
| • | it may make us more vulnerable to further downturns in our business or the economy; and |
| • | it limits our ability to exploit business opportunities. |
The 9% Notes mature November 15, 2010. The ABL Facility matures June 18, 2013. However, the maturity date of the ABL Facility and our other debt maturing in 2013 may be accelerated if we default on our obligations. If the maturity of the ABL Facility and/or such other debt is accelerated, we do not believe that we will have sufficient cash on hand to repay the ABL Facility and/or such other debt or, unless conditions in the credit markets improve significantly, that we will be able to refinance the ABL Facility and/or such other debt on acceptable terms, or at all. The failure to repay or refinance the ABL Facility and/or such other debt at maturity will have a material adverse effect on our business and financial condition, would cause substantial liquidity problems and may result in the bankruptcy of us and/or our subsidiaries. Any actual or potential bankruptcy or liquidity crisis may materially harm our relationships with our customers, suppliers and affiliates.
Our ability to satisfy our interest, redemption and principal payment obligations will depend upon, among other things:
| • | our future financial and operating performance, which will be affected by many factors beyond our control; and |
| • | our future ability to borrow under the ABL Facility, the availability of which depends on, among other things, our complying with the covenants in the ABL Facility. |
We may not generate sufficient cash flow from operations, and we may not be able to draw under the ABL Facility, in an amount sufficient to fund our liquidity needs. If our cash flows and capital resources are insufficient to service our indebtedness or fund our operations, we may be forced to reduce or delay capital expenditures, sell assets, seek additional capital or restructure or refinance our indebtedness. Our ability to restructure or refinance our debt will depend on the condition of the capital markets and our financial condition at such time. Any refinancing of our debt could be at higher interest rates and may require us to comply with more onerous covenants, which could further restrict our business operations. If we are not able to refinance any of our indebtedness, sell assets or raise capital on commercially reasonable terms or at all or for sufficient proceeds, we could default on our obligations and impair our liquidity. Our inability to generate sufficient cash flow to satisfy our debt obligations or to refinance our obligations on commercially reasonable terms would have a material adverse effect on our business, financial condition, results of operations or cash flows.
Despite our substantial indebtedness, we may incur significantly more indebtedness, which could have a material adverse effect on our business, financial condition, results of operations or cash flows.
The ABL Facility and the indentures governing the 2013 Senior Notes and the 2013 PIK Notes contain restrictions on our ability to incur additional indebtedness. These restrictions are subject to a number of important qualifications and exceptions, and the indebtedness incurred in compliance with these restrictions could be substantial. Accordingly, we or our subsidiaries could incur significant additional indebtedness in the future. As of June 30, 2010, we had approximately $47.8 million available for additional borrowing under the ABL Facility, including a subfacility for letters of credit, and the covenants under our debt agreements would allow us to borrow a significant amount of additional indebtedness. Additional leverage could have a material adverse effect on our business, financial condition, results of operations or cash flows and could increase the risks described in “—Our debt agreements contain restrictions that could limit our flexibility in operating our business,” and “—We have substantial indebtedness and may not be able to make required payments on our indebtedness.”
The trucking industry is extremely competitive and fragmented.
The trucking industry is extremely competitive and fragmented. No single truckload carrier has a significant market share. We compete with many other truckload carriers of varying sizes, customers’ private fleets, and, to a lesser extent, with railroads, which may limit our growth opportunities and reduce profitability. Historically, competition has created downward pressure on the trucking industry’s pricing structure. Some trucking companies with which we compete have greater financial resources.
18
Table of Contents
We believe that the most significant competitive factor that impacts demand for our products is rates, and we may be forced to lower our rates based on our competitors’ pricing decisions, which would reduce our profitability. In fact, certain markets that we serve have experienced fierce price competition in recent years. This has been further magnified through the impact of the recent global economic recession as trucking companies have focused more on price to retain business and market share. With respect to certain aspects of our business, we also compete with intermodal transportation and railroads. Intermodal transportation has increased in recent years. Growth in such forms of transport could adversely affect our market share, net sales and profit margins. Competition from non-trucking modes of transportation and from intermodal transportation would likely increase if state or federal fuel taxes were to increase without a corresponding increase in taxes imposed upon other modes of transportation.
Additional trends include current and anticipated consolidation among our competitors which may cause us to lose market share as well as put downward pressure on pricing. Some of our competitors are larger, have greater financial resources and have less debt than we do. As a result, those competitors may be better able to withstand a change in conditions within our industry and in the economy as a whole. If we do not compete successfully, our operating margins, financial condition, cash flows and profitability could be adversely affected.
Our reliance upon affiliates and independent owner-operators could adversely affect our operations and profitability.
We rely heavily upon our independent affiliates and independent owner-operators to perform the services for which we contract with our customers. A reduction in the number of independent owner-operators, whether due to capital requirements related to the expense of obtaining, operating and maintaining equipment or for other reasons, could have a negative effect on our operations and profitability. Similarly the loss of one or more affiliates could adversely affect our profitability.
Contracts with affiliates are for various terms and contracts with independent owner-operators may be terminated by either party on short notice. Although affiliates and independent owner-operators are responsible for paying for their own equipment and other operating costs, significant increases in these costs could cause them to seek a higher percentage of the revenue generated if we are unable to increase our rates commensurately. A continued decline in the rates we pay to our affiliates and independent owner-operators could adversely affect our ability to retain our existing affiliates and independent owner-operators and attract new affiliates, independent owner-operators and drivers. Disagreements with affiliates or independent owner-operators as to payment or other terms, or the failure of a key affiliate to meet our contractual obligations or otherwise perform consistent with our requirements may require us to utilize alternative suppliers, in each case at potentially higher prices or with disruption of the services that we provide to our customers. If we fail to deliver loads on time or if the costs of our services increase, then our profitability and customer relationships could be harmed.
Although our affiliates and independent owner-operators have substantial contractual obligations to us, we do not control them. These affiliates and independent owner-operators typically utilize tractors and trailers bearing our tradenames and trademarks. To the extent that one of our affiliates or independent owner-operators are subject to negative publicity, it could reflect on us and have a material adverse effect on our business, brand, results of operations, cash flows or financial condition.
The loss of one or more significant customers may adversely affect our business.
We are dependent upon a limited number of large customers. Our top ten customers accounted for approximately 34% of our total revenues during 2009. The loss of one or more of our major customers, or a material reduction in the services we perform for such customers, may have a material adverse effect on our business, results of operations or financial condition.
19
Table of Contents
We are self-insured and have exposure to certain claims and are subject to the insurance marketplace, all of which could affect our profitability.
The primary accident risks associated with our business are:
| • | motor-vehicle related bodily injury and property damage; |
| • | workers’ compensation claims; |
| • | environmental pollution liability claims; |
| • | cargo loss and damage; and |
| • | general liability claims. |
We currently maintain insurance for:
| • | motor-vehicle related bodily injury and property damage claims, covering all employees, owner operators and affiliates; |
| • | workers’ compensation insurance coverage on our employees and company drivers; |
| • | environmental pollution liability claims; and |
| • | general liability claims. |
Our insurance program includes a self insured deductible of $2.0 million per incident for bodily injury and property damage and a $1.0 million deductible for workers’ compensation. In addition, we currently maintain insurance policies with a total limit of $40.0 million, of which $35.0 million is provided under an umbrella liability policy and $5.0 million is provided under a truckers’ liability policy. The $2.0 million deductible per incident could adversely affect our profitability, particularly in the event of an increase in the number or severity of incidents. Additionally, we are self-insured for damage to the equipment that we own and lease, as well as for cargo losses and such self-insurance is not subject to any maximum limitation. We also extend insurance coverage to our affiliates for (i) motor vehicle related bodily injury, (ii) property damage and (iii) cargo loss and damage. Under this extended coverage, affiliates are responsible for only a small portion of the applicable deductibles.
We are subject to changing conditions and pricing in the insurance marketplace and we cannot assure you that the cost or availability of various types of insurance may not change dramatically in the future. To the extent these costs cannot be passed on to our customers through increased freight rates, increases in insurance costs could reduce our future profitability and cash flow.
Changes in laws and regulations regarding health insurance benefits could adversely affect our cost of operations, employee relations and profitability.
The recently enacted federal healthcare reform legislation could significantly increase our employee costs by requiring us either to provide health insurance coverage to our employees or to pay certain penalties for electing not to provide such coverage. Because these new requirements are broad, complex, subject to certain phase-in rules and may be challenged by legal actions in the coming months and years, it is difficult to predict the ultimate impact that this legislation will have on our business and operating costs. We cannot assure you that this legislation or any alternative version that may ultimately be implemented will not materially increase our operating costs. This legislation could also adversely affect our employee relations and ability to compete for new employees if our response to this legislation is considered less favorable than the responses or health benefits offered by employers with whom we compete for talent.
The trucking industry is subject to regulation, and changes in trucking regulations may increase costs.
As a motor carrier, we are subject to regulation by the Federal Motor Carrier Safety Administration (“FMCSA”) and the U.S. Department of Transportation (“DOT”), and by various federal, state, and provincial agencies. These regulatory authorities exercise broad powers governing various aspects such as operating
20
Table of Contents
authority, safety, hours of service, hazardous materials transportation, financial reporting and acquisitions. There are additional regulations specifically relating to the trucking industry, including testing and specification of equipment, product-handling requirements and drug testing of drivers. We recently underwent a compliance review by the FMCSA in which we retained our satisfactory DOT safety rating. We anticipate a follow-up review in the near future, including with respect to issues identified in the recent review, which could result in the imposition of corrective action with which we would be required to comply. Beginning November 30, 2010, the FMCSA, for the first time, will rate individual driver safety performance inclusive of all driver violations over 3-year time periods under new regulations known as the Comprehensive Safety Analysis 2010 (“CSA”). CSA is an FMCSA initiative designed to provide motor carriers and drivers with attention from FMCSA and state partners about their potential safety problems with an ultimate goal of achieving a greater reduction in large truck and bus crashes, injuries, and fatalities. Prior to these regulations, only carriers were rated by the DOT and the rating only included out-of-service violations and ticketed offenses associated with out-of-service violations. Any downgrade in our DOT safety rating (as a result of these new regulations, any follow-up reviews or otherwise) could adversely affect our business.
The trucking industry is subject to possible regulatory and legislative changes that may affect the economics of the industry by requiring changes in operating practices, emissions or by changing the demand for common or contract carrier services or the cost of providing truckload services. Possible changes include:
| • | increasingly stringent environmental regulations, including changes intended to address climate change; |
| • | restrictions, taxes or other controls on emissions; |
| • | increasing control over the transportation of hazardous materials; |
| • | changes in the hours-of-service regulations, which govern the amount of time a driver may drive in any specific period; |
| • | electronic on-board recorders; |
| • | requirements leading to accelerated purchases of new trailers; |
| • | mandatory limits on vehicle weight and size; and |
| • | mandatory regulations imposed by the Department of Homeland Security. |
From time to time, various legislative proposals are introduced, including proposals to increase federal, state, or local taxes, including taxes on motor fuels and emissions, which may increase our operating costs, require capital expenditures or adversely impact the recruitment of drivers.
Restrictions on emissions or other climate change laws or regulations could also affect our customers that use significant amounts of energy or burn fossil fuels in producing or delivering the products we carry. We could also lose revenue if our customers divert business from us because we have not complied with their sustainability requirements.
Increased unionization could increase our operating costs or constrain operating flexibility.
Although only approximately 2.8% of our driver population, including independent owner-operators and employees of affiliates, was subject to collective bargaining agreements at June 30, 2010, unions such as the International Brotherhood of Teamsters have traditionally been active in the U.S. trucking industry. Unionized workers could disrupt our operations by strike, work stoppage or other slowdown. In addition, our non-union workforce has been subject to unionization efforts in the past, and we could be subject to future unionization. The potential for unionization could increase if the U.S. Congress passes proposed legislation called the Employee Free Choice Act in which unions can organize based on card check authorization rather than by secret ballot election. This proposed legislation also provides for third-party arbitration of collective bargaining agreements. Increased unionization of our workforce could result in higher compensation and working condition demands that could increase our operating costs or constrain our operating flexibility.
21
Table of Contents
Our operations involve hazardous materials, which could create environmental liabilities.
Our activities, particularly those relating to our handling, transporting and storage of bulk chemicals, are subject to environmental, health and safety laws and regulation by governmental authorities in the United States as well as foreign governmental authorities. Among other things, these environmental laws and regulations address emissions to the air, discharges on land and in water, the generation, handling, storage, transportation, treatment and disposal of waste materials, and the health and safety of our employees. These laws generally require us to obtain and maintain various licenses and permits. Most environmental laws provide for substantial fines and potential criminal sanctions for violations. Environmental, health and safety laws and regulations are complex, change frequently and have tended to become stricter over time. Some of these laws and regulations are subject to varying and conflicting interpretations. There can be no assurance that violations of such laws, regulations, permits or licenses will not be identified or occur in the future, or that such laws and regulations will not change in a manner that could impose material costs on us.
As a handler of hazardous substances, we are potentially subject to strict, joint and several liability for investigating and rectifying the consequences of spills and other environmental releases of these substances. We have incurred remedial costs and regulatory penalties for chemical or wastewater spills and releases at our facilities or over the road. As a result of environmental studies conducted at our facilities or at third party sites, we have identified environmental contamination at certain sites that will require remediation and we are currently conducting investigation and remediation projects at seven of our facilities. Future liabilities and costs under environmental, health, and safety laws are not easily predicted, and such liabilities could result in a material adverse effect on our financial condition, results of operations or business reputation.
In addition, we have been named a potentially responsible party at various sites under the Comprehensive Environmental Response Compensation and Liability Act of 1980 and other environmental regulatory programs. Our current reserves provided for these sites may prove insufficient, which would result in future charges against earnings. Further, we could be named a potentially responsible party at other sites in the future and the costs associated with such future sites could be material.
Potential disruptions at U.S. ports of entry could adversely affect our business, financial condition and results of operations.
Any disruption of the delivery of ISO tank containers to those ports where we do business would reduce the number of ISO tank containers that we transport, store, clean or maintain. This reduced activity may have a material adverse effect on our business, results of operations or financial condition.
If fuel prices increase significantly, our results of operations could be adversely affected.
We are subject to risk with respect to purchases of fuel. Prices and availability of petroleum products are subject to political, economic and market factors that are generally outside our control. Political events in the Middle East, Venezuela, and elsewhere, as well as hurricanes and other weather-related events, and current and future market-based (cap-and-trade) greenhouse gas emissions control mechanisms, also may cause the price of fuel to increase. Because our operations are dependent upon diesel fuel, significant increases in diesel fuel costs could materially and adversely affect our results of operations and financial condition if we are unable to pass increased costs on to customers through rate increases or fuel surcharges. Historically, we have recovered the majority of the increases in fuel prices from customers through fuel surcharges. Fuel surcharges that can be collected may not always fully offset the increase in the cost of diesel fuel. To the extent fuel surcharges are insufficient to offset our fuel costs or we are unable to continue passing on increased fuel costs to our customers, our results of operations may be adversely affected.
The loss of qualified drivers or other personnel could limit our growth and negatively affect operations.
During periods of high trucking volumes, there is substantial competition for qualified drivers in the trucking industry. Regulatory requirements, including CSA (discussed above), and an improvement in the
22
Table of Contents
economy could reduce the number of eligible drivers. Furthermore, certain geographic areas have a greater shortage of qualified drivers than other areas. We operate in many of the geographic areas where there have been driver shortages in the past and have turned down new business opportunities as a result of the lack of qualified new drivers. We expect this to occur again as the economy begins to improve. Difficulty in attracting qualified personnel, particularly qualified drivers, could require us to increase driver compensation, forego available customer opportunities and underutilize the tractors and trailers in our network. These actions could result in increased costs and decreased revenues. In addition, we may not be able to recruit other qualified personnel in the future.
Our business may be harmed by terrorist attacks, future wars or certain types of security measures.
In the aftermath of the terrorist attacks of September 11, 2001, federal, state and municipal authorities have implemented and are continuing to implement various security measures, including checkpoints and travel restrictions on large trucks and fingerprinting of drivers in connection with new hazardous materials endorsements on their licenses. Such existing measures and future measures may have significant costs associated with them which a motor carrier is forced to bear. Moreover, large trucks carrying toxic chemicals are potential terrorist targets, and we may be obligated to take measures, including possible capital expenditures intended to protect our trucks. In addition, the insurance premiums charged for some or all of the coverage currently maintained by us could continue to increase dramatically or such coverage could be unavailable in the future.
We depend on members of our senior management.
We believe that our ability to successfully implement our business strategy and to operate profitably depends in large part on the continued employment of our senior management team. If members of senior management become unable or unwilling to continue in their present positions, our business or financial results could be adversely affected.
Our long-lived assets are subject to potential asset impairment.
At June 30, 2010, goodwill and other intangible assets represented approximately $44.7 million, or approximately 15.3% of our total assets and approximately 24.6% of our non-current assets, the carrying value of which may be reduced if we determine that those assets are impaired. In addition, net property and equipment totaled approximately $122.2 million, or approximately 41.9% of our total assets.
We review for potential goodwill impairment on an annual basis as part of our goodwill impairment testing in the second quarter of each year with a measurement date of June 30, and more often if a triggering event or circumstance occurs making it likely that impairment exists. In addition, we test for the recoverability of long-lived assets at year end, and more often if an event or circumstance indicates the carrying value may not be recoverable. We conduct impairment testing based on our current business strategy in light of present industry and economic conditions, as well as future expectations.
The annual goodwill impairment review performed as of June 30, 2010 resulted in no impairment. The annual goodwill impairment review performed in June 2009 indicated there was goodwill impairment. As a result of the analysis, we concluded that a total impairment charge to goodwill of $146.2 million was necessary at June 30, 2009, of which $144.3 million was related to our trucking segment, eliminating 100% of the carrying amount of goodwill of that segment, and $1.9 million was related to our container services segment.
If there are changes to the methods used to allocate carrying values, if management’s estimates of future operating results change, if there are changes in the identified reporting units or if there are changes to other significant assumptions, the estimated carrying values and the estimated fair value of our goodwill could change significantly, and could result in future impairment charges, which could materially impact our results of operations and financial condition.
23
Table of Contents
We may be unable to successfully realize all of the intended benefits from future acquisitions, and we may be unable to identify or realize the intended benefits of potential future acquisition candidates.
We may be unable to realize all of the intended benefits of any future acquisitions. As part of our business strategy, we will evaluate potential future acquisitions, some of which could be material, and engage in discussions with acquisition candidates. We cannot assure you that suitable acquisition candidates will be identified and acquired in the future, that the financing of any such acquisition will be available on satisfactory terms, that we will be able to complete any such acquisition or that we will be able to accomplish our strategic objectives as a result of any such acquisition. Nor can we assure you that our acquisition strategies will be viewed positively by customers or achieve their intended benefits. Often acquisitions are undertaken to improve the operating results of either or both of the acquirer and the acquired company and we cannot assure you that we will be successful in this regard. We will encounter various risks in acquiring other companies, including the possible inability to integrate an acquired business into our operations, diversion of management’s attention and unanticipated problems or liabilities, some or all of which could have a material adverse effect on our business, financial condition, results of operations or cash flows.
Our restructuring involves risks to our business operations and may not reduce our costs.
During 2008 and 2009, and continuing into 2010, we eliminated non-driver positions, consolidated and closed under-performing company terminals, implemented certain contract terminations, transitioned company-owned terminals to affiliates and took other measures intended to reduce future costs. These steps have placed, and will continue to place, pressures on our management, administrative and operational infrastructure as well as on our results of operations. Employees that departed in connection with the restructuring possessed knowledge of our business, skills and relationships with our customers, affiliates, drivers and other employees that were not replaced. As a result, our remaining employees may be required to serve new operational roles in which they have limited experience, which may reduce employee satisfaction and productivity. New relationships may also reduce customer, affiliate or driver satisfaction. Additionally, our restructuring plans and related efforts may divert management’s and other employee’s attention from other business concerns.
Due to the restructuring, we took pre-tax charges in 2008 and 2009, which represent severance-related costs and costs associated with lease and contract terminations. The majority of these costs were cash expenditures paid during 2008 and 2009 or costs that we expect to pay in the future. Actual costs may exceed our estimates, and we have taken and expect to continue to take additional charges in 2010. Furthermore, we have formulated this restructuring plan with the goal of reducing our future operating expenses. Our future operating expenses may not be reduced as we expect, or reductions may be offset in the future by other expenses.
In addition, risks and uncertainties associated with implementation of the restructuring plan that are not currently known to us or that we currently deem to be immaterial may also materially adversely affect our business, financial condition and/or operating results.
Risks Related to our Common Stock and the Offering
We have a single shareholder who can substantially influence the outcome of all matters voted upon by our shareholders and prevent actions which a shareholder may otherwise view favorably.
As of June 30, 2010, Apollo and its affiliated funds owned or controlled approximately 48.9% of our outstanding common stock. As a result, Apollo can influence substantially all matters requiring shareholder approval, including the election of directors, the approval of significant corporate transactions, such as acquisitions, the ability to block an unsolicited tender offer and any other matter requiring a vote of shareholders. Although Apollo’s beneficial ownership is currently below 50% and will be further reduced by our issuance and sale of common stock pursuant to this offering, Apollo is still expected to be our largest shareholder. Four of our board members are partners or officers of Apollo. This concentration of ownership could delay, defer or prevent a change in control of our Company or impede a merger, consolidation, takeover or other business combination that a shareholder may otherwise view favorably.
24
Table of Contents
Following the consummation of this offering, we will no longer be a “controlled company” for the purposes of the NASDAQ Global Market’s corporate governance requirements and therefore we will be subject to the NASDAQ rule requiring that at least a majority of the board of directors is comprised of “independent” directors. We do not anticipate that this will require us to change the composition of our Board of Directors because the majority of our Board of Directors is currently composed of independent directors under the NASDAQ rules.
Our ability to issue “blank check” preferred stock and Florida law may prevent a change in control of our company that a shareholder may consider favorable.
Provisions of our articles of incorporation and Florida law may discourage, delay or prevent a change in control of our Company that a shareholder may consider favorable. These provisions include:
| • | authorization of the issuance of “blank check” preferred stock that could be issued by our Board of Directors to increase the number of outstanding shares in order to control a takeover attempt which the Board viewed unfavorably; |
| • | elimination of the voting rights of shareholders with respect to shares that are acquired without prior Board approval that would otherwise entitle such shareholder to exercise certain amounts of voting power in the election of directors; and |
| • | prohibition on business combinations with interested shareholders unless particular conditions are met. |
As a result, these provisions could limit the price that investors are willing to pay in the future for shares of our common stock.
You will suffer immediate and substantial dilution.
Purchasers of our common stock in this offering will experience immediate and substantial dilution in the net tangible book value of their common stock. At the public offering price of $ per share, you will incur dilution in the amount of $ per share. As of June 30, 2010, we also had outstanding stock options to purchase 2.2 million shares of our common stock at a weighted average exercise price of $4.88 per share and outstanding warrants to purchase 445,929 shares of our common stock at an exercise price of $0.01 per share. To the extent these options and warrants are exercised there will be further dilution.
Future sales and issuances of our common stock in the public market may depress our stock price and result in dilution.
The market price of our common stock could decline as a result of sales by our existing shareholders of a large number of shares of our common stock. These sales might also make it more difficult for us to sell additional equity securities at a time and price that we deem appropriate. As of June 30, 2010, there are approximately 21.5 million shares of common stock outstanding. Approximately 11.7 million shares of common stock as of June 30, 2010, are “restricted securities” as defined in Rule 144 under the Securities Act of 1933 or are held by affiliates.
In connection with this offering, Apollo and our directors and executive officers have entered into lock-up agreements described under “Underwriting” that expire 90 days after the date of this prospectus, subject to extension in certain circumstances. After these lock-up agreements have expired, subject to any applicable holding periods and volume limitations, these shares will become eligible for sale in the public market under Rule 144 or Rule 701 of the Securities Act. In addition, Apollo will have the ability to cause us to register the resale of their shares and certain of our current and former management members who hold shares will have the ability to include their shares in the registration. The market price of shares of our common stock may drop significantly when the restrictions on resale by these stockholders lapse.
In addition, as of June 30, 2010, we have 3.1 million shares of common stock available for issuance under our stock option plan. As of June 30, 2010, there were outstanding options for 2.2 million shares and outstanding
25
Table of Contents
warrants for 445,929 shares of our common stock. Exercise of the warrants and of options that are in-the-money will result in dilution to existing shareholders in an amount equal to the difference in the market and exercise prices multiplied by the number of shares exercised. In addition, prior to their exercise, these options and warrants may depress the market price for our common stock.
We currently do not intend to pay dividends on our common stock.
We do not expect to pay dividends on our common stock in the foreseeable future. In addition, the ABL Facility and indentures governing our 2013 Senior Notes and 2013 PIK Notes contain certain restrictions on our ability to pay dividends on our common stock. Accordingly, the price of our common stock must appreciate in order to realize a gain on one’s investment. This may not occur.
Our ability to use U.S. net operating loss carryforwards might be limited.
Depending on the size of this offering, the offering may result in an ownership change for purposes of applying the limitation on the ability to use net operating losses set forth in section 382 of the of the Internal Revenue Code of 1986, as amended (the “Code”). As of December 31, 2009, we had federal net operating loss carryforwards of $95.7 million. Even if an ownership change were to result from this offering such that section 382 of the Code were to impose an annual limitation on the use of our net operating loss carryforwards, we believe our net operating loss carryforwards would be sufficiently available, for federal income tax purposes, to offset our regular taxable income. Accordingly, although our net operating loss carryforwards might be limited as a result of an ownership change, we do not believe that the limitation would materially affect our after-tax cash flow.
26
Table of Contents
FORWARD-LOOKING STATEMENTS AND CERTAIN CONSIDERATIONS
This prospectus contains forward-looking statements within the meaning of the Securities Act of 1933 and the Securities Exchange Act of 1934, as amended, or the Exchange Act, and the Private Securities Litigation Reform Act of 1995. All statements included in this prospectus that address activities, events or developments that we or our management expect, believe or anticipate will or may occur in the future, are forward-looking statements. These statements represent our reasonable judgment on the future based on various factors and using numerous assumptions and are subject to known and unknown risks, uncertainties and other factors that could cause our actual results and financial position to differ materially. We claim the protection of the safe harbor for forward-looking statements provided in the Private Securities Litigation Reform Act of 1995, Section 27A of the Securities Act and Section 21E of the Exchange Act. Examples of forward-looking statements include: (i) projections of revenue, earnings, capital structure and other financial items, (ii) statements of our plans and objectives, (iii) statements of expected future economic performance, and (iv) assumptions underlying statements regarding us or our business. Forward-looking statements can be identified by, among other things, the use of forward-looking language, such as “believes,” “expects,” “estimates,” “may,” “will,” “should,” “could,” “seeks,” “plans,” “intends,” “anticipates” or “scheduled to” or the negatives of those terms, or other variations of those terms or comparable language, or by discussions of strategy or other intentions.
Forward-looking statements are subject to known and unknown risks, uncertainties and other factors that could cause our actual results to differ materially from those contemplated by the statements. The forward-looking information is based on various factors and was derived using numerous assumptions. Important factors that could cause our actual results to be materially different from the forward-looking statements include the risks and other factors discussed in this prospectus under the heading “Risk Factors” and our Annual Report on Form 10-K for the fiscal year ended December 31, 2009, our Quarterly Report on Form 10-Q for the period ended March 31, 2010 and our Quarterly Report on Form 10-Q for the period ended June 30, 2010, each of which is incorporated herein by reference. Some of these factors include:
| • | the effect of local and national economic, credit and capital market conditions on the economy in general, and on the particular industries in which we operate; |
| • | turmoil in credit and capital markets; |
| • | access to available and reasonable financing on a timely basis; |
| • | availability and price of diesel fuel; |
| • | adverse weather conditions; |
| • | competition and rate fluctuations; |
| • | our substantial leverage and restrictions contained in our debt arrangements and interest rate fluctuations in our floating rate indebtedness; |
| • | the cyclical nature of the transportation industry due to various economic factors such as excess capacity in the industry, the availability of qualified drivers, changes in fuel and insurance prices, interest rate fluctuations, and downturns in customers’ business cycles and shipping requirements; |
| • | potential disruption at U.S. ports of entry; |
| • | our substantial dependence on affiliates and independent owner-operators and our ability to attract and retain drivers; |
| • | the loss of one or more of our major customers or a material reduction in the services we perform for such customers; |
| • | our ability to effectively manage terminal operations that are converted from company-operated to affiliate; |
| • | changes in the future, or our inability to comply with, governmental regulations and legislative changes affecting the transportation industry; |
27
Table of Contents
| • | our ability to comply with current and future environmental regulations and the increasing costs relating to environmental compliance including those relating to the control of greenhouse gas emissions, such as market-based (cap-and-trade) mechanisms; |
| • | our liability as a self-insurer to the extent of our deductibles, as well as our ability or inability to reduce our claims exposure through insurance due to changing conditions and pricing in the insurance marketplace; |
| • | the cost of complying with existing and future anti-terrorism security measures enacted by federal, state and municipal authorities; |
| • | the potential loss of our ability to use net operating losses to offset future income; |
| • | increased unionization, which could increase our operating costs or constrain operating flexibility; |
| • | changes in senior management; |
| • | our ability to successfully manage workforce restructurings; |
| • | our ability to successfully identify acquisition opportunities, consummate such acquisitions and integrate acquired businesses; |
| • | potential future impairment charges; |
| • | changes in planned or actual capital expenditures due to operating needs, changes in regulation, covenants in our debt arrangements and other expenses, including interest expenses; and |
| • | the interests of Apollo, which controls our largest shareholder, which may conflict with your interests. |
In addition, there may be other factors that could cause our actual results to be materially different from the results referenced in the forward-looking statements. For example, the cost estimates and expected cost savings for our recent reduction in workforce were determined based upon the operating information and upon certain assumptions that we believe to be reasonable. The estimates are subject to a number of assumptions, which depend upon the actions of persons other than us or other factors beyond our control.
All forward-looking statements contained in this prospectus are qualified in their entirety by this cautionary statement. Forward-looking statements speak only as of the date they are made, and we do not intend to update or otherwise revise the forward-looking statements to reflect events or circumstances after the date of this prospectus or to reflect the occurrence of unanticipated events. If we do update one or more forward-looking statements, no inference should be made that we will make additional updates with respect to those or other forward-looking statements.
28
Table of Contents
We estimate that the net proceeds of this offering to us will be approximately $ million or $ million if the underwriters exercise their over-allotment option in full, after deducting the underwriting discounts and commissions and our estimated offering expenses. We intend to use $15.0 million of the net proceeds from our sale of shares in this offering to repay outstanding borrowings under the ABL Facility (without reducing commitments). We intend to use the remainder of such proceeds to retire a portion of our outstanding notes, either through redemption at par, plus accrued and unpaid interest, or opportunistically at prices below par, through tender offers and/or open market repurchases. Pending such use of the remainder of the proceeds, we may temporarily further repay outstanding borrowings under the ABL Facility.
The ABL Facility bears interest at a rate equal to an applicable margin plus, at our option, either a base rate or LIBOR. The applicable margin for borrowings under the current asset tranche at June 30, 2010 was 1.00% with respect to base rate borrowings and 2.00% with respect to LIBOR borrowings. The applicable margin for borrowings under the fixed asset tranche at June 30, 2010 was 1.25% with respect to base rate borrowings and 2.25% with respect to LIBOR borrowings. The interest rate on the ABL Facility at June 30, 2010 and 2009 was 2.6% and 2.4%, respectively. The 9% Notes pay interest semiannually on May 15 and November 15. Interest accrues at 9% per annum. We may redeem all or any portion of the 9% Notes upon not less than 30, nor more than 60, days’ notice at 100% of the principal amount plus accrued and unpaid interest, if any, to the date of redemption. The 2012 Notes pay interest quarterly on January 15, April 15, July 15, and October 15. Interest accrues at a floating rate per annum, reset quarterly, equal to LIBOR plus 4.5%. The interest rate on the 2012 Notes at June 30, 2010 and 2009 was 4.8% and 5.6%, respectively. We may redeem all or any portion of the 2012 Notes upon not less than 30, nor more than 60, days’ notice at 100% of the principal amount plus accrued and unpaid interest, if any, to the date of redemption. The 2013 Senior Notes pay interest semiannually on June 1 and December 1. Interest accrues at 10% per annum. We may redeem all or any portion of the 2013 Senior Notes upon not less than 30, nor more than 60, days’ notice at 100% of the principal amount plus accrued and unpaid interest, if any, to the date of redemption. The 2013 PIK Notes pay interest quarterly on February 1, May 1, August 1 and November 1. Interest accrues at 11.75% per annum, of which 9% is payable in cash and 2.75% is payable by increasing the outstanding principal amount of the 2013 PIK Notes by the amount of such interest. The 2013 PIK Notes are redeemable as of October 15, 2010 at a redemption price of 100% of the principal amount thereof, plus accrued and unpaid interest, if any, through the date of redemption. Depending on market conditions, we may elect to offer to repurchase the 2013 PIK Notes prior to such redemption date.
We have not paid dividends on our common stock and we do not intend to pay any dividends on our common stock in the foreseeable future. We currently intend to retain our future earnings, if any, to repay debt or to finance the further expansion and continued growth of our business. Additionally, the ABL Facility and the indentures governing our 2013 Senior Notes and our 2013 PIK Notes limit QDI’s ability to pay dividends on its common stock. Future dividends, if any, will be determined by our Board of Directors.
29
Table of Contents
Our common stock is traded on The NASDAQ Global Market under the symbol “QLTY.” The table below sets forth the quarterly high and low sale prices for our common stock as reported by The NASDAQ Global Market.
| High | Low | |||||
| 2010 |
||||||
| First Quarter |
$ | 6.19 | $ | 3.71 | ||
| Second Quarter |
8.18 | 5.05 | ||||
| Third Quarter (through September 9, 2010) |
7.14 | 4.60 | ||||
| 2009 |
||||||
| First Quarter |
$ | 3.23 | $ | 1.25 | ||
| Second Quarter |
2.30 | 1.62 | ||||
| Third Quarter |
4.51 | 1.82 | ||||
| Fourth Quarter |
4.20 | 3.15 | ||||
| 2008 |
||||||
| First Quarter |
$ | 5.17 | $ | 2.57 | ||
| Second Quarter |
4.00 | 2.42 | ||||
| Third Quarter |
4.90 | 2.22 | ||||
| Fourth Quarter |
4.28 | 1.22 | ||||
As of September 2, 2010, there were approximately 82 record holders of our common stock.
30
Table of Contents
The following table sets forth our consolidated cash and cash equivalents and capitalization as of June 30, 2010 on an actual basis, and on an as adjusted basis to give effect to the issuance of shares of our common stock in this offering at an assumed price of $ per share (the last reported sale price of our common stock on , 2010), the write-off of debt issuance costs related to the redemption of a portion of the 2013 Senior Notes (based on assumptions described in footnote (1) below), and the application of the net proceeds of the offering applied as described in “Use of Proceeds,” after deducting underwriting discounts and commissions and estimated offering expenses. You should read this table in conjunction with our consolidated financial statements, including the notes thereto, appearing elsewhere in this prospectus, as well as “Selected Historical Financial and Other Data,” “Use of Proceeds” and “Management’s Discussion and Analysis of Financial Condition and Results of Operations,” appearing elsewhere in this prospectus.
| As of
June 30, 2010 | |||||||
| (in thousands) | Actual | As Adjusted(1) | |||||
| Cash and cash equivalents |
$ | 2,892 | $ | ||||
| Debt: |
|||||||
| Borrowings under ABL Facility |
$ | 79,500 | |||||
| 9% Senior Subordinated Notes, due 2010 |
16,031 | ||||||
| Senior Floating Rate Notes, due 2012 |
501 | ||||||
| 10% Senior Notes, due 2013(2) |
134,499 | ||||||
| 11.75% Senior Subordinated PIK Notes, due 2013(2) |
82,331 | ||||||
| Capital Lease obligations |
14,157 | ||||||
| Other Notes payable |
11,679 | ||||||
| Total debt, including current maturities |
338,698 | ||||||
| Total shareholders’ (deficit) equity |
(136,138 | ) | |||||
| Total capitalization |
$ | 202,560 | $ | ||||
| (1) | In connection with the application of the net proceeds of the offering, we have assumed that $15.0 million of such proceeds are applied to repay outstanding borrowings under the ABL Facility (without reducing commitments), and the remainder is applied to redeem a portion of the 2013 Senior Notes at 100% of principal amount plus accrued and unpaid interest (which would result in a $ write-off of unamortized debt issuance costs related thereto), although such remaining proceeds may be applied differently as described in “Use of Proceeds.” Notwithstanding the foregoing, we intend to opportunistically apply such proceeds to retire a portion of our outstanding notes (including our 2013 Senior Notes) at prices below 100%, whether through tender offer and/or open market repurchases. Pending such use of the remainder of the proceeds, we may temporarily further repay outstanding borrowings under the ABL Facility. See “Use of Proceeds.” |
| (2) | Amounts do not include the remaining aggregate unamortized original issue discount of $7.5 million. |
31
Table of Contents
SELECTED HISTORICAL FINANCIAL AND OTHER DATA
The following table presents, as of the dates and for the periods indicated, our selected historical financial and other data. The historical statement of operations data for the fiscal years ended December 31, 2009, 2008 and 2007 and the historical balance sheet data as of December 31, 2009 and 2008 are derived from, and should be read in conjunction with, the audited consolidated financial statements and related notes included elsewhere in this prospectus. The historical statement of operations data for the fiscal years ended December 31, 2006 and 2005 and the historical balance sheet data as of December 31, 2007, 2006 and 2005 are also derived from our audited financial statements not included or incorporated by reference into this prospectus. The historical statement of operations data for the six months ended June 30, 2010 and June 30, 2009 and the historical balance sheet data as of June 30, 2010 and June 30, 2009 are derived from our unaudited financial statements included elsewhere in this prospectus. The unaudited financial statements have been prepared on the same basis as the audited financial statements and, in the opinion of management, include all adjustments, consisting only of normal recurring adjustments, necessary to present fairly the data for the period. The results of operations for the interim period are not necessarily indicative of the operating results for the entire year or any future period.
The information contained in this table should also be read in conjunction with “Capitalization” and “Management’s Discussion and Analysis of Financial Condition and Results of Operations,” appearing elsewhere in this prospectus.
32
Table of Contents
| Years Ended December 31, | Six Months Ended June 30, |
|||||||||||||||||||||||||||||
| (Dollars in thousands, except per-share amounts) |
2009 | 2008 | 2007 | 2006 | 2005 | 2010 | 2009 | |||||||||||||||||||||||
| (Unaudited) | ||||||||||||||||||||||||||||||
| Statement of Operations Data(1) |
||||||||||||||||||||||||||||||
| Operating revenues |
$ | 613,609 | $ | 815,290 | $ | 751,558 | $ | 730,159 | $ | 678,076 | $ | 338,885 | $ | 299,518 | ||||||||||||||||
| Operating expenses: |
||||||||||||||||||||||||||||||
| Purchased transportation |
373,539 | 466,823 | 471,531 | 493,686 | 471,238 | 233,975 | 170,876 | |||||||||||||||||||||||
| Depreciation and amortization |
20,218 | 21,002 | 17,544 | 16,353 | 17,278 | 8,310 | 10,639 | |||||||||||||||||||||||
| Impairment charge(2) |
148,630 | — | — | — | — | — | 148,630 | |||||||||||||||||||||||
| Other operating expenses |
186,398 | 294,487 | 238,630 | 171,842 | 149,741 | 76,693 | 106,611 | |||||||||||||||||||||||
| Operating (loss) income |
(115,176 | ) | 32,978 | 23,853 | 48,278 | 39,819 | 19,907 | (137,238 | ) | |||||||||||||||||||||
| Interest expense, net |
28,047 | 35,120 | 30,524 | 29,388 | 26,712 | 16,990 | 13,332 | |||||||||||||||||||||||
| Write-off debt issuance costs |
20 | 283 | 2,031 | — | 1,110 | — | — | |||||||||||||||||||||||
| Gain on debt extinguishment |
(1,870 | ) | (16,532 | ) | — | — | — | — | (675 | ) | ||||||||||||||||||||
| Other expense (income) |
1,912 | (2,945 | ) | 940 | 888 | (222 | ) | 226 | (276 | ) | ||||||||||||||||||||
| (Loss) income before taxes |
(143,285 | ) | 17,052 | (9,642 | ) | 18,002 | 12,219 | 2,691 | (149,619 | ) | ||||||||||||||||||||
| Provision for (benefit from) income taxes |
37,249 | 4,940 | (2,079 | ) | (38,168 | ) | 352 | (163 | ) | 36,910 | ||||||||||||||||||||
| Net (loss) income |
(180,534 | ) | 12,112 | (7,563 | ) | 56,170 | 11,867 | $ | 2,854 | $ | (186,529 | ) | ||||||||||||||||||
| Net (loss) income per common share: |
||||||||||||||||||||||||||||||
| Basic |
$ | (9.28 | ) | $ | 0.63 | $ | (0.39 | ) | $ | 2.97 | $ | 0.63 | $ | 0.14 | $ | (9.65 | ) | |||||||||||||
| Diluted |
(9.28 | ) | 0.62 | (0.39 | ) | 2.87 | 0.61 | 0.13 | (9.65 | ) | ||||||||||||||||||||
| Weighted average common shares outstanding: |
||||||||||||||||||||||||||||||
| Basic |
19,449 | 19,379 | 19,336 | 18,920 | 18,934 | 19,880 | 19,331 | |||||||||||||||||||||||
| Diluted |
19,449 | 19,539 | 19,336 | 19,571 | 19,301 | 21,585 | 19,331 | |||||||||||||||||||||||
| Other Data(1) |
||||||||||||||||||||||||||||||
| Net cash provided by (used in) operating activities |
$ | 39,756 | $ | 19,593 | $ | 14,052 | $ | 28,236 | $ | 9,039 | $ | (6,134 | ) | $ | 22,498 | |||||||||||||||
| Net cash provided by (used in) investing activities |
9,577 | (8,524 | ) | (63,399 | ) | (10,591 | ) | (16,063 | ) | (2,366 | ) | (611 | ) | |||||||||||||||||
| Net cash (used in) provided by financing activities |
(50,515 | ) | (13,485 | ) | 52,194 | (12,474 | ) | 5,858 | 5,759 | (25,756 | ) | |||||||||||||||||||
| Number of terminals at end of period |
108 | 149 | 169 | 165 | 165 | 105 | 139 | |||||||||||||||||||||||
| Number of trailers operated at end of period |
6,410 | 7,115 | 7,506 | 7,769 | 7,461 | 6,478 | 6,586 | |||||||||||||||||||||||
| Number of tractors operated at end of period |
2,839 | 3,224 | 3,927 | 3,829 | 3,539 | 3,031 | 3,036 | |||||||||||||||||||||||
| Balance Sheet Data at Year End(1) |
||||||||||||||||||||||||||||||
| Working capital |
$ | 19,016 | $ | 44,967 | $ | 67,093 | $ | 59,673 | $ | 43,079 | $ | 35,263 | $ | 32,388 | ||||||||||||||||
| Total assets |
279,616 | 502,103 | 493,976 | 417,873 | 377,053 | 291,700 | 295,685 | |||||||||||||||||||||||
| Total indebtedness, including current maturities |
321,284 | 362,586 | 349,271 | 279,122 | 289,116 | 331,185 | 341,954 | |||||||||||||||||||||||
| Shareholders’ (deficit) equity |
(140,736 | ) | 31,020 | 27,300 | 31,774 | (27,462 | ) | (136,138 | ) | (154,568 | ) | |||||||||||||||||||
| (1) | On December 17, 2007, we acquired 100% of the stock of Boasso. The results of Boasso have been included in our results since the date of the acquisition. |
| (2) | The impairment charge resulted from an impairment analysis of goodwill and intangible assets performed during the quarter ended June 30, 2009. Refer to Note 12 to the audited consolidated financial statements for the fiscal year ended December 31, 2009 included elsewhere in this prospectus. |
33
Table of Contents
MANAGEMENT’S DISCUSSION AND ANALYSIS OF FINANCIAL CONDITION
AND RESULTS OF OPERATIONS
The following discussion of our results of operations and financial condition should be read in conjunction with the audited consolidated financial statements and the related notes for the fiscal year ended December 31, 2009, and the unaudited consolidated financial statements and the related notes for the six months ended June 30, 2010 included elsewhere in this prospectus. The following discussion includes forward-looking statements. For a discussion of important factors that could cause actual results to differ from results discussed in the forward-looking statements, see “Forward Looking Statements and Certain Considerations.”
Overview
We operate the largest chemical bulk tank truck network in North America through our wholly owned subsidiary, QCI, and are the largest North American provider of intermodal tank container and depot services through our wholly owned subsidiary Boasso.
Trucking Services
The bulk tank truck market in North America includes all products shipped by bulk tank truck carriers and consists primarily of liquid and dry bulk chemicals (including plastics) and bulk dry and liquid food-grade products. We primarily transport a broad range of chemical products and provide our customers with logistics and other value-added services. We are a core carrier for many of the major companies engaged in chemical processing, including Ashland, BASF, Dow, DuPont, ExxonMobil, Georgia-Pacific, Honeywell, PPG Industries, Procter & Gamble, Sunoco and Unilever, and we provide services to most of the top 100 chemical producers with United States operations. We believe the diversity of our customer base, geography and end-markets provides a competitive advantage.
Our transportation revenue is a function of the volume of shipments by the bulk chemical industry, prices, the average number of miles driven per load, our market share and the allocation of shipments between tank truck transportation and other modes of transportation such as rail. The volume of shipments of chemical products is, in turn, affected by many other industries and end use markets, including consumer and industrial products, paints and coatings, paper and packaging, agriculture and food products, and tends to vary with changing economic conditions. We have recently experienced some year-over-year volume improvements and believe this trend could continue as the economy recovers. Due to the nature of our customers’ business, our revenues generally decline during winter months, namely the first and fourth fiscal quarters and over holidays. Highway transportation can be adversely affected depending upon the severity of the weather in various sections of the country during the winter months.
We believe rates in the bulk tank truck industry tend to be more stable than rates in the overall trucking industry. We believe the specialized nature of the bulk tank truck industry, including specifically-licensed drivers, specialized equipment, and more stringent safety requirements create barriers to entry which limit the more drastic swings in supply experienced by the broader trucking industry. Additionally, it is common practice in the bulk tank truck industry for customers to pay fuel surcharges, which helps enable recovery of fuel price increases from customers.
Container Services
Boasso is the largest North American provider of intermodal tank container transportation and depot services with eight terminals located in the eastern half of the United States. In addition to intermodal tank container transportation services, Boasso provides tank cleaning, heating, testing, maintenance and storage services to customers. Boasso provides local and over-the-road trucking primarily within proximity of the port cities where its depots are located and also sells equipment that its customers use for portable alternative storage or office space.
34
Table of Contents
Demand for intermodal tank containers is driven by the volume of imports and exports of chemicals through United States ports. Boasso’s revenues are accordingly impacted by this import/export volume, in particular the number and volume of shipments through ports at which Boasso has terminals, as well as by Boasso’s market share. Economic conditions and differences among the laws and currencies of nations may impact the volume of shipments as well.
Our Network
Our bulk service network consists primarily of independently owned third-party affiliate terminals, company-operated terminals and independent owner-operator drivers. Independent affiliates are independent companies we contract with to operate trucking terminals exclusively on our behalf in defined markets. The independent affiliates provide the capital necessary to service their contracted business and are also responsible for most of the operating costs associated with servicing the contracted business. Independent owner-operators are generally individual drivers who own or lease their tractors and agree to provide transportation services to us under contract. We believe the use of independent affiliates and independent owner-operators provides the following key competitive advantages to us in the marketplace:
| • | Locally owned and operated independent affiliate terminals can provide superior, tailored customer service. |
| • | Independent affiliates and independent owner-operators generally are paid a fixed, contractual percentage of revenue collected on each load they transport creating a variable cost structure that mitigates against cyclical downturns. |
| • | Reliance on independent affiliates and independent owner-operators creates an asset-light business model that generally reduces our capital investment. |
Due to several factors, including our ownership of the customer contracts and relationships, the presence of non-compete agreements with the independent affiliates, and our ownership of the trailers, our relationships with the independent affiliates tend to be long-term in nature, with minimal voluntary turnover.
Given the specialty nature of the services we provide and the size of our existing network, we believe there are significant barriers to entry to our industry. In the first quarter of 2009, we began consolidating certain company-operated terminals and transitioning other company-operated terminals to independent affiliates. These actions have continued thus far in 2010 and have resulted in a larger portion of our revenue being generated by independent affiliates and a substantial reduction in the number of terminals in our network. We believe these actions will reduce certain fixed costs, provide a more variable cost structure and position us with a financially flexible business platform.
We believe the most significant factors relevant to our future business growth are the ability to (i) obtain additional business from existing customers, (ii) add new customers, (iii) improve the utilization of our trailer fleet and (iv) add and retain qualified drivers. While many of our customers source some of their logistics needs with rail, we expect our customers to continue to outsource their logistics needs to full service tank truck carriers. As a result of our leading market position, strong customer relationships and flexible business model, we believe we are well-positioned to benefit from customers seeking consolidation of their shipping relationships.
Note Exchange
On October 15, 2009, we received approximately $134.5 million of our 2012 Notes in exchange for new 2013 Senior Notes. We also received approximately $83.6 million for our 9% Notes in exchange for approximately $80.7 million aggregate principal amount of our new 2013 PIK Notes, approximately 1.75 million warrants and $1.8 million in cash. The warrants are exercisable to purchase shares of our common stock at an exercise price of $0.01 per share, during the period beginning April 16, 2010 and ending on November 1, 2013. As of June 30, 2010, approximately 1.3 million warrants have been exercised.
35
Table of Contents
Affiliation
On May 1, 2010, we added F. T. Silfies (“Silfies”) to our independent affiliate network. Headquartered in Allentown, Pennsylvania, Silfies specializes in bulk cement and lime transport primarily servicing the East Coast markets. In connection with this affiliation, we loaned Silfies $3.0 million in cash. This loan bears interest at seven percent per annum, is repayable in equal weekly installments of principal and interest over three and one-half years and is secured by all of the assets of Silfies and a personal guarantee. We expect this affiliation to generate approximately $20.0 million of revenue annually following the date of affiliation.
Disposition
On October 10, 2009, we sold substantially all of the operating assets of our tank wash subsidiary, QSI, for $13.0 million, of which $10.0 million was paid in cash and the remaining $3.0 million in a subordinated note. The subordinated note is a five year non-amortizing note which matures on December 31, 2014. The principal is payable in a lump sum at maturity. Interest is payable quarterly at 7% per annum commencing December 31, 2009. In connection with the sale, QSI entered into various agreements with the purchaser, which is not affiliated with us, including long-term leases of real estate used in the tank wash business and various operating agreements. The assets sold had a net book value of $4.9 million which included $4.3 million of equipment, $0.4 million of inventory, and $0.2 million of intangibles. The sold QSI business generated approximately $19.5 million of revenue in 2009 from tank wash and related operations. We recorded a pre-tax gain of $7.1 million in the fourth quarter of 2009 as part of our operating income. We believe the changes in our business activities as a result of the sale of the tank wash business will reduce our environmental compliance costs going forward.
Acquisitions
During 2008, we purchased the assets of two transportation companies and the assets of an affiliate for $2.1 million, in the aggregate, of which $1.4 million was paid in cash at closing and the remaining $0.7 million is payable over future periods. Of the total $2.1 million, we allocated $1.0 million to property and equipment, $0.9 million to goodwill, and $0.2 million to other intangible assets such as non-compete agreements.
Critical Accounting Policies and Estimates
Our discussion and analysis of our financial condition and results of operations are based upon our consolidated financial statements, which have been prepared in accordance with GAAP. We believe the following are the more critical accounting policies that impact the financial statements, some of which are based on management’s best estimates available at the time of preparation. Actual future experience may differ from these estimates.
Property and equipment—Property and equipment expenditures, including tractor and trailer rebuilds that extend the useful lives of such equipment, are capitalized and recorded at cost. For financial statement purposes, these assets are depreciated using the straight-line method over the estimated useful lives of the assets to an estimated salvage value.
The asset lives used are presented in the following table:
| Average Lives (in years) | ||
| Buildings and improvements |
10 - 25 | |
| Tractors and terminal equipment |
5 - 7 | |
| Trailers |
15 - 20 | |
| Furniture and fixtures |
3 - 5 | |
| Other equipment |
3 - 10 |
Tractor and trailer rebuilds, which are recurring in nature and extend the lives of the related assets, are capitalized and depreciated over the period of extension, generally 3 to 10 years, based on the type and extent of
36
Table of Contents
these rebuilds. Maintenance and repairs are charged directly to expense as incurred. Management estimates the useful lives of these assets based on historical trends and the age of the assets when placed in service. Any changes in the actual lives could result in material changes in the net book value of these assets. Additionally, we estimate the salvage values of these assets based on historical sales or disposals, and any changes in the actual salvage values could also affect the net book value of these assets.
Furthermore, we evaluate the recoverability of our long-lived assets whenever adverse events or changes in the business climate indicate that the expected undiscounted future cash flows from the related asset may be less than previously anticipated. If the net book value of the related asset exceeds the undiscounted future cash flows of the asset, the carrying amount would be reduced to fair value and an impairment loss would be recognized. This analysis requires us to make significant estimates and assumptions in projecting future cash flows, and changes in facts and circumstances could result in material changes in the amount of any write-offs for impairment.
Goodwill and Intangible Assets—We evaluate goodwill and indefinite-lived intangible assets for impairment at least annually during the second quarter with a measurement date of June 30, and more frequently if indicators of impairment arise, in accordance with FASB’s guidance on goodwill and other intangible assets. At June 30, 2010, we evaluated goodwill for impairment by determining the fair value for each reporting unit to which our goodwill relates. At June 30, 2010, our container services segment was our only reporting unit that contained goodwill. Our container services segment contains goodwill and other identifiable intangible assets as a result of a previous business acquisition.
The methodology applied in the analysis performed at June 30, 2010 was consistent with the methodology applied in prior years, but was based on updated assumptions, as appropriate. As a result of our analysis, we concluded no impairment had occurred as of June 30, 2010. As a result of our analysis at June 30, 2009, a total impairment charge to goodwill of $146.2 million was necessary, of which $144.3 million was related to our trucking segment, eliminating 100% of the carrying amount of goodwill of that segment, and $1.9 million was related to our container services segment. We continued to evaluate indicators of impairment quarterly following our annual goodwill impairment test at June 30, 2009, in accordance with applicable guidance. There were no indications that a triggering event had occurred following our June 30, 2009 analysis and leading up to our analysis at June 30, 2010.
Goodwill
Under the FASB guidance, the process of evaluating the potential impairment of goodwill involves a two-step process and requires significant judgment at many points during the analysis. In the first step, we determine whether there is an indication of impairment by comparing the fair value of a reporting unit to its carrying amount, including goodwill. If, based on the first step, we determine that there is an indication of goodwill impairment, we assess the impairment in step two in accordance with the FASB guidance.
In the first step, we determine the fair value for our container services reporting unit using a combination of two valuation approaches: the market approach and the income approach. The market approach uses a guideline company methodology which is based upon a comparison of us to similar publicly-traded companies within our industry. We derive a market value of invested capital or business enterprise value for each comparable company by multiplying the price per share of common stock of the publicly traded companies by their total common shares outstanding and adding each company’s current level of debt. We calculate a business enterprise multiple based on revenue and earnings from each company then apply those multiples to each reporting unit’s revenue and earnings to conclude a reporting unit business enterprise value. Assumptions regarding the selection of comparable companies are made based on, among other factors, capital structure, operating environment and industry. As the comparable companies were typically larger and more diversified than our reporting units, multiples were adjusted prior to application to our reporting units’ revenues and earnings to reflect differences in margins, long-term growth prospects and market capitalization.
The income approach uses a discounted debt-free cash flow analysis to measure fair value by estimating the present value of future economic benefits. To perform the discounted debt-free cash flow analysis, we develop a
37
Table of Contents
pro forma analysis of each reporting unit to estimate future available debt-free cash flow and discounting estimated debt-free cash flow by an estimated industry weighted average cost of capital based on the same comparable companies used in the market approach. Per the FASB guidance, the weighted average cost of capital is based on inputs (e.g., capital structure, risk, etc.) from a market participant’s perspective and not necessarily from the reporting unit or QDI’s perspective. Future cash flow is projected based on assumptions for our economic growth, industry expansion, future operations and the discount rate, all of which require significant judgments by management.
After computing a separate business enterprise value under the income approach and market approach, we apply a weighting to them to derive the business enterprise value of the reporting unit. The income approach and market approach were both weighted 50% in the analysis performed at June 30, 2010. The weightings are evaluated each time a goodwill impairment assessment is performed and give consideration to the relative reliability of each approach at that time. Given that the business enterprise value derived from the market approach supported what was calculated in the income approach, we believed that both approaches should be equally weighted. Based on these weightings we concluded a business enterprise value for the reporting unit. We then add debt-free liabilities of the reporting unit to the concluded business enterprise value to derive an implied fair value of the reporting unit. The implied fair value is then compared to the reporting unit’s carrying value of total assets. Upon completion of the analysis in step one, we determined that the fair value of our container services reporting unit exceeded its carrying value. As such, a step two analysis was not required.
Intangible assets
To determine the implied fair value of our indefinite-lived intangible assets, we utilize the relief from royalty method, pursuant to which those assets are valued by reference to the amount of royalty income they would generate if licensed in an arm’s length transaction. Under the relief from royalty method, similar to the discounted cash flow method, estimated net revenues expected to be generated by the asset during its life are multiplied by a benchmark royalty rate and then discounted by the estimated weighted average cost of capital associated with the asset. The resulting capitalized royalty stream is an indication of the value of owning the asset.
If there are changes to the methods used to allocate carrying values, if management’s estimates of future operating results change, if there are changes in the identified reporting units or if there are changes to other significant assumptions, the estimated carrying values for each reporting unit and the estimated fair value of our goodwill could change significantly, and could result in future impairment charges, which could materially impact our results of operations and financial condition.
Deferred tax asset—In accordance with FASB guidance, we use the liability method of accounting for income taxes. Significant management judgment is required in determining the provision for income taxes and, in particular, any valuation allowance that is recorded or released against our deferred tax assets.
We continue to evaluate quarterly the positive and negative evidence regarding the realization of net deferred tax assets. The carrying value of our net deferred tax assets is based on our belief that it is more likely than not that we will generate sufficient future taxable income to realize these deferred tax assets. A valuation allowance has been established for 100% of our net deferred tax asset as we no longer believe it meets the “more likely than not” criteria. Our judgments regarding future taxable income may change due to changes in market conditions, changes in tax laws or other factors. If any of the assumptions and related estimates change in the future, it may increase or decrease the valuation allowance and related income tax expense in the same period.
During the second quarter of 2009, an impairment charge of $148.6 million was recorded and as a result the Company determined that it was in a cumulative loss position. Based on this negative evidence we concluded that it was no longer more likely than not that the Company’s net deferred tax asset was realizable. As a result, a $41.2 million deferred tax valuation allowance was recorded in 2009. For purposes of assessing realizability of the deferred tax assets, a cumulative financial reporting loss position is considered significant negative evidence the Company will not be able to fully realize the deferred tax assets in the future. The Company reviews a rolling
38
Table of Contents
thirty-six month calculation of U.S. earnings to determine if the Company is in a cumulative loss position. As of June 30, 2010, the Company is in a net cumulative loss position. Our judgments regarding future taxable income may change due to changes in market conditions, changes in tax laws, operating results or other factors.
At December 31, 2009 we had an estimated $95.7 million in federal net operating loss carryforwards, $2.3 million in alternative minimum tax credit carryforwards and $3.1 million in foreign tax credit carryforwards. The net operating loss carryforwards will expire in the years 2018 through 2027, while the alternative minimum tax credits may be carried forward indefinitely and the foreign tax credits may be carried forward for 10 years.
Uncertain income tax positions—In accordance with FASB guidance, we account for uncertainty in income taxes, using a two-step process. The first step is to evaluate the tax position for recognition by determining if the weight of available evidence indicates that it is more likely than not that the position will be sustained on audit, including resolution of related appeals or litigation processes, if any. The second step requires us to estimate and measure the tax benefit as the largest amount that is more than 50% likely to be realized upon ultimate settlement. It is inherently difficult and subjective to estimate such amounts, as we have to determine the probability of various possible outcomes. We re-evaluate these uncertain tax positions on a quarterly basis. This evaluation is based on factors including, but not limited to, changes in facts or circumstances, changes in tax law, effectively settled issues under audit, and new audit activity. Such a change in recognition and measurement would result in recognition of a tax benefit and/or an additional charge to the tax provision.
Environmental liabilities—We have reserved for potential environmental liabilities based on the best estimates of potential clean-up and remediation for known environmental sites. We employ a staff of environmental professionals to administer all phases of our environmental programs and use outside experts where needed. These professionals develop estimates of potential liabilities at these sites based on projected and known remediation costs. These cost projections are determined through previous experiences with other sites and through bids from third-party contractors. Management believes current reserves are reasonable based on current information.
Accrued loss and damage claims—We currently maintain liability insurance for bodily injury and property damage claims, covering all employees, independent owner-operators and independent affiliates, and workers’ compensation insurance coverage on our employees and company drivers. This insurance includes deductibles of $2.0 million per incident for bodily injury and property damage and $1.0 million for workers’ compensation. As such, we are subject to liability as a self-insurer to the extent of these deductibles under the policy. We are self-insured for damage to the equipment we own or lease and for cargo losses. As of June 30, 2010, we had $29.7 million in an outstanding letter of credit to our insurance administrator to guarantee the self-insurance portion of our liability. If we fail to meet certain terms of our agreement, the insurance administrator may draw down the letter of credit. In developing liability reserves, we rely on professional third party claims administrators, insurance company estimates and the judgment of our own personnel, and independent professional actuaries and attorneys. The most significant assumptions used in the estimation process include determining the trends in loss costs, the expected consistency in the frequency and severity of claims incurred but not yet reported to prior-year claims, and expected costs to settle unpaid claims. Management believes reserves are reasonable given known information, but as each case develops, estimates may change to reflect the effect of new information.
Revenue recognition—Transportation revenue, including fuel surcharges and related costs, are recognized on the date freight is delivered. Other service revenue consists primarily of rental revenues, container revenues and tank wash revenues. Rental revenues from independent affiliates, independent owner-operators and third parties are recognized ratably over the lease period. Container revenues, consisting primarily of repair and storage services, are recognized when the services are rendered. During the periods that we operated our tank wash business, tank wash revenues were recognized when the wash was completed. Service revenues on insurance policies are recorded as a contractual percentage of premiums received ratably over the period that the insurance covers. We recognize all revenues on a gross basis as the principal and primary obligor with risk of loss in relation to our responsibility for completion of services as contracted with our customers.
39
Table of Contents
Allowance for uncollectible receivables—The allowance for all potentially uncollectible receivables is based on a combination of historical data, cash payment trends, specific customer issues, write-off trends, general economic conditions and other factors. These factors are continuously monitored by our management to arrive at the estimate for the amount of accounts receivable that may be ultimately uncollectible. The receivables analyzed include trade receivables, as well as loans and advances made to independent owner-operators and independent affiliates. If the financial condition of our customers were to deteriorate, resulting in an impairment of their ability to make payments, an additional allowance could be required.
Stock compensation plans—Stock compensation is determined by the assumptions required under the FASB guidance. The fair values of stock option grants are based upon the Black-Scholes option-pricing model and amortized as compensation expense on a straight-line basis over the vesting period of the grants. Restricted stock awards are issued and measured at market value on the date of grant and related compensation expense is recognized over time on a straight-line basis over the vesting period of the grants. Stock-based compensation expense related to stock options and restricted stock was $1.1 million for the six months ended June 30, 2010 and $0.3 million for the six months ended June 30, 2009. As of June 30, 2010, there was approximately $4.9 million of total unrecognized compensation cost related to the unvested portion of our stock-based awards. The recognition period for the remaining unrecognized stock-based compensation cost generally varies from two to four years. For further discussion on stock-based compensation, see Note 18 of the notes to our audited consolidated financial statements for the fiscal year ended December 31, 2009, which appear elsewhere in this prospectus.
Pension plans—We maintain two noncontributory defined-benefit plans resulting from a prior acquisition that cover certain full-time salaried employees and certain other employees under a collective bargaining agreement. Both plans are frozen and, as such, no future benefits accrue. We record annual amounts relating to these plans based on calculations specified by GAAP, which include various actuarial assumptions such as discount rates (6.25% to 6.30%) and assumed rates of return (7.00% to 8.00%) depending on the pension plan.
Material changes in pension costs may occur in the future due to changes in these assumptions. Future annual amounts could be impacted by changes in the discount rate, changes in the expected long-term rate of return, changes in the level of contributions to the plans and other factors.
We had an accumulated net pension equity credit (after-tax) of $1.0 million at December 31, 2009 compared to a charge of $9.7 million at December 31, 2008. The equity charge in 2008 reflected the decline in our funded status as a result of significant negative asset returns during 2008.
The discount rate is based on a model portfolio of AA-rated bonds with a maturity matched to the estimated payouts of future pension benefits. The expected return on plan assets is based on our expectation of the long-term rates of return on each asset class based on the current asset mix of the funds, considering the historical returns earned on the type of assets in the funds, plus an assumption of future inflation. The current inflation assumption is 3.00%. We review our actuarial assumptions on an annual basis and make modifications to the assumptions based on current rates and trends when appropriate. The effects of the modifications are amortized over future periods.
Assumed discount rates and expected return on plan assets have a significant effect on the amounts reported for the pension plan. At December 31, 2009, our projected benefit obligation (“PBO”) was $47.3 million. Our projected 2010 net periodic pension expense is $1.9 million. A 1.0% decrease in our assumed discount rate would increase our PBO to $52.3 million and increase our 2010 net periodic pension expense less than $0.1 million. A 1.0% increase in our assumed discount rate would decrease our PBO to $43.1 million and decrease our 2010 net periodic pension expense less than $0.1 million. A 1.0% decrease in our assumed rate of return would not change our PBO but would increase our 2010 net periodic pension expense to $2.2 million. A 1.0% increase in our assumed rate of return would not change our PBO but would decrease our 2010 net periodic pension expense to $1.6 million.
40
Table of Contents
Restructuring—We account for restructuring costs associated with one-time termination benefits, costs associated with lease and contract terminations and other related exit activities in accordance with the FASB’s guidance. We have made estimates of the costs to be incurred as part of our restructuring plan. During the quarter ended June 30, 2008, we committed to a plan of restructure resulting in the termination of non-driver positions and the consolidation, closure or affiliation of underperforming company terminals. We continued our plan of restructure throughout 2009 which resulted in charges of $3.5 million, of which the majority related to our trucking segment. Our restructuring plan continued in 2010 and resulted in charges of $2.2 million for the six month period ended June 30, 2010, of which the majority related to our trucking segment. The charges related to employee termination benefits and other related exit activities, and included the termination of approximately 380 non-driver positions. We expect to conclude our restructuring plan in 2010 and to take additional related charges during the year. As of June 30, 2010, approximately $1.2 million was accrued related to the restructuring charges, which are expected to be paid through 2012.
New Accounting Pronouncements
During 2009, the Financial Accounting Standards Board (“FASB”) issued the FASB Accounting Standards Codification, or Codification. The Codification became the single source for all authoritative generally accepted accounting principles. The Codification does not change GAAP and did not impact our financial position or results of operations.
In June 2009, FASB issued new guidance which revises and updates previously issued guidance related to variable interest entities. The new guidance eliminates the exceptions to consolidating qualifying special-purpose entities that were included in the prior guidance. The new guidance contains new criteria for determining the primary beneficiary and increases the frequency of required reassessments to determine whether a company is the primary beneficiary of a variable interest entity. The guidance also contains a new requirement that any term, transaction, or arrangement that does not have a substantive effect on an entity’s status as a variable interest entity, a company’s power over a variable interest entity, or a company’s obligation to absorb losses or its right to receive benefits of an entity must be disregarded. The elimination of the qualifying special-purpose entity concept and its consolidation exceptions means more entities will be subject to consolidation assessments and reassessments. The new guidance became effective for our fiscal year beginning January 1, 2010. The Company has concluded that a majority of its relationships with independent affiliates do not represent variable interests and that the Company is not in a position to direct the significant economic activities of independent affiliates.
In June 2009, the FASB issued guidance that eliminates the concept of a qualifying special-purpose entity, creates more stringent conditions for reporting a transfer of a portion of a financial asset as a sale, clarifies other sale-accounting criteria, and changes the initial measurement of a transferor’s interest in transferred financial assets. This guidance became effective for our fiscal year beginning January 1, 2010 and had no impact on our consolidated financial statements.
In May 2009, the FASB issued guidance related to subsequent events that provides general standards of accounting for and disclosure of events that occur after the balance sheet date but before financial statements are issued or are available to be issued. It requires the disclosure of the date through which an entity has evaluated subsequent events and the basis for that date; that is, whether that date represents the date the financial statements were issued or were available to be issued. We adopted this guidance in the second quarter of 2009, as it became effective for interim or annual financial periods ending after June 15, 2009. In February 2010 the guidance was amended, eliminating the requirement to disclose the date through which subsequent events were evaluated.
On April 9, 2009, the Securities and Exchange Commission (“SEC”) issued guidance that amended and supplemented its previous guidance on other than temporary impairment of certain investments in debt and equity securities. The newly issued guidance maintains the SEC staff’s previous views related to equity securities; however, debt securities are excluded from its scope. The guidance provides that “other-than-temporary” impairment is not necessarily the same as “permanent” impairment and unless evidence exists to
41
Table of Contents
support a value equal to or greater than the carrying value of the equity security investment, a write-down to fair value should be recorded and accounted for as a realized loss. The guidance was effective upon issuance and had no impact on our consolidated financial statements.
On April 9, 2009, the FASB issued guidance which requires an entity to provide disclosures about fair value of financial instruments in interim financial information. The disclosures are required prospectively and are effective for interim and annual periods ending after June 15, 2009. We adopted this guidance, and the required disclosures are included herein. This guidance had no impact on our consolidated financial statements.
On April 1, 2009, the FASB issued guidance requiring that assets acquired and liabilities assumed in a business combination that arise from a contingency must be recognized at fair value. If fair value cannot be determined during the measurement period defined in the guidance, the asset or liability can still be recognized if it can be determined that it is probable that the asset existed or the liability had been incurred as of the measurement date and if the amount of the asset or liability can be reasonably estimated. If it is not determined to be probable that the asset/liability existed/was incurred or no reasonable amount can be determined, no asset or liability is recognized. The entity should determine a rational basis for subsequently measuring the acquired assets and assumed liabilities. Contingent consideration agreements should be recognized initially at fair value and subsequently reevaluated in accordance with the guidance. The guidance is effective for business combinations with an acquisition date on or after the beginning of the Company’s first annual reporting period beginning on or after December 15, 2008. The Company will assess the impact of this guidance if and when a future acquisition occurs.
On January 1, 2009, we adopted newly issued guidance from the FASB regarding business combinations. This guidance significantly changes the financial accounting and reporting of business combination transactions but retains the fundamental requirements of the prior guidance, including utilizing the purchase method for all business combinations and identifying an acquirer for each business combination. The impact of adopting the new guidance will depend on the nature, terms and size of business combinations completed.
On January 1, 2009, we adopted the FASB’s amended guidance on noncontrolling interests in consolidated financial statements. This guidance requires the reporting of all noncontrolling interests as a separate component of stockholders’ equity, the reporting of consolidated net income (loss) as the amount attributable to both the parent and the noncontrolling interests, and the separate disclosure of net income (loss) attributable to the parent and to the noncontrolling interests. Other than the reporting requirements described above which require retrospective application, the remaining provisions are to be applied prospectively in the first annual reporting period beginning on or after December 15, 2008. The adoption of this guidance had an immaterial impact on our consolidated financial statements.
In conjunction with guidance on noncontrolling interests, we adopted guidance on classification and measurement of redeemable securities. This standard is applicable for all noncontrolling interests where the Company is subject to equity classified securities that are redeemable or may become redeemable at a fixed or determinable price on a fixed or determinable date, at the option of the holder, or upon the occurrence of an event that is not solely within the control of the issuer. A subsidiary of QDI has issued and outstanding preferred stock that is held by holders other than QDI and its other subsidiaries. The holders have the right to cause us to redeem their shares of preferred stock. The redemption value of the preferred stock held by these noncontrolling holders equals the fair value of $1.8 million at June 30, 2010 and is reflected in our consolidated balance sheets as redeemable noncontrolling interest.
On January 1, 2009, we adopted new guidance from the FASB on determining the useful life of intangible assets which amends the factors that should be considered in developing renewal or extension assumptions used to determine the useful life of a recognized intangible asset. The amended guidance removes an earlier requirement to consider whether an intangible asset can be renewed without substantial cost or material modifications to the existing terms and conditions; instead, it requires an entity to consider its own historical
42
Table of Contents
experience in renewing similar arrangements. The guidance also requires expanded disclosure related to the determination of intangible asset useful lives. The adoption of this guidance had no impact on our consolidated financial statements.
On January 1, 2009, we adopted the FASB’s guidance to assist in determining whether instruments granted in share-based payment transactions are participating securities. The guidance addresses whether unvested equity-based awards are participating securities and, therefore, need to be included in the earnings allocation in computing earnings per share under the two-class method The adoption of this guidance had no impact on our consolidated financial statements.
In December 2008, the FASB issued guidance on an employer’s disclosures about plan assets of a defined benefit pension or other postretirement plan. This guidance is intended to ensure that an employer meets the objectives of the disclosures about plan assets in an employer’s defined benefit pension or other postretirement plan to provide users of financial statements with an understanding of the following: how investment allocation decisions are made, the major categories of plan assets, the inputs and valuation techniques used to measure the fair value of plan assets, the effect of fair value measurements using significant unobservable inputs on changes in plan assets, and significant concentrations of risk within plan assets. The disclosures required become effective for us on December 31, 2009. We have determined that the adoption of this guidance will not have an impact on our consolidated financial statements.
On January 1, 2008, we adopted the FASB’s guidance on fair value measurements which provides a consistent definition of fair value that focuses on exit price and prioritizes, within a measurement of fair value, the use of market-based inputs over company-specific inputs. The guidance requires expanded disclosures about fair value measurements and establishes a three-level hierarchy for fair value measurements based on the observable inputs to the valuation of an asset or liability at the measurement date. The standard also requires that a company consider its own nonperformance risk when measuring liabilities carried at fair value, including derivatives. In February 2008, the FASB permitted companies to partially defer the effective date of its fair value measurement guidance for one year for nonfinancial assets and nonfinancial liabilities that are recognized or disclosed at fair value in the financial statements on a nonrecurring basis, and we elected to do so. On January 1, 2009, we adopted the fair value measurement guidance for nonfinancial assets and nonfinancial liabilities. The effect of our adoption was not material to our consolidated financial statements.
On January 1, 2008, we adopted the FASB’s guidance on the fair value option for financial assets and financial liabilities which permits a company to measure certain financial assets and financial liabilities at fair value that were not previously required to be measured at fair value. We have not elected to measure any financial assets and financial liabilities at fair value which were not previously required to be measured at fair value; therefore, the adoption of this guidance has had no effect on our results of operations.
43
Table of Contents
Results of Operations
The following table sets forth for the periods indicated the percentage of total revenue represented by certain items in our consolidated statements of operations for the periods presented:
| Three months ended June 30, |
Six months ended June 30, |
|||||||||||
| 2010 | 2009 | 2010 | 2009 | |||||||||
| OPERATING REVENUES: |
||||||||||||
| Transportation |
72.9 | % | 74.8 | % | 73.3 | % | 74.5 | % | ||||
| Other service revenue |
14.9 | 17.3 | 15.2 | 17.8 | ||||||||
| Fuel surcharge |
12.2 | 7.9 | 11.5 | 7.7 | ||||||||
| Total operating revenues |
100.0 | 100.0 | 100.0 | 100.0 | ||||||||
| OPERATING EXPENSES: |
||||||||||||
| Purchased transportation |
69.3 | 59.4 | 69.0 | 57.1 | ||||||||
| Compensation |
8.4 | 13.0 | 8.5 | 14.3 | ||||||||
| Fuel, supplies and maintenance |
6.8 | 10.6 | 7.2 | 11.2 | ||||||||
| Depreciation and amortization |
2.3 | 3.5 | 2.5 | 3.6 | ||||||||
| Selling and administrative |
2.5 | 4.6 | 2.7 | 4.7 | ||||||||
| Insurance costs |
2.6 | 2.6 | 2.3 | 2.7 | ||||||||
| Taxes and licenses |
0.4 | 0.5 | 0.3 | 0.6 | ||||||||
| Communication and utilities |
0.7 | 1.5 | 0.6 | 1.5 | ||||||||
| Loss (gain) on disposal of property and equipment |
0.1 | (0.1 | ) | 0.0 | (0.1 | ) | ||||||
| Impairment of goodwill and intangibles |
0.0 | 99.2 | 0.0 | 49.6 | ||||||||
| Restructuring costs |
0.6 | 0.8 | 0.7 | 0.6 | ||||||||
| Total operating expenses |
93.7 | 195.6 | 93.8 | 145.8 | ||||||||
| Operating income (loss) |
6.3 | (95.6 | ) | 6.2 | (45.8 | ) | ||||||
| Interest expense |
4.9 | 4.4 | 5.1 | 4.5 | ||||||||
| Interest income |
(0.1 | ) | (0.1 | ) | (0.1 | ) | (0.1 | ) | ||||
| Gain on extinguishment of debt |
0.0 | 0.0 | 0.0 | (0.2 | ) | |||||||
| Other expense (income) |
0.1 | (0.3 | ) | 0.2 | 0.0 | |||||||
| Income (loss) before income taxes |
1.4 | (99.6 | ) | 1.0 | (50.0 | ) | ||||||
| Provision for income taxes |
0.3 | 24.7 | 0.0 | 12.3 | ||||||||
| Net income (loss) |
1.1 | % | (124.3 | )% | 1.0 | % | (62.3 | )% | ||||
The following table shows the approximate number of terminals, drivers, tractors and trailers, that we managed (including independent affiliates and independent owner-operators) at the dates indicated:
| As of June 30, | ||||
| 2010 | 2009 | |||
| Terminals |
105 | 139 | ||
| Drivers |
2,809 | 2,748 | ||
| Tractors |
3,031 | 3,036 | ||
| Trailers |
6,478 | 6,586 | ||
We reduced our total number of terminals by 38% from 169 to 105 during 2008, 2009 and the first six months of 2010, while transitioning most of the business from these under-performing terminals to our remaining terminals and affiliating many company-owned terminals. At June 30, 2010, 91 of our 97 trucking terminals were affiliate operated, compared with 55 of 121 at December 31, 2007. Eight of our current terminals are intermodal tank depot services terminals used in the Boasso business.
We own approximately 5,000 tank or specialty trailers, the majority of which we lease to our independent affiliates to help facilitate our business. We prefer to own the trailers as they provide us with a stable source of
44
Table of Contents
lease income, as well as access to attractive capital through our asset-based loan facility (the “ABL Facility”). We view the trailer leasing business as attractive given the low upfront costs, long useful life, limited maintenance and attractive return on investment. The tank and specialty trailers generally have long useful lives and we believe that increasing their utilization can significantly improve our operating income due to high operating leverage. Through periodic maintenance, we are typically able to extend the useful lives of trailers beyond 15-20 years, leading to operational flexibility.
The following table sets forth for the periods indicated the percentage of total revenue represented by certain items in our consolidated statements of operations for the periods presented:
| Year Ended December 31, | |||||||||
| 2009 | 2008 | 2007 | |||||||
| Operating Revenues: |
|||||||||
| Transportation |
74.1 | % | 69.4 | % | 77.3 | % | |||
| Other service revenue |
17.1 | 12.8 | 10.1 | ||||||
| Fuel surcharge |
8.8 | 17.8 | 12.6 | ||||||
| Total operating revenues |
100.0 | 100.0 | 100.0 | ||||||
| Operating Expenses: |
|||||||||
| Purchased transportation |
60.9 | 57.3 | 62.7 | ||||||
| Compensation |
12.5 | 13.4 | 11.4 | ||||||
| Fuel, supplies and maintenance |
10.2 | 14.0 | 10.8 | ||||||
| Depreciation and amortization |
3.3 | 2.6 | 2.3 | ||||||
| Selling and administrative |
4.0 | 4.4 | 4.2 | ||||||
| Insurance costs |
2.3 | 1.8 | 3.2 | ||||||
| Taxes and licenses |
0.6 | 0.6 | 0.5 | ||||||
| Communication and utilities |
1.3 | 1.6 | 1.5 | ||||||
| Gain on sale of tank wash assets |
(1.2 | ) | — | — | |||||
| Loss (gain) on disposal of property and equipment |
0.1 | (0.4 | ) | 0.1 | |||||
| Impairment on property and equipment |
24.2 | — | — | ||||||
| Restructuring charges |
0.6 | 0.7 | — | ||||||
| Total operating expenses |
118.8 | 96.0 | 96.7 | ||||||
| Operating (loss) income |
(18.8 | ) | 4.0 | 3.3 | |||||
| Interest expense, net |
4.6 | 4.3 | 4.1 | ||||||
| Write-off of debt issuance costs |
— | — | 0.3 | ||||||
| Gain on early debt extinguishment |
(0.3 | ) | (2.0 | ) | — | ||||
| Other expense (income) |
0.3 | (0.4 | ) | 0.1 | |||||
| (Loss) income before income taxes |
(23.4 | ) | 2.1 | (1.2 | ) | ||||
| Provision for (benefit from) income taxes |
6.1 | 0.6 | (0.3 | ) | |||||
| Net (loss) income |
(29.5 | ) | 1.5 | (0.9 | ) | ||||
The following table sets forth for the periods indicated the number of terminals, tractors and trailers utilized in our business (including affiliates and owner-operators) as of December 31:
| 2009 | 2008 | 2007 | ||||
| Terminals |
108 | 149 | 169 | |||
| Number of drivers |
2,591 | 3,053 | 3,486 | |||
| Trailers |
6,410 | 7,115 | 7,506 | |||
| Tractors |
2,839 | 3,224 | 3,927 | |||
| Transportation billed miles (in thousands) |
108,302 | 136,234 | 154,340 | |||
45
Table of Contents
Three Months Ended June 30, 2010 Compared to Three Months Ended June 30, 2009
For the quarter ended June 30, 2010, total revenues were $177.6 million, an increase of $27.8 million, or 18.5%, from revenues of $149.8 million for the same period in 2009. Transportation revenue increased by $17.4 million, or 15.5%, primarily due to an increase in linehaul revenue due to an increase in demand, predominantly from existing customers. Revenue increases were primarily driven by an increase in volume, which resulted in a 10.2% increase in the total number of miles driven and a 9.1% increase in loads from the prior-year quarter. To a lesser extent, revenues were positively affected by a modest increase in average rates.
Other service revenue increased $0.6 million, or 2.4%. This increase was primarily due to the increase in rental revenue of $3.1 million due to the conversion of certain company-operated terminals to independent affiliate terminals and an increase in container service revenues of $1.8 million. This was offset by a reduction in tank wash revenue of $4.3 million due to the sale of our tank wash business in the fourth quarter of 2009. Fuel surcharge revenue increased $9.7 million, or 82.1%, due to the increase in linehaul revenue offset by a slight reduction in fuel prices.
Purchased transportation increased by $34.1 million, or 38.3%, due primarily to the increase in linehaul revenue, miles driven and loads. Total purchased transportation as a percentage of transportation revenue and fuel surcharge revenue increased to 81.5% for the current quarter versus 71.8% for the prior-year quarter due primarily to the conversion of certain company-operated terminals to independent affiliate terminals. Our independent affiliates generated 93.3% of our transportation revenue and fuel surcharge revenue for the three months ended June 30, 2010 compared to 67.2% for the comparable prior-year period. We pay our independent affiliates a greater percentage of transportation revenues generated by them than is paid to independent owner-operators, so our purchased transportation costs will change as revenues generated by independent affiliates change as a percentage of total transportation revenue. During the three month period ended June 30, 2010 and 2009, we paid our affiliates approximately 85% of the transportation revenue collected while we typically paid independent owner-operators approximately 65% of the invoiced linehaul amount. We believe that the greater proportion of operating revenue derived from independent affiliate operations during the three-month period ended June 30, 2010 is likely indicative of the proportion of operating revenue derived from independent affiliate operations in the future due to the sale of our tank wash business in the fourth quarter of 2009, our addition of a new affiliate during the quarter, and our affiliation of company owned terminals during 2009 and 2010.
In 2009 and 2010, we transitioned certain company-operated terminals to independent affiliates which resulted in a larger portion of our revenue being generated by independent affiliates. We believe these actions have reduced certain fixed costs and provided a more variable cost structure.
Compensation expense decreased $4.6 million, or 23.3%, primarily due to $4.1 million of reduced expense from corporate headcount reductions, terminal consolidations, and conversions of company-operated terminals to independent affiliate terminals offset by an increase in Boasso operations of $1.0 million. In addition, we had a reduction in compensation expense of $1.5 million due to the sale of our tank wash business.
Fuel, supplies and maintenance decreased $3.9 million, or 24.3%, due to lower fuel costs of $1.6 million and lower equipment rent expense of $0.3 million due to the shift of revenue from company-operated terminals to independent affiliates. In addition, tank wash operations had a decrease of $1.5 million due to the sale of this business.
Depreciation and amortization expense decreased $1.2 million, or 23.3%, due to a decrease in depreciation from disposals of revenue equipment and the sale of our tank wash assets in the fourth quarter of 2009.
Selling and administrative expenses decreased by $2.4 million, or 35.3%, primarily due to a decrease in our bad debt reserve of $1.3 million, a $0.4 million reduction in building rent expense and other expenses related to closed or converted terminals, and a $0.3 million reduction in professional fees. In addition, tank wash operations had a decrease of $0.4 million due to the sale of this business.
Insurance expense increased by $0.6 million, or 15.1%, due primarily to a slight increase in claims incurred for the quarter ended June 30, 2010.
46
Table of Contents
Communication and utilities expense decreased $0.9 million, or 42.5%, primarily due to reduced expense from terminal consolidations, conversions of company-operated terminals to independent affiliate terminals and due to the sale of our tank wash business.
We incurred a loss on disposal of assets of $0.2 million for the quarter ended June 30, 2010 as compared to a gain of $0.2 million in the comparable prior-year period from the sale and disposal of equipment.
For the quarter ended June 30, 2009, we recorded a non-cash impairment charge to goodwill and intangibles totaling $148.6 million as a result of our impairment analysis, which is performed at least annually every June 30 on both our trucking and container services segments. We recorded a charge of $144.3 million for the impairment of goodwill in our trucking segment. We also recorded a charge of $1.9 million for the impairment of goodwill in our container services segment and a charge of $2.4 million for the impairment of the tradename in our container services segment. We incurred no such charges for the quarter ended, June 30, 2010.
In the second quarter of 2010 and 2009, we incurred additional restructuring costs of $1.1 million and $1.2 million, respectively, primarily due to the continuation of our restructuring plan which began during the second quarter of 2008. These costs consist of employee termination benefits and other related exit activities.
For the quarter ended June 30, 2010, operating income totaled $11.2 million, an increase of $154.4 million or more than 100.0%, compared to an operating loss of $143.2 million for the same period in 2009 primarily due to the non-cash impairment charge to goodwill and intangibles. The operating margin for the quarter ended June 30, 2010 was 6.3% compared to (95.6%) for the same period in 2009 as a result of the above-mentioned items.
Interest expense increased by $2.1 million, or 32.6%, in the quarter ended June 30, 2010 compared to the same period in 2009, due to the higher interest rates on our 2013 Senior Notes and 2013 PIK Notes than the rates on the notes for which they were exchanged in the fourth quarter of 2009. As a result of these higher rates of interest, we expect our interest expense to be higher in 2010 unless the principal balances of our indebtedness are reduced substantially.
The provision for income taxes was $0.5 million for the quarter ended June 30, 2010 compared to $37.0 million for the same period in 2009. The effective tax rates for the quarters ended June 30, 2010 and 2009 were approximately 18.4% and (24.8%) respectively. This change in income taxes was primarily due to the recording of a deferred tax valuation allowance during 2009.
For the quarter ended June 30, 2010, our net income was $2.1 million, compared to net loss of $186.2 million for the same period last year.
Six Months Ended June 30, 2010 Compared to Six Months Ended June 30, 2009
For the six months ended June 30, 2010, total revenues were $338.9 million, an increase of $39.4 million, or 13.1%, from revenues of $299.5 million for the same period in 2009. Transportation revenue increased by $25.3 million, or 11.3%, primarily due to an increase in linehaul revenue due to an increase in demand. We had a 6.7% increase in the total number of miles driven and a 4.3% increase in loads from the prior-year six months.
Other service revenue decreased $2.1 million, or 3.9%. This decrease was primarily due to reductions in tank wash revenue of $9.3 million offset by an increase of $6.0 million of increased rental revenue and a $1.3 million increase in container service revenues. Fuel surcharge revenue increased $16.2 million, or 70.4%, due to the increase in linehaul revenue.
Purchased transportation increased by $63.1 million, or 36.9%, due primarily to the increase in linehaul revenue, miles driven and loads. Total purchased transportation as a percentage of transportation revenue and fuel surcharge revenue increased to 81.4% for the current six months versus 69.4% for the prior-year six months
47
Table of Contents
due primarily to the conversion of certain company-operated terminals to independent affiliate terminals. Our independent affiliates generated 93.1% of our transportation revenue and fuel surcharge revenue for the six months ended June 30, 2010 compared to 63.2% for the comparable prior-year period.
Compensation expense decreased $13.9 million, or 32.5%, primarily due to $12.4 million of reduced expense from corporate headcount reductions, terminal consolidations, and conversions of company-operated terminals to independent affiliate terminals offset by a $1.4 million increase in Boasso operations. In addition, tank wash operations had a decrease of $2.9 million due to the sale of this business.
Fuel, supplies and maintenance decreased $9.1 million, or 27.3%, due to lower fuel costs of $3.0 million, lower repairs and maintenance expense of $1.8 million, and lower equipment rent expense of $0.5 million due to the shift of revenue from company-operated terminals to independent affiliates. In addition, tank wash operations had a decrease of $3.3 million due to the sale of this business.
Depreciation and amortization expense decreased $2.3 million, or 21.9%, due to a decrease in depreciation from disposals of revenue equipment and the sale of our tank wash assets in the fourth quarter of 2009.
Selling and administrative expenses decreased by $4.8 million, or 34.2%, primarily due to a decrease in our bad debt reserve of $1.7 million, a $1.3 million reduction in building rent expense and other expenses related to closed or converted terminals, and a $0.9 million reduction in professional fees. In addition, tank wash operations had a decrease of $0.7 million due to the sale of this business.
Insurance expense remained relatively flat compared to same period last year.
Communication and utilities expense decreased $2.6 million, or 53.5%, primarily due to reduced expense from terminal consolidations, and conversions of company-operated terminals to independent affiliate terminals.
We incurred a loss on disposal of assets of $0.7 million for the six months ended June 30, 2010 as compared to a gain of $0.3 million in the comparable prior-year period, from the sale and disposal of equipment.
For the six months ended June 30, 2009, we recorded a non-cash impairment charge to goodwill and intangibles totaling $148.6 million as a result of our impairment analysis, which is performed at least annually every June 30 on both our trucking and container services segments. We recorded a charge of $144.3 million for the impairment of goodwill in our trucking segment. We also recorded a charge of $1.9 million for the impairment of goodwill in our container services segment and a charge of $2.4 million for the impairment of the tradename in our container services segment. We incurred no such charges for the six months ended, June 30, 2010.
In the six months ended 2010 and 2009, we incurred additional restructuring costs of $2.2 million and $1.8 million, respectively, primarily due to the continuation of our restructuring plan which began during the second quarter of 2008. These costs consist of employee termination benefits and other related exit activities.
For the six months ended June 30, 2010, operating income totaled $19.9 million, an increase of $157.1 million or more than 100.0%, compared to operating loss of $137.2 million for the same period in 2009 primarily due to the non cash impairment charge to goodwill and intangibles. The operating margin for the six months ended June 30, 2010, was 5.9% compared to (45.8%) for the same period in 2009 as a result of the above-mentioned items.
Interest expense increased by $3.8 million, or 28.0%, in the six months ended June 30, 2010 compared to the same period in 2009, due to the higher interest rates on our 2013 Senior Notes and 2013 PIK Notes than the rates on the notes for which they were exchanged in the fourth quarter of 2009. As a result of these higher rates of interest, we expect our interest expense to continue to be higher throughout 2010 unless the principal balances of our indebtedness are reduced substantially.
48
Table of Contents
In 2009, gain on debt extinguishment of $0.7 million resulted from the repurchase of $1.0 million of our 9% Notes.
The provision for income taxes was ($0.2) million for the six months ended June 30, 2010 compared to a benefit of income taxes of $36.9 million for the same period in 2009. The effective tax rates for the six months ended June 30, 2010 and 2009 were approximately (6.1%) and (24.7)%, respectively. This change in income taxes was primarily due to the recording of a deferred tax valuation allowance during 2009.
For the six months ended June 30, 2010, our net income was $2.9 million, compared to net loss of $186.5 million for the same period last year.
Year Ended December 31, 2009 Compared to Year Ended December 31, 2008
Total revenues for 2009 were $613.6 million, a decrease of $201.7 million, or 24.7%, compared to 2008 revenues. Transportation revenue decreased by $111.2 million, or 19.6%, primarily due to a decrease in linehaul revenue due to continuing softness in the housing and automotive industries and general weakening of our economy. We had a 20.0% decrease in the total number of miles driven as the average number of miles per load decreased over the prior year along with a 22.7% decrease in overall loads.
Other service revenue increased by $0.9 million, or 0.9%, compared to 2008. This increase was primarily due to $11.6 million of increased rental income from the conversion of certain company-operated terminals to affiliate terminals, offset by reductions in tank wash revenue of $8.9 million due to tank wash closures, reduced business and the sale of substantially all of our tank wash business in the fourth quarter of 2009.
Fuel surcharge revenue decreased $91.4 million, or 62.9%, primarily due to a decrease in fuel prices and a decrease in the total number of miles driven.
Purchased transportation decreased by $93.3 million, or 20.0%, due primarily to the decrease in linehaul revenue, miles driven and loads. Total purchased transportation as a percentage of transportation revenue and fuel surcharge revenue increased to 73.4% in 2009, versus 65.6% for 2008 due to the conversion of certain company-operated terminals to affiliate terminals. Our affiliates generated 72.8% of our transportation revenue and fuel surcharge revenue for 2009 compared to 50.7% for 2008. We pay our affiliates a greater percentage of transportation revenues generated by them than is paid to independent owner-operators, so our purchased transportation costs will change as revenues generated by affiliates change as a percentage of total transportation revenue. During the 2009 and 2008 periods, we paid our affiliates approximately 85% of transportation revenue and paid independent owner-operators approximately 65% of transportation revenue.
In 2009, we transitioned the majority of company-operated terminals to affiliates. These actions resulted in a larger portion of our revenue being generated by affiliates in 2009 and we expect an even larger portion to be generated by affiliates in 2010. We believe these actions will reduce certain fixed costs and provide a more variable cost structure.
Compensation expense decreased $32.2 million, or 29.5%, primarily due to $30.0 million of reduced expense from corporate headcount reductions, terminal consolidations, and conversions of company-operated terminals to affiliate terminals offset by $2.2 million increase in pension expense. In addition, we had a reduction in compensation expense of $4.7 million for QSI due to tank wash closures, reduced business, and the sale of substantially all of our tank wash business in the fourth quarter of 2009.
Fuel, supplies and maintenance decreased $51.9 million, or 45.4%, due to lower fuel costs of $26.8 million, lower repairs and maintenance expense of $17.7 million, lower equipment rent expense of $4.8 million and lower QSI expenses of $3.9 million due to tank wash closures, reduced business and the sale of substantially all of our tank wash business in the fourth quarter of 2009 offset by an increase in Boasso terminal operations.
49
Table of Contents
Selling and administrative expenses decreased $11.3 million, or 31.4%, primarily due to $4.2 million reduction in building rent expense and other expenses related to closed or converted terminals. In addition, we had a decrease of $4.1 million in professional fees, $1.6 million in travel-related costs, and $1.8 million for QSI due to tank wash closures and the sale of substantially all of our tank wash business in the fourth quarter of 2009, offset by an increase in our bad debt reserve of $0.7 million.
Insurance costs decreased $0.9 million, or 5.9%, primarily due to a reduction in the number and severity of accidents that occurred during 2009.
Communication and utilities expense decreased $4.8 million, or 37.8%, primarily due to reduced expense from terminal consolidations, conversions of company-operated terminals to affiliate terminals, tank wash closures and the sale of substantially all of our tank wash business in the fourth quarter of 2009.
Gain on sale of tank wash equipment of $7.1 million resulted from the sale of substantially all of QSI’s operating assets for $13.0 million to a third party on October 10, 2009.
Loss on disposal of property and equipment was $0.5 million in 2009 as compared to a gain of $3.1 million in 2008. The loss in 2009 resulted from the disposals of revenue equipment compared with a gain in 2008 resulting from the sale of land not used in our business.
In 2009, we recorded a non-cash impairment charge to goodwill and intangibles totaling $148.6 million as a result of our impairment analysis, which is performed at least annually every June 30 on both our trucking and container services segments. We recorded a charge of $144.3 million for the impairment of goodwill in our trucking segment. We also recorded a charge of $1.9 million for the impairment of goodwill in our container services segment and a charge of $2.4 million for the impairment of the tradename in our container services segment. Further information regarding our impairment analysis is included in “Goodwill and Intangible Assets” in our “Critical Accounting Policies and Estimates”.
We incurred restructuring costs of $3.5 million in 2009 and $5.3 million in 2008 primarily due to expenses associated with our restructuring plan which began during the second quarter of 2008. These costs consist of employee termination benefits and other related exit activities. As of December 31, 2009 we had accrued $1.1 million of additional expense related to this plan. We expect to conclude our restructuring plan in 2010 and to take additional related charges during the year.
Operating loss was $115.2 million in 2009 as compared to operating income of $33.0 million in 2008. The operating margin for 2009 was (18.8%) compared to 4.0% for 2008 as a result of the above items.
Interest expense decreased by $7.2 million, or 20.3%, in 2009 compared to 2008 primarily due to a decrease in interest rates on our floating rate debt partially offset by higher interest rates following our note exchange in the fourth quarter of 2009. In addition, the outstanding principal amount of our 9% Notes was lower due to our note repurchases during 2009 and 2008, and the outstanding balance on our ABL Facility was lower. We expect our interest expense to increase in 2010 as our 2013 Senior Notes and our 2013 PIK Notes bear higher rates of interest than the notes for which they were exchanged.
In 2009, gain on debt extinguishment of $1.9 million resulted from the repurchase of $4.0 million of our 9% Notes. In 2008, gain on debt extinguishment of $16.5 million resulted from the repurchase of $24.2 million of our 9% Notes.
Other expense of $1.9 million in 2009 consists primarily of $2.3 million of costs related to refinancing activities related to our note exchanges offset by $0.4 million in foreign currency conversions. Other income of $2.9 million in 2008 resulted primarily from the settlement of an acquired pension liability of $3.4 million offset by $0.3 million in foreign currency conversion.
50
Table of Contents
The provision for income taxes was $37.2 million in 2009 as compared to a provision for income taxes of $4.9 million in 2008. The effective rate for 2009 was (26.0%), which is lower than our normalized tax rate of 39.0%, in large part due to the recording of a deferred tax valuation allowance and an impairment charge.
Net loss was $180.5 million for 2009 compared with a net income of $12.1 million for 2008 for the reasons outlined above.
Year Ended December 31, 2008 Compared to Year Ended December 31, 2007
Total revenues for 2008 were $815.3 million, an increase of $63.7 million or 8.5%, compared to 2007 revenues. Transportation revenue decreased by $14.9 million or 2.6%, primarily due to a $43.0 million increase from the acquired Boasso operations offset by a $57.9 million decrease in our pre-existing business due to continuing softness in the housing and automotive industries and general weakening of our economy. We had an 11.5% decrease in the total number of miles driven as the average number of miles per load decreased over the prior year along with a 7.7% decrease in overall loads.
Other service revenue increased by $27.8 million, or 36.5%, compared to 2007. This increase was primarily due to a $30.4 million increase in revenue generated by the acquired Boasso operations.
Fuel surcharge revenue increased $50.8 million, or 53.6%, primarily due to an increase in fuel prices, and to the acquisition of Boasso, offset in part by a decrease in the total number of miles driven.
Purchased transportation decreased by $4.7 million, or 1.0%, due primarily to a reduction in our pre-existing business due to a weakened economy offset by $26.8 million of expense from the acquired Boasso operations. Total purchased transportation as a percentage of transportation revenue and fuel surcharge revenue decreased to 65.6% in 2008 versus 69.8% for the prior year due to the conversion of certain affiliate terminals to company-operated terminals. Our affiliates generated 50.7% of our transportation revenue and fuel surcharge revenue for 2008 compared to 56.7% for the prior year. We pay our affiliates a greater percentage of transportation revenues generated by them than is paid to independent owner-operators, so our purchased transportation costs will change as revenues generated by affiliates change as a percentage of total transportation revenue. During the 2008 and 2007 periods, we paid our affiliates approximately 85% of the transportation revenue and paid independent owner-operators approximately 65% of transportation revenue.
Compensation expense increased $23.3 million, or 27.1%, due primarily to $18.5 million of expense from the acquired Boasso operations. In addition, we had an increase of $6.1 million due to new or converted Company terminals added over the prior year and $0.9 million increase in healthcare costs partially offset by a reduction of approximately $2.3 million from wages and payroll taxes for positions eliminated in our plan of restructure.
Fuel, supplies and maintenance increased $33.0 million, or 40.6%, due primarily to $20.5 million of expense from the acquired Boasso operations, increased fuel costs of $11.7 million, increased equipment maintenance of $1.5 million and increased equipment lease costs of $0.6 million as we increase the capacity of our equipment.
Depreciation and amortization expense increased $3.5 million, or 19.7%, due primarily to increased depreciation and amortization from the acquired Boasso operations.
Selling and administrative expenses increased $4.5 million, or 14.5%, due primarily to $4.1 million of expense from the acquired Boasso operations. We also incurred an increase of $0.3 million in bad debt expense in 2008 due to credit adjustments in 2007 resulting from a reduction in days sales outstanding in 2007, and an increase of $0.4 million in professional fees offset by a decrease of $0.6 million of travel related costs.
Insurance claims expense decreased $8.9 million, or 37.2%, due primarily to a reduction in the number and severity of accidents that occurred during 2008 offset by an increase of $1.8 million for the acquired Boasso operations.
51
Table of Contents
Gain on disposal of property and equipment was $3.1 million in 2008 as compared to a loss of $1.0 million in 2007. The gain in the current year period resulted from the sale of land not used in our business compared with a loss in the prior year resulting from the disposals of certain tank wash equipment.
In 2008, we incurred restructuring costs of $5.3 million primarily due to employee termination benefits and costs associated with lease and contract terminations and other related exit activities related to our restructuring plan. The majority of these costs were related to our trucking operations.
Operating income increased $9.1 million, or 38.3%, compared to 2007. The operating margin for 2008 was 4.0% compared to 3.3% for 2007 as a result of the above items.
Interest expense increased by $4.2 million, or 13.4%, in 2008 compared to 2007 primarily due to interest on our new $50 million of the 2012 Notes issued in December 2007. These notes, along with our entry into a new asset-based loan facility in December 2007, were issued primarily to fund the acquisition of Boasso, and to repay a portion of the term loan under our previous credit facility. In conjunction with these notes, we are incurring increased amortization of the original issue discount related to these notes. In addition, the amortization of deferred financing costs has increased due to the refinancing of our previous revolving credit facility in December 2007.
We wrote off debt issuance costs of $0.3 million related to the partial repurchase of our 9% Notes in 2008. In 2007, we wrote off $1.2 million of debt issuance costs due to the refinancing of our previous revolving credit facility and term loan with our new asset-based loan facility and recorded a charge of $0.8 million for bridge loan commitment fees related to the Boasso acquisition in 2007.
Gain on debt extinguishment of $16.5 million resulted from the repurchase of $24.2 million of our 9% Notes.
Other income of $2.9 million in 2008 resulted primarily from the settlement of an acquired pension liability of $3.4 million offset by $0.3 million in foreign currency conversion. Other expense in 2007 contained $1.6 million of costs related to an unconsummated acquisition and refinancing activities offset by $0.7 million in foreign currency conversions.
The provision for income taxes was $4.9 million in 2008 as compared to a benefit from income taxes of $2.1 million in 2007. The effective rate for 2008 was 29.0%, which is lower than our anticipated 39.0% effective rate in large part due to recording a $1.2 million reduction to tax expense related to a pension adjustment. The Company’s effective rate would have been higher if this pension adjustment had not been recorded. This pension adjustment was related to an income item related to the release of a pension obligation that would never be subject to income tax.
Net income was $12.1 million for 2008 compared with a net loss of $7.6 million for 2007 for the reasons outlined above.
Segment Operating Results
We have two reportable business segments for financial reporting purposes that are distinguished primarily on the basis of services offered:
| • | Trucking, which consists of truckload transportation of bulk chemicals, and |
| • | Container Services, specifically intermodal tank container transportation and depot services. |
Segment revenues and operating income include the allocation of fuel surcharge to the trucking and container services segments. The operating income reported in our segments excludes amounts reported in Other operating income, such as gains and losses on disposal of property and equipment, impairment charge,
52
Table of Contents
restructuring costs, corporate and other unallocated amounts. Corporate and unallocated amounts include depreciation and amortization and other gains and losses. Although these amounts are excluded from the business segment results, they are included in reported consolidated earnings. Included in Other revenue are revenues from our equipment rental, our tank wash services for periods we operated our tank wash business and other value-added services. We have not provided specific asset information by segment, as it is not regularly provided to our chief operating decision maker for review.
Summarized segment operating results are as follows (in thousands):
| Three months ended June 30, | Change | |||||||||||||||||
| 2010 | % of Total |
2009 | % of Total |
$ | % | |||||||||||||
| Operating revenues: |
||||||||||||||||||
| Trucking |
$ | 134,482 | 75.7 | % | $ | 113,470 | 75.8 | % | 21,012 | 18.5 | % | |||||||
| Container Services |
26,238 | 14.8 | % | 17,878 | 11.9 | % | 8,360 | 46.8 | % | |||||||||
| Other revenue |
16,832 | 9.5 | % | 18,438 | 12.3 | % | (1,606 | ) | (8.7 | %) | ||||||||
| Total |
$ | 177,552 | 100.0 | % | $ | 149,786 | 100.0 | % | ||||||||||
| Operating income: |
||||||||||||||||||
| Trucking |
$ | 11,178 | 67.4 | % | $ | 8,104 | 69.2 | % | 3,074 | 37.9 | % | |||||||
| Container Services |
4,526 | 27.3 | % | 2,001 | 17.1 | % | 2,525 | 126.2 | % | |||||||||
| Other operating income |
888 | 5.3 | % | 1,601 | 13.7 | % | (713 | ) | (44.5 | %) | ||||||||
| Total |
$ | 16,592 | 100.0 | % | $ | 11,706 | 100.0 | % | ||||||||||
| Six months ended June 30, | Change | |||||||||||||||||
| 2010 | % of Total |
2009 | % of Total |
$ | % | |||||||||||||
| Operating revenues: |
||||||||||||||||||
| Trucking |
$ | 256,263 | 75.6 | % | $ | 224,618 | 75.0 | % | 31,645 | 14.1 | % | |||||||
| Container Services |
49,433 | 14.6 | % | 37,779 | 12.6 | % | 11,654 | 30.9 | % | |||||||||
| Other revenue |
33,189 | 9.8 | % | 37,121 | 12.4 | % | (3,932 | ) | (10.6 | )% | ||||||||
| Total |
$ | 338,885 | 100.0 | % | $ | 299,518 | 100.0 | % | ||||||||||
| Operating income: |
||||||||||||||||||
| Trucking |
$ | 21,711 | 69.8 | % | $ | 15,689 | 66.7 | % | 6,022 | 38.4 | % | |||||||
| Container Services |
8,202 | 26.4 | % | 5,290 | 22.5 | % | 2,912 | 55.1 | % | |||||||||
| Other operating income |
1,171 | 3.8 | % | 2,552 | 10.8 | % | (1,381 | ) | (54.1 | )% | ||||||||
| Total |
$ | 31,084 | 100.0 | % | $ | 23,531 | 100.0 | % | ||||||||||
| Year ended December 31, | Change | |||||||||||||||||
| 2009 | % of Total |
2008 | % of Total |
$ | % | |||||||||||||
| Operating revenue: |
||||||||||||||||||
| Trucking |
$ | 460,390 | 75.0 | % | $ | 653,618 | 80.2 | % | (193,228 | ) | (29.6 | )% | ||||||
| Container Services |
79,499 | 13.0 | 89,715 | 11.0 | (10,216 | ) | (11.4 | )% | ||||||||||
| Other revenue |
73,720 | 12.0 | 71,957 | 8.8 | 1,763 | 2.5 | % | |||||||||||
| Total |
$ | 613,609 | 100.0 | % | 815,290 | 100.0 | % | |||||||||||
| Operating income: |
||||||||||||||||||
| Trucking |
$ | 35,217 | 69.7 | $ | 41,291 | 73.5 | % | (6,074 | ) | (14.7 | )% | |||||||
| Container Services |
11,287 | 22.4 | 10,934 | 19.5 | 353 | 3.2 | % | |||||||||||
| Other operating income |
3,984 | 7.9 | 3,988 | 7.0 | (4 | ) | (0.1 | )% | ||||||||||
| Total |
$ | 50,488 | 100.0 | % | $ | 56,213 | 100.0 | % | ||||||||||
53
Table of Contents
| Year ended December 31, | Change | ||||||||||||||||||
| 2008 | % of Total |
2007 | % of Total |
$ | % | ||||||||||||||
| Operating revenue: |
|||||||||||||||||||
| Trucking |
$ | 653,618 | 80.2 | $ | 666,199 | 88.6 | % | (12,581 | ) | (1.9 | )% | ||||||||
| Container Services |
89,715 | 11.0 | 12,168 | 1.6 | 77,547 | 637.3 | % | ||||||||||||
| Other revenue |
71,957 | 8.8 | 73,191 | 9.8 | (1,234 | ) | (1.7 | )% | |||||||||||
| Total |
$ | 815,290 | 100.0 | % | $ | 751,558 | 100.0 | % | |||||||||||
| Operating income: |
|||||||||||||||||||
| Trucking |
$ | 41,291 | 73.5 | $ | 37,421 | 88.3 | % | 3,870 | 10.3 | % | |||||||||
| Container Services |
10,934 | 19.5 | (93 | ) | (0.2 | ) | 11,027 | 11,857.0 | % | ||||||||||
| Other operating income |
3,988 | 7.0 | 5,028 | 11.9 | (1,040 | ) | (20.7 | )% | |||||||||||
| Total |
$ | 56,213 | 100.0 | % | $ | 42,356 | 100.0 | % | |||||||||||
Three Months Ended June 30, 2010 Compared to Three Months Ended June 30, 2009
Operating revenue:
Trucking—revenues increased $21.0 million, or 18.5%, for the quarter ended June 30, 2010 compared to the same period for 2009, due to an increase of $12.6 million in linehaul revenue and an increase of $8.4 million of fuel surcharge.
Container Services—revenues increased $8.4 million, or 46.8%, for the quarter ended June 30, 2010 compared to the same period for 2009, due to an increase of $7.0 million in linehaul and other revenue and an increase of $1.4 million of fuel surcharge.
Other revenue—revenues decreased $1.6 million, or 8.7%, for the quarter ended June 30, 2010 compared to the same period for 2009, due primarily to a decrease in our tank wash revenue due to the sale of our tank wash business offset by an increase in rental income.
Operating income:
Trucking—operating income increased $3.1 million, or 37.9%, for the quarter ended June 30, 2010 compared to the same period for 2009, due to an increase in linehaul revenue and cost savings initiatives including conversion of company-operated terminals to independent affiliate terminals.
Container Services—operating income increased $2.5 million, or 126.2%, for the quarter ended June 30, 2010 compared to the same period for 2009, due to increased demand.
Other operating income—operating income decreased $0.7 million, or 44.5%, for the quarter ended June 30, 2010 compared to the same period for 2009, due primarily to reduced tank wash revenue.
Six Months Ended June 30, 2010 Compared to Six Months Ended June 30, 2009
Operating revenue:
Trucking—revenues increased $31.6 million, or 14.1%, for the six months ended June 30, 2010 compared to the same period for 2009 due to an increase of $17.8 million in linehaul revenue and an increase of $13.8 million of fuel surcharge.
Container Services—revenues increased $11.7 million, or 30.9%, for the six months ended June 30, 2010 compared to the same period for 2009 due to an increase of $9.4 million in linehaul and other revenue and an increase of $2.3 million of fuel surcharge.
54
Table of Contents
Other revenue—revenues decreased $3.9 million, or 10.6%, for the six months ended June 30, 2010 compared to the same period for 2009 due primarily to a decrease in our tank wash revenue offset by an increase in rental income.
Operating income:
Trucking—operating income increased $6.0 million, or 38.4%, for the six months ended June 30, 2010 compared to the same period for 2009 due to an increase in linehaul revenue and cost savings initiatives including conversion of company-operated terminals to independent affiliate terminals.
Container Services—operating income increased $2.9 million, or 55.1%, for the six months ended June 30, 2010 compared to the same period for 2009 due to increased demand.
Other operating income—operating income decreased $1.4 million, or 54.1%, for the six months ended June 30, 2010 compared to the same period for 2009, primarily due to reduced tank wash revenue due to the sale of our tank wash business.
Year Ended December 31, 2009 Compared to Year Ended December 31, 2008
Operating revenue:
Trucking—revenues decreased $193.2 million, or 29.6%, for 2009 compared to 2008 due to fewer miles driven due to a weakened economy and a decrease in fuel surcharge resulting from lower fuel prices in 2009.
Container Services—revenues decreased $10.2 million, or 11.4%, for 2009 compared to 2008 due to a decrease of $6.5 million in fuel surcharge and a decrease of $3.7 million in linehaul revenue.
Other revenue—revenues increased $1.8 million, or 2.5%, for 2009 compared to 2008 due primarily to an increase of $11.6 million in rental revenue offset by a decrease of $8.9 million in our tank wash revenue.
Operating income:
Trucking—operating income decreased $6.1 million, or 14.7%, for 2009 compared to 2008 primarily due to a decrease in linehaul revenue offset by cost savings initiatives and the conversion of company-operated terminals to affiliates terminals.
Container Services—operating income increased $0.4 million, or 3.2%, for 2009 compared to 2008 due to expanded terminal operations.
Other operating income—operating income decreased less than $0.1 million, or less than 1.0%, for 2009 compared to 2008, primarily due to reduced tank wash revenue.
Year Ended December 31, 2008 Compared to Year Ended December 31, 2007
Operating revenue:
Trucking—revenues decreased $12.6 million, or 1.9%, for 2008 compared to 2007 due to fewer miles driven due to a weakened economy partially offset by an increase in fuel surcharge resulting from increased fuel prices in 2008.
Container Services—revenues increased $77.5 million, or more than 100.0%, for 2008 compared to 2007 due to the acquired Boasso operations.
Other revenue—revenues decreased $1.2 million, or 1.7%, for 2008 compared to 2007 due primarily to a decrease in our tank wash revenue.
55
Table of Contents
Operating income:
Trucking—operating income increased $3.9 million, or 10.3%, for 2008 compared to 2007 primarily due to cost savings initiatives offset by fewer billed miles and the conversion of affiliates to company terminals which increased facility, leasing, and maintenance costs.
Container Services—operating income increased $11.0 million, or more than 100.0%, for 2008 compared to 2007 due to the acquired Boasso operations.
Other operating income—operating income decreased $1.0 million, or 20.7%, for 2008 compared to 2007, primarily due to reduced tank wash revenue.
Exchange Rates
We operate in Canada and Mexico as well as in the United States. Our results of operations are affected by the relative strength of currencies in the countries where we operate. Approximately 6.1%, 6.4% and 7.0% of our revenue in 2009, 2008 and 2007, respectively, was generated outside the United States.
In comparing the average exchange rates between 2009 and 2008, the Canadian dollar depreciated against the United States dollar by approximately 6.6% while the Mexican peso appreciated against the United States dollar by approximately 17.4%. The change in exchange rates negatively impacted revenue by approximately $2.7 million in 2009. The depreciation of the Canadian dollar was the primary reason for the $0.1 million net increase in cumulative currency translation loss in shareholders’ deficit for 2009.
Gains and losses included in the consolidated statements of operations from foreign currency transactions included a $0.4 million gain in 2009, a $0.3 million gain in 2008, and a $0.3 million gain in 2007. Risks associated with foreign currency fluctuations are discussed further in “Quantitative and Qualitative Disclosures about Market Risk” appearing in our Annual Report on Form 10-K for the fiscal year ended December 31, 2009, which has been incorporated by reference into this prospectus.
Liquidity and Capital Resources
We believe that our liquidity, asset-light business model and streamlined operations will provide us with the flexibility and competitive positioning to take advantage of opportunities as the economy recovers and volumes in our industry rebound. At June 30, 2010, we had $47.8 million of borrowing availability under the ABL Facility.
The following summarizes our cash flows for fiscal years 2009, 2008 and 2007 as reported in our audited consolidated statements of cash flows in the audited consolidated financial statements included elsewhere in this prospectus:
| Year Ended December 31, | ||||||||||||
| (In thousands) | 2009 | 2008 | 2007 | |||||||||
| Net cash provided by operating activities |
$ | 39,756 | $ | 19,593 | $ | 14,052 | ||||||
| Net cash provided by (used in) investing activities |
9,577 | (8,524 | ) | (63,399 | ) | |||||||
| Net cash (used in) provided by financing activities |
(50,515 | ) | (13,485 | ) | 52,194 | |||||||
| Effect of exchange rates |
28 | (508 | ) | 23 | ||||||||
| Net (decrease) increase in cash |
(1,154 | ) | (2,924 | ) | 2,870 | |||||||
| Cash at beginning of period |
6,787 | 9,711 | 6,841 | |||||||||
| Cash at end of period |
$ | 5,633 | $ | 6,787 | $ | 9,711 | ||||||
56
Table of Contents
The following summarizes our cash flows for the six months ended June 30, 2010 and June 30, 2009 as reported in our consolidated statements of cash flows in the unaudited consolidated financial statements included elsewhere in this prospectus:
| Six Months Ended June 30, |
||||||||
| (In thousands) | 2010 | 2009 | ||||||
| Net cash (used in) provided by operating activities |
$ | (6,134 | ) | $ | 22,498 | |||
| Net cash used in investing activities |
(2,366 | ) | (611 | ) | ||||
| Net cash provided by (used in) financing activities |
5,759 | (25,756 | ) | |||||
| Effect of exchange rate changes on cash |
— | 16 | ||||||
| Net decrease in cash and cash equivalents |
(2,741 | ) | (3,853 | ) | ||||
| Cash and cash equivalents at beginning of period |
5,633 | 6,787 | ||||||
| Cash and cash equivalents at end of period |
$ | 2,892 | $ | 2,934 | ||||
Historically, our primary source of liquidity has been cash flow from operations and borrowing availability under our ABL Facility. Our primary cash needs consist of working capital, capital expenditures and debt service including our ABL Facility and our notes. We incur capital expenditures for the purpose of purchasing tractors and trailers to meet our strategic needs during the year, and maintaining and improving our infrastructure. Our extensive use of independent affiliates and independent owner-operators results in a highly variable cost structure with relatively minimal capital investment requirements. Based on our current trailer fleet, we believe we have the ability to capture any additional business volume with minimal capital expenditures. Due to our recent transition to a predominantly affiliate-based business model, we expect our capital expenditures to generally amount to approximately 1% of operating revenues annually. We have incurred $5.7 million in capital expenditures during the six months ended June 30, 2010, and we expect capital expenditures for 2010 to be approximately $9.0 million, although the actual amount of capital expenditures could differ materially because of operating needs, regulatory changes, covenants in our debt arrangements, other expenses, including interest expense, or other factors.
Our primary cash needs consist of capital expenditures and debt service including the ABL Facility, the 9% Notes, the 2012 Notes, the 2013 Senior Notes and the 2013 PIK Notes. We incur capital expenditures for the purpose of purchasing tractors and trailers to meet our strategic needs during the year, and maintaining and improving our infrastructure.
As described in “Use of Proceeds” we intend to use $15.0 million of the net proceeds from our sale of shares in this offering to repay outstanding borrowings under the ABL Facility (without reducing commitments). We intend to use the remainder of such proceeds to retire a portion of our outstanding notes, either through redemption at par, plus accrued and unpaid interest, or opportunistically at prices below par, through tender offers and/or open market repurchases. Pending such use of the remainder of the proceeds, we may temporarily further repay outstanding borrowings under the ABL Facility.
In 2010, $16.0 million of our 9% Notes mature in addition to our regular payment obligations on capital leases, other notes and other indebtedness. We expect to fund payment of the maturing notes and redemption obligations under our 2013 Senior Notes, opportunistic retirements of our other debt during this period, and any cash needs for our operations during this period, through a combination of cash from operations, borrowings under the ABL Facility and the proceeds of this offering.
During the fourth quarter of 2008, we repurchased $24.2 million in aggregate principal amount of the 9% Notes for an aggregate purchase price of $7.7 million. During the first quarter of 2009, we purchased an additional $1.0 million in aggregate principal amount of the 9% Notes for an aggregate purchase price of $0.3 million. We believe that these purchases at a substantial discount to their principal amount were a good investment for us because the prices were substantially less than the amount that we would owe for the repurchased notes upon maturity, and we had adequate liquidity for such purchases.
57
Table of Contents
As described above, on October 15, 2009, we completed exchange and tender offers for our 2012 Notes and our 9% Notes. In connection with the exchange and tender offers, we received approximately $134.5 million of our 2012 Notes in exchange for $134.5 million of our new 2013 Senior Notes. We received approximately $83.6 million of our 9% Notes in exchange for approximately $80.7 million aggregate principal amount of our new 2013 PIK Notes, approximately 1.75 million warrants to purchase our common stock and $1.8 million in cash.
As of June 30, 2010, we have accrued $11.3 million for environmental claims and $16.9 million for loss and damage claims and the timing of the cash payment for such claims fluctuates from quarter to quarter.
Net cash used in operating activities was $6.1 million for the six-month period ended June 30, 2010 compared to $22.5 million provided by operating activities in the comparable 2009 period. The $28.6 million decrease in cash provided by operating activities was primarily due to the increased sales and related accounts receivable in the 2010 period.
Net cash used in investing activities totaled $2.4 million for the six-month period ended June 30, 2010 compared to $0.6 million used in the comparable 2009 period. The $1.8 million change resulted from a decrease in property and equipment sales proceeds received in 2010.
Net cash provided by financing activities was $5.8 million during the six-month period ended June 30, 2010, compared to $25.8 million used in financing activities in the comparable 2009 period. In 2010, increased borrowings of $11.5 million under our ABL facility were used to pay a large insurance claim, issue a loan to a new independent affiliate, and to pay down debt and capital lease obligations. In 2009, cash was utilized to repay $10.5 million of borrowings under our ABL Facility, to pay down debt and capital lease obligations, and repurchase $1.0 million in principal amount of our 9% Notes.
We generated $39.8 million, $19.6 million and $14.1 million in net cash from operating activities in 2009, 2008 and 2007, respectively. The increase in net cash provided by operating activities in 2009 as compared to 2008 is primarily due to increased collections of outstanding accounts receivable, lower loss and damage claim payments and lower operating expenses due to our restructuring and transition to affiliates or closure of many of our trucking terminals. The increase in net cash provided by operating activities in 2008 as compared to 2007 is primarily due to our net income for the year. We continued to experience softness in demand throughout 2009; however our continued restructuring and cost reduction efforts have enabled us to generate stronger operating cash. We have aligned our cost structure to allow for flat or declining revenues. The cash that we are required to pay in 2010 on our higher rate 2013 Senior Notes and 2013 PIK Notes will be mitigated in part because interest equal to 2.75% payable on the 2013 PIK Notes is payable through the issuance of additional notes rather than cash.
Net cash provided by (used in) investing activities in 2009, 2008 and 2007 was $9.6 million, $(8.5) million and $(63.4) million, respectively. Capital expenditures totaled $8.2 million, $14.8 million and $10.6 million in 2009, 2008 and 2007, respectively while proceeds from sales of property and equipment were $7.5 million, $6.3 million and $6.4 million, respectively. In 2009, we received cash of $10.0 million from the sale of tank wash assets. In 2008, we used net cash of $8.4 million to purchase new revenue equipment, the assets of two businesses and the assets of one affiliate. We used net cash of $52.4 million for the acquisition of Boasso and $6.8 million of cash to purchase the assets of two businesses and the assets of six affiliates in 2007, issued notes payable for $2.4 million and assumed $2.5 million in liabilities as part of the total consideration of these acquisitions.
Net cash provided by (used in) financing activities was $(50.5) million, $(13.5) million and $52.2 million in 2009, 2008 and 2007, respectively. In 2009, we primarily utilized cash to repay $19.0 million of our borrowings under our ABL facility, $17.7 million to pay down other debt and capital lease obligations including $2.1 million used to repurchase $4.0 million of 9% Notes and to pay financing fees of $4.9 million in connection with our exchange and tender offers. In 2008, we used cash of $7.7 million to repurchase $24.2 million of our 9% Notes. In addition, we generated cash from operations and sale of properties to pay down approximately $9.0 million of our debt obligations. We utilized a portion of our ABL Facility to finance the acquisition of Boasso in 2007.
58
Table of Contents
We believe that our current cash and cash equivalents, cash flow from operations, amounts available under the ABL Facility and the net proceeds to us from this offering will be sufficient to meet our anticipated cash needs for at least the next twelve months. We may, however, require additional cash resources due to changed business conditions or other future developments. If these sources are insufficient to satisfy our cash requirements, we may seek to sell debt securities or additional equity securities or obtain additional funds under our credit facility. The sale of convertible debt securities or additional equity securities could result in additional dilution to our shareholders. The incurrence of indebtedness would result in debt service obligations and could result in operating and financial covenants that would restrict our operations. We cannot assure you that financing will be available in amounts or on terms acceptable to us, if at all.
Off-Balance Sheet Arrangements
We have no off-balance sheet arrangements as defined under Item 303(a) (4) of Regulation S-K.
Contractual Obligations and Commitments
The following is a schedule of our long-term contractual commitments, including the current portion of our long-term indebtedness at June 30, 2010 over the periods we expect them to be paid (dollars in thousands). It does not reflect this offering or the application of proceeds therefrom:
| Total | Remainder of 2010 |
Years 2011 & 2012 |
Years 2013 & 2014 |
Year 2015 and after | |||||||||||
| Operating leases(1) |
$ | 37,555 | $ | 7,956 | $ | 16,796 | $ | 6,580 | $ | 6,223 | |||||
| Total indebtedness(2) |
324,541 | 17,528 | 6,004 | 299,878 | 1,131 | ||||||||||
| Capital leases |
14,157 | 2,164 | 9,116 | 2,877 | — | ||||||||||
| Interest on indebtedness(3) |
85,591 | 14,370 | 54,953 | 16,168 | 100 | ||||||||||
| Total |
$ | 461,844 | $ | 42,018 | $ | 86,869 | $ | 325,503 | $ | 7,454 | |||||
| (1) | These obligations represent the minimum rental commitments under all non-cancelable operating leases including the guaranteed residual values at the end of the leases. Includes lease for our corporate headquarters. We expect that some of our operating lease obligations for tractors will be partially offset by rental revenue from sub-leasing the tractors to independent owner-operators or independent affiliates. |
| (2) | Includes aggregate unamortized discount of $7.5 million. |
| (3) | Amounts presented for interest payments assume that all long-term debt obligations outstanding as of June 30, 2010 will remain outstanding until maturity and interest rates on variable-rate debt in effect as of June 30, 2010 will remain in effect until maturity. As discussed below, the maturity date of the ABL Facility may be accelerated if we default on our obligations under the ABL Facility. |
The following is a schedule of our long-term contractual commitments, including the current portion of our long-term indebtedness at June 30, 2010, over the periods we expect them to be paid (dollars in thousands), the application of $15.0 million of the net proceeds of the offering to repay outstanding borrowings under the ABL Facility (without reducing commitments), and the application of the remainder of such proceeds to redeem a portion of the 2013 Senior Notes at 100% of the principal amount plus accrued and unpaid interest although such remaining proceeds may be applied differently as described in “Use of Proceeds”:
| Total | Remainder of 2010 |
Years 2011 & 2012 |
Years 2013 & 2014 |
Year 2015 and after | |||||||||||
| Operating leases(1) |
$ | 37,555 | $ | 7,956 | $ | 16,796 | $ | 6,580 | $ | 6,223 | |||||
| Total indebtedness(2) |
|||||||||||||||
| Capital leases |
|
14,157 |
2,164 | 9,116 | 2,877 | — | |||||||||
| Interest on indebtedness(3) |
|||||||||||||||
| Total |
$ | $ | $ | $ | $ | ||||||||||
| (1) | These obligations represent the minimum rental commitments under all non-cancelable operating leases including the guaranteed residual values at the end of the leases. Includes lease for our corporate headquarters. We expect that some of our operating lease obligations for tractors will be partially offset by rental revenue from sub-leasing the tractors to independent owner-operators or independent affiliates. |
59
Table of Contents
| (2) | Includes aggregate unamortized discount of $7.5 million. We have assumed that $15.0 million of the net proceeds of the offering are applied to repay outstanding borrowings under the ABL Facility (without reducing commitments), and the remainder is applied to redeem a portion of the 2013 Senior Notes at 100% of principal amount plus accrued and unpaid interest. Notwithstanding the foregoing, alternatively we may opportunistically apply such proceeds to retire a portion of our outstanding notes (including our 2013 Senior Notes) at prices below 100%, whether through tender offer and/or open market repurchases. Pending such use of the remainder of the proceeds, we may temporarily further repay outstanding borrowings under the ABL Facility. See “Use of Proceeds.” |
| (3) | Amounts presented for interest payments assume that all long-term debt obligations outstanding as of June 30, 2010 (excluding amounts repaid with proceeds from this offering) will remain outstanding until maturity and interest rates on variable-rate debt in effect as of June 30, 2010 will remain in effect until maturity. As discussed below, the maturity date of the ABL Facility may be accelerated if we default on our obligations under the ABL Facility. |
Other Liabilities and Obligations
As of June 30, 2010, we have $11.3 million of environmental liabilities, $18.4 million of pension plan obligations and $16.9 million of accrued loss and damage claims. We expect to incur additional environmental costs in the future for environmental studies and remediation efforts that we will be required to undertake related to legacy sites related to our subsidiary, CLC. We believe the changes in our business activities as a result of the sale of the tank wash business will reduce our environmental compliance costs going forward. As of June 30, 2010, we had $36.0 million in outstanding letters of credit. We are required to provide letters of credit to our insurance administrator to cover the payment of claims. The outstanding letter of credit as of June 30, 2010 for our insurance administrator was $29.7 million. If we fail to meet certain terms of our agreement, the insurance administrator may draw down the entire letter of credit. The remaining $6.3 million of outstanding letters of credit relates to various leasing obligations and to satisfy certain USEPA requirements. As of June 30, 2010, we have a reserve related to uncertain tax positions of $2.2 million which includes total unrecognized tax benefits and interest and penalties that may be paid in future periods.
Long-term Debt
Our principal debt sources at June 30, 2010 consist of $16.0 million aggregate principal amount of our 9% Notes, $0.5 million principal amount of our 2012 Notes, $134.5 million aggregate principal amount of our 2013 Senior Notes, $82.3 million aggregate principal amount of our 2013 PIK Notes and our $225 million ABL Facility, $47.8 million which is available for borrowing as of June 30, 2010.
The ABL Facility
The ABL Facility, which was effective December 18, 2007, consists of a current asset-based revolving facility in an amount of $200.0 million (the “current asset tranche”) and a fixed asset-based revolving facility in an amount of $25.0 million (the “fixed asset tranche”). The total commitments under the fixed asset tranche will be reduced and the total commitments under the current asset tranche correspondingly increased by $5.0 million on December 18, 2010. Borrowings of revolving loans under the ABL Facility are allocated pro rata to the current asset tranche and the fixed asset tranche based on the then-current asset borrowing base and the then-current fixed asset borrowing base. The ABL Facility matures June 18, 2013. The maturity date of the ABL Facility may be accelerated if we default on our obligations under the ABL Facility.
The ABL Facility includes borrowing capacity of up to $150.0 million for letters of credit, which are allocated pro rata between the two tranches based on the then-current borrowing base for each tranche (or, if the credit extensions under the fixed asset tranche are repaid and the commitments thereunder are terminated prior to
60
Table of Contents
the termination of the ABL Facility, to the current asset tranche), and up to $10.0 million for swingline borrowings on same-day notice, which are allocated under the current asset tranche. The proceeds of the ABL Facility were used, together with the proceeds from other indebtedness, to finance a portion of the Boasso acquisition. The ABL Facility contains a fixed charge coverage ratio of 1.0 to 1.0 which only needs to be met if borrowing availability is less than $20 million. At June 30, 2010, we had $47.8 million of borrowing availability under the ABL Facility.
Borrowings under the ABL Facility bear interest at a rate equal to an applicable margin plus, at our option, either a base rate or LIBOR. The applicable margin for borrowings under the current asset tranche at June 30, 2010 was 1.00% with respect to base rate borrowings and 2.00% with respect to LIBOR borrowings. The applicable margin for borrowings under the fixed asset tranche at June 30, 2010 was 1.25% with respect to base rate borrowings and 2.25% with respect to LIBOR borrowings. The applicable margin for such borrowings will be reduced or increased based on the aggregate borrowing base availability under the ABL Facility over the life of the ABL Facility. The base rate for the ABL Facility is the higher of the prime rate and the federal funds overnight rate plus 0.50%. We are also required to pay a fee for utilized commitments under the ABL Facility at a rate equal to 0.25% per annum. The ABL Facility is required to be prepaid only to the extent that the aggregate amount of outstanding borrowings, unreimbursed letter of credit drawings and undrawn letters of credit under the relevant tranche exceed the lesser of the applicable commitments and the applicable borrowing base in effect at such time for such tranche. The borrowing base for the current asset tranche consists of eligible accounts receivable, eligible inventory and eligible truck and trailer fleet, and the borrowing base for the fixed asset tranche consists of eligible real property and certain eligible equipment. We may voluntarily repay outstanding loans under the ABL Facility at any time without premium or penalty, other than customary “breakage” costs with respect to LIBOR loans. The interest rate on the ABL Facility at June 30, 2010 and 2009 was 2.6% and 2.4%, respectively. The weighted average interest rate during fiscal year 2009 was 2.4%. All obligations under the ABL Facility are guaranteed by QDI and each of our wholly-owned domestic restricted subsidiaries (other than our immaterial subsidiaries). Obligations under the current asset tranche, and the guarantees of those obligations (as well as cash management obligations and any interest hedging or other swap agreements), are secured by a first priority lien on certain assets of QD LLC and the guarantors, including eligible accounts, eligible inventory and eligible truck and trailer fleet (“current asset tranche priority collateral”) and a second priority lien on all other assets of QD LLC and the guarantors, including eligible real property and certain eligible equipment (“fixed asset tranche priority collateral”). Obligations under the fixed asset tranche, and the guarantees of those obligations, are secured by a first-priority lien on fixed asset tranche priority collateral and a second priority lien on current asset tranche priority collateral.
We incurred $6.9 million in debt issuance costs relating to the ABL Facility. We are amortizing these costs over the term of the ABL Facility.
9% Senior Subordinated Notes Due 2010
On September 30, 2003, we issued $125.0 million aggregate principal amount of our 9% Notes. During the fourth quarter of 2008 and the first quarter of 2009, we repurchased $25.2 million in principal amount of the 9% Notes. On October 15, 2009, we completed exchange and tender offers to exchange approximately $80.7 million of our 9% Notes for $80.7 million aggregate principal amount of our new 2013 PIK Notes and approximately 1.75 million warrants to purchase our common stock and retired an additional $2.9 million of our 9% Notes for $1.8 million in cash. Upon the completion of the exchange and tender offer, we also amended the 9% Notes to eliminate or waive substantially all of the restrictive covenants, to eliminate certain events of default, to modify covenants regarding mergers and consolidations and modify or eliminate certain other provisions contained in the indentures governing the 9% Notes. As of June 30, 2010, approximately $16.0 million total principal amount of the 9% Notes remained outstanding.
The 9% Notes are the unsecured and senior subordinated obligations of QD LLC and QD Capital and are fully and unconditionally guaranteed on an unsecured and senior subordinated basis, jointly and severally, by QDI and certain of our U.S. restricted subsidiaries. We have the right to redeem the 9% Notes in whole or in part
61
Table of Contents
from time to time at 100% of the principal amount plus accrued and unpaid interest if any, to the date of redemption. The 9% Notes will mature on November 15, 2010. Interest on the 9% Notes is payable at the rate of 9% per annum and is payable semi-annually in cash on each May 15 and November 15.
We incurred $5.5 million in debt issuance costs relating to the issuance of the 9% Notes. During 2008 and 2009, we wrote-off approximately $0.3 million in debt issuance costs relating to repurchases of 9% Notes. Additionally $0.5 million of unamortized debt issuance costs relating to the 9% Notes are included in debt issuance costs related to the 2013 PIK Notes following their exchange for the 9% Notes. We are amortizing the remaining less than $0.1 million of debt issuance costs over the remaining term of the 9% Notes.
Senior Floating Rate Notes Due 2012
On January 28, 2005, we issued $85.0 million aggregate principal amount of our 2012 Notes. On December 18, 2007, we issued a second series of 2012 Notes in the original principal amount of $50.0 million. On October 15, 2009, we completed exchange and tender offers to exchange approximately $134.5 million of 2012 Notes for $134.5 million of our 2013 Senior Notes. Upon the completion of the exchange offer, we amended the 2012 Notes to eliminate or waive substantially all of the restrictive covenants, to eliminate certain events of default, to modify covenants regarding mergers and consolidations and modify or eliminate certain other provisions contained in the indentures governing the 2012 Notes. As of June 30, 2010, approximately $0.5 million total principal amount of the 2012 Notes remained outstanding.
The 2012 Notes are the unsecured and unsubordinated obligations of QD LLC and QD Capital and are fully and unconditionally guaranteed on an unsecured and unsubordinated basis, jointly and severally, by QDI and certain of its U.S. restricted subsidiaries. We may redeem all or any portion of the 2012 Notes upon not less than 30, nor more than 60, days’ notice at 100% of the principal amount plus accrued and unpaid interest if any, to the date of redemption. The 2012 Notes will mature on January 15, 2012. Interest on the 2012 Notes is payable quarterly in cash in arrears on each January 15, April 15, July 15 and October 15. The interest rate on the 2012 Notes at June 30, 2010 and 2009 was 4.8% and 5.6%, respectively. The weighted average interest rate during fiscal year 2009 and 2008 was 5.3% and 8.4%, respectively.
We incurred $2.5 million in debt issuance costs relating to the initial $85.0 million of the 2012 Notes and $2.3 million related to the second $50.0 million of the 2012 Notes. All of these unamortized debt issuance costs are included in debt issuance costs related to the 2013 Senior Notes following their exchange for the 2012 Notes.
10% Senior Notes Due 2013
On October 15, 2009, we issued approximately $134.5 million aggregate principal amount of our 2013 Senior Notes. The 2013 Senior Notes are the unsecured and unsubordinated obligations of QD LLC and QD Capital and are fully and unconditionally guaranteed on an unsecured and unsubordinated basis, jointly and severally, by QDI and certain of our U.S. restricted subsidiaries. Interest on the 2013 Senior Notes is payable at a rate of 10% per annum, semiannually on June 1 and December 1 of each year, commencing on June 1, 2010. The 2013 Senior Notes mature on June 1, 2013. On May 17, 2010, we satisfied our contractual obligation to exchange the 2013 Senior Notes sold in October 2009 for 2013 Senior Notes registered under the Securities Act.
We may redeem the 2013 Senior Notes, in whole or part, at any time at a price equal to 100% of the principal amount of the 2013 Senior Notes redeemed plus accrued and unpaid interest to the redemption date. Subject to certain conditions, we are obligated to redeem $6.0 million of 2013 Senior Notes on each June 1 and December 1, commencing December 1, 2010. Beginning in 2011, promptly following the delivery of our Annual Report on Form 10-K for each fiscal year, the 2013 Senior Notes are subject to additional mandatory redemption in an amount equal to 50% of the excess cash flow we generate minus $12.0 million. Both required redemption amounts will be reduced to the extent necessary so that:
| • | the sum of borrowing availability under the ABL Facility, plus unrestricted cash and cash equivalents, is at least $37.5 million; |
62
Table of Contents
| • | the minimum borrowing availability requirements under the ABL Facility are satisfied; |
| • | there is fixed charge coverage ratio of at least 1.0 to 1.0 as calculated under the ABL Facility; and |
| • | no other event of default is otherwise caused under the ABL Facility by the redemption. |
The required redemption amounts are also reduced by any optional redemptions and repurchases during the redemption period.
We recorded $3.6 million in debt issuance costs relating to the 2013 Senior Notes, of which $2.0 million of unamortized debt issuance costs related to the 2012 Notes and $1.6 million was related to the new issuance. We are amortizing these costs over the remaining term of the 2013 Senior Notes.
11.75% Senior Subordinated PIK Notes Due 2013
On October 15, 2009, we issued $80.7 million aggregate principal amount of our 2013 PIK Notes. The 2013 PIK Notes are the unsecured and senior subordinated obligations of QD LLC and QD Capital and are fully and unconditionally guaranteed on an unsecured and senior subordinated basis, jointly and severally, by QDI and certain of our U.S. restricted subsidiaries. Interest is payable on the 2013 PIK Notes at 11.75% per annum, payable 9% in cash and 2.75% in the form of additional 2013 PIK Notes, quarterly on February 1, May 1, August 1 and November 1 of each year, commencing on February 1, 2010. On May 17, 2010, we satisfied our contractual obligation to exchange the 2013 PIK Notes sold in October 2009 for 2013 PIK Notes registered under the Securities Act.
The 2013 PIK Notes mature on November 1, 2013. We may redeem the 2013 PIK Notes, in whole or part, at any time prior to October 15, 2010, at a price equal to 100% of the principal amount of the 2013 PIK Notes redeemed plus accrued and unpaid interest to the redemption date plus an additional “make-whole premium.” After October 15, 2010, we may redeem the 2013 PIK Notes, in whole or part, at any time at a price equal to 100% of the principal amount of the 2013 PIK Notes redeemed plus accrued and unpaid interest to the redemption date. Additionally, at any time prior to October 15, 2010, we may redeem up to 35% of the principal amount of the 2013 PIK Notes at a redemption premium equal to 11.75% of the face amount thereof with the net proceeds of one or more equity offerings so long as at least 65% of the aggregate original principal amount of the 2013 PIK Notes remains outstanding afterwards.
We recorded $1.5 million in debt issuance costs relating to the 2013 PIK Notes, of which $0.5 million of unamortized debt issuance costs related to the 9% Notes and $1.0 million were related to the new issuance. In addition, we recorded $6.7 million in note issuance discount due to the warrants issued. The amount represents the fair market value of the warrants at time of issuance. We are amortizing these costs over the remaining term of the 2013 PIK Notes.
The note exchanges described above were treated as a debt modification in accordance with applicable FASB guidance.
Boasso Note
The promissory note issued in connection with our acquisition of the stock of Boasso was a $2.5 million 7% promissory note with a maturity on December 18, 2009 issued as part of the purchase price of the Boasso acquisition. The holder of the Boasso Note had the option to require prepayment of the Boasso note, which he exercised on December 18, 2008. The Boasso Note was paid in full in January 2009.
Collateral, Guarantees and Covenants
The ABL Facility contains a number of covenants that, among other things, restrict, subject to certain exceptions, our ability to (i) sell assets; (ii) incur additional indebtedness; (iii) prepay other indebtedness
63
Table of Contents
(including the 2013 Senior Notes, the 2012 Notes, the 2013 PIK Notes and the 9% Notes); (iv) repurchase or pay dividends on QDI’s common stock; (v) create liens on assets; (vi) make investments; (vii) make certain acquisitions; (viii) engage in mergers or consolidations; (ix) engage in certain transactions with independent affiliates; (x) amend certain charter documents and material agreements governing subordinated indebtedness, including the 2013 Senior Notes, the 2012 Notes, the 2013 PIK Notes and the 9% Notes; (xi) change the business conducted by us and our subsidiaries; and (xii) enter into agreements that restrict dividends from subsidiaries. The ABL Facility also contains certain customary events of default, which, if any of them occurs, may result in the principal, interest and any other monetary obligations under the ABL Facility becoming immediately payable.
The indentures governing our 2013 Senior Notes and our 2013 PIK Notes contain covenants that restrict, subject to certain exceptions, our ability to, among other things: (i) incur additional debt or issue certain preferred shares; (ii) pay dividends on or make other distributions in respect of QDI’s common stock or make other restricted payments; (iii) make certain investments; (iv) sell certain assets; (v) create or permit to exist dividend and/or payment restrictions affecting their restricted subsidiaries; (vi) create liens on certain assets to secure debt; (vii) consolidate, merge, sell or otherwise dispose of all or substantially all of their assets; (viii) enter into certain transactions with their independent affiliates; and (ix) designate their subsidiaries as unrestricted subsidiaries. The indentures also provide certain customary events of default, which, if any of them occurs, may result in the principal, interest and any other monetary obligations on the then outstanding 2013 Senior Notes and 2013 PIK Notes becoming payable immediately.
The payment obligations under the ABL Facility are senior secured obligations of QD LLC and QD Capital and are secured by certain assets and its subsidiaries. The payment obligations of QD LLC and QD Capital under the 9% Notes, the 2012 Notes, the 2013 Senior Notes and the 2013 PIK Notes are guaranteed by QDI, and by all of its domestic subsidiaries. The 9% Notes and the 2013 PIK Notes, and the guarantees thereof are senior subordinated unsecured obligations ranking junior in right of payment to all of our existing and future senior debt, and all liabilities of our subsidiaries that do not guarantee the 9% Notes the 2013 PIK Notes, as applicable. All of the notes are effectively junior to all of our existing and future secured debt, including borrowings under the ABL Facility, to the extent of the value of the assets securing such debt.
We were in compliance with the covenants under the ABL Facility, the 2013 Senior Notes and the 2013 PIK Notes at June 30, 2010.
Debt Retirement
The following is a schedule of our indebtedness at June 30, 2010 over the periods we are required to pay such indebtedness (in thousands):
| Remainder of 2010 |
2011 | 2012 | 2013 | 2014 and after |
Total | |||||||||||||
| Capital lease obligations |
$ | 2,164 | $ | 4,312 | $ | 4,804 | $ | 2,298 | $ | 579 | $ | 14,157 | ||||||
| ABL Facility |
— | — | — | 79,500 | — | 79,500 | ||||||||||||
| 9% Senior Subordinated Notes, due 2010 |
16,031 | — | — | — | — | 16,031 | ||||||||||||
| Senior Floating Rate Notes, due 2012 |
— | — | 501 | — | — | 501 | ||||||||||||
| 10% Senior Notes, due 2013(1) |
— | — | — | 134,499 | — | 134,499 | ||||||||||||
| 11.75% Senior Subordinated PIK Notes, due 2013(1) |
— | — | — | 82,331 | — | 82,331 | ||||||||||||
| Other Notes |
1,497 | 2,848 | 2,656 | 2,601 | 2,077 | 11,679 | ||||||||||||
| Total |
$ | 19,692 | $ | 7,160 | $ | 7,961 | $ | 301,229 | $ | 2,656 | $ | 338,698 | ||||||
| (1) | Amounts do not include the remaining aggregated unamortized original issue discount of $7.5 million. |
64
Table of Contents
The following is a schedule of our indebtedness at June 30, 2010 over the periods we are required to pay such indebtedness (dollars in thousands) after giving effect to this offering, the application of $15.0 million of the net proceeds of the offering to repay outstanding borrowings under the ABL Facility (without reducing commitments), and the application of the remainder of such proceeds remainder to redeem a portion of the 2013 Senior Notes at 100% of the principal amount plus accrued and unpaid interest although such proceeds may be applied differently as described in “Use of Proceeds”:
| Remainder of 2010 |
2011 | 2012 | 2013 | 2014 and after |
Total | |||||||||||||
| Capital lease obligations |
$ | 2,164 | $ | 4,312 | $ | 4,804 | $ | 2,298 | $ | 579 | $ | 14,157 | ||||||
| ABL Facility |
— | — | — | |||||||||||||||
| 9% Senior Subordinated Notes, due 2010 |
16,031 | — | — | — | — | 16,031 | ||||||||||||
| Senior Floating Rate Notes, due 2012 |
— | — | 501 | — | — | 501 | ||||||||||||
| 10% Senior Notes, due 2013(1) |
— | — | — | |||||||||||||||
| 11.75% Senior Subordinated PIK Notes, due 2013(1) |
— | — | — | 82,331 | — | 82,331 | ||||||||||||
| Other Notes |
1,497 | 2,848 | 2,656 | 2,601 | 2,077 | 11,679 | ||||||||||||
| Total |
$ | 19,692 | $ | 7,160 | $ | 7,961 | $ | $ | 2,656 | $ | ||||||||
| (1) | Amounts do not include the remaining aggregated unamortized original issue discount of $7.5 million. |
The following is a schedule of our debt issuance costs (in thousands):
| December 31, 2009 Balance |
Amortization Expense |
June 30, 2010 Balance | ||||||||
| ABL Facility |
$ | 4,284 | $ | (624 | ) | $ | 3,660 | |||
| 9% Senior Subordinated Notes, due 2010 |
69 | (40 | ) | 29 | ||||||
| 10% Senior Notes, due 2013 |
3,425 | (503 | ) | 2,922 | ||||||
| 11.75% Senior Subordinated PIK Notes, due 2013 |
1,426 | (186 | ) | 1,240 | ||||||
| Total |
$ | 9,204 | $ | (1,353 | ) | $ | 7,851 | |||
Amortization expense of deferred issuance costs was $1.4 million for the six months ending June 30, 2010 and 2009. We are amortizing these costs over the term of the debt instruments.
Liquidity
We believe that, based on current operations and anticipated growth, our cash flow from operations, together with available sources of liquidity, including proceeds from this offering and borrowings under the ABL Facility, will be sufficient to fund anticipated capital expenditures, make required payments of principal and interest on our debt, including obligations under our credit agreement, and satisfy other long-term contractual commitments for the next twelve months.
However, for periods extending beyond twelve months, if our operating cash flow and borrowings under the ABL Facility are not sufficient to satisfy our capital expenditures, debt service and other long-term contractual commitments, we would be required to seek alternative financing. These alternatives would likely include another restructuring or refinancing of our long-term debt, the sale of a portion or all of our assets or operations, or the sale of additional debt or equity securities. If these alternatives were not available in a timely manner or on satisfactory terms, or were not permitted under any of our debt agreements and we default on our obligations, our indebtedness could be accelerated and our assets might not be sufficient to repay in full all of our indebtedness.
65
Table of Contents
Market Risk
We are subject to market risks from (i) interest rates due to our variable interest rate indebtedness, (ii) foreign currency fluctuations due to our international operations and (iii) increased commodity prices due to the diesel consumption necessary for our operations. During the last three years, we have not held derivative instruments or engaged in other hedging transactions to reduce our exposure to such risks.
Interest Rate Risk
We are exposed to the impact of interest rate changes through our variable-rate borrowings under the ABL Facility and the 2012 Notes. With regard to the ABL Facility, at QD LLC’s option, the applicable margin for borrowings under the current asset tranche at June 30, 2010 was 1.00% with respect to base rate borrowings and 2.00% with respect to LIBOR borrowings. The applicable margin for borrowings under the fixed asset tranche at June 30, 2010 was 1.25% with respect to base rate borrowings and 2.25% with respect to LIBOR borrowings. The applicable margin for such borrowings will be reduced or increased based on aggregate borrowing base availability under the ABL Facility over the life of the ABL Facility. The base rate under the ABL Facility is equal to the higher of the prime rate and the federal funds overnight rate plus 0.50%. The base rate for our 2012 Notes is LIBOR plus 4.50%.
| (dollars in thousands) | Balance at June 30, 2010 |
Interest Rate at June 30, 2010 |
Effect of 1% Increase | |||||
| ABL Facility |
$ | 79,500 | 2.56% | $ | 795 | |||
| Senior Floating Rate Notes, due 2012 |
501 | 4.80% | 5 | |||||
| Total |
$ | 80,001 | $ | 800 | ||||
At June 30, 2010, a 1.00% increase in the current per annum interest rate for each would result in $0.8 million of additional interest expense during the next year. The foregoing calculation assumes an instantaneous 1.00% increase in the rates of all of our indebtedness and that the principal amount of each is the amount outstanding as of June 30, 2010. The calculation therefore does not account for the differences in the market rates upon which the interest rates of our indebtedness are based, our various options to elect the lower of two different interest rates under our borrowings or other possible actions, such as prepayment, that we might take in response to any rate increase.
We reduced our exposure to variable borrowings on October 15, 2009, when we exchanged substantially all of our floating rate 2012 Notes for our fixed rate 2013 Senior Notes.
Foreign Currency Exchange Rate Risk
Operating in international markets involves exposure to the possibility of volatile movements in foreign exchange rates. The currencies in each of the countries in which we operate affect:
| • | the results of our international operations reported in United States dollars; and |
| • | the value of the net assets of our international operations reported in United States dollars. |
These exposures may impact future earnings or cash flows. Revenue from foreign locations (Canada and Mexico) represented approximately 5.6% of our consolidated revenue for the six months ended June 30, 2010 and 6.1% of our consolidated revenue for the six months ended June 30, 2009, and 6.1% of our consolidated revenue in 2009 and 6.4% of our consolidated revenue in 2008. The economic impact of foreign exchange rate movements is complex because such changes are often linked to variability in real growth, inflation, interest rates, governmental actions and other factors. These changes, if material, could cause us to adjust our financing and operating strategies. Therefore, to isolate the effect of changes in currency does not accurately portray the effect of these other important economic factors. As foreign exchange rates change, translation of the income
66
Table of Contents
statements of our international subsidiaries into U.S. dollars affects year-over-year comparability of operating results. While we may hedge specific transaction risks, we generally do not hedge translation risks because we believe there is no long-term economic benefit in doing so.
Assets and liabilities for our Canadian operations are matched in the local currency, which reduces the need for dollar conversion. Our Mexican operations use the United States dollar as their functional currency. Any foreign currency impact on translating assets and liabilities into dollars is included as a component of shareholders’ equity. Our revenue results for the six months ended June 30, 2010 were positively impacted by a $2.6 million foreign currency movement, primarily due to the strengthening of the Canadian dollar against the United States dollar.
Changes in foreign exchange rates that had the largest impact on translating our international operating profits for the first six months of 2010 related to the Canadian dollar versus the United States dollar. We estimate that a 1% adverse change in the Canadian dollar foreign exchange rate would have decreased our revenues by approximately $0.2 million for the six months ended June 30, 2010, assuming no changes other than the exchange rate itself. Our inter-company loans are subject to fluctuations in exchange rates primarily between the United States dollar and the Canadian dollar. Based on the outstanding balance of our inter-company loans at June 30, 2010, a change of 1% in the exchange rate for the Canadian dollar would cause a change in our foreign exchange result of less than $0.1 million.
Commodity Price Risk
The price and availability of diesel fuel are subject to fluctuations due to changes in the level of global oil production, seasonality, weather, global politics and other market factors. Historically, we have been able to recover a majority of fuel price increases from our customers in the form of fuel surcharges. The price and availability of diesel fuel can be unpredictable as well as the extent to which fuel surcharges can be collected to offset such increases. In 2009 and 2008 and for the six months ended June 30, 2010, a majority of fuel price increases were recovered through fuel surcharges.
Net Operating Loss Carryforwards
Depending on the size of this offering, the offering may result in an ownership change for purposes of applying an annual limitation on the ability to use net operating losses, as set forth in section 382 of the of the Code. It is also possible that subsequent transactions may cause such an ownership change. As of December 31, 2009, we had net operating loss carryforwards of $95.7 million. Even if an ownership change were to result from this offering such that section 382 of the Code were to impose an annual limitation on the use of our net operating loss carryforwards, we believe our net operating loss carryforwards would be sufficiently available, for federal income tax purposes, to offset our regular taxable income. Accordingly, although our net operating loss carryforwards might be limited as a result of an ownership change, we do not believe that the limitation would materially affect our after-tax cash flow.
67
Table of Contents
The following table sets forth certain information as of August 31, 2010 with respect to our directors and executive officers:
| Name |
Age | Position | ||
| Gary R. Enzor |
48 | Chief Executive Officer and Director | ||
| Stephen R. Attwood |
58 | President and Chief Operating Officer | ||
| Joseph J. Troy |
46 | Executive Vice President and Chief Financial Officer | ||
| Jonathan C. Gold |
46 | Senior Vice President, General Counsel and Secretary | ||
| Randall T. Strutz |
45 | Senior Vice President of Sales | ||
| Marc E. Becker |
38 | Director | ||
| Kevin E. Crowe |
28 | Director | ||
| Richard B. Marchese |
68 | Director | ||
| Thomas R. Miklich |
63 | Director | ||
| M. Ali Rashid |
34 | Director | ||
| Alan H. Schumacher |
64 | Director | ||
| Thomas M. White |
52 | Director |
Our directors hold office until their successors have been elected and qualified, or, if earlier, upon their death, resignation, removal or disqualification. Officers serve at the discretion of the Board of Directors. Following the consummation of this offering, we will no longer be a “controlled company” for the purposes of The NASDAQ Global Market’s corporate governance requirements and therefore we will be subject to the NASDAQ rule requiring that at least a majority of the board of directors is composed of “independent” directors. We do not anticipate that this will require us to change the composition of our Board of Directors because the majority of our Board of Directors is currently composed of independent directors under the NASDAQ rules.
Gary R. Enzor has been a director of QDI since 2008. He has served as our Chief Executive Officer since June 2007 and as President of QDI from November 2005 to July 2010. Mr. Enzor joined QDI in December 2004 as Executive Vice President and Chief Operating Officer. Prior to joining QDI, Mr. Enzor served as Executive Vice President and Chief Financial Officer of Swift Transportation Company, Inc. since August 2002. Prior to Swift, Mr. Enzor held executive positions with, Dell Computer and AlliedSignal, Inc. (now Honeywell International, Inc.). Mr. Enzor provides the board with an intimate knowledge of our operations as well as industry knowledge from his considerable experience in the trucking sector.
Stephen R. Attwood joined QDI in July 2008 as Senior Vice President and Chief Financial Officer, and was named President and Chief Operating Officer in July 2010. Prior to joining QDI, Mr. Attwood served as Controller and Vice President of Swift Transportation Co., Inc. Previously, Mr. Attwood held senior management positions with Dell Computer and AlliedSignal Inc. (now Honeywell International, Inc.).
Joseph J. Troy joined QDI in August 2010 as Executive Vice President and Chief Financial Officer. Prior to joining QDI, Mr. Troy was Chairman and Chief Financial Officer of GuardianLion Wireless, LLC, a developer of unique personal locator devices from January 2009 through August 2010. From 2000 to 2008, Mr. Troy held a variety of senior executive positions and roles at Walter Industries, Inc. (predecessor to Walter Energy, Inc.) over his tenure with the company, including Executive Vice President & Chief Financial Officer, Treasurer, Business Development/M&A, President & CEO of Walter’s residential mortgage business. Prior to Walter Industries, Mr. Troy held various banking positions with NationsBank and its predecessor institutions. Mr. Troy presently serves on the board of directors of Cellu Tissue Holdings, Inc. (NYSE: CLU) and GuardianLion Wireless. Mr. Troy also serves on various charitable boards in Tampa, including Kids Charity of Tampa Bay, Inc. and A Kid’s Place, Inc. which support children in the foster care system. Mr. Troy earned a BBA and MBA in Finance from Loyola University in Maryland.
68
Table of Contents
Jonathan C. Gold has served as QDI’s Senior Vice President, General Counsel and Secretary since April 1, 2007. Mr. Gold joined QDI in January 2005 as Vice President, Associate General Counsel and Assistant Secretary. Prior to his employment with the Company, Mr. Gold served as corporate counsel with CSX Transportation, Inc. and Vice President, General Counsel and Secretary with Softmart, Inc. In addition, Mr. Gold was in private practice in Washington, D.C. and served as Judicial Clerk to the Honorable Harvey E. Schlesinger, Senior U.S. District Judge for the Middle District of Florida. Mr. Gold retired from the U.S. Army Reserve in 2007 after more than 20 years of active and reserve military service and is a decorated veteran of Operation Iraqi Freedom.
Randall T. Strutz joined QDI on April 5, 2010 as Senior Vice President of Sales. Mr. Strutz, 45, was CEO of Morgan Systems, Inc., a start-up third-party logistics provider from 2008 until 2010. Prior to that, he worked for six years at Pacer International Inc., a leading transportation and logistics provider. While at Pacer, he held various executive positions including Chief Commercial Officer, President of Rail Brokerage and Chief Operating Officer-Retail Intermodal.
Marc E. Becker has been a director of QDI since June 1998. Mr. Becker is a partner of Apollo. He has been employed with Apollo since 1996 and has served as an officer of certain affiliates of Apollo since 1999. Prior to that time, Mr. Becker was employed by Salomon Smith Barney Inc. within its investment banking division. Mr. Becker serves on several boards of directors including Affinion Group, Inc., Realogy Corporation, SourceCorp, Inc. and Vantium Corp. Mr. Becker was previously a member of the board of directors of UAP Holding Corp., Pacer International Inc., National Financial Partners Corp. and Metals USA Holdings. Mr. Becker brings to the board his extensive experience with highly-leveraged companies like us, from his time at Apollo, prior investment banking experiences, and board service as well as an understanding of our company from over 11 years of board service.
Kevin E. Crowe has been a director of QDI since November 2009. Mr. Crowe has been employed by Apollo since August of 2006. From June of 2004 until June of 2006, Mr. Crowe was a member of the Financial Sponsors Group within the Global Banking department at Deutsche Bank. Mr. Crowe graduated in 2004 from Princeton University with an AB in Economics and a certificate in Finance. Mr. Crowe is a director of Prestige Cruise Holdings, Inc. Mr. Crowe’s education and experience in the global banking sector enable him to provide the board insight regarding our liquidity and capital resources issues as well as other complex financial issues that we may experience.
Richard B. Marchese has been a director of QDI since January 2004. Mr. Marchese served as QDI’s interim Chief Financial Officer from September through November 2004. Mr. Marchese served as Vice President Finance, Chief Financial Officer and Treasurer of Georgia Gulf Corporation from 1989 until his retirement at the end of 2003. Prior to 1989, Mr. Marchese served as the Controller of Georgia Gulf Corporation and prior to that as the Controller of the Resins Division of Georgia Pacific Corporation. Mr. Marchese is a director of Nalco Holding Company, BlueLinx Holdings, Inc. and Texas Petrochemicals, Inc. Mr. Marchese brings extensive finance and operations experience to the board. His experience as a director of public companies in various industries enables Mr. Marchese to bring a broad perspective to the Board.
Thomas R. Miklich has been a director of QDI since May 2005. He was Chief Financial Officer of OM Group, Inc., a chemical company specializing in nickel and cobalt products, from 2002 until his retirement in 2004. Prior to that, he was Chief Financial Officer and General Counsel of Invacare Corporation from 1993 to 2002. Mr. Miklich was a director of United Agri Products from 2004 until its sale in 2007. He was a director of Titan Technology Partners, a privately held IT consulting firm, from 2004 until 2007 and its CFO from 2005 until 2007. He is a director of Noranda Aluminum Holding Corporation and was previously a director of UAP Holding Corp. Mr. Miklich is a CPA (inactive) and an attorney (inactive). Mr. Miklich can provide the board with valuable insight into the environment our customers face as he has over 30 years of diverse financial and legal experience with mid-to-large capitalization public companies, including those in the chemical industry.
69
Table of Contents
M. Ali Rashid has been a director of QDI since June 2005 and is a principal of Apollo. He has been employed with Apollo since 2000. Prior to joining Apollo, Mr. Rashid was employed by the Goldman Sachs Group, Inc. in the Financial Institutions Group of its Investment Banking Division from August 1998 to July 2000. Mr. Rashid received an MBA from the Stanford Graduate School of Business and graduated Magna Cum Laude and Beta Gamma Sigma from Georgetown University with a B.S. in Business Administration. He is a director of Metals USA, Inc., Realogy Corporation and Noranda Aluminum Holding Corporation. Mr. Rashid brings to the board experience with complex financial issues facing highly-leveraged organizations like us from his current position at Apollo and his prior investment banking experience. He also provides the Board with an understanding of executive compensation and incentive arrangements from his work experience and service on other public company boards of directors.
Alan H. Schumacher has been a director of QDI since May 2004. Mr. Schumacher is a member of the Federal Accounting Standards Advisory Board. From 1977 to 2000, he served in various financial positions at American National Can and American National Can Group, the last four years serving as Executive Vice President and Chief Financial Officer. Mr. Schumacher was a director of Anchor Glass Container Inc. from 2003 until 2006. Mr. Schumacher is a director of BlueLinx Holdings, Inc., Equable Ascent Financial, Traxis Group B.V. and Noranda Aluminum Holding Corporation. With his years of financial reporting experience, including service as a the Chief Financial Officer and other public company audit committees, Mr. Schumacher provides the board with experience in oversight of financial reporting and internal controls.
Thomas M. White has been a director of QDI since November 6, 2007. Mr. White joined Apollo in May 2007 as an Operating Partner in the distribution and transportation industries. He is currently serving as Chief Financial Officer of SkyLink Aviation, Inc., an Apollo owned entity based in Toronto. During 2009, Mr. White served as interim Chief Financial Officer of CEVA Group, plc, an Apollo owned entity based in the Netherlands. From 2002 to 2007, Mr. White was the Senior Vice President, Chief Financial Officer and Treasurer of Hub Group, Inc., a NASDAQ listed company providing transportation management, intermodal, truck brokerage and logistics services. Prior to joining Hub Group, Mr. White was a senior audit partner with Arthur Andersen, which he joined in 1979. Mr. White currently serves on the board of directors of CEVA Group plc, (audit committee) and Landauer, Inc., an NYSE listed company (audit committee chair and compensation committee). Mr. White served on the board of directors of FTD, Inc., an NYSE listed company until its sale in August 2008 (compensation committee chair and audit committee). Mr. White is a CPA. With his experience as a Chief Financial Officer, as a senior audit partner at Arthur Andersen, and service on other audit committees, including that of a public company, as well as his educational background, Mr. White brings an understanding of financial statements, financial reporting and internal controls, to our board. Mr. White also has management experience in the trucking sector.
70
Table of Contents
General
The following description of our capital stock, provisions of our amended and restated articles of incorporation and specific provisions of Florida laws are summaries thereof and are qualified in their entirety by reference to the Florida Business Corporation Act and our amended and restated articles of incorporation and amended and restated bylaws. Copies of our amended and restated articles of incorporation and our amended and restated bylaws have been filed with the SEC.
Under our Amended and Restated Articles of Incorporation which became effective on November 4, 2003, as amended on June 28, 2005 and May 28, 2010, our capital stock consists of 50,000,000 total authorized shares, consisting of (a) 49,000,000 shares designated as “Common Stock,” no par value per share and (b) 1,000,000 shares designated as “Preferred Stock,” no par value per share, of which 600,000 are designated as “Convertible Preferred Stock.”
No holder of shares of our capital stock shall, pursuant to our amended and restated articles of incorporation, have any preferential or preemptive right to subscribe for, purchase or receive any shares of its stock, any options or warrants for shares of its stock, any rights to subscribe to or purchase any shares or any securities which may at any time or from time to time be issued, sold or offered for sale by us.
Pursuant to the terms of certain agreements among us, Apollo and certain other of our shareholders, Apollo and certain shareholders have preemptive rights to purchase shares of our capital stock or securities containing options or warrants to acquire shares of our capital stock if we propose to issue any such securities. However, such rights are not implicated by this offering. In addition, Apollo and certain shareholders and management have piggyback registration rights entitling them to require us to register shares of our common stock owned by them in connection with certain registration statements filed by us. Such rights have either been waived or are not applicable in connection with this offering.
As of June 30, 2010, there were outstanding 21.5 million shares of common stock held by approximately 86 shareholders of record and no shares of preferred stock were outstanding. In addition, as of June 30, 2010, there were outstanding options to purchase an aggregate of approximately 2.2 million shares of common stock and outstanding warrants to purchase an aggregate of approximately 445,929 million shares of common stock.
71
Table of Contents
Common Stock
The holders of shares of our common stock are entitled to:
| • | one vote for each share of common stock held of record on all matters submitted to a vote of shareholders; |
| • | receive ratably such dividends as may be declared by our Board of Directors out of funds legally available therefor, after all required dividends are paid to the holders of our outstanding shares of Preferred Stock; and |
| • | in the event of our liquidation, dissolution or winding up, share ratably in all assets which remain after payment of all of our corporate debts and the required payment of all amounts due to the holders of our outstanding shares of Preferred Stock, if any. |
Voting is noncumulative, and all shares of our common stock outstanding on June 30, 2010 were fully paid and non-assessable.
Preferred Stock
Shares of preferred stock may be issued from time to time, in one or more classes or series, with the relative rights, preferences, qualifications, and limitations of the shares of any class or series so established, including, without limitation, the number of shares constituting such class or series, dividend rights, conversion rights, redemption privileges, voting powers, and liquidation preferences, and the ability to increase or decrease the size of any such class or series (but not below the number of shares of any class or series of preferred stock then outstanding) to the extent permitted under the FBCA (as defined below), as our Board of Directors from time to time may adopt by resolution, subject to certain limitations described below.
Effect of Florida Anti-Takeover Provisions
We are subject to several anti-takeover provisions under the Florida Business Corporation Act (the “FBCA”) that may deter or hinder takeovers of Florida corporations. Florida’s control share acquisition statute generally provides that shares acquired in a “control share acquisition” will not possess any voting rights unless either the Board of Directors approves the acquisition or such voting rights are approved by a majority of the corporation’s voting shares, excluding interested shares. Interested shares are those held by our officers and inside directors and by the acquiring party. A “control share acquisition” is an acquisition, directly or indirectly, by any person of ownership of, or the power to direct the exercise of voting power with respect to, issued and outstanding “control shares” of a publicly held Florida corporation. “Control shares” are shares that, except for Florida’s control share acquisition statute, would have voting power that, when added to all other shares that can be voted by the acquiring party, would entitle the acquiring party, immediately after the acquisition of such shares, directly or indirectly, to exercise voting power in the election of directors within any of the following ranges:
| • | at least 20% but less than 33 1/ 3% of all voting power; |
| • | at least 33 1/3% but less than a majority of all voting power; or |
| • | a majority or more of all voting power. |
We are also subject to the “affiliated transactions” statute of the FBCA. The affiliated transactions statute is designed to deter coercive tender offers that are not approved by the disinterested directors and generally requires special approval for a publicly-held Florida corporation to engage in a broad range of business combinations or other extraordinary corporate transactions with an “interested shareholder.” An interested shareholder is a person who, together with affiliates and associates, beneficially owns more than 10% of the corporation’s outstanding voting shares.
72
Table of Contents
The affiliated transaction statute requires that any affiliated transaction with an interested shareholder receive the approval of either a majority of the disinterested directors or two-thirds vote of the shares held by disinterested shareholders. Absent either such approval, a statutory fair price must be paid to all of the shareholders.
Indemnification of Directors and Officers
Section 607.0850 of the Florida Business Corporation Act, or FBCA, permits, in general, a Florida corporation to indemnify any person who was or is a party to any proceeding (other than an action by, or in the right of, the corporation) by reason of the fact that he or she is or was a director or officer of the corporation, or served another entity in any capacity at the request of the corporation, against liability incurred in connection with such proceeding, including the estimated expenses of litigating the proceedings to conclusion and the expenses actually and reasonably incurred in connection with the defense or settlement of such proceeding, including any appeal thereof, if such person acted in good faith for a purpose he or she reasonably believed to be in, or not opposed to, the best interest of the corporation and, in criminal actions or proceedings, additionally had no reasonable cause to believe that his or her conduct was unlawful. Section 607.0850(6) of the FBCA permits the corporation to pay such costs or expenses in advance of a final disposition of such action or proceeding upon receipt of an undertaking by or on behalf of the director or officer to repay such amount if he or she is ultimately found not to be entitled to indemnification under the FBCA. Section 607.0850 of the FBCA provides that the indemnification and advancement of expense provisions contained in the FBCA shall not be deemed exclusive of any rights to which a director or officer seeking indemnification or advancement of expenses may be entitled.
In accordance with the provisions of our amended and restated bylaws and amended and restated articles of incorporation, we shall indemnify, to the fullest extent permitted by law, any person who is or was a party to, or is threatened to be made a party to, any threatened, pending or contemplated action, suit or other type of proceeding (other than an action by or in our right), whether civil, criminal, administrative, investigative or otherwise, and whether formal or informal, by reason of the fact that such person is or was our director or officer or is or was serving at our request (as a director, officer, employee or agent of another corporation, partnership, joint venture, trust or other enterprise) against judgments, amounts paid in settlement, penalties, fines (including an excise tax assessed with respect to any employee benefit plan) and expenses (including counsel fees) actually and reasonably incurred in connection with any such action, suit or other proceeding, including any appeal thereof, if such person acted in good faith and in a manner such person reasonably believed to be in, or not opposed to, our best interests and, with respect to any criminal action or proceeding, had no reasonable cause to believe such person’s conduct was unlawful. The termination of any such action, suit or other proceeding by judgment, order, settlement or conviction, or upon a plea of nolo contendere or its equivalent, shall not, of itself, create a presumption that the person did not act in good faith and in a manner that such person reasonably believed to be in, or not opposed to, our best interests or, with respect to any criminal action or proceeding, had reasonable cause to believe that such person’s conduct was unlawful.
In accordance with the provisions of our amended and restated bylaws and amended and restated articles of incorporation, we shall indemnify, to the fullest extent permitted by law, any person who is or was a party to, or is threatened to be made a party to, any threatened, pending or completed action, suit or other type of proceeding by or in our right to procure a judgment in its favor by reason of the fact that such person is or was our director or officer or is or was serving at our request (as a director, officer, employee or agent of another corporation, partnership, joint venture, trust or other enterprise) against expenses (including counsel fees, including those for appeal) and amounts paid in settlement not exceeding, in the judgment of our Board of Directors, the estimated expense of litigating the action, suit, or other proceeding to conclusion, actually and reasonably incurred in connection with the defense or settlement of such action, suit, or other proceeding, including any appeal thereof if such person acted in good faith and in a manner such person reasonably believed to be in, or not opposed to, our best interests, except that no indemnification shall be made in respect of any claim, issue, or matter as to which such person shall have been adjudged to be liable unless, and only to the extent that, the court in which
73
Table of Contents
such action, suit, or other proceeding was brought, or any other court of competent jurisdiction, shall determine upon application that, despite the adjudication of liability but in view of all circumstances of the case, such person is fairly and reasonably entitled to indemnity for such expenses which the court shall deem proper.
At present, there is no pending litigation or proceeding involving any of our directors, officers or employees regarding which indemnification is sought, nor are we aware of any threatened litigation that may result in claims for indemnification.
NASDAQ Trading
Our common stock is listed on The NASDAQ Global Market under the symbol “QLTY.”
Transfer Agent and Registrar
The transfer agent and registrar for our common stock is American Stock Transfer & Trust Company, LLC.
74
Table of Contents
DESCRIPTION OF THE ABL FACILITY AND OTHER INDEBTEDNESS
The ABL Facility
We entered into the ABL Facility on December 18, 2007. Effective December 18, 2009, the ABL Facility consists of a current asset tranche in the amount of $200.0 million and a fixed asset tranche in the amount of $25.0 million, with the total commitments under the fixed asset tranche to be reduced, and the total commitments under the current asset tranche correspondingly increased, by $5.0 million on December 18, 2010. Borrowings of revolving loans under the ABL Facility are allocated pro rata to the current asset tranche and the fixed asset tranche based on the then-current asset borrowing base and the then-current fixed asset borrowing base. The ABL Facility includes letters of credit, which are to be allocated pro rata between the two tranches based on the then-current borrowing base for each tranche for so long as the fixed asset tranche remains in effect, and are available for working capital needs and general corporate purposes, including permitted acquisitions. The maturity date of the ABL Facility is June 18, 2013. The maturity date of the ABL Facility may be accelerated if we default on our obligations under the ABL Facility.
Prepayments
The ABL Facility is required to be prepaid only to the extent that aggregate amount of outstanding borrowings, unreimbursed letter of credit drawings and undrawn letters of credit under the relevant tranche exceeds the lesser of the applicable commitments and the applicable borrowing base in effect at such time for such tranche. The borrowing base for the current asset tranche consists of eligible accounts receivable, eligible inventory and eligible truck and trailer fleet, and the borrowing base for the fixed asset tranche consists of eligible real property and certain eligible equipment.
Voluntary prepayments and commitment reductions are permitted in whole or in part, subject to minimum prepayment or reduction requirements, without premium or penalty provided that voluntary prepayments of Eurodollar loans on a date other than the last day of the relevant interest period are subject to payment of customary breakage costs, if any.
Interest and Fees
The interest rate under the current asset tranche is based, at our option, on either the administrative agent’s base rate plus 1.00% or on the Eurodollar LIBOR rate plus, 2.00%. The administrative agent’s base rate is equal to the greater of the federal funds overnight rate plus 0.50% or the prime rate. The interest rate under the fixed asset tranche is based, at our option, on either the administrative agent’s base rate plus 1.25% or on LIBOR plus 2.25%, in each case subject to reductions in the applicable margins based upon the amounts available for borrowing under the ABL Facility. Overdue principal, interest and other amounts bear interest at a rate per annum equal to 2.0% in excess of the rate on such overdue borrowings.
With respect to LIBOR loans, we are able to elect interest periods of 1, 2, 3 or 6 months (or, if consented to by all lenders under the applicable tranche at the time of the relevant borrowing, 9 or 12 months). With respect to Eurodollar loans, interest is payable in arrears at the end of each interest period and, in any event, at least every 3 months. With respect to base rate loans, interest is payable quarterly in arrears on the last business day of each calendar quarter. Per annum rates are calculated on the basis of a 360-day year for LIBOR loans, or a 365/366 day year, for base rate loans.
Letters of Credit and Fees
The ABL Facility provides for payment of the following in respect of outstanding letters of credit:
| • | a letter of credit fee, payable quarterly in arrears, equal to (i) for standby letters of credit, the spread over the LIBOR for LIBOR loans under the ABL Facility, and (ii) for trade letters of credit, the spread over the |
75
Table of Contents
| LIBOR for Eurodollar rate loans under the ABL Facility minus 0.50%, in each case from time to time in effect on the aggregate outstanding stated amounts of such letters of credit; |
| • | a fronting fee, payable quarterly in arrears, equal to 0.125% per annum on the aggregate outstanding stated amounts of such letter of credit; and |
| • | customary administrative charges. |
We pay a commitment fee equal to 0.25% per annum on the available daily undrawn portion of the available commitment under the ABL Facility. This commitment fee is paid quarterly in arrears.
We may request up to $150.0 million in letters of credit, subject to certain limitations based on availability under the ABL Facility. In the event we prepay all outstanding amounts under the fixed asset tranche of the ABL Facility, and all commitments thereunder are terminated, prior to the termination of the ABL Facility, no less than $150.0 million under the current asset tranche will be available for letters of credit.
Collateral and Guarantees
The payment obligations under the ABL Facility are senior secured obligations of QD LLC and QD Capital and are secured by certain assets and guaranteed by certain of our subsidiaries. Our obligations and the obligations of the guarantors under the current asset tranche are secured by a first lien on the current asset tranche priority collateral, and a second lien on the fixed asset tranche priority collateral. Our obligations and the obligations of the guarantors under the fixed asset tranche are secured by a first lien on the current asset tranche priority collateral and a second lien on the fixed asset tranche priority collateral. The collateral will also secure certain interest rate protection and other hedging agreements permitted by the ABL Facility that may be entered into from time to time by us.
Representations and Warranties and Covenants
The ABL Facility and related documentation contains certain customary representations and warranties. In addition, the ABL Facility contains customary covenants restricting, subject to certain exceptions, our ability to, among other things:
| • | prepay other indebtedness (including the 2013 Senior Notes and the 2013 PIK Notes); |
| • | declare dividends and repurchase capital stock; |
| • | create liens on assets; |
| • | make investments; |
| • | incur additional indebtedness; |
| • | amend certain organizational, corporate and other documents (including those governing the 2013 Senior Notes and the 2013 PIK Notes); |
| • | engage in mergers, acquisitions, joint ventures and asset sales; |
| • | enter into sale-leaseback transactions; |
| • | change the nature of our business; |
| • | engage in certain transactions with affiliates and formation of subsidiaries; and |
| • | issue common stock and preferred stock, subject to certain exceptions. |
The ABL Facility contains a fixed charge coverage ratio of 1.0 to 1.0 which only needs to be met if borrowing availability is less than $20.0 million.
76
Table of Contents
Events of Default
Events of default under the ABL Facility include:
| • | our failure to pay principal or interest when due or pay a reimbursement obligation on a letter of credit; |
| • | material breach of any representation or warranty; |
| • | covenant defaults; |
| • | cross defaults on other material indebtedness; |
| • | events of bankruptcy; |
| • | our change of control; and |
| • | other customary events of default. |
The 9% Notes
On September 30, 2003, we issued $125.0 million aggregate principal amount of our 9% Notes. The offering and sale of the 9% Notes was not registered under the Securities Act. On March 10, 2005, we exchanged the original 9% Notes for a new issue of substantially identical notes registered under the Securities Act. Prior to August 28, 2009, we repurchased $25.2 million in principal amount of 9% Notes. On August 28, 2009, we commenced exchange and tender offers to exchange new notes and cash consideration for any and all of our 9% Notes. These offers were completed on October 15, 2009. In connection with the exchange offer, we received approximately $80.7 million of our 9% Notes in exchange for the issuance of approximately $80.7 million aggregate principal amount of our 2013 PIK Notes and approximately 1.75 million warrants. In connection with the tender offer, we retired $2.9 million of our 9% Notes for $1.8 million in cash. The warrants are exercisable to purchase shares of QDI’s common stock at an exercise price of $0.01 per share, during the period beginning on the six-month anniversary of October 15, 2009 and ending on November 1, 2013. Upon the completion of the exchange and tender offers, we amended the indentures governing the 9% Notes to eliminate or waive substantially all of the restrictive covenants, to eliminate certain events of default, to modify covenants regarding mergers and consolidations and modify or eliminate certain other provisions contained in the indentures governing the 9% Notes. As of June 30, 2010, approximately $16.0 million total principal amount of the 9% Notes remained outstanding.
The 9% Notes are the unsecured and senior subordinated obligations of QD LLC and QD Capital and are fully and unconditionally guaranteed on an unsecured and senior subordinated basis, jointly and severally, by QDI and certain of our U.S. restricted subsidiaries. The 9% Notes are senior subordinated unsecured obligations ranking junior in right of payment to all of our existing and future senior debt, and all liabilities of our subsidiaries that do not guarantee the 9% Notes. In the event of liquidation, bankruptcy, insolvency or similar events, holders of senior debt, such as the lenders under the ABL Facility and holders of 2012 Notes or 2013 Senior Notes, are entitled to receive payment in full in cash or cash equivalents before holders of the 9% Notes are entitled to receive any payments. No payments may be made on the 9% Notes if we default on the payment of senior debt, and payments on the 9% Notes may be blocked for up to 180 days if we default on the senior debt in some other way until such default is cured or waived. Interest on the 9% Notes is payable at the rate of 9% per annum and is payable semi-annually in cash on each May 15 and November 15. The 9% Notes will mature on November 15, 2010. We have the right to redeem the 9% Notes in whole or in part from time to time at 100% of the principal amount plus accrued and unpaid interest if any, to the date of redemption.
The 2012 Notes
On January 28, 2005, we issued $85.0 million aggregate principal amount of our 2012 Notes. The offering and sale of the initial tranche of 2012 Notes was not registered under the Securities Act. In September 2005, we exchanged the initial tranche of the 2012 Notes for a new issue of substantially identical notes registered under
77
Table of Contents
the Securities Act. On December 18, 2007, we issued a second tranche of 2012 Notes consisting of $50.0 million aggregate principal amount of our 2012 Notes. The offering and sale of the second tranche of the 2012 Notes was not registered under the Securities Act. In June 2008, we exchanged the second tranche of the 2012 Notes for a new issue of substantially identical notes registered under the Securities Act.
On August 28, 2009, we commenced an exchange offer to exchange new notes for any and all of our 2012 Notes. This offer was completed on October 15, 2009. We received approximately $134.5 million of our 2012 Notes in exchange for our 2013 Senior Notes. Upon the completion of the exchange offer, we amended the 2012 Notes to eliminate or waive substantially all of the restrictive covenants, to eliminate certain events of default, to modify covenants regarding mergers and consolidations and modify or eliminate certain other provisions contained in the indentures governing the 2012 Notes. As of June 30, 2010, approximately $0.5 million total principal amount of the 2012 Notes remained outstanding.
The 2012 Notes are the unsecured and unsubordinated obligations of QD LLC and QD Capital and are fully and unconditionally guaranteed on an unsecured and unsubordinated basis, jointly and severally, by QDI and certain of our U.S. restricted subsidiaries. The 2012 Notes are senior unsecured obligations ranking equal in right of payment with all our existing and future senior obligations. The 2012 Notes are effectively subordinated to all existing and future secured debt of QD LLC, QD Capital and the guarantors, to the extent of the assets securing such debt, including indebtedness under the ABL Facility. The 2012 Notes are also effectively subordinated to any debt, preferred stock obligations and other liabilities of our subsidiaries (other than QD Capital) that are not guarantors. Interest on the 2012 Notes is payable quarterly in cash in arrears on each January 15, April 15, July 15 and October 15. The interest rate on the 2012 Notes at June 30, 2010 and 2009 was 4.8% and 5.6%, respectively. The 2012 Notes will mature on January 15, 2012. We may redeem all or any portion of the 2012 Notes upon not less than 30, nor more than 60, days’ notice at 100% of the principal amount plus accrued and unpaid interest if any, to the date of redemption.
The 2013 Senior Notes
On October 15, 2009, we issued approximately $134.5 million aggregate principal amount of our 2013 Senior Notes. The 2013 Senior Notes are the unsecured and unsubordinated obligations of QD LLC and QD Capital and are fully and unconditionally guaranteed on an unsecured and unsubordinated basis, jointly and severally, by QDI and certain of our U.S. restricted subsidiaries.
Interest on the 2013 Senior Notes is payable at a rate of 10% per annum, semiannually on June 1 and December 1 of each year, commencing on June 1, 2010. The 2013 Senior Notes mature on June 1, 2013.
We may redeem the 2013 Senior Notes, in whole or part, at any time at a price equal to 100% of the principal amount of the 2013 Senior Notes redeemed plus accrued and unpaid interest to the redemption date. Subject to certain conditions, we are obligated to redeem $6.0 million of 2013 Senior Notes on each June 1 and December 1, commencing December 1, 2010. Beginning in 2011, promptly following the delivery of our Annual Report on Form 10-K for each fiscal year, the 2013 Senior Notes are subject to additional mandatory redemption in an amount equal to 50% of the excess cash flow we generate minus $12.0 million. Both required redemption amounts will be reduced to the extent necessary so that:
| • | the sum of borrowing availability under the ABL Facility, plus unrestricted cash and cash equivalents, is at least $37.5 million; |
| • | the minimum borrowing availability requirements under the ABL Facility are satisfied; |
| • | there is fixed charge coverage ratio of at least 1.0 to 1.0 as calculated under the ABL Facility; and |
| • | no other event of default is otherwise caused under the ABL Facility by the redemption. |
78
Table of Contents
The required redemption amounts are also reduced by any optional redemptions and repurchases during the redemption period.
We recorded $3.6 million in debt issuance costs relating to the 2013 Senior Notes, of which $2.0 million of unamortized debt issuance costs related to the 2012 Notes and $1.6 million was related to the new issuance. We are amortizing these costs over the remaining term of the 2013 Senior Notes.
The 2013 PIK Notes
On October 15, 2009, we issued $80.7 million aggregate principal amount of our 2013 PIK Notes. The 2013 PIK Notes are the unsecured and senior subordinated obligations of QD LLC and QD Capital and are fully and unconditionally guaranteed on an unsecured and senior subordinated basis, jointly and severally, by QDI and certain of our U.S. restricted subsidiaries.
Interest is payable on the 2013 PIK Notes at 11.75% per annum, payable 9% in cash and 2.75% in the form of additional 2013 PIK Notes, quarterly on February 1, May 1, August 1 and November 1 of each year, commencing on February 1, 2010.
The 2013 PIK Notes mature on November 1, 2013. We may redeem the 2013 PIK Notes, in whole or part, at any time prior to October 15, 2010, at a price equal to 100% of the principal amount of the 2013 PIK Notes redeemed plus accrued and unpaid interest to the redemption date plus an additional “make-whole premium.” After October 15, 2010, we may redeem the 2013 PIK Notes, in whole or part, at any time at a price equal to 100% of the principal amount of the 2013 PIK Notes redeemed plus accrued and unpaid interest to the redemption date. Additionally, at any time prior to October 15, 2010, we may redeem up to 35% of the principal amount of the 2013 PIK Notes at a redemption premium equal to 11.75% of the face amount thereof with the net proceeds of one or more equity offerings so long as at least 65% of the aggregate original principal amount of the 2013 PIK Notes remains outstanding afterwards.
We recorded $1.5 million in debt issuance costs relating to the 2013 PIK Notes, of which $0.5 million of unamortized debt issuance costs related to the 9% Notes and $1.0 million were related to the new issuance. In addition, we recorded $6.7 million in note issuance discount due to the warrants issued. The amount represents the fair market value of the warrants at time of issuance. We are amortizing these costs over the remaining term of the 2013 PIK Notes.
The note exchanges described above were treated as a debt modification in accordance with applicable FASB guidance.
79
Table of Contents
MATERIAL UNITED STATES FEDERAL INCOME TAX
CONSEQUENCES FOR NON-U.S. HOLDERS
The following discussion describes material U.S. federal income tax consequences to Non-U.S. Holders (as defined below) relating to the purchase, ownership, and disposition of our common stock. This summary is based upon the provisions of the Internal Revenue Code of 1986, as amended (the “Code”), Treasury regulations promulgated under the Code (the “Regulations”), and administrative rulings and judicial decisions, in each case as of the date hereof. These authorities are subject to differing interpretations and may be changed, perhaps retroactively, resulting in U.S. federal income tax consequences materially different from those summarized below.
This summary assumes that our common stock is and will be held as capital assets. This summary does not address the tax considerations arising under the U.S. federal estate and gift tax laws or the laws of any foreign, state or local jurisdiction. In addition, this summary does not purport to address all tax considerations that may be applicable to a particular holder’s circumstances or to holders that may be subject to special tax rules, including, without limitation, holders subject to the alternative minimum tax, banks, insurance companies or other financial institutions, tax-exempt organizations, dealers, brokers or traders in securities, currencies or commodities, holders that elect to use a mark-to-market method of accounting for their securities holdings, controlled foreign corporations, passive foreign investment companies, former U.S. citizens or long-term residents, partnerships or other pass-through entities for U.S. federal income tax purposes or investors therein, holders holding our common stock as a position in a hedging transaction, “straddle,” “conversion transaction”, other “synthetic security” or integrated transaction, or other risk reduction transaction, holders deemed to sell our common stock under the constructive sale provisions of the Code, current or former holders, directly, indirectly or constructively, of five percent or more of our common stock or holders who acquired our common stock through the exercise of employee stock options or otherwise as compensation.
For purposes of this discussion, the term “U.S. Holder” means a beneficial owner of common stock that is, for U.S. federal income tax purposes:
| (i) | an individual who is a citizen or resident of the United States; |
| (ii) | a corporation, including any entity treated as a corporation for U.S. federal income tax purposes, created or organized in the United States or under the laws of the United States, any state thereof or the District of Columbia; |
| (iii) | an estate the income of which is subject to U.S. federal income taxation regardless of its source; or |
| (iv) | a trust, if its administration is subject to the primary supervision of a U.S. court and one or more U.S. persons have the authority to control all substantial decisions of the trust, or if it has made a valid election in effect under applicable Regulations to be treated as a U.S. person. |
For purposes of this discussion, the term “Non-U.S. Holder” means a beneficial owner of common stock (other than a partnership or other entity treated as a partnership for U.S. federal income tax purposes) that is not a U.S. Holder.
If a partnership (or other entity treated as a partnership for U.S. federal income tax purposes) holds our common stock, the tax treatment of a partner in the partnership will generally depend upon the status of the partner and the activities of the partnership. If you are a partnership or a partner of a partnership purchasing common stock, you should consult your tax advisor regarding the tax consequences relating to the purchase, ownership, and disposition of our common stock.
THIS SUMMARY IS FOR GENERAL INFORMATION PURPOSES ONLY, AND IS NOT INTENDED TO BE, AND SHOULD NOT BE CONSTRUED TO BE, LEGAL OR TAX ADVICE TO ANY PARTICULAR HOLDER. YOU ARE URGED TO CONSULT YOUR OWN TAX ADVISOR WITH
80
Table of Contents
REGARD TO THE APPLICATION OF THE U.S. FEDERAL INCOME TAX LAWS, AS WELL AS THE APPLICATION OF NON-INCOME TAX LAWS AND THE LAWS OF ANY STATE, LOCAL OR FOREIGN TAXING JURISDICTION, TO YOUR PARTICULAR SITUATION.
Dividends. As discussed above under “Dividend Policy,” we currently do not pay dividends on our common stock and do not intend to pay dividends on our common stock in the foreseeable future. Dividends paid to you, if any, generally will be subject to withholding of U.S. federal income tax at a 30% rate or such lower rate as may be specified by an applicable income tax treaty. However, dividends that are effectively connected with your conduct of a trade or business within the United States and, if certain tax treaties apply, are attributable to your U.S. permanent establishment, are not subject to the withholding tax, but instead are subject to U.S. federal income tax on a net income basis in the same manner as if you were a U.S. Holder. Special certification and disclosure requirements, including the completion of Internal Revenue Service Form W-8ECI (or any successor form), must be satisfied for effectively connected income to be exempt from withholding. If you are a foreign corporation, any such effectively connected dividends received by you may be subject to an additional branch profits tax at a 30% rate or such lower rate as may be specified by an applicable income tax treaty. If you wish to claim the benefit of an applicable treaty with respect to the withholding tax on dividends, you will be required to complete Internal Revenue Service Form W-8BEN (or other applicable form) and certify under penalties of perjury that you are not a U.S. person and that you are entitled to the benefits of the applicable treaty. Special certification and other requirements apply to certain Non–U.S. Holders that are entities rather than individuals. If you are eligible for a reduced rate of U.S. withholding tax pursuant to an income tax treaty, you may obtain a refund of any excess amounts withheld by timely filing an appropriate claim for refund with the Internal Revenue Service.
Sale or Exchange of Common Stock. You generally will not be subject to U.S. federal income tax with respect to gain recognized on a sale or other disposition of shares of our common stock unless:
| • | the gain is effectively connected with your conduct of a trade or business in the United States, and if certain tax treaties apply, is attributable to your U.S. permanent establishment; |
| • | you are an individual and are present in the United States for 183 days or more in the taxable year of the sale or other disposition, and certain other conditions are met; or |
| • | we are or have been a “U.S. real property holding corporation” for U.S. federal income tax purposes. |
If you are an individual and are described in the first bullet above, you will be subject to tax on the net gain derived from the sale under regular graduated U.S. federal income tax rates in the same manner as if you were a U.S. Holder. If you are an individual and are described in the second bullet above, you will be subject to a flat 30% tax on the gain derived from the sale, which may be offset by U.S. source capital losses (even though you are not considered a resident of the United States). If you are a foreign corporation and are described in the first bullet above, you will be subject to tax on your gain under regular graduated U.S. federal income tax rates in the same manner as if you were a U.S. Holder and, in addition, may be subject to the branch profits tax on your effectively connected earnings and profits at a rate of 30% or at such lower rate as may be specified by an applicable income tax treaty.
We believe we are not and do not anticipate becoming a “U.S. real property holding corporation” for U.S. federal income tax purposes.
Information Reporting and Backup Withholding. Under certain circumstances, Treasury regulations require information reporting and backup withholding on certain payments on common stock.
U.S. backup withholding tax (currently at a rate of 28%) is imposed on certain payments to persons that fail to furnish the information required under the U.S. information reporting requirements. Dividends on common stock paid to a Non-U.S. Holder will generally be exempt from backup withholding, provided the Non-U.S. Holder meets applicable certification requirements, including providing a correct and properly executed Internal
81
Table of Contents
Revenue Service Form W-8BEN or otherwise establishes an exemption. We must report annually to the Internal Revenue Service and to each Non-U.S. Holder the amount of dividends paid to that holder and the U.S. federal withholding tax withheld with respect to those dividends, regardless of whether withholding is reduced or eliminated by an applicable tax treaty.
Under United States Treasury regulations, payments of proceeds from the sale of our common stock effected through a foreign office of a broker generally are not subject to information reporting or backup withholding. However, if the broker is a U.S. person, a controlled foreign corporation for U.S. federal income tax purposes, a foreign person 50% or more of whose gross income is effectively connected with a U.S. trade or business for a specified three-year period or a foreign partnership with significant U.S. ownership or engaged in a U.S. trade or business, then information reporting (but not backup withholding) will be required, unless the broker has in its records documentary evidence that the beneficial owner of the payment is a Non-U.S. Holder or is otherwise entitled to an exemption (and the broker has no knowledge or reason to know to the contrary), and other applicable certification requirements are met. Backup withholding will apply if the sale is subject to information reporting and the broker has actual knowledge that you are a U.S. person. Information reporting and backup withholding generally will apply to payments of proceeds from the sale of our common stock effected through a U.S. office of any U.S. or foreign broker, unless the beneficial owner, under penalties of perjury, certifies, among other things, its status as a Non-U.S. Holder or otherwise establishes an exemption.
Backup withholding does not represent an additional income tax. Any amounts withheld from a payment to a holder under the backup withholding rules will be allowed as a credit against the holder’s U.S. federal income tax liability and may entitle the holder to a refund, provided that the required information or returns are timely furnished by the holder to the Internal Revenue Service.
Recent Legislation. Recent legislation generally imposes withholding at a rate of 30% on payments to certain foreign entities (including financial intermediaries), after December 31, 2012, of dividends on and the gross proceeds of dispositions of U.S. common stock, unless various U.S. information reporting and due diligence requirements that are different from, and in addition to, the beneficial owner certification requirements described above have been satisfied (generally relating to ownership by U.S. persons of interests in or accounts with those entities). Non-U.S. Holders should consult their tax advisors regarding the possible implications of this legislation on their investment in our common stock.
82
Table of Contents
Under the terms and subject to the conditions contained in an underwriting agreement dated , 2010, we have agreed to sell to the underwriters named below, for whom Credit Suisse Securities (USA) LLC and RBC Capital Markets Corporation are acting as representatives, the following respective numbers of shares of common stock:
| Underwriter |
Number of Shares | |
| Credit Suisse Securities (USA) LLC |
||
| RBC Capital Markets Corporation |
||
| BB&T Capital Markets, a division of Scott & Stringfellow, LLC |
||
| Stephens Inc. |
||
| Stifel, Nicolaus & Company, Incorporated |
||
| Cantor Fitzgerald & Co. |
||
| Moelis & Company LLC |
||
| Ladenburg Thalmann & Co. Inc. |
||
| Sterne, Agee & Leach, Inc. |
||
| Total |
||
The underwriting agreement provides that the underwriters are obligated to purchase all the shares of common stock in the offering if any are purchased, other than those shares covered by the over-allotment option described below. The underwriting agreement also provides that if an underwriter defaults the purchase commitments of non-defaulting underwriters may be increased or the offering may be terminated.
We have granted to the underwriters a 30-day option to purchase on a pro rata basis up to additional shares from us at the initial public offering price less the underwriting discounts and commissions. The option may be exercised only to cover any over-allotments of common stock.
The underwriters propose to offer the shares of common stock initially at the public offering price on the cover page of this prospectus and to selling group members at that price less a selling concession of $ per share. The underwriters and selling group members may allow a discount of $ per share on sales to other broker/dealers. After the initial public offering the representative may change the public offering price and concession and discount to broker/dealers.
The following table summarizes the compensation and estimated expenses we will pay:
| Per Share | Total | |||||||||||
| Without Over-allotment |
With Over-allotment |
Without Over-allotment |
With Over-allotment | |||||||||
| Underwriting Discounts and Commissions |
$ | $ | $ | $ | ||||||||
| Expenses payable by us |
$ | $ | $ | $ | ||||||||
We have agreed that we will not offer, sell, contract to sell, pledge or otherwise dispose of, directly or indirectly, or file with the Securities and Exchange Commission a registration statement under the Securities Act relating to, any shares of our common stock or securities convertible into or exchangeable or exercisable for any shares of our common stock (subject to a limited exception with respect to Apollo described further below), or publicly disclose the intention to make any offer, sale, pledge, disposition or filing, without the prior written consent of Credit Suisse Securities (USA) LLC for a period of 90 days after the date of this prospectus. However, in the event that either (1) during the last 17 days of the “lock-up” period, we release earnings results or material
83
Table of Contents
news or a material event relating to us occurs or (2) prior to the expiration of the “lock-up” period, we announce that we will release earnings results during the 16-day period beginning on the last day of the “lock-up” period, then in either case the expiration of the “lock-up” will be extended until the expiration of the 18-day period beginning on the date of the release of the earnings results or the occurrence of the material news or event, as applicable, unless Credit Suisse Securities (USA) LLC waives, in writing, such an extension.
Our officers, directors and certain stockholders have agreed that they will not offer, sell, contract to sell, pledge or otherwise dispose of, directly or indirectly, any shares of our common stock or securities convertible into or exchangeable or exercisable for any shares of our common stock, enter into a transaction that would have the same effect, or enter into any swap, hedge or other arrangement that transfers, in whole or in part, any of the economic consequences of ownership of our common stock, whether any of these transactions are to be settled by delivery of our common stock or other securities, in cash or otherwise, or publicly disclose the intention to make any offer, sale, pledge or disposition, or to enter into any transaction, swap, hedge or other arrangement, without, in each case, the prior written consent of Credit Suisse Securities (USA) LLC for a period of 90 days after the date of this prospectus provided that Apollo may request us to file a registrant statement on Form S-3 with the Securities and Exchange Commission with respect to its shares of our common stock beginning 60 days after the date of this prospectus so long as no offer, sale or transfer of the shares is made until the expiration of the lock-up period. However, in the event that either (1) during the last 17 days of the “lock-up” period, we release earnings results or material news or a material event relating to us occurs or (2) prior to the expiration of the “lock-up” period, we announce that we will release earnings results during the 16-day period beginning on the last day of the “lock-up” period, then in either case the expiration of the “lock-up” will be extended until the expiration of the 18-day period beginning on the date of the release of the earnings results or the occurrence of the material news or event, as applicable, unless Credit Suisse Securities (USA) LLC waives, in writing, such an extension.
We have agreed to indemnify the underwriters against liabilities under the Securities Act, or contribute to payments that the underwriters may be required to make in that respect.
Our common stock is listed on The NASDAQ Global Market under the symbol “QLTY.”
In connection with the offering the underwriters may engage in stabilizing transactions, over-allotment transactions, syndicate covering transactions, penalty bids and passive market making in accordance with Regulation M under the Exchange Act.
| • | Stabilizing transactions permit bids to purchase the underlying security so long as the stabilizing bids do not exceed a specified maximum. |
| • | Over-allotment involves sales by the underwriters of shares in excess of the number of shares the underwriters are obligated to purchase, which creates a syndicate short position. The short position may be either a covered short position or a naked short position. In a covered short position, the number of shares over-allotted by the underwriters is not greater than the number of shares that they may purchase in the over-allotment option. In a naked short position, the number of shares involved is greater than the number of shares in the over-allotment option. The underwriters may close out any covered short position by either exercising their over-allotment option and/or purchasing shares in the open market. |
| • | Syndicate covering transactions involve purchases of the common stock in the open market after the distribution has been completed in order to cover syndicate short positions. In determining the source of shares to close out the short position, the underwriters will consider, among other things, the price of shares available for purchase in the open market as compared to the price at which they may purchase shares through the over-allotment option. If the underwriters sell more shares than could be covered by the over-allotment option, a naked short position, the position can only be closed out by buying shares in the open market. A naked short position is more likely to be created if the underwriters are concerned that there could be downward pressure on the price of the shares in the open market after pricing that could adversely affect investors who purchase in the offering. |
84
Table of Contents
| • | Penalty bids permit the representative to reclaim a selling concession from a syndicate member when the common stock originally sold by the syndicate member is purchased in a stabilizing or syndicate covering transaction to cover syndicate short positions. |
| • | In passive market making, market makers in the common stock who are underwriters or prospective underwriters may, subject to limitations, make bids for or purchases of our common stock until the time, if any, at which a stabilizing bid is made. |
These stabilizing transactions, syndicate covering transactions and penalty bids may have the effect of raising or maintaining the market price of our common stock or preventing or retarding a decline in the market price of the common stock. As a result the price of our common stock may be higher than the price that might otherwise exist in the open market. These transactions may be effected on The NASDAQ Global Market or otherwise and, if commenced, may be discontinued at any time.
Certain of the underwriters and their respective affiliates have in the past and may in the future perform various financial advisory, investment banking and other services for us and our affiliates in the ordinary course of business, for which they received and will receive customary fees and expenses. In particular, certain affiliates of Credit Suisse Securities (USA) LLC and BB&T Capital Markets, a division of Scott & Stringfellow, LLC, are lenders or agents under the ABL Facility.
A prospectus in electronic format may be made available on the web sites maintained by one or more of the underwriters, or selling group members, if any, participating in this offering and one or more of the underwriters participating in this offering may distribute prospectuses electronically. The representative may agree to allocate a number of shares to underwriters and selling group members for sale to their online brokerage account holders. Internet distributions will be allocated by the underwriters and selling group members that will make internet distributions on the same basis as other allocations.
85
Table of Contents
Affiliates of Credit Suisse Securities (USA) LLC and BB&T Capital Markets, a division of Scott & Stringfellow, LLC, which are underwriters, are lenders under the ABL Facility and may receive more than five percent of the net proceeds of this offering as a result of our intention to repay outstanding borrowings under the ABL Facility. Thus, Credit Suisse Securities (USA) LLC and BB&T Capital Markets, a division of Scott & Stringfellow, LLC, may be deemed to have a “conflict of interest” under the applicable provisions of Rule 2720 of the Conduct Rules of the Financial Industry Regulatory Authority, Inc., or FINRA. Accordingly, this offering will be made in compliance with the applicable provisions of Rule 2720 of the Conduct Rules. Rule 2720 currently requires that a “qualified independent underwriter,” as defined by the FINRA rules, participate in the preparation of the registration statement and the prospectus and exercise the usual standards of due diligence in respect thereto. RBC Capital Markets Corporation is acting as the qualified independent underwriter and will not receive any compensation in such capacity. We have agreed to indemnify RBC Capital Markets Corporation in its capacity as the qualified independent underwriter against liabilities under the Securities Act, or contribute to payments that it may be required to make in that respect.
86
Table of Contents
The validity of the common stock we are offering by this prospectus will be passed upon for us by Shumaker Loop & Kendrick, LLP, Tampa, Florida. Certain legal matters will be passed upon for us by O’Melveny & Myers LLP, New York, New York. Davis Polk & Wardwell LLP, New York, New York will act as counsel for the underwriters.
The financial statements as of December 31, 2009 and 2008 and for each of the three years in the period ended December 31, 2009 and management’s assessment of the effectiveness of internal control over financial reporting (which is included in Management’s Report on Internal Control over Financial Reporting) as of December 31, 2009 included in this Prospectus have been so included in reliance on the report of PricewaterhouseCoopers LLP, an independent registered certified public accounting firm, given on the authority of said firm as experts in auditing and accounting.
WHERE YOU CAN FIND MORE INFORMATION
We have filed a Registration Statement on Form S-1 with the SEC regarding this offering. This prospectus, which is part of the registration statement, does not contain all of the information included in the registration statement, and you should refer to the registration statement and its exhibits to read that information. We file annual, quarterly and current reports, proxy statements and other information with the SEC. You may read and copy any document we file with the SEC at the SEC’s public reference facilities maintained by the SEC at 100 F Street, N.E., Washington, D.C. 20549. You can also request copies of those documents, upon payment of a duplicating fee, by writing to the SEC. Please call the SEC at 1-800-SEC-0330 for further information on the operation of the public reference rooms. The SEC also maintains an Internet site that contains reports, proxy and information statements and other information regarding issuers that file with the SEC. The site’s Internet address is www.sec.gov. Certain information about our company may also be obtained from our website at www.qualitydistribution.com. Information contained on our website or any other website does not constitute a part of this prospectus.
You may also request a copy of these filings, at no cost, by writing or telephoning us at:
Quality Distribution Inc.
4041 Park Oaks Blvd., Suite 200
Tampa, Florida 33610
Phone: (813) 630-5826
The SEC allows us to incorporate by reference into this prospectus the information we file with the SEC. This means that we are disclosing important information to you by referring to other documents. The information incorporated by reference is considered to be part of this prospectus, except for any information superseded by information contained directly in this prospectus. We incorporate by reference the documents listed below (other than any portions thereof, which under the Exchange Act and applicable SEC rules, are not deemed “filed” under the Exchange Act) and any future filings made with the SEC under Section 13(a), 13(c), 14 or 15(d) of the Exchange Act until this offering is completed:
| • | Our Annual Report on Form 10-K for the fiscal year ended December 31, 2009 filed with the SEC on March 12, 2010 (including information specifically incorporated by reference into the Annual Report on Form 10-K from the Company’s Definitive Proxy Statement on Schedule 14A filed with the SEC on April 26, 2010); |
| • | Our Quarterly Report on Form 10-Q for the fiscal quarter ended March 31, 2010 filed with the SEC on May 7, 2010; |
| • | Our Quarterly Report on Form 10-Q for the fiscal quarter ended June 30, 2010 filed with the SEC on July 30, 2010; |
87
Table of Contents
| • | Our Definitive Information Statement filed with the SEC on May 3, 2010; |
| • | Our Current Reports on Form 8-K filed with the SEC on April 19, 2010, May 28, 2010 and July 22, 2010; and |
| • | The description of our common stock contained in the Registration Statement on Form 8-A filed on November 5, 2003, including any amendments or reports filed for the purposes of updating such description. |
You may also request a copy of these filings, at no cost, by writing or telephoning us at:
Quality Distribution Inc.
4041 Park Oaks Blvd., Suite 200
Tampa, Florida 33610
Phone: (813) 630-5826
Exhibits to any documents incorporated by reference in this prospectus will not be sent, however, unless those exhibits have been specifically referenced in this prospectus.
88
Table of Contents
QUALITY DISTRIBUTION, INC.
F-1
Table of Contents
Management’s Report on Internal Control over Financial Reporting
Management is responsible for establishing and maintaining adequate internal control over financial reporting, as such term is defined in Exchange Act Rules 13a-15(e) and 15d-15(e). Our internal control over financial reporting is a process designed under the supervision of the Chief Executive Officer and Chief Financial Officer and effected by the Board of Directors and management, to provide reasonable assurance regarding the reliability of financial reporting and the preparation of consolidated financial statements for external purposes in accordance with accounting principles generally accepted in the United States of America. Our internal control over financial reporting includes those policies and procedures that (i) pertain to the maintenance of records that, in reasonable detail, accurately and fairly reflect the transactions and dispositions of the assets of the company; (ii) provide reasonable assurance that transactions are recorded as necessary to permit preparation of financial statements in accordance with generally accepted accounting principles, and that receipts and expenditures of the company are being made only in accordance with authorizations of management and directors of the company; and (iii) provide reasonable assurance regarding prevention or timely detection of unauthorized acquisition, use, or disposition of the company’s assets that could have a material effect on the financial statements.
Because of its inherent limitations, internal control over financial reporting may not prevent or detect misstatements. Also, projections of any evaluation of effectiveness to future periods are subject to the risk that controls may become inadequate because of changes in conditions, or that the degree of compliance with the policies or procedures may deteriorate.
Management has assessed the effectiveness of our internal control over financial reporting as of December 31, 2009, using the criteria established in Internal Control—Integrated Framework issued by the Committee of Sponsoring Organizations of the Treadway Commission. Based on that assessment and those criteria, management has determined that our internal control over financial reporting was effective as of December 31, 2009.
PricewaterhouseCoopers LLP, our independent registered public accounting firm, has audited the effectiveness of the Company’s internal controls over financial reporting as of December 31, 2009, as stated in their report which is included herein.
F-2
Table of Contents
Report of Independent Registered Certified Public Accounting Firm
To: Board of Directors and shareholders of Quality Distribution, Inc.
In our opinion, the accompanying consolidated balance sheets and the related consolidated statements of operations, of shareholders’ equity (deficit) and comprehensive income (loss) and of cash flows present fairly, in all material respects, the financial position of Quality Distribution, Inc. and its subsidiaries at December 31, 2009 and December 31, 2008, and the results of their operations and their cash flows for each of the three years in the period ended December 31, 2009 in conformity with accounting principles generally accepted in the United States of America. Also in our opinion, the Company maintained, in all material respects, effective internal control over financial reporting as of December 31, 2009, based on criteria established in Internal Control—Integrated Framework issued by the Committee of Sponsoring Organizations of the Treadway Commission (COSO). The Company’s management is responsible for these financial statements, for maintaining effective internal control over financial reporting and for its assessment of the effectiveness of internal control over financial reporting, included in Management’s Report on Internal Control over Financial Reporting. Our responsibility is to express opinions on these financial statements and on the Company’s internal control over financial reporting based on our integrated audits. We conducted our audits in accordance with the standards of the Public Company Accounting Oversight Board (United States). Those standards require that we plan and perform the audits to obtain reasonable assurance about whether the financial statements are free of material misstatement and whether effective internal control over financial reporting was maintained in all material respects. Our audits of the financial statements included examining, on a test basis, evidence supporting the amounts and disclosures in the financial statements, assessing the accounting principles used and significant estimates made by management, and evaluating the overall financial statement presentation. Our audit of internal control over financial reporting included obtaining an understanding of internal control over financial reporting, assessing the risk that a material weakness exists, and testing and evaluating the design and operating effectiveness of internal control based on the assessed risk. Our audits also included performing such other procedures as we considered necessary in the circumstances. We believe that our audits provide a reasonable basis for our opinions.
A company’s internal control over financial reporting is a process designed to provide reasonable assurance regarding the reliability of financial reporting and the preparation of financial statements for external purposes in accordance with generally accepted accounting principles. A company’s internal control over financial reporting includes those policies and procedures that (i) pertain to the maintenance of records that, in reasonable detail, accurately and fairly reflect the transactions and dispositions of the assets of the company; (ii) provide reasonable assurance that transactions are recorded as necessary to permit preparation of financial statements in accordance with generally accepted accounting principles, and that receipts and expenditures of the company are being made only in accordance with authorizations of management and directors of the company; and (iii) provide reasonable assurance regarding prevention or timely detection of unauthorized acquisition, use, or disposition of the company’s assets that could have a material effect on the financial statements.
Because of its inherent limitations, internal control over financial reporting may not prevent or detect misstatements. Also, projections of any evaluation of effectiveness to future periods are subject to the risk that controls may become inadequate because of changes in conditions, or that the degree of compliance with the policies or procedures may deteriorate.
/s/ PricewaterhouseCoopers LLP
Tampa, Florida
March 12, 2010
F-3
Table of Contents
Quality Distribution, Inc. and Subsidiaries
Consolidated Statements of Operations
For the Years Ended December 31, 2009, 2008 and 2007
(In thousands) Except Per Share Data
| Years ended December 31, | ||||||||||||
| 2009 | 2008 | 2007 | ||||||||||
| OPERATING REVENUES: |
||||||||||||
| Transportation |
$ | 454,658 | $ | 565,814 | $ | 580,676 | ||||||
| Other service revenue |
104,954 | 104,039 | 76,221 | |||||||||
| Fuel surcharge |
53,997 | 145,437 | 94,661 | |||||||||
| Total operating revenues |
613,609 | 815,290 | 751,558 | |||||||||
| OPERATING EXPENSES: |
||||||||||||
| Purchased transportation |
373,539 | 466,823 | 471,531 | |||||||||
| Compensation |
76,955 | 109,110 | 85,820 | |||||||||
| Fuel, supplies and maintenance |
62,448 | 114,351 | 81,316 | |||||||||
| Depreciation and amortization |
20,218 | 21,002 | 17,544 | |||||||||
| Selling and administrative |
24,572 | 35,836 | 31,291 | |||||||||
| Insurance costs |
14,119 | 14,999 | 23,883 | |||||||||
| Taxes and licenses |
3,578 | 5,242 | 3,980 | |||||||||
| Communication and utilities |
7,910 | 12,716 | 11,381 | |||||||||
| Gain on sale of tank wash assets |
(7,130 | ) | — | — | ||||||||
| Loss (gain) on disposal of property and equipment |
450 | (3,092 | ) | 959 | ||||||||
| Impairment charge |
148,630 | — | — | |||||||||
| Restructuring costs |
3,496 | 5,325 | — | |||||||||
| Total operating expenses |
728,785 | 782,312 | 727,705 | |||||||||
| Operating (loss) income |
(115,176 | ) | 32,978 | 23,853 | ||||||||
| Interest expense |
28,335 | 35,546 | 31,342 | |||||||||
| Interest income |
(288 | ) | (426 | ) | (818 | ) | ||||||
| Write-off of debt issuance costs |
20 | 283 | 2,031 | |||||||||
| Gain on extinguishment of debt |
(1,870 | ) | (16,532 | ) | — | |||||||
| Other expense (income) |
1,912 | (2,945 | ) | 940 | ||||||||
| (Loss) income before income taxes |
(143,285 | ) | 17,052 | (9,642 | ) | |||||||
| Provision for (benefit from) income taxes |
37,249 | 4,940 | (2,079 | ) | ||||||||
| Net (loss) income |
$ | (180,534 | ) | $ | 12,112 | $ | (7,563 | ) | ||||
| PER SHARE DATA: |
||||||||||||
| Net (loss) income per common share |
||||||||||||
| Basic |
$ | (9.28 | ) | $ | 0.63 | $ | (0.39 | ) | ||||
| Diluted |
$ | (9.28 | ) | $ | 0.62 | $ | (0.39 | ) | ||||
| Weighted-average number of shares |
||||||||||||
| Basic |
19,449 | 19,379 | 19,336 | |||||||||
| Diluted |
19,449 | 19,539 | 19,336 | |||||||||
The accompanying notes are an integral part of these consolidated financial statements.
F-4
Table of Contents
Quality Distribution, Inc. and Subsidiaries
Consolidated Balance Sheets
December 31, 2009 and 2008
(In thousands)
| December 31, 2009 |
December 31, 2008 |
|||||||
| ASSETS |
||||||||
| Current assets: |
||||||||
| Cash and cash equivalents |
$ | 5,633 | $ | 6,787 | ||||
| Accounts receivable, net |
69,625 | 81,612 | ||||||
| Prepaid expenses |
8,584 | 12,922 | ||||||
| Deferred tax asset, net |
5,506 | 14,707 | ||||||
| Other |
4,420 | 7,950 | ||||||
| Total current assets |
93,768 | 123,978 | ||||||
| Property and equipment, net |
127,329 | 148,692 | ||||||
| Goodwill |
27,023 | 173,519 | ||||||
| Intangibles, net |
18,467 | 22,698 | ||||||
| Non-current deferred tax asset, net |
— | 22,636 | ||||||
| Other assets |
13,029 | 10,580 | ||||||
| Total assets |
$ | 279,616 | $ | 502,103 | ||||
| LIABILITIES, REDEEMABLE NONCONTROLLING INTEREST AND SHAREHOLDERS’ (DEFICIT) EQUITY |
||||||||
| Current liabilities: |
||||||||
| Current maturities of indebtedness |
$ | 19,866 | $ | 8,361 | ||||
| Current maturities of capital lease obligations |
5,322 | 7,994 | ||||||
| Accounts payable |
6,182 | 16,126 | ||||||
| Affiliates and independent owner-operators payable |
9,734 | 7,649 | ||||||
| Accrued expenses |
21,378 | 25,357 | ||||||
| Environmental liabilities |
3,408 | 4,819 | ||||||
| Accrued loss and damage claims |
8,862 | 8,705 | ||||||
| Total current liabilities |
74,752 | 79,011 | ||||||
| Long-term indebtedness, less current maturities |
284,253 | 330,409 | ||||||
| Capital lease obligations, less current maturities |
11,843 | 15,822 | ||||||
| Environmental liabilities |
8,241 | 6,035 | ||||||
| Accrued loss and damage claims |
10,534 | 12,815 | ||||||
| Other non-current liabilities |
28,896 | 25,158 | ||||||
| Total liabilities |
418,519 | 469,250 | ||||||
| Commitments and contingencies—Note 19 |
||||||||
| Redeemable noncontrolling interest |
1,833 | 1,833 | ||||||
| SHAREHOLDERS’ (DEFICIT) EQUITY |
||||||||
| Common stock, no par value; 29,000 shares authorized; 20,297 issued and 20,077 outstanding at December 31, 2009 and 19,754 issued and 19,549 outstanding at December 31, 2008, respectively |
364,046 | 362,945 | ||||||
| Treasury stock, 220 and 205 shares at December 31, 2009 and December 31, 2008, respectively |
(1,580 | ) | (1,580 | ) | ||||
| Accumulated deficit |
(294,568 | ) | (114,034 | ) | ||||
| Stock recapitalization |
(189,589 | ) | (189,589 | ) | ||||
| Accumulated other comprehensive loss |
(25,587 | ) | (26,488 | ) | ||||
| Stock purchase warrants |
6,696 | — | ||||||
| Stock subscriptions receivable |
(154 | ) | (234 | ) | ||||
| Total shareholders’ (deficit) equity |
(140,736 | ) | 31,020 | |||||
| Total liabilities, redeemable noncontrolling interest and shareholders’ (deficit) equity |
$ | 279,616 | $ | 502,103 | ||||
The accompanying notes are an integral part of these consolidated financial statements.
F-5
Table of Contents
Quality Distribution, Inc. and Subsidiaries
Consolidated Statements of Shareholders’ Equity (Deficit) and Comprehensive Income (Loss)
For the Years Ended December 31, 2009, 2008 and 2007 (In thousands)
| Comprehensive Income (Loss) |
Shares of Common Stock |
Shares of Treasury Stock |
Common Stock |
Treasury Stock |
Accumulated Deficit |
Stock Recapitalization |
Accumulated Other Comprehensive Loss |
Stock Purchase Warrants |
Stock Subscription Receivables |
Total Shareholders’ Equity (Deficit) |
|||||||||||||||||||||||||||||||||
| Balance, December 31, 2006 |
— | 19,210 | (172 | ) | 359,995 | (1,527 | ) | (118,255 | ) | (189,589 | ) | (18,531 | ) | 21 | (340 | ) | 31,774 | ||||||||||||||||||||||||||
| Net loss |
$ | (7,563 | ) | — | — | — | — | (7,563 | ) | — | — | — | — | (7,563 | ) | ||||||||||||||||||||||||||||
| Issuance of restricted stock |
— | 47 | 11 | (25 | ) | 25 | — | — | — | — | — | — | |||||||||||||||||||||||||||||||
| Forfeiture of restricted stock |
— | — | (2 | ) | 11 | (11 | ) | — | — | — | — | — | — | ||||||||||||||||||||||||||||||
| Amortization of restricted stock |
— | — | — | 295 | — | — | — | — | — | — | 295 | ||||||||||||||||||||||||||||||||
| Amortization of non-employee options |
— | — | — | 125 | — | — | — | — | — | — | 125 | ||||||||||||||||||||||||||||||||
| Amortization of stock options |
— | — | — | 1,143 | — | — | — | — | — | — | 1,143 | ||||||||||||||||||||||||||||||||
| Stock warrant exercise |
— | 80 | — | 21 | — | — | — | — | (21 | ) | — | — | |||||||||||||||||||||||||||||||
| Stock option exercise |
— | — | 8 | 52 | 19 | — | — | — | — | — | 71 | ||||||||||||||||||||||||||||||||
| Acquisition of treasury stock |
— | (3 | ) | (3 | ) | — | (70 | ) | — | — | — | — | 70 | — | |||||||||||||||||||||||||||||
| FIN 48 Adjustment |
— | — | — | — | — | (328 | ) | — | — | — | — | (328 | ) | ||||||||||||||||||||||||||||||
| Translation adjustment, net of tax |
182 | — | — | — | — | — | — | 182 | — | — | 182 | ||||||||||||||||||||||||||||||||
| Adjustment to pension obligation, net of a deferred tax liability of $1,009 |
1,601 | — | — | — | — | — | — | 1,601 | — | — | 1,601 | ||||||||||||||||||||||||||||||||
| Balance, December 31, 2007 |
$ | (5,780 | ) | 19,334 | (158 | ) | $ | 361,617 | $ | (1,564 | ) | $ | (126,146 | ) | $ | (189,589 | ) | $ | (16,748 | ) | $ | — | $ | (270 | ) | $ | 27,300 | ||||||||||||||||
| Net income |
$ | 12,112 | — | — | — | — | 12,112 | — | — | — | — | 12,112 | |||||||||||||||||||||||||||||||
| Issuance of restricted stock |
— | 468 | — | — | — | — | — | — | — | — | — | ||||||||||||||||||||||||||||||||
| Forfeiture of restricted stock |
— | (48 | ) | (47 | ) | — | — | — | — | — | — | — | — | ||||||||||||||||||||||||||||||
| Amortization of restricted stock |
— | — | — | 208 | — | — | — | — | — | — | 208 | ||||||||||||||||||||||||||||||||
| Amortization of non-employee options |
— | — | — | 119 | — | — | — | — | — | — | 119 | ||||||||||||||||||||||||||||||||
| Amortization of stock options |
— | — | — | 1,001 | — | — | — | — | — | — | 1,001 | ||||||||||||||||||||||||||||||||
| Acquisition of treasury stock |
— | — | — | — | (16 | ) | — | — | — | — | 36 | 20 | |||||||||||||||||||||||||||||||
| Translation adjustment, net of tax |
(79 | ) | — | — | — | — | — | — | (79 | ) | — | — | (79 | ) | |||||||||||||||||||||||||||||
| Adjustment to pension obligation, net of tax |
(9,661 | ) | — | — | — | — | — | — | (9,661 | ) | — | — | (9,661 | ) | |||||||||||||||||||||||||||||
| Balance, December 31, 2008 |
$ | 2,372 | $ | 19,754 | (205 | ) | $ | 362,945 | $ | (1,580 | ) | $ | (114,034 | ) | $ | (189,589 | ) | $ | (26,488 | ) | — | $ | (234 | ) | $ | 31,020 | |||||||||||||||||
The accompanying notes are an integral part of these consolidated financial statements.
F-6
Table of Contents
Quality Distribution, Inc. and Subsidiaries
Consolidated Statements of Shareholders’ Equity (Deficit) and Comprehensive Income (Loss)—(Continued)
For the Years Ended December 31, 2009, 2008 and 2007 (In thousands)
| Comprehensive (Loss) Income |
Shares of Common Stock |
Shares of Treasury Stock |
Common Stock |
Treasury Stock |
Accumulated Deficit |
Stock Recapitalization |
Accumulated Other Comprehensive Loss |
Stock Purchase Warrants |
Stock Subscription Receivables |
Total Shareholders’ Equity (Deficit) |
|||||||||||||||||||||||||||||
| Balance, December 31, 2008 |
19,754 | (205 | ) | $ | 362,945 | $ | (1,580 | ) | $ | (114,034 | ) | $ | (189,589 | ) | $ | (26,488 | ) | — | $ | (234 | ) | $ | 31,020 | ||||||||||||||||
| Net loss |
$ | (180,534 | ) | — | — | — | — | (180,534 | ) | — | — | — | — | (180,534 | ) | ||||||||||||||||||||||||
| Issuance of restricted stock |
— | 543 | — | — | — | — | — | — | — | — | — | ||||||||||||||||||||||||||||
| Forfeiture of restricted stock |
— | — | (15 | ) | — | — | — | — | — | — | — | — | |||||||||||||||||||||||||||
| Amortization of restricted stock |
— | — | — | 388 | — | — | — | — | — | — | 388 | ||||||||||||||||||||||||||||
| Amortization of stock options |
— | — | — | 713 | — | — | — | — | — | — | 713 | ||||||||||||||||||||||||||||
| Forgiveness of stock subscription receivable |
— | — | — | — | — | — | — | — | — | 80 | 80 | ||||||||||||||||||||||||||||
| Issuance of stock purchase warrants |
— | — | — | — | — | — | — | — | 6,696 | — | 6,696 | ||||||||||||||||||||||||||||
| Translation adjustment, net of tax |
(134 | ) | — | — | — | — | — | — | (134 | ) | — | — | (134 | ) | |||||||||||||||||||||||||
| Adjustment to pension obligation, net of tax |
1,035 | — | — | — | — | — | — | 1,035 | — | — | 1,035 | ||||||||||||||||||||||||||||
| Balance, December 31, 2009 |
$ | (179,633 | ) | 20,297 | (220 | ) | $ | 364,046 | $ | (1,580 | ) | $ | (294,568 | ) | $ | (189,589 | ) | $ | (25,587 | ) | $ | 6,696 | $ | (154 | ) | $ | (140,736 | ) | |||||||||||
The accompanying notes are an integral part of these consolidated financial statements.
F-7
Table of Contents
Quality Distribution, Inc. and Subsidiaries
Consolidated Statements of Cash Flows
For the Years Ended December 31, 2009, 2008 and 2007
(In thousands)
| Years Ended December 31, | ||||||||||||
| 2009 | 2008 | 2007 | ||||||||||
| CASH FLOWS FROM OPERATING ACTIVITIES: |
||||||||||||
| Net (loss) income |
$ | (180,534 | ) | $ | 12,112 | $ | (7,563 | ) | ||||
| Adjustments to reconcile to net cash and cash equivalents provided by (used in) operating activities: |
||||||||||||
| Deferred income tax benefit |
(4,222 | ) | (657 | ) | (6,029 | ) | ||||||
| Depreciation and amortization |
20,218 | 21,002 | 17,544 | |||||||||
| Bad debt expense |
1,838 | 1,086 | 796 | |||||||||
| Gain on sale of tank wash assets |
(7,130 | ) | — | — | ||||||||
| Loss (gain) on disposal of property and equipment |
450 | (3,092 | ) | 959 | ||||||||
| Impairment charge |
148,630 | — | — | |||||||||
| Gain on pension settlement |
— | (3,410 | ) | — | ||||||||
| PIK interest on Senior Subordinated Notes |
469 | — | — | |||||||||
| Gain on extinguishment of debt |
(1,870 | ) | (16,532 | ) | — | |||||||
| Financing costs |
2,323 | — | — | |||||||||
| Write-off of deferred financing costs |
20 | 283 | 2,031 | |||||||||
| Stock based compensation |
1,101 | 1,328 | 1,563 | |||||||||
| Amortization of deferred financing costs |
2,826 | 3,005 | 1,865 | |||||||||
| Amortization of bond discount |
1,358 | 1,100 | 279 | |||||||||
| Noncontrolling interest dividends |
145 | 145 | 145 | |||||||||
| Increase in deferred tax asset valuation allowance |
41,566 | — | 1,403 | |||||||||
| Changes in assets and liabilities: |
||||||||||||
| Accounts and other receivables |
9,945 | 16,755 | (2,545 | ) | ||||||||
| Prepaid expenses |
5,254 | 1,765 | (309 | ) | ||||||||
| Other assets |
2,776 | 2,456 | 910 | |||||||||
| Accounts payable |
(2,844 | ) | (2,685 | ) | (288 | ) | ||||||
| Accrued expenses |
(4,150 | ) | (860 | ) | 2,784 | |||||||
| Environmental liabilities |
794 | (315 | ) | (657 | ) | |||||||
| Accrued loss and damage claims |
(2,124 | ) | (10,392 | ) | (1,155 | ) | ||||||
| Affiliates and independent owner-operators payable |
2,085 | (4,949 | ) | 816 | ||||||||
| Other liabilities |
233 | 3,127 | 545 | |||||||||
| Current income taxes |
599 | (1,679 | ) | 958 | ||||||||
| Net cash provided by operating activities |
39,756 | 19,593 | 14,052 | |||||||||
| CASH FLOWS FROM INVESTING ACTIVITIES: |
||||||||||||
| Capital expenditures |
(8,221 | ) | (14,791 | ) | (10,557 | ) | ||||||
| Acquisition of businesses and assets |
— | (1,399 | ) | (6,836 | ) | |||||||
| Acquisition of Boasso America Corporation |
— | — | (53,415 | ) | ||||||||
| Cash acquired from Boasso America Corporation |
— | — | 1,015 | |||||||||
| Boasso purchase adjustment |
266 | 1,318 | — | |||||||||
| Proceeds from sale of tank wash assets |
10,000 | — | — | |||||||||
| Proceeds from sales of property and equipment |
7,532 | 6,348 | 6,394 | |||||||||
| Net cash provided by (used in) investing activities |
9,577 | (8,524 | ) | (63,399 | ) | |||||||
| CASH FLOWS FROM FINANCING ACTIVITIES: |
||||||||||||
| Proceeds from issuance of long-term debt |
— | 1,049 | 46,809 | |||||||||
| Principal payments on long-term debt |
(9,829 | ) | (12,900 | ) | (65,450 | ) | ||||||
| Principal payments on capital lease obligations |
(7,913 | ) | (3,835 | ) | (1,204 | ) | ||||||
| Proceeds from revolver |
28,600 | 115,700 | 123,030 | |||||||||
| Payments on revolver |
(47,600 | ) | (112,830 | ) | (41,400 | ) | ||||||
| Payments on acquisition notes |
(966 | ) | (1,015 | ) | (592 | ) | ||||||
| Financing costs |
(2,323 | ) | — | — | ||||||||
| Deferred financing costs |
(2,554 | ) | (860 | ) | (9,170 | ) | ||||||
| Stock offering costs |
— | — | (787 | ) | ||||||||
| Change in book overdraft |
(7,785 | ) | 1,331 | 1,033 | ||||||||
| Minority dividends |
(145 | ) | (145 | ) | (145 | ) | ||||||
| Other stock transactions |
— | 20 | 70 | |||||||||
| Net cash (used in) provided by financing activities |
(50,515 | ) | (13,485 | ) | 52,194 | |||||||
| Effect of exchange rate changes on cash |
28 | (508 | ) | 23 | ||||||||
| Net (decrease) increase in cash and cash equivalents |
(1,154 | ) | (2,924 | ) | 2,870 | |||||||
| Cash and cash equivalents, beginning of period |
6,787 | 9,711 | 6,841 | |||||||||
| Cash and cash equivalents, end of period |
$ | 5,633 | $ | 6,787 | $ | 9,711 | ||||||
F-8
Table of Contents
Quality Distribution, Inc. and Subsidiaries
Consolidated Statements of Cash Flows—(Continued)
For the Years Ended December 31, 2009, 2008 and 2007
(In thousands)
| Years Ended December 31, | |||||||||||
| 2009 | 2008 | 2007 | |||||||||
| SUPPLEMENTAL DISCLOSURE OF CASH FLOW INFORMATION |
|||||||||||
| Cash paid during the year for: |
|||||||||||
| Interest |
$ | 22,704 | $ | 30,690 | $ | 28,850 | |||||
| Income Taxes |
182 | 2,019 | 438 | ||||||||
| SUPPLEMENTAL DISCLOSURES OF NON-CASH FLOW INFORMATION: |
|||||||||||
| Minimum pension liability accrual, net of tax |
$ | 248 | $ | 12,565 | $ | 2,422 | |||||
| Original and amended capital lease obligations |
1,280 | 22,368 | 1,094 | ||||||||
| Notes issued to seller for sale (purchase) of business assets |
3,000 | (1,121 | ) | (4,956 | ) | ||||||
| Notes payable—capital expenditures |
— | 12,658 | — | ||||||||
| Notes payable—insurance fundings |
1,879 | 6,537 | — | ||||||||
| Deferred tax adjustment related to Boasso acquisition |
— | — | 10,050 | ||||||||
| Adjustment to deferred taxes for FIN 48 adoption |
— | — | 972 | ||||||||
| Transfer of tractors from other assets to fixed assets |
— | — | 2,950 | ||||||||
| Warrant discount on notes issuance |
6,696 | — | — | ||||||||
| Long-term liability assumed with purchase of business |
— | (3,410 | ) | — | |||||||
The accompanying notes are an integral part of these consolidated financial statements.
F-9
Table of Contents
Quality Distribution, Inc. and Subsidiaries
Notes to Consolidated Financial Statements
For the Years Ended December 31, 2009, 2008 and 2007
1. BUSINESS ORGANIZATION
Quality Distribution, Inc. (the “Company”, “QDI”, or “we”) and its subsidiaries are engaged primarily in truckload transportation of bulk chemicals in North America. We conduct a significant portion of our business through a network of affiliates and independent owner-operators. Affiliates are independent companies, which enter into various term contracts with the Company. Affiliates are responsible for paying for their own power equipment (including debt service), fuel and other operating costs. Certain affiliates lease trailers from us. Independent owner-operators are independent contractors, who, through a contract with us, supply one or more tractors and drivers for our use. Contracts with independent owner-operators may be terminated by either party on short notice. We charge affiliates and third parties for the use of tractors and trailers as necessary. In exchange for the services rendered, affiliates and independent owner-operators are normally paid a percentage of the revenues collected on each load hauled.
2. SIGNIFICANT ACCOUNTING POLICIES
Basis of Presentation
These consolidated financial statements have been prepared in accordance with accounting principles generally accepted in the United States using U.S. dollars as the reporting currency as the majority of our business is in the U.S. The consolidated financial statements include the accounts of QDI and its subsidiaries. All significant intercompany accounts and transactions have been eliminated in consolidation. Redeemable noncontrolling interest reflects outstanding preferred stock of Chemical Leaman Corp. (“CLC”), a subsidiary of QDI.
Cash and Cash Equivalents
We consider all highly liquid investments with original maturities of three months or less to be cash equivalents. Book overdrafts are included in accounts payable.
Allowance for Uncollectible Receivables
We have established a reserve for uncollectible receivables based on a combination of historical data, cash payment trends, specific customer issues, write-off trends, general economic conditions and other factors. We charge uncollectible amounts to our allowance based on various issues, including cash payment trends and specific customer issues. These factors are continuously monitored by our management to arrive at the estimate for the amount of accounts receivable that may be ultimately uncollectible. The receivables analyzed include trade receivables, as well as loans and advances made to independent owner-operators.
Inventories
Inventories are stated at the lower of cost (first-in, first-out method) or market and consist primarily of tires, parts, fuel and supplies for servicing our revenue equipment (tractors and trailers).
Tires
We capitalize the cost of tires mounted on purchased revenue equipment as a part of the total equipment cost and depreciate the cost over the useful life of the related equipment. Subsequent replacement tires are expensed at the time those tires are placed in service similar to other repairs and maintenance costs.
F-10
Table of Contents
Quality Distribution, Inc. and Subsidiaries
Notes to Consolidated Financial Statements—(Continued)
For the Years Ended December 31, 2009, 2008 and 2007
Property and Equipment and Impairment on Long-Lived Assets
Property and equipment expenditures, including tractor and trailer rebuilds that extend the useful lives of such equipment, are capitalized and recorded at cost. For financial statement purposes, these assets are depreciated using the straight-line method over the estimated useful lives of the assets to an estimated salvage value.
The asset lives used are presented in the following table:
| Average Lives (in years) | ||
| Buildings and improvements |
10 - 25 | |
| Tractors and terminal equipment |
5 - 7 | |
| Trailers |
15 - 20 | |
| Furniture and fixtures |
3 - 5 | |
| Other equipment |
3 - 10 |
Tractor and trailer rebuilds, which are recurring in nature and extend the lives of the related assets, are capitalized and depreciated over the period of extension, generally 3 to 10 years, based on the type and extent of these rebuilds. Maintenance and repairs are charged directly to expense as incurred. Major improvements that extend the lives of the assets are capitalized. Management estimates the useful lives of these assets based on historical trends and the age of the assets when placed in service, and any changes in the actual lives could result in material changes in the periodic depreciation and resulting net book value of these assets. Additionally, we estimate the salvage values of these assets based on historical sales of disposals, and any changes in the actual salvage values could also affect the periodic depreciation and resulting net book value of these assets.
Furthermore, we evaluate the recoverability of our long-lived assets whenever adverse events or changes in the business climate indicate that the expected undiscounted future cash flows from the related category of assets may be less than previously anticipated. We assess whether there has been an impairment of long-lived assets and definite lived intangibles in accordance with the FASB guidance. If the carrying value of an asset, including associated intangibles, exceeds the sum of estimated undiscounted future cash flows, then an impairment loss is recognized for the difference between estimated fair value and carrying value. When assets are disposed of, the cost and related accumulated depreciation are removed from the accounts, and any gains or losses are reflected in operating expenses.
Goodwill and Intangible Assets
We evaluate goodwill and indefinite–lived intangible assets for impairment annually during the second quarter with a measurement date of June 30, or more frequently if indicators of impairment arise, in accordance the FASB guidance. We have identified three reporting units: trucking, container services and other. Our evaluation of goodwill is measured through a two-step impairment test. The first step compares the fair value of a reporting unit to its carrying amount, including goodwill. If the fair value of a reporting unit exceeds its carrying amount, goodwill of the reporting unit is considered not impaired, thus the second step of the impairment test is unnecessary. If the carrying amount of a reporting unit exceeds its fair value, the second step of the goodwill impairment test shall be performed to measure the amount of impairment loss. The second step compares the implied fair value of reporting unit goodwill with the carrying amount of that goodwill. If the carrying amount of reporting unit goodwill exceeds the implied fair value of that goodwill, an impairment loss must be recognized in an amount equal to the excess. The loss recognized cannot exceed the carrying amount of goodwill. After a
F-11
Table of Contents
Quality Distribution, Inc. and Subsidiaries
Notes to Consolidated Financial Statements—(Continued)
For the Years Ended December 31, 2009, 2008 and 2007
goodwill impairment loss is recognized, the adjusted carrying amount of goodwill will be its new accounting basis. Subsequent reversal of a previously recognized goodwill impairment loss is prohibited once the measurement of that loss is completed.
Impairment of Long-Lived Assets Other than Goodwill
Long-lived assets held and used, including revenue earning equipment, operating property and equipment and intangible assets with finite lives, are tested for recoverability when circumstances indicate that the carrying amount of assets may not be recoverable. Recoverability of long-lived assets is evaluated by comparing the carrying amount of an asset or asset group to management’s best estimate of the undiscounted future operating cash flows (excluding interest charges) expected to be generated by the asset or asset group. If these comparisons indicate that the asset or asset group is not recoverable, an impairment loss is recognized at the amount by which the carrying value of the asset or asset group exceeds fair value. Fair value is determined by quoted market price, if available, or an estimate of projected future operating cash flows, discounted using a rate that reflects the related operating segment’s average cost of funds. Long-lived assets to be disposed of including revenue earning equipment, operating property and equipment and indefinite-lived intangible assets, are reported at the lower of carrying amount or fair value less costs to sell.
Other Assets—Deferred Loan Costs
Costs incurred to issue debt are deferred and amortized as a component of interest expense over the estimated term of the related debt using the effective interest rate method.
Taxation—We use the liability method of accounting for income taxes. If, on the basis of available evidence, it is more likely than not that all or a portion of the deferred tax asset will not be realized, the asset must be reduced by a valuation allowance. Since realization is not assured as of December 31, 2009, management has deemed it appropriate to establish a valuation allowance against the net deferred tax assets. Any change in the actual future results of operations could impact the valuation of the net deferred tax asset.
A valuation allowance has been established for 100% of our net deferred tax asset as we no longer believe it meets the “more likely than not” criteria. Our judgments regarding future taxable income may change due to changes in market conditions, changes in tax laws or other factors. If any of the assumptions and related estimates change in the future, it may increase or decrease the valuation allowance and related income tax expense in the same period.
During the second quarter of 2009, an impairment charge of $148.6 million was recorded and as result we were in a cumulative loss position. We base this cumulative loss analysis on a rolling thirty-six month calculation of U.S. earnings. As a result of this negative evidence it was determined that is was no longer more likely than not our net deferred tax asset was realizable. For purposes of assessing realizability of the deferred tax assets, this cumulative financial reporting loss position is considered significant negative evidence and has caused us to conclude that we will not fully realize the deferred tax assets. This evidence was weighed against positive evidence such as positive forecasted earnings and when net operating losses are expected to expire. The negative evidence out weighed the positive evidence and as a result, a $41.2 million deferred tax valuation allowance was recorded.
At December 31, 2009 we had an estimated $95.7 million in federal net operating loss carryforwards, $2.3 million in alternative minimum tax credit carryforwards and $3.1 million in foreign tax credit carryforwards. The net operating loss carryforwards will expire in the years 2018 through 2027, while the alternative minimum tax credits may be carried forward indefinitely and the foreign tax credits may be carried forward for 10 years. We
F-12
Table of Contents
Quality Distribution, Inc. and Subsidiaries
Notes to Consolidated Financial Statements—(Continued)
For the Years Ended December 31, 2009, 2008 and 2007
do not have a history of net operating loss or tax credit carryforwards expiring unused; however, we have determined based on the weight of available evidence that it is more likely than not that some or all of the carryforwards may expire.
We continue to evaluate quarterly, the positive and negative evidence regarding the realization of net deferred tax assets in accordance with FASB guidance for income taxes. Included in this assessment are estimates of projected future taxable income. Significant management judgment is required in this process and although realization is not assured, based on our assessment, we concluded it is more likely than not, such assets will not continue to be realized.
FASB guidance requires that companies recognize the effect of a tax position in their consolidated financial statements if there is a greater likelihood than not of the position being sustained upon audit based on the technical merits of the position. We adopted accounting for uncertain tax positions effective January 1, 2007. As a result of the implementation, we recognized an increase to reserves for uncertain tax positions of $0.3 million. The increase to the reserve was accounted for as an adjustment to accumulated deficit to recognize the cumulative effect of adoption on the balance sheet.
Under FASB guidance, we account for uncertain tax positions using a two-step process. The first step is to evaluate the tax position for recognition by determining if the weight of available evidence indicates that it is more likely than not that the position will be sustained on audit, including resolution of related appeals or litigation processes, if any. The second step requires us to estimate and measure the tax benefit as the largest amount that is more than 50% likely to be realized upon ultimate settlement. It is inherently difficult and subjective to estimate such amounts, as we have to determine the probability of various possible outcomes. We re-evaluate these uncertain tax positions on a quarterly basis. This evaluation is based on factors including, but not limited to, changes in facts or circumstances, changes in tax law, effectively settled issues under audit, and new audit activity. Such a change in recognition or measurement would result in the recognition of a tax benefit or an additional charge to the tax provision
Environmental liabilities
We have reserved for potential environmental liabilities based on the best estimates of potential clean-up and remediation for known environmental sites. We employ a staff of environmental professionals to administer all phases of our environmental programs and use outside experts where needed. These professionals develop estimates of potential liabilities at these sites based on projected and known remediation costs. These cost projections are determined through previous experiences with other sites and through bids from third-party contractors. Management believes current reserves are reasonable based on current information.
Accrued Loss and Damage and Claims
We currently maintain liability insurance for bodily injury and property damage claims, covering all employees, independent owner-operators and affiliates, and workers’ compensation insurance coverage on our employees and company drivers. This insurance includes deductibles of $2.0 million per incident for bodily injury and property damage and $1.0 million for workers’ compensation for periods after March 31, 2008. Prior to March 30, 2008, our insurance deductible was $5.0 million per incident for bodily injury and property damage. As such, we are subject to liability as a self-insurer to the extent of these deductibles under the policy. We are self-insured for damage to the equipment we own or lease and for cargo losses. As of December 31, 2009, we had $33.6 million in an outstanding letter of credit to our insurance administrator to guarantee the self-insurance portion of our liability. If we fail to meet certain terms of our agreement, the insurance administrator may draw
F-13
Table of Contents
Quality Distribution, Inc. and Subsidiaries
Notes to Consolidated Financial Statements—(Continued)
For the Years Ended December 31, 2009, 2008 and 2007
down the letter of credit. In developing liability reserves, we rely on professional third party claims administrators, insurance company estimates and the judgment of our own safety department personnel, and independent professional actuaries and attorneys. The most significant assumptions used in the estimation process include determining the trends in loss costs, the expected consistency in the frequency and severity of claims incurred but not yet reported to prior-year claims, and expected costs to settle unpaid claims. Management believes reserves are reasonable given known information, but as each case develops, estimates may change to reflect the effect of new information.
Redeemable Noncontrolling Interest
Shares of Series C preferred stock of our subsidiary, Chemical Leaman Corporation (“CLC”) are held by two shareholders that are not affiliated with us. These shareholders are entitled to dividends on their shares of Series C preferred stock, payable quarterly, at a rate of 8.0% (or $480 per share) per annum on each share of Series C preferred stock. As of December 31, 2009 all 302 shares were outstanding, fully redeemable and carried at a maximum aggregate redemption value of $1.8 million in accordance with FASB guidance. In 2009, we adopted FASB guidance that requires us to report the noncontrolling interest as a temporary equity item.
Foreign Currency Translation
The translation from Canadian dollars to U.S. dollars is performed for balance sheet accounts using current exchange rates in effect at the balance sheet date and for revenue and expense accounts using a weighted-average exchange rate in effect during the period. The gains or losses, net of income taxes, resulting from such translation are included in shareholders’ deficit as a component of accumulated other comprehensive loss. Gains or losses from foreign currency transactions are included in other expense.
Accumulated Other Comprehensive Loss
The components of accumulated other comprehensive loss are as follows at December 31 (in thousands):
| 2009 | 2008 | |||||
| Unrecognized loss and prior service costs |
$ | 24,511 | $ | 25,546 | ||
| Foreign currency translation adjustment |
1,076 | 942 | ||||
| $ | 25,587 | $ | 26,488 | |||
Revenue Recognition
Transportation revenue, including fuel surcharges, and related costs are recognized on the date freight is delivered. Other service revenue consists primarily of rental revenues, container revenues and tank wash revenues. Rental revenues from affiliates, independent owner-operators and third parties, are recognized ratably over the lease period. Container revenues, consisting primarily of repair and storage services, are recognized when the services are rendered. Tank wash revenues are recognized when the wash is completed. Service revenues on insurance policies are recorded as a contractual percentage of premiums received ratably over the period that the insurance covers. We recognize all revenues on a gross basis as the principal and primary obligor with risk of loss in relation to our responsibility for completion of services as contracted with our customers.
F-14
Table of Contents
Quality Distribution, Inc. and Subsidiaries
Notes to Consolidated Financial Statements—(Continued)
For the Years Ended December 31, 2009, 2008 and 2007
Other Service Revenue
The components of Other service revenue are as follows at December 31 (in thousands):
| 2009 | 2008 | 2007 | |||||||
| Rental revenue |
$ | 42,115 | $ | 30,508 | $ | 31,422 | |||
| Container revenues |
31,161 | 31,413 | 2,264 | ||||||
| Tank wash revenue |
19,530 | 28,395 | 31,136 | ||||||
| Other revenue |
12,148 | 13,723 | 11,399 | ||||||
| $ | 104,954 | $ | 104,039 | $ | 76,221 | ||||
Share-Based Compensation
Under the FASB guidance, we apply the Black-Scholes valuation model in determining the fair value of share-based payments to employees. The resulting compensation expense is recognized over the requisite service period, which is generally the option vesting term of four years. Please refer to Note 18 for further discussion regarding stock-based compensation.
Leased Assets
We have both capital and operating leases. The leases for most of our tractors and trailers have terms that range from three to seven years. Some leases require us to pay the lessor a minimum residual amount at the end of the lease. For operating leases, we accrue this residual by recording a prepaid rent amount and amortizing a monthly amount as rental expense and also record a liability that is increased every year by recognizing interest expense. This residual amount is recorded in the balance sheet category “Other non-current liabilities.” For capital leases, the residual is included as part of the cost of the capitalized leased asset.
Use of Estimates
The preparation of financial statements in conformity with generally accepted accounting principles requires management to make estimates and assumptions that affect the reported amounts of assets and liabilities and disclosure of contingent assets and liabilities at the date of the financial statements and the reported amounts of revenues and expenses during the reporting period. Actual results could differ from those estimates.
Net (Loss) Income Per Common Share
Basic net (loss) income per common share is calculated based on the weighted-average common shares outstanding during each period. Diluted (loss) income per common share includes the dilutive effect, if any, of common equivalent shares outstanding during each period.
New Accounting Pronouncements
During 2009, the Financial Accounting Standards Board (“FASB”) issued the FASB Accounting Standards Codification, or Codification. The Codification became the single source for all authoritative generally accepted accounting principles. The Codification does not change GAAP and did not impact our financial position or results of operations.
F-15
Table of Contents
Quality Distribution, Inc. and Subsidiaries
Notes to Consolidated Financial Statements—(Continued)
For the Years Ended December 31, 2009, 2008 and 2007
In June 2009, FASB issued new guidance which revises and updates previously issued guidance related to variable interest entities. The new guidance eliminates the exceptions to consolidating qualifying special-purpose entities that were included in the prior guidance. The new guidance contains new criteria for determining the primary beneficiary and increases the frequency of required reassessments to determine whether a company is the primary beneficiary of a variable interest entity. The guidance also contains a new requirement that any term, transaction, or arrangement that does not have a substantive effect on an entity’s status as a variable interest entity, a company’s power over a variable interest entity, or a company’s obligation to absorb losses or its right to receive benefits of an entity must be disregarded. The elimination of the qualifying special-purpose entity concept and its consolidation exceptions means more entities will be subject to consolidation assessments and reassessments. The new guidance will be effective for our fiscal year beginning January 1, 2010. This guidance has no impact on our consolidated financial statements.
In June 2009, the FASB issued guidance that eliminates the concept of a qualifying special-purpose entity, creates more stringent conditions for reporting a transfer of a portion of a financial asset as a sale, clarifies other sale-accounting criteria, and changes the initial measurement of a transferor’s interest in transferred financial assets. This guidance will be effective for our fiscal year beginning January 1, 2010. This guidance has no impact on our consolidated financial statements.
In May 2009, the FASB issued guidance related to subsequent events that provides general standards of accounting for and disclosure of events that occur after the balance sheet date but before financial statements are issued or are available to be issued. It requires the disclosure of the date through which an entity has evaluated subsequent events and the basis for that date; that is, whether that date represents the date the financial statements were issued or were available to be issued. We adopted this guidance in the second quarter of 2009, as it became effective for interim or annual financial periods ending after June 15, 2009. In February 2010 the guidance was amended, eliminating the requirement to disclose the date through which subsequent events were evaluated.
On April 9, 2009, the Securities and Exchange Commission (“SEC”) issued guidance that amended and supplemented its previous guidance on other than temporary impairment of certain investments in debt and equity securities. The newly issued guidance maintains the SEC staff’s previous views related to equity securities; however, debt securities are excluded from its scope. The guidance provides that “other-than-temporary” impairment is not necessarily the same as “permanent” impairment and unless evidence exists to support a value equal to or greater than the carrying value of the equity security investment, a write-down to fair value should be recorded and accounted for as a realized loss. The guidance was effective upon issuance and had no impact on our consolidated financial statements.
On April 9, 2009, the FASB issued guidance which requires an entity to provide disclosures about fair value of financial instruments in interim financial information. The disclosures are required prospectively and are effective for interim and annual periods ending after June 15, 2009. We adopted this guidance, and the required disclosures are included herein. This guidance had no impact on our consolidated financial statements.
On April 1, 2009, the FASB issued guidance requiring that assets acquired and liabilities assumed in a business combination that arise from a contingency must be recognized at fair value. If fair value cannot be determined during the measurement period defined in the guidance, the asset or liability can still be recognized if it can be determined that it is probable that the asset existed or the liability had been incurred as of the measurement date and if the amount of the asset or liability can be reasonably estimated. If it is not determined to be probable that the asset/liability existed/was incurred or no reasonable amount can be determined, no asset or liability is recognized. The entity should determine a rational basis for subsequently measuring the acquired assets and assumed liabilities. Contingent consideration agreements should be recognized initially at fair value
F-16
Table of Contents
Quality Distribution, Inc. and Subsidiaries
Notes to Consolidated Financial Statements—(Continued)
For the Years Ended December 31, 2009, 2008 and 2007
and subsequently reevaluated in accordance with the guidance. The guidance is effective for business combinations with an acquisition date on or after the beginning of the Company’s first annual reporting period beginning on or after December 15, 2008. The Company will assess the impact of this guidance if and when a future acquisition occurs.
On January 1, 2009, we adopted newly issued guidance from the FASB regarding business combinations. This guidance significantly changes the financial accounting and reporting of business combination transactions but retains the fundamental requirements of the prior guidance, including utilizing the purchase method for all business combinations and identifying an acquirer for each business combination. The impact of adopting the new guidance will depend on the nature, terms and size of business combinations completed.
On January 1, 2009, we adopted the FASB’s amended guidance on noncontrolling interests in consolidated financial statements. This guidance requires the reporting of all noncontrolling interests as a separate component of stockholders’ equity, the reporting of consolidated net income (loss) as the amount attributable to both the parent and the noncontrolling interests, and the separate disclosure of net income (loss) attributable to the parent and to the noncontrolling interests. Other than the reporting requirements described above which require retrospective application, the remaining provisions are to be applied prospectively in the first annual reporting period beginning on or after December 15, 2008. The adoption of this guidance had an immaterial impact on our consolidated financial statements.
In conjunction with guidance on noncontrolling interests, we adopted guidance on classification and measurement of redeemable securities. This standard is applicable for all noncontrolling interests where the Company is subject to equity classified securities that are redeemable or may become redeemable at a fixed or determinable price on a fixed or determinable date, at the option of the holder, or upon the occurrence of an event that is not solely within the control of the issuer. A subsidiary of QDI has issued and outstanding preferred stock that is held by holders other than QDI and its other subsidiaries. The holders have the right to cause us to redeem their shares of preferred stock. The redemption value of the preferred stock held by these noncontrolling holders equals the fair value of $1.8 million at December 31, 2009 and is reflected in our consolidated balance sheets as redeemable noncontrolling interest.
On January 1, 2009, we adopted new guidance from the FASB on determining the useful life of intangible assets which amends the factors that should be considered in developing renewal or extension assumptions used to determine the useful life of a recognized intangible asset. The amended guidance removes an earlier requirement to consider whether an intangible asset can be renewed without substantial cost or material modifications to the existing terms and conditions; instead, it requires an entity to consider its own historical experience in renewing similar arrangements. The guidance also requires expanded disclosure related to the determination of intangible asset useful lives. The adoption of this guidance had no impact on our consolidated financial statements.
On January 1, 2009, we adopted the FASB’s guidance to assist in determining whether instruments granted in share-based payment transactions are participating securities. The guidance addresses whether unvested equity-based awards are participating securities and, therefore, need to be included in the earnings allocation in computing earnings per share under the two-class method The adoption of this guidance had no impact on our consolidated financial statements.
In December 2008, the FASB issued guidance on an employer’s disclosures about plan assets of a defined benefit pension or other postretirement plan. This guidance is intended to ensure that an employer meets the objectives of the disclosures about plan assets in an employer’s defined benefit pension or other postretirement
F-17
Table of Contents
Quality Distribution, Inc. and Subsidiaries
Notes to Consolidated Financial Statements—(Continued)
For the Years Ended December 31, 2009, 2008 and 2007
plan to provide users of financial statements with an understanding of the following: how investment allocation decisions are made, the major categories of plan assets, the inputs and valuation techniques used to measure the fair value of plan assets, the effect of fair value measurements using significant unobservable inputs on changes in plan assets, and significant concentrations of risk within plan assets. The disclosures required become effective for us on December 31, 2009. We have determined that the adoption of this guidance will not have an impact on our consolidated financial statements.
On January 1, 2008, we adopted the FASB’s guidance on fair value measurements which provides a consistent definition of fair value that focuses on exit price and prioritizes, within a measurement of fair value, the use of market-based inputs over company-specific inputs. The guidance requires expanded disclosures about fair value measurements and establishes a three-level hierarchy for fair value measurements based on the observable inputs to the valuation of an asset or liability at the measurement date. The standard also requires that a company consider its own nonperformance risk when measuring liabilities carried at fair value, including derivatives. In February 2008, the FASB permitted companies to partially defer the effective date of its fair value measurement guidance for one year for nonfinancial assets and nonfinancial liabilities that are recognized or disclosed at fair value in the financial statements on a nonrecurring basis, and we elected to do so. On January 1, 2009, we adopted the fair value measurement guidance for nonfinancial assets and nonfinancial liabilities. The effect of our adoption was not material to our consolidated financial statements.
On January 1, 2008, we adopted the FASB’s guidance on the fair value option for financial assets and financial liabilities which permits a company to measure certain financial assets and financial liabilities at fair value that were not previously required to be measured at fair value. We have not elected to measure any financial assets and financial liabilities at fair value which were not previously required to be measured at fair value; therefore, the adoption of this guidance has had no effect on our results of operations.
3. FAIR VALUE OF FINANCIAL INSTRUMENTS
The three-level valuation hierarchy for fair value measurements is based upon observable and unobservable inputs. Observable inputs reflect market data obtained from independent sources, while unobservable inputs reflect our market assumptions. These two types of inputs create the following fair value hierarchy:
| • | Level 1—Quoted prices for identical instruments in active markets; |
| • | Level 2—Quoted prices for similar instruments in active markets; quoted prices for identical or similar instruments in markets that are not active; and model-derived valuations whose significant inputs are observable: and |
| • | Level 3—Instruments whose significant inputs are unobservable. |
Following is a description of the valuation methodologies we used for instruments measured at fair value, as well as the general classification of such instruments pursuant to the valuation hierarchy.
F-18
Table of Contents
Quality Distribution, Inc. and Subsidiaries
Notes to Consolidated Financial Statements—(Continued)
For the Years Ended December 31, 2009, 2008 and 2007
Fair Value Measurements on a Nonrecurring Basis
The following tables summarize assets measured at fair value on a nonrecurring basis subsequent to initial recognition:
| December 31, 2009 |
Significant Unobservable Inputs (Level 3) |
Total Loss |
||||||||
| Assets |
||||||||||
| Goodwill |
$ | 27,023 | $ | 27,023 | $ | (146,230 | ) | |||
| Intangibles |
18,467 | 18,467 | (2,400 | ) | ||||||
| Total |
$ | 45,490 | $ | 45,490 | $ | (148,630 | ) | |||
We review the carrying value of our assets measured at fair value on a nonrecurring basis when events and circumstances warrant. This review requires the comparison of the fair value of our assets to their respective carrying values. The fair value of our assets is determined based on valuation techniques using the best information that is available, and may include quoted market prices, market comparables, and discounted cash flow projections. An impairment charge is recorded whenever a decline in fair value below the carrying value is determined to be other than temporary.
Goodwill and Intangibles
Goodwill and intangible assets may become impaired as a result of declines in profitability due to changes in volume, pricing or costs. Fair value is determined using a combination of two valuation approaches: the market approach and the income approach. As of December 31, 2009, the carrying value of our goodwill was $27.0 million, and the carrying value of our intangibles was $18.5 million. These values reflect adjustments to fair value made as of June 30, 2009 as a result of our annual impairment analysis. Refer to Note 2 for further information on the valuation process of our goodwill and intangibles.
Long-term indebtedness
The fair value of our 9% Senior Subordinated Notes (“9% Notes”), our Senior Floating Rate Notes (“2012 Notes”), our 10% Senior Notes (“2013 Senior Notes”) and our 11.75% Senior Subordinated PIK Notes (“2013 PIK Notes”) were based on quoted market prices. As of December 31, 2009, the carrying value of our 9% Notes was $16.0 million with a fair value of $14.0 million. As of December 31, 2009, the carrying value of our 2012 Notes was $0.5 million with a fair value of $0.4 million. As of December 31, 2009, the carrying value of our 2013 Senior Notes was $134.5 million with a fair value of $118.4 million. As of December 31, 2009, the carrying value of our 2013 PIK Notes was $81.2 million with a fair value of $64.2 million. Our asset-based loan facility (the “ABL Facility”) is variable rate debt and approximates fair value.
The carrying amounts reported in the accompanying balance sheets for cash and cash equivalents, accounts receivable, and accounts payable approximate fair value because of the immediate or short-term maturities of these financial instruments.
F-19
Table of Contents
Quality Distribution, Inc. and Subsidiaries
Notes to Consolidated Financial Statements—(Continued)
For the Years Ended December 31, 2009, 2008 and 2007
4. (LOSS) INCOME PER COMMON SHARE
A reconciliation of the numerators and denominators of the basic and diluted (loss) earnings from continuing operations to (loss) earnings per share computations follows (in thousands except per share amounts):
| December 31, 2009 | December 31, 2008 | December 31, 2007 | ||||||||||||||||||||||||||
| Loss from continuing operations (numerator) |
Shares (denominator) |
Per- share amount |
Earnings from continuing operations (numerator) |
Shares (denominator) |
Per- share amount |
Loss from continuing operations (numerator) |
Shares (denominator) |
Per- share amount |
||||||||||||||||||||
| Basic (loss) earnings available to common shareholders: |
||||||||||||||||||||||||||||
| Net (loss) earnings from continuing operations |
$ | (180,534 | ) | $ | 12,112 | $ | (7,563 | ) | ||||||||||||||||||||
| Dividends and accretion on preferred stock and minority stock dividends |
— | — | — | |||||||||||||||||||||||||
| (Loss) earnings |
(180,534 | ) | 19,449 | $ | (9.28 | ) | 12,112 | 19,379 | $ | 0.63 | (7,563 | ) | 19,336 | $ | (0.39 | ) | ||||||||||||
| Effect of dilutive securities: |
||||||||||||||||||||||||||||
| Stock options |
— | 8 | — | |||||||||||||||||||||||||
| Unvested restricted stock |
— | 152 | — | |||||||||||||||||||||||||
| Stock units |
— | — | — | |||||||||||||||||||||||||
| Stock warrants |
— | — | — | |||||||||||||||||||||||||
| Diluted (loss) earnings available to common shareholders: |
||||||||||||||||||||||||||||
| (Loss) earnings |
$ | (180,534 | ) | 19,449 | $ | (9.28 | ) | $ | 12,112 | 19,539 | $ | 0.62 | $ | (7,563 | ) | 19,336 | $ | (0.39 | ) | |||||||||
The effect of our stock options, restricted stock and stock warrants which represent the shares shown in the table above are included in the computation of diluted earnings per share for each year. There is no effect of our stock options, restricted stock and stock warrants in the computation of diluted earnings per share for the year ended December 31, 2009 due to a net loss in the period.
The following securities were not included in the calculation of diluted EPS because such inclusion would be anti-dilutive (in thousands):
| For the years ended December 31, | ||||||
| 2009 | 2008 | 2007 | ||||
| Stock options |
2,171 | 1,917 | 2,790 | |||
| Restricted stock |
610 | — | 125 | |||
| Warrants |
1,747 | — | — | |||
F-20
Table of Contents
Quality Distribution, Inc. and Subsidiaries
Notes to Consolidated Financial Statements—(Continued)
For the Years Ended December 31, 2009, 2008 and 2007
5. ACQUISITIONS AND DISPOSITIONS
During 2009, we did not complete any asset or other acquisitions of businesses or affiliates.
On October 10, 2009, we sold substantially all of the operating assets of our tank wash subsidiary, QSI, for $13.0 million, of which $10.0 million was paid in cash and the remaining $3.0 million in a subordinated note. The subordinated note is a five year non-amortizing note which matures on December 31, 2014. The principal is payable in a lump sum at maturity. Interest is payable quarterly at 7% per annum commencing December 31, 2009. In connection with the sale, QSI entered into various agreements with the purchaser, which is not affiliated with us, including long-term leases of real estate used in the tank wash business and various operating agreements. The assets sold had a net book value of $4.9 million which included $4.3 million of equipment, $0.4 million of inventory, and $0.2 million of intangibles. The sold QSI business generated approximately $19.5 million of revenue in 2009 from tank wash and related operations. Following the sale of the QSI business, we have purchased tank wash services (which were previously provided by QSI) from the acquirer of QSI’s tank wash assets and we expect to continue to do so in the future. Since we expect these continuing cash outflows to be significant, the sold QSI business does not qualify as a discontinued operation under FASB guidance. Therefore, we recorded a pre-tax gain in the fourth quarter of $7.1 million as part of our operating income.
During 2008, we purchased assets of two transportation companies and the assets of an affiliate for $2.1 million, in the aggregate, of which $1.4 million was paid in cash at closing and the remaining $0.7 million is payable over future periods. Of the total $2.1 million, we allocated $1.0 million to property and equipment, $0.9 million to goodwill, and $0.2 million to other intangible assets such as non-compete agreements.
6. SELECTED QUARTERLY FINANCIAL DATA (Unaudited) (In thousands, except per share data)
| Quarter Ended | ||||||||||||||
| March 31 | June 30 | September 30 | December 31 | |||||||||||
| 2009 |
||||||||||||||
| Operating revenues |
$ | 149,732 | $ | 149,786 | $ | 162,805 | $ | 151,286 | ||||||
| Operating income (loss) |
5,993 | (143,231 | ) | 7,896 | 14,166 | |||||||||
| Net (loss) income |
(302 | ) | (186,227 | ) | 1,426 | 4,569 | ||||||||
| (Loss) income per share—basic |
(0.02 | ) | (9.58 | ) | 0.07 | 0.23 | ||||||||
| (Loss) income per share—diluted |
(0.02 | ) | (9.58 | ) | 0.07 | 0.21 | ||||||||
| 2008 |
||||||||||||||
| Operating revenues |
$ | 208,501 | $ | 223,962 | $ | 214,741 | $ | 168,086 | ||||||
| Operating income |
5,797 | 9,576 | 9,763 | 7,842 | ||||||||||
| Net (loss) income |
(1,919 | ) | 352 | 717 | 12,962 | |||||||||
| (Loss) income per share—basic |
(0.10 | ) | 0.02 | 0.04 | 0.67 | |||||||||
| (Loss) income per share—diluted |
(0.10 | ) | 0.02 | 0.04 | 0.66 | |||||||||
In 2009, we recognized $3.5 million in restructuring costs. Results for the second quarter of 2009 include an impairment charge of $148.6 million related to goodwill and intangible assets. Results for the fourth quarter of 2009 include a $7.1 million gain on sale of tank wash assets, $1.2 million gain on extinguishment of debt and $2.3 million of refinancing costs.
In 2008, we recognized $5.3 million in restructuring costs. Results for the fourth quarter of 2008 include $16.5 million of gain on extinguishment of debt and $0.3 million write-off of debt issuance costs due to the repurchase of our 9% Notes. In addition, results for the fourth quarter in 2008 include a gain of $3.4 million related to the reduction of an acquired pension liability.
F-21
Table of Contents
Quality Distribution, Inc. and Subsidiaries
Notes to Consolidated Financial Statements—(Continued)
For the Years Ended December 31, 2009, 2008 and 2007
7. RESTRUCTURING
We account for restructuring costs associated with one-time termination benefits, costs associated with lease and contract terminations and other related exit activities in accordance with FASB guidance. We have made estimates of the costs to be incurred as part of our restructuring plan. During the quarter ended June 30, 2008, we committed to a plan of restructure resulting in the termination of non-driver positions and the consolidation, closure or affiliation of underperforming company terminals. We continued our plan of restructure throughout 2008 which resulted in a restructuring charge of $5.3 million of which the majority related to our trucking segment. As of December 31, 2008, approximately $0.8 million was accrued related to the restructuring charges, which was paid during 2009.
In the year ended December 31, 2008, we had the following activity in our restructuring accruals (in thousands):
| Balance at December 31, 2007 |
Additions | Payments | Reductions | Balance at December 31, 2008 | |||||||||||||
| Restructuring costs |
$ | — | $ | 5,325 | $ | (3,909 | ) | $ | (630 | ) | $ | 786 | |||||
Our restructuring plan continued in 2009 and resulted in charges of $3.5 million of which the majority related to our trucking segment. At December 31, 2009, $1.1 million was accrued related to the restructuring charges, which are expected to be paid through 2010.
In the year ended December 31, 2009, we had the following activity in our restructuring accruals (in thousands):
| Balance at December 31, 2008 |
Additions | Payments | Reductions | Balance at December 31, 2009 | ||||||||||||
| Restructuring costs |
$ | 786 | $ | 3,496 | $ | (3,219 | ) | $ | — | $ | 1,063 | |||||
The charges in 2008 and 2009 related to employee termination benefits and other related exit activities, and included the termination of approximately 350 non-driver positions. We expect to conclude our restructuring plan in 2010 and to take additional related charges during the year.
8. SEGMENT REPORTING
Reportable Segments
We have two reportable business segments for financial reporting purposes that are distinguished primarily on the basis of services offered:
| • | Trucking, which consists of truckload transportation of bulk chemicals; and |
| • | Container Services, specifically International Organization for Standardization, or ISO tank container transportation and depot services. |
Segment revenues and operating income include the allocation of fuel surcharge to the trucking and container services segments. The operating income reported in our segments excludes amounts reported in Other operating income, such as gains and losses on disposal of property and equipment, restructuring costs, impairment charge, corporate and other unallocated amounts. Corporate and unallocated amounts include
F-22
Table of Contents
Quality Distribution, Inc. and Subsidiaries
Notes to Consolidated Financial Statements—(Continued)
For the Years Ended December 31, 2009, 2008 and 2007
depreciation and amortization and other gains and losses. Although these amounts are excluded from the business segment results, they are included in reported consolidated earnings. Included in Other revenue are revenues from our tank wash services and other value-added services. We have not provided specific asset information by segment, as it is not regularly provided to our chief operating decision maker for review.
Summarized segment data and a reconciliation to (loss) income before income taxes for the years ended December 31 (in thousands):
| 2009 | 2008 | 2007 | ||||||||||
| Operating revenues: |
||||||||||||
| Trucking |
$ | 460,390 | $ | 653,618 | $ | 666,199 | ||||||
| Container Services |
79,499 | 89,715 | 12,168 | |||||||||
| Other revenue |
73,720 | 71,957 | 73,191 | |||||||||
| Total |
613,609 | 815,290 | 751,558 | |||||||||
| Operating income: |
||||||||||||
| Trucking |
35,217 | 41,291 | 37,421 | |||||||||
| Container Services |
11,287 | 10,934 | (93 | ) | ||||||||
| Other operating income |
3,984 | 3,988 | 5,028 | |||||||||
| Total segment operating income |
50,488 | 56,213 | 42,356 | |||||||||
| Depreciation and amortization expense |
20,218 | 21,002 | 17,544 | |||||||||
| Impairment charge(1) |
148,630 | — | — | |||||||||
| Other (income) expense |
(3,184 | ) | 2,233 | 959 | ||||||||
| Total |
(115,176 | ) | 32,978 | 23,853 | ||||||||
| Interest expense |
28,335 | 35,545 | 31,342 | |||||||||
| Interest income |
(288 | ) | (426 | ) | (818 | ) | ||||||
| Other expense (income) |
62 | (19,193 | ) | 2,971 | ||||||||
| (Loss) Income before income taxes |
$ | (143,285 | ) | $ | 17,052 | $ | (9,642 | ) | ||||
| (1) | Includes an impairment charge of $144.3 million related to our trucking segment and an impairment charge of $4.3 million related to our container services segment. |
F-23
Table of Contents
Quality Distribution, Inc. and Subsidiaries
Notes to Consolidated Financial Statements—(Continued)
For the Years Ended December 31, 2009, 2008 and 2007
9. GEOGRAPHIC SEGMENTS
Our operations are located primarily in the United States, Canada, and Mexico. Inter-area sales are not significant to the total revenue of any geographic area. Information about our operations in different geographic areas for the years ended December 31 is as follows (in thousands):
| 2009 | |||||||||||
| U.S. | International | Consolidated | |||||||||
| Total operating revenues |
$ | 576,405 | $ | 37,204 | $ | 613,609 | |||||
| Operating (loss) income |
(119,288 | ) | 4,112 | (115,176 | ) | ||||||
| Long-term identifiable assets(1) |
137,807 | 7,989 | 145,796 | ||||||||
| 2008 | |||||||||||
| U.S. | International | Consolidated | |||||||||
| Total operating revenues |
$ | 763,155 | $ | 52,135 | $ | 815,290 | |||||
| Operating income |
28,043 | 4,935 | 32,978 | ||||||||
| Long-term identifiable assets(1) |
164,068 | 7,322 | 171,390 | ||||||||
| 2007 | |||||||||||
| U.S. | International | Consolidated | |||||||||
| Total operating revenues |
$ | 698,797 | $ | 52,761 | $ | 751,558 | |||||
| Operating income |
17,415 | 6,438 | 23,853 | ||||||||
| Long-term identifiable assets(1) |
138,827 | 7,332 | 146,159 | ||||||||
| (1) | includes property and equipment and intangible assets. |
10. ACCOUNTS RECEIVABLE
Accounts receivable consisted of the following at December 31 (in thousands):
| 2009 | 2008 | |||||||
| Trade accounts receivable |
$ | 64,810 | $ | 76,871 | ||||
| Affiliate and independent owner-operator receivables |
5,401 | 4,981 | ||||||
| Other receivables |
1,218 | 2,698 | ||||||
| 71,429 | 84,550 | |||||||
| Less allowance for doubtful accounts |
(1,804 | ) | (2,938 | ) | ||||
| $ | 69,625 | $ | 81,612 | |||||
The activity in the allowance for doubtful accounts for the years ended December 31 is as follows (in thousands):
| 2009 | 2008 | |||||||
| Balance, beginning of period |
$ | 2,938 | $ | 3,454 | ||||
| Adjustment to bad debt expense |
1,838 | 1,086 | ||||||
| Write-offs, net of recoveries |
(2,972 | ) | (1,602 | ) | ||||
| Balance, end of period |
$ | 1,804 | $ | 2,938 | ||||
F-24
Table of Contents
Quality Distribution, Inc. and Subsidiaries
Notes to Consolidated Financial Statements—(Continued)
For the Years Ended December 31, 2009, 2008 and 2007
11. PROPERTY AND EQUIPMENT
Property and equipment consisted of the following at December 31 (in thousands):
| 2009 | 2008 | |||||||
| Land and improvements |
$ | 12,041 | $ | 12,041 | ||||
| Buildings and improvements |
21,642 | 27,248 | ||||||
| Revenue equipment |
247,110 | 266,482 | ||||||
| Other equipment |
29,739 | 53,377 | ||||||
| Total property and equipment |
310,532 | 359,148 | ||||||
| Accumulated depreciation |
(183,203 | ) | (210,456 | ) | ||||
| Property and equipment, net |
$ | 127,329 | $ | 148,692 | ||||
From time to time, we identify real properties that are not needed in our current operations and such properties are sold. During 2008, we sold four properties with a net book value of approximately $0.7 million for which we recognized a $2.2 million gain.
Depreciation expense was $18.6 million, $19.3 million and $17.2 million for the years ending December 31, 2009, 2008 and 2007, respectively. At December 31, 2009 and 2008, we had $23.5 million and $26.5 million of capitalized cost and $6.1 million and $4.0 million of accumulated depreciation of equipment under capital leases, respectively, included in revenue equipment in the above schedule.
12. GOODWILL AND INTANGIBLE ASSETS
Goodwill
Under the FASB guidance, goodwill and intangible assets are subject to an annual impairment test as well as impairment assessments of certain triggering events. We evaluate goodwill for impairment by determining the fair value based on criteria in the FASB guidance for each reporting unit, our trucking segment and our container services segment. These reporting units contain goodwill and other identifiable intangible assets as a result of previous business acquisitions. Our annual impairment test is performed during the second quarter with a measurement date of June 30th. The methodology applied in the analysis performed this current fiscal year at June 30, 2009 was consistent with the methodology applied in prior years, but was based on updated assumptions, as appropriate. As a result of our analysis we concluded a total impairment charge to goodwill of $146.2 million was necessary at June 30, 2009, of which $144.3 million was related to our trucking segment, eliminating 100% of the carrying amount of goodwill of that segment, and $1.9 million was related to our container services segment. We continued to evaluate indicators of impairment quarterly following our annual goodwill impairment test at June 30, 2009 through year end 2009, including the quarter ended December 31, 2009. There were no indications that a triggering event had occurred for the remainder of the year ended December 31, 2009. As of December 31, 2009, we had total goodwill of $27.0 million, all of which relates to our container services segment.
We have evaluated at least quarterly whether indicators of impairment in accordance with applicable guidance. Prior to our June 30, 2009 analysis, we did not believe that factors attributable to the economic downturn would impact the recoverability of our goodwill. Our performance since the prior period’s goodwill impairment test at June 30, 2008 through year end 2008 trended positive and there were no indications from our quarterly reviews that a triggering event had occurred. The first quarter of 2009 showed improved operating income year over year and strong operating cash flow; however, due to the continuing economic downturn, we
F-25
Table of Contents
Quality Distribution, Inc. and Subsidiaries
Notes to Consolidated Financial Statements—(Continued)
For the Years Ended December 31, 2009, 2008 and 2007
reviewed not only our market capitalization, but also performed a discounted cash flow analysis based on assumptions adjusted to reflect the current economic environment and which we believed to be appropriate at the time. The conclusions from our extended analysis at March 31, 2009 did not indicate a trend in operating results that would foretell of impairment to our goodwill. For our June 30, 2009 analysis, we adjusted further our assumptions used, such as growth and discount rates, in the annual impairment test to reflect the persistence of the downward economic trend.
As the result of the impairment charge, we determined that we were in a cumulative loss position. Based on this negative evidence we concluded that it was no longer more likely than not that our net deferred tax asset was realizable. For purposes of assessing realizability of the deferred tax assets, this cumulative financial reporting loss position is considered significant negative evidence we will not be able to fully realize the deferred tax assets in the future. As a result, a $41.2 million deferred tax valuation allowance was recorded. Our judgments regarding future taxable income may change due to changes in market conditions, changes in tax laws, operating results or other factors. If any of these factors and related estimates change in the future, it may increase or decrease the valuation allowance and related income tax expense in the same period
Under the FASB guidance, the process of evaluating the potential impairment of goodwill requires significant judgment at many points during the analysis and involves a two-step process. In the first step, we determine whether there is an indication of impairment by comparing the fair value of a reporting unit to its carrying amount, including goodwill. If, based on the first step, we determine that there is an indication of goodwill impairment, the Company will measure any identified goodwill impairment in accordance with the FASB guidance.
In the first step, we determine the fair value for our reporting units using a combination of two valuation approaches: the market approach and the income approach. The market approach uses a guideline company methodology which is based upon a comparison of us to similar publicly-traded companies within our industry. We derive a market value of invested capital or business enterprise value for each comparable company by multiplying the price per share of common stock of the publicly traded companies by their total common shares outstanding and adding each company’s current level of debt. We calculate a business enterprise multiple based on revenue and earnings from each company then apply those multiples to each reporting unit’s revenue and earnings to conclude a reporting unit business enterprise value. Assumptions regarding the selection of comparable companies are made based on, among other factors, capital structure, operating environment and industry. As the comparable companies were typically larger and more diversified than our reporting units, multiples were adjusted prior to application to our reporting units’ revenues and earnings to reflect differences in margins, long-term growth prospects and market capitalization.
The income approach uses a discounted debt-free cash flow analysis to measure fair value by estimating the present value of future economic benefits. To perform the discounted debt-free cash flow analysis, we develop a pro forma analysis of each reporting unit to estimate future available debt-free cash flow and discounting estimated debt-free cash flow by an estimated industry weighted average cost of capital based on the same comparable companies used in the market approach. Per the FASB guidance, the weighted average cost of capital is based on inputs (e.g., capital structure, risk, etc.) from a market participant’s perspective and not necessarily from the reporting unit or QDI’s perspective. Future cash flow is projected based on assumptions for our economic growth, industry expansion, future operations and the discount rate, all of which require significant judgments by management.
F-26
Table of Contents
Quality Distribution, Inc. and Subsidiaries
Notes to Consolidated Financial Statements—(Continued)
For the Years Ended December 31, 2009, 2008 and 2007
As of December 31, 2008 and 2007 the goodwill balance was $173.5 million and $173.6 million, respectively. The allocation of goodwill changed from 2007 to 2008 due to the requirement to report segment operating results because of our December 2007 acquisition of Boasso, which created two reportable business segments for financial reporting purposes specifically, trucking and container services. Per FASB guidance, when an entity reorganizes its reporting structure, goodwill shall be reassigned to reporting units affected using a relative fair value allocation approach. Based on the relative fair values of the reporting units, goodwill of $3.9 million and $1.1 million was reallocated from Other and Container Services, respectively, to the Trucking segment.
Pursuant to the Stock Purchase Agreement between our company and Boasso America Corporation, and based on an evaluation of the net working capital as of the date of the acquisition, approximately $1.3 million of the purchase price was refunded to us in cash. Additionally during fiscal 2008, $0.3 million of additional liabilities were recorded with a corresponding increase in goodwill. Therefore, the goodwill in fiscal 2008 was reduced by a net $1.0 million related to these purchase price adjustments. The goodwill in fiscal 2009 was reduced by $0.3 million due to a final purchase price adjustment.
Goodwill by segment and the related changes for each segment for 2008 were as follows (in thousands):
| 2007 | Acquisitions | Purchase Price Adjustments |
Reallocation | 2008 | |||||||||||||
| Trucking |
$ | 138.4 | $ | 0.9 | — | $ | 5.0 | $ | 144.3 | ||||||||
| Container services |
31.3 | — | (1.0 | ) | (1.1 | ) | 29.2 | ||||||||||
| Other revenue |
3.9 | — | — | (3.9 | ) | — | |||||||||||
| $ | 173.6 | $ | 0.9 | $ | (1.0 | ) | $ | — | $ | 173.5 | |||||||
Goodwill by segment and the related changes by segment for 2009 were as follows (in thousands):
| 2008 | Impairment | Purchase Price Adjustments |
2009 | |||||||||||
| Trucking |
$ | 144.3 | $ | (144.3 | ) | — | $ | — | ||||||
| Container services |
29.2 | (1.9 | ) | (0.3 | ) | 27.0 | ||||||||
| Other revenue |
— | — | — | — | ||||||||||
| $ | 173.5 | $ | (146.2 | ) | $ | (0.3 | ) | $ | 27.0 | |||||
Intangible Assets
Intangible assets at December 31, 2009 are as follows (in thousands):
| Gross value |
Accumulated amortization |
Impairment Charge |
Sold to third party |
Net book value |
Average lives (in years) | |||||||||||||||
| Tradename |
$ | 9,800 | $ | — | $ | (2,400 | ) | $ | — | $ | 7,400 | Indefinite | ||||||||
| Customer relationships |
11,998 | (2,031 | ) | — | (51 | ) | 9,916 | 12 | ||||||||||||
| Non-compete agreements |
3,053 | (1,768 | ) | — | (134 | ) | 1,151 | 3 – 5 | ||||||||||||
| $ | 24,851 | $ | (3,799 | ) | $ | (2,400 | ) | $ | (185 | ) | $ | 18,467 | ||||||||
F-27
Table of Contents
Quality Distribution, Inc. and Subsidiaries
Notes to Consolidated Financial Statements—(Continued)
For the Years Ended December 31, 2009, 2008 and 2007
Amortization expense for the years ended December 31, 2009, 2008, and 2007 was $1.6 million, $1.7 million and $0.3 million, respectively. Estimated amortization expense for intangible assets are as follows (in thousands):
| 2010 |
$ | 1,543 | |
| 2011 |
1,369 | ||
| 2012 |
1,205 | ||
| 2013 |
996 | ||
| 2014 and after |
5,954 |
13. ACCOUNTS PAYABLE AND ACCRUED EXPENSES
Accounts payable includes $0.1 million and $7.9 million of book overdrafts at December 31, 2009 and 2008, respectively.
Accrued expenses include the following at December 31 (in thousands):
| 2009 | 2008 | |||||
| Salaries, wages and benefits |
$ | 5,505 | $ | 7,215 | ||
| Accrued interest |
4,679 | 4,375 | ||||
| Claims and deposits |
3,747 | 4,917 | ||||
| Taxes |
1,435 | 1,671 | ||||
| Other |
6,012 | 7,179 | ||||
| $ | 21,378 | $ | 25,357 | |||
14. LONG-TERM INDEBTEDNESS
Long-term debt consisted of the following at December 31 (in thousands):
| 2009 | 2008 | |||||||
| Capital lease obligations |
$ | 17,165 | $ | 23,816 | ||||
| ABL Facility |
68,000 | 87,000 | ||||||
| Senior Floating Rate Notes due 2012 |
501 | 135,000 | ||||||
| 9% Senior Subordinated Notes due 2010 |
16,031 | 100,761 | ||||||
| 10% Senior Notes due 2013 |
134,499 | — | ||||||
| 11.75% Senior Subordinated PIK Notes due 2013 |
81,211 | — | ||||||
| Boasso Note |
— | 2,500 | ||||||
| Other Notes |
12,560 | 16,855 | ||||||
| Long-term debt, including current maturities |
329,967 | 365,932 | ||||||
| Discount on Senior Floating Rate Notes |
(8,683 | ) | (3,346 | ) | ||||
| 321,284 | 362,586 | |||||||
| Less current maturities of long-term debt (including capital lease obligations) |
(25,188 | ) | (16,355 | ) | ||||
| Long-term debt, less current maturities |
$ | 296,096 | $ | 346,231 | ||||
F-28
Table of Contents
Quality Distribution, Inc. and Subsidiaries
Notes to Consolidated Financial Statements—(Continued)
For the Years Ended December 31, 2009, 2008 and 2007
Our principal debt sources at December 31, 2009 comprise $16.0 million aggregate principal amount of 9% Senior Subordinated Notes due 2010 (the “9% Notes”), $0.5 million principal amount of our Senior Floating Rate Notes due 2012 (the “2012 Notes”), $134.5 million aggregate principal amount of 10% Senior Notes due 2013 (the “2013 Senior Notes”), $81.2 million aggregate principal amount of 11.75% Senior Subordinated PIK Notes due 2013 (“2013 PIK Notes”) and a $225 million asset-based loan facility (the “ABL Facility”).
The ABL Facility
The ABL Facility which was effective December 18, 2007, consists of a current asset-based revolving facility in an amount of $200.0 million (the “current asset tranche”) and a fixed asset-based revolving facility in an amount of $25.0 million (the “fixed asset tranche”). The total commitments under the fixed asset tranche will be reduced and the total commitments under the current asset tranche correspondingly increased by $5.0 million on December 18, 2010. Borrowings of revolving loans under the ABL Facility are allocated pro rata to the current asset tranche and the fixed asset tranche based on the then-current asset borrowing base and the then-current fixed asset borrowing base. The ABL Facility matures June 18, 2013. The maturity date of the ABL Facility may be accelerated if we default on our obligations under the ABL Facility.
The ABL Facility includes borrowing capacity of up to $150.0 million for letters of credit, which are allocated pro rata between the two tranches based on the then-current borrowing base for each tranche (or, if the credit extensions under the fixed asset tranche are repaid and the commitments there under are terminated prior to the termination of the ABL Facility, to the current asset tranche), and up to $10.0 million for swingline borrowings on same-day notice, which are allocated under the current asset tranche. The proceeds of the ABL Facility were used, together with the proceeds from an additional private offering of $50 million of Senior Floating Rate Notes (described below under “Senior Floating Rate Notes”), to finance a portion of the Boasso acquisition. The ABL Facility contains a fixed charge coverage ratio of 1.0 to 1.0 which only needs to be met if borrowing availability is less than $20 million. At December 31, 2009, we had $44.7 million of borrowing availability under the ABL Facility.
Borrowings under the ABL Facility bear interest at a rate equal to an applicable margin plus, at our option, either a base rate or LIBOR. The applicable margin for borrowings under the current asset tranche at December 31, 2009 was 1.00% with respect to base rate borrowings and 2.00% with respect to LIBOR borrowings. The applicable margin for borrowings under the fixed asset tranche at December 31, 2009 was 1.25% with respect to base rate borrowings and 2.25% with respect to LIBOR borrowings. The applicable margin for such borrowings will be reduced or increased based on the aggregate borrowing base availability under the ABL Facility over the life of the ABL Facility. The base rate for the ABL Facility is the higher of the prime rate and the federal funds overnight rate plus 0.50%. We are also required to pay a fee for utilized commitments under the ABL Facility at a rate equal to 0.25% per annum. The ABL Facility is required to be prepaid only to the extent that the aggregate amount of outstanding borrowings, unreimbursed letter of credit drawings and undrawn letters of credit under the relevant tranche exceeds the lesser of the applicable commitments and the applicable borrowing base in effect at such time for such tranche. The borrowing base for the current asset tranche consists of eligible accounts receivable, eligible inventory and eligible truck and trailer fleet, and the borrowing base for the fixed asset tranche consists of eligible real property and certain eligible equipment. We may voluntarily repay outstanding loans under the ABL Facility at any time without premium or penalty, other than customary “breakage” costs with respect to LIBOR loans. The interest rate on the ABL Facility at December 31, 2009 and 2008 was 2.4% and 3.3%, respectively. The weighted average interest rate during fiscal year 2009 was 2.4%. All obligations under the ABL Facility are guaranteed by QDI and each of our wholly-owned domestic restricted subsidiaries (other than our immaterial subsidiaries). Obligations under the current
F-29
Table of Contents
Quality Distribution, Inc. and Subsidiaries
Notes to Consolidated Financial Statements—(Continued)
For the Years Ended December 31, 2009, 2008 and 2007
asset tranche, and the guarantees of those obligations (as well as cash management obligations and any interest hedging or other swap agreements), are secured by a first priority lien on certain assets of QD LLC and the guarantors, including eligible accounts, eligible inventory and eligible truck and trailer fleet (“current asset tranche priority collateral”) and a second priority lien on all other assets of QD LLC and the guarantors, including eligible real property and certain eligible equipment (“fixed asset tranche priority collateral”). Obligations under the fixed asset tranche, and the guarantees of those obligations, are secured by a first-priority lien on fixed asset tranche priority collateral and a second priority lien on current asset tranche priority collateral.
We incurred $6.9 million in debt issuance costs relating to the ABL Facility. We are amortizing these costs over the term of the ABL Facility.
9% Senior Subordinated Notes Due 2010
On September 30, 2003, we issued $125.0 million aggregate principal amount of our 9% Notes. During the fourth quarter of 2008 and the first quarter of 2009, we repurchased $25.2 million in principal amount of the 9% Notes. On October 15, 2009, we completed exchange and tender offers to exchange approximately $80.7 million of our 9% Notes for $80.7 million aggregate principal amount of our new 2013 PIK Notes and approximately 1.75 million warrants and retired an additional $2.9 million of our 9% Notes for $1.8 million in cash. Upon the completion of the exchange and tender offer, we also amended the 9% Notes to eliminate or waive substantially all of the restrictive covenants, to eliminate certain events of default, to modify covenants regarding mergers and consolidations and modify or eliminate certain other provisions contained in the indentures governing the 9% Notes. As of December 31, 2009, approximately $16.0 million total principal amount of the 9% Notes remained outstanding.
The 9% Notes are the unsecured and senior subordinated obligations of QD LLC and QD Capital and are fully and unconditionally guaranteed on an unsecured and senior subordinated basis, jointly and severally, by QDI and certain of its U.S. restricted subsidiaries. We have the right to redeem the 9% Notes in whole or in part from time to time at 100% of the principal amount plus accrued and unpaid interest if any, to the date of redemption. The 9% Notes will mature on November 15, 2010. Interest on the 9% Notes is payable at the rate of 9% per annum and is payable semi-annually in cash on each May 15 and November 15.
We incurred $5.5 million in debt issuance costs relating to the issuance of the 9% Notes. During 2008 and 2009, we wrote-off approximately $0.3 million in debt issuance costs relating to repurchases of 9% Notes. Additionally $0.5 million of unamortized debt issuance costs relating to the 9% Notes are included in debt issuance costs related to the 2013 PIK Notes following their exchange for the 9% Notes. We are amortizing the remaining $0.1 million of debt issuance costs over the remaining term of the 9% Notes.
Senior Floating Rate Notes Due 2012
On January 28, 2005, we issued $85.0 million aggregate principal amount of our 2012 Notes. On December 18, 2007, we issued a second series of 2012 Notes in the original principal amount of $50.0 million. On October 15, 2009, we completed exchange and tender offers to exchange approximately $134.5 million of 2012 Notes for $134.5 million of our 2013 Senior Notes. Upon the completion of the exchange offer, we amended the 2012 Notes to eliminate or waive substantially all of the restrictive covenants, to eliminate certain events of default, to modify covenants regarding mergers and consolidations and modify or eliminate certain other provisions contained in the indentures governing the 2012 Notes. As of December 31, 2009, approximately $0.5 million total principal amount of the 2012 Notes remained outstanding.
F-30
Table of Contents
Quality Distribution, Inc. and Subsidiaries
Notes to Consolidated Financial Statements—(Continued)
For the Years Ended December 31, 2009, 2008 and 2007
The 2012 Notes are the unsecured and unsubordinated obligations of QD LLC and QD Capital and are fully and unconditionally guaranteed on an unsecured and unsubordinated basis, jointly and severally, by QDI and certain of its U.S. restricted subsidiaries. We may redeem all or any portion of the 2012 Notes upon not less than 30, nor more than 60, days’ notice at 100% of the principal amount plus accrued and unpaid interest if any, to the date of redemption. The 2012 Notes will mature on January 15, 2012. Interest on the 2012 Notes is payable quarterly in cash in arrears on each January 15, April 15, July 15 and October 15. The interest rate on the 2012 Notes at December 31, 2009 and 2008 was 4.8% and 9.3%, respectively. The weighted average interest rate during fiscal year 2009 and 2008 was 5.3% and 8.4%, respectively.
We incurred $2.5 million in debt issuance costs relating to the initial $85.0 million of the 2012 Notes and $2.3 million related to the second $50.0 million of the 2012 Notes. All of these unamortized debt issuance costs are included in debt issuance costs related to the 2013 Senior Notes in connection with the exchange offer.
10% Senior Notes Due 2013
On October 15, 2009, we issued approximately $134.5 million aggregate principal amount of our 2013 Senior Notes. The 2013 Senior Notes are the unsecured and unsubordinated obligations of QD LLC and QD Capital and are fully and unconditionally guaranteed on an unsecured and unsubordinated basis, jointly and severally, by QDI and certain of our U.S. restricted subsidiaries.
In connection with the issuance of the 2013 Senior Notes, we have agreed pursuant to a registration rights agreement to file a registration statement, relating to an offer to exchange the 2013 Senior Notes for new debt securities which are substantially identical in all material respects, by February 12, 2010, and to use our commercially reasonable efforts to cause the registration statement to be declared effective by the SEC by April 13, 2010. The registration statement was filed pursuant to these obligations on December 18, 2009. If the registration statement is not declared effective by the SEC by April 13, 2010 or if we do not consummate the exchange offer by May 23, 2010, we will be required to pay additional interest.
Interest on the 2013 Senior Notes is payable at a rate of 10% per annum, semiannually on June 1 and December 1 of each year, commencing on June 1, 2010. The 2013 Senior Notes mature on June 1, 2013.
We may redeem the 2013 Senior Notes, in whole or part, at any time at a price equal to 100% of the principal amount of the 2013 Senior Notes redeemed plus accrued and unpaid interest to the redemption date. Subject to certain conditions, we are obligated to redeem $6.0 million of 2013 Senior Notes on each June 1 and December 1, commencing December 1, 2010. Beginning in 2011, promptly following the delivery of our Annual Report on Form 10-K for each fiscal year, the 2013 Senior Notes are subject to additional mandatory redemption in an amount equal to 50% of the excess cash flow we generate minus $12.0 million. Both required redemption amounts will be reduced to the extent necessary so that:
| • | the sum of borrowing availability under the ABL Facility, plus unrestricted cash and cash equivalents, is at least $37.5 million; |
| • | the minimum borrowing availability requirements under the ABL Facility are satisfied; |
| • | there is fixed charge coverage ratio of at least 1.0 to 1.0 as calculated under the ABL Facility; and |
| • | no other event of default is otherwise caused under the ABL Facility by the redemption. |
The required redemption amounts are also reduced by any optional redemptions and repurchases during the redemption period.
F-31
Table of Contents
Quality Distribution, Inc. and Subsidiaries
Notes to Consolidated Financial Statements—(Continued)
For the Years Ended December 31, 2009, 2008 and 2007
We recorded $3.6 million in debt issuance costs relating to the 2013 Senior Notes, of which $2.0 million of unamortized debt issuance costs related to the 2012 Notes and $1.6 million was related to the new issuance. We are amortizing these costs over the remaining term of the 2013 Senior Notes.
11.75% Senior Subordinated PIK Notes Due 2013
On October 15, 2009, we issued $80.7 million aggregate principal amount of our 2013 PIK Notes. The 2013 PIK Notes are the unsecured and senior subordinated obligations of QD LLC and QD Capital and are fully and unconditionally guaranteed on an unsecured and senior subordinated basis, jointly and severally, by QDI and certain of our U.S. restricted subsidiaries.
In connection with the issuance of the 2013 PIK Notes, we have agreed pursuant to registration rights agreements to file a registration statement, relating to an offer to exchange the 2013 PIK Notes for new debt securities which are substantially identical in all material respects, by February 12, 2010, and to use our commercially reasonable efforts to cause the registration statement to be declared effective by the SEC by April 13, 2010. The registration statement was filed pursuant to these obligations on December 18, 2009. If the registration statement is not declared effective by the SEC by April 13, 2010 or if we do not consummate the exchange offer by May 23, 2010, we will be required to pay additional interest.
Interest is payable on the 2013 PIK Notes at 11.75% per annum, payable 9% in cash and 2.75% in the form of additional 2013 PIK Notes, quarterly on February 1, May 1, August 1 and November 1 of each year, commencing on February 1, 2010.
The 2013 PIK Notes mature on November 1, 2013. We may redeem the 2013 PIK Notes, in whole or part, at any time prior to October 15, 2010, at a price equal to 100% of the principal amount of the 2013 PIK Notes redeemed plus accrued and unpaid interest to the redemption date plus an additional “make-whole premium.” After October 15, 2010, we may redeem the Subordinated Notes, in whole or part, at any time at a price equal to 100% of the principal amount of the Subordinated Notes redeemed plus accrued and unpaid interest to the redemption date. Additionally, at any time prior to October 15, 2010, we may redeem up to 35% of the principal amount of the 2013 PIK Notes at a redemption price equal to 11.75% of the face amount thereof with the net proceeds of one or more equity offerings so long as at least 65% of the aggregate original principal amount of the 2013 PIK Notes remains outstanding afterwards.
We recorded $1.5 million in debt issuance costs relating to the 2013 PIK Notes, of which $0.5 million of unamortized debt issuance costs related to the 9% Notes and $1.0 million was related to the new issuance. In addition, we recorded $6.7 million in note issuance discount due to the warrants issued. The amount represents the fair market value of the warrants at time of issuance. We are amortizing these costs over the remaining term of the 2013 PIK Notes.
Accounting Treatment of Note Exchanges and Redemption of Notes for Cash
Upon settlement of our offers to exchange our 9% Notes and 2012 Notes (the “Old Notes”) for our new 2013 PIK Notes and 2013 Senior Notes (collectively, “the 2013 Notes”) and warrants to purchase our common stock (collectively the “Exchange Offer”) and completion of a cash option payment of $1.8 million for validly tendered 9% Notes (the “Retail Tender Offer”), there were: (1) Old Notes that were exchanged for New Notes, (2) Old Notes that were extinguished as a result of the Retail Tender Offer, (3) Old Notes that were not exchanged or tendered, and (4) warrants that were issued in connection with the exchange of 9% Notes for 2013
F-32
Table of Contents
Quality Distribution, Inc. and Subsidiaries
Notes to Consolidated Financial Statements—(Continued)
For the Years Ended December 31, 2009, 2008 and 2007
PIK Notes (see Note 17). Respectively, all tenders described above were treated as a debt modification in accordance with applicable FASB guidance. We did not recognize a gain or loss on the modification since the exchanges were a par for par exchange.
1. Old Notes for which holders chose to exchange for New Notes
The issuance of the 2013 PIK Notes in exchange for 9% Notes and the issuance of the 2013 Senior Notes in exchange for 2012 Notes were each accounted for as a debt modification in accordance with applicable FASB guidance.
In accordance with FASB guidance, since the prepayment option (or any put or call feature) of the Old Notes is exercisable at any time, we assumed that the prepayment option was exercised immediately on the date the exchange offers were completed. Further, FASB guidance provides that if debt is callable or puttable and the exercise of the put or call would usually result in the smallest change in cash flows, then the issuance is presumed to be a modification. We have performed the cash flows analysis assuming exercise by the Company of the prepayment option on the amendment date which resulted in less than a 10% change in cash flows. Accordingly, we have accounted for the transaction as a debt modification. Since the exchange of the Old Notes for the New Notes was a par for par exchange, no gain or loss resulted for the settlement of that exchange.
Under applicable FASB guidance, costs incurred with the Exchange Offer are associated with the replacement or modified debt instrument and, along with any existing unamortized premium or discount, are amortized as an adjustment to interest expense over the remaining term of the replacement or modified debt instruments using the effective interest method. Therefore, the original pro-rata share of the deferred financing costs and original issue discounts related to the Old Notes that were exchanged in the Exchange Offer will remain with, and be amortized over the remaining terms of, the New Notes. The balance of deferred finance costs associated with the 2013 PIK Notes and the 2013 Senior Notes at December 31, 2009 was $1.4 million and $3.4 million, respectively. Any third party costs were expensed as incurred.
2. 9% Notes that were extinguished as a result of the Retail Tender Offer
Since the Retail Tender Offer provided cash consideration for the 9% Notes, the Retail Tender Offer was accounted for as an extinguishment of debt in accordance with FASB guidance. As such, the Company wrote off the value of any 9% Notes for which we paid cash consideration in accordance with the Retail Tender Offer. The Company paid $1.8 million in cash consideration for $2.9 million of the 9% Notes which resulted in a gain on extinguishment of $1.1 million. The pro-rata share of the deferred financing costs related to the extinguished debt was minimal and was written off. Any third party costs associated with the extinguishment, which were also minimal, were expensed as incured.
3. Costs associated with Remaining Old Notes
The remaining Old Notes will continue to be accounted for in the same manner prior to the Exchange Offer and the Retail Tender Offer. The original terms of the remaining balances did not change. The deferred financing costs associated with the remaining Old Notes continue to be amortized over the original term of the Old Notes. The balance of deferred finance costs associated with the 9% Notes and the 2012 Notes at December 31, 2009 was $0.1 million and $0.0 million, respectively.
F-33
Table of Contents
Quality Distribution, Inc. and Subsidiaries
Notes to Consolidated Financial Statements—(Continued)
For the Years Ended December 31, 2009, 2008 and 2007
Boasso Note
The Boasso Note was a $2.5 million 7% promissory note with a maturity on December 18, 2009 issued as part of the purchase price of the Boasso acquisition. The holder of the Boasso Note had the option to require prepayment of the Boasso note, which he exercised on December 18, 2008. The Boasso Note was paid in full in January 2009.
Collateral, Guarantees and Covenants
The ABL Facility contains a number of covenants that, among other things, restrict, subject to certain exceptions, our ability to (i) sell assets; (ii) incur additional indebtedness; (iii) prepay other indebtedness (including the 2013 Senior Notes, the 2012 Notes, the 2013 PIK Notes and the 9% Notes); (iv) repurchase or pay dividends on QDI’s common stock; (v) create liens on assets; (vi) make investments; (vii) make certain acquisitions; (viii) engage in mergers or consolidations; (ix) engage in certain transactions with affiliates; (x) amend certain charter documents and material agreements governing subordinated indebtedness, including the 2013 Senior Notes, the 2012 Notes, the 2013 PIK Notes and the 9% Notes; (xi) change the business conducted by us and our subsidiaries; and (xii) enter into agreements that restrict dividends from subsidiaries. The ABL Facility also contains certain customary events of default, which, if any of them occurs, may result in the principal, interest and any other monetary obligations under the ABL Facility becoming immediately payable.
The indentures governing our 2013 Senior Notes and our 2013 PIK Notes contain covenants that restrict, subject to certain exceptions, our ability to, among other things: (i) incur additional debt or issue certain preferred shares; (ii) pay dividends on or make other distributions in respect of QDI’s common stock or make other restricted payments; (iii) make certain investments; (iv) sell certain assets; (v) create or permit to exist dividend and/or payment restrictions affecting their restricted subsidiaries; (vi) create liens on certain assets to secure debt; (vii) consolidate, merge, sell or otherwise dispose of all or substantially all of their assets; (viii) enter into certain transactions with their affiliates; and (ix) designate their subsidiaries as unrestricted subsidiaries. The indentures also provide certain customary events of default, which, if any of them occurs, may result in the principal, interest and any other monetary obligations on the then outstanding 2013 Senior Notes and 2013 PIK Notes becoming payable immediately.
The payment obligations under the ABL Facility are senior secured obligations of QD LLC and QD Capital and are secured by certain assets and its subsidiaries. The payment obligations of QD LLC and QD Capital under the 9% Notes, the 2012 Notes, the 2013 Senior Notes and the 2013 PIK Notes are guaranteed by QDI, and by all of its domestic subsidiaries. The 9% Notes and the 2013 PIK Notes, and the guarantees thereof are senior subordinated unsecured obligations ranking junior in right of payment to all of our existing and future senior debt, and all liabilities of our subsidiaries that do not guarantee the 9% Notes and the 2013 PIK Notes, as applicable. All of the notes are effectively junior to all of our existing and future secured debt, including borrowings under the ABL Facility, to the extent of the value of the assets securing such debt.
We were in compliance with the covenants under the ABL Facility, the 2013 Senior Notes and the 2013 PIK Notes at December 31, 2009.
F-34
Table of Contents
Quality Distribution, Inc. and Subsidiaries
Notes to Consolidated Financial Statements—(Continued)
For the Years Ended December 31, 2009, 2008 and 2007
Debt Retirement
The following is a schedule of our indebtedness at December 31, 2009 over the periods we are required to pay such indebtedness (in thousands):
| 2010 | 2011 | 2012 | 2013 | 2014 and after |
Total | |||||||||||||
| Capital lease obligations |
$ | 5,322 | $ | 4,279 | $ | 4,748 | $ | 2,253 | $ | 563 | $ | 17,165 | ||||||
| ABL Facility |
— | — | — | 68,000 | — | 68,000 | ||||||||||||
| 9% Senior Subordinated Notes, due 2010 |
16,031 | — | — | — | — | 16,031 | ||||||||||||
| Senior Floating Rate Notes, due 2012 |
— | — | 501 | — | — | 501 | ||||||||||||
| 10% Senior Notes, due 2013(1) |
— | — | — | 134,499 | — | 134,499 | ||||||||||||
| 11.75% Senior Subordinated PIK Notes, due 2013(1) |
— | — | — | 81,211 | — | 81,211 | ||||||||||||
| Other Notes |
3,835 | 2,311 | 2,104 | 2,231 | 2,079 | 12,560 | ||||||||||||
| Total |
$ | 25,188 | $ | 6,590 | $ | 7,353 | $ | 288,194 | $ | 2,642 | $ | 329,967 | ||||||
| (1) | Amounts do not include the remaining aggregate unamortized original issue discount of $8.7 million. |
The following table represents our debt issuance costs at December 31, 2009 and 2008 (in thousands):
| 2008 | Write-off of Issuance Costs |
Additional Debt Issuance Costs |
Transfer Related to Exchange Offers |
Current year amortization expense |
2009 | ||||||||||||||||
| ABL Facility |
$ | 5,552 | $ | — | $ | — | $ | — | $ | (1,268 | ) | $ | 4,284 | ||||||||
| 9% Senior Subordinated Notes, due 2010 |
1,150 | (20 | ) | — | (537 | ) | (524 | ) | 69 | ||||||||||||
| Senior Floating Rate Notes, due 2012 |
2,794 | — | — | (2,059 | ) | (735 | ) | — | |||||||||||||
| 10% Senior Notes, due 2013 |
— | — | 1,584 | 2,059 | (218 | ) | 3,425 | ||||||||||||||
| 11.75% Senior Subordinated PIK Notes, due 2013 |
— | — | 970 | 537 | (81 | ) | 1,426 | ||||||||||||||
| Total |
$ | 9,496 | $ | (20 | ) | $ | 2,554 | $ | — | $ | (2,826 | ) | $ | 9,204 | |||||||
Amortization expense of deferred issuance costs was $2.8 million, $3.0 million, and $1.9 million for years ending December 31, 2009, 2008, and 2007, respectively. We are amortizing these costs over the term of the debt instruments.
Liquidity
We believe that, based on current operations and anticipated growth, our cash flow from operations, together with available sources of liquidity, including borrowings under the ABL Facility, will be sufficient to fund anticipated capital expenditures, make required payments of principal and interest on our debt, including obligations under our credit agreement, and satisfy other long-term contractual commitments for the next twelve months.
F-35
Table of Contents
Quality Distribution, Inc. and Subsidiaries
Notes to Consolidated Financial Statements—(Continued)
For the Years Ended December 31, 2009, 2008 and 2007
However, for periods extending beyond twelve months, if our operating cash flow and borrowings under the revolving portions of the ABL Facility are not sufficient to satisfy our capital expenditures, debt service and other long-term contractual commitments, we would be required to seek alternative financing. These alternatives would likely include another restructuring or refinancing of our long-term debt, the sale of a portion or all of our assets or operations, or the sale of additional debt or equity securities. If these alternatives were not available in a timely manner or on satisfactory terms, or were not permitted under our existing agreements, we might default on some or all of our obligations. If we default on our obligations under our ABL Facility, the maturity date of the ABL may be accelerated. If this occurs, our assets might not be sufficient to repay in full all of our indebtedness, and we might be forced into bankruptcy.
15. INCOME TAXES
For financial reporting purposes, (loss) income before income taxes includes the following components (in thousands):
| 2009 | 2008 | 2007 | |||||||||
| Domestic |
$ | (144,136 | ) | $ | 15,950 | $ | (10,805 | ) | |||
| Mexico |
637 | 1,058 | 694 | ||||||||
| Canada |
214 | 44 | 469 | ||||||||
| (143,285 | ) | 17,052 | (9,642 | ) | |||||||
The components of the provision for (benefit from) income tax for the years ended December 31 are as follows (in thousands):
| 2009 | 2008 | 2007 | ||||||||||
| Current taxes: |
||||||||||||
| Federal |
$ | (792 | ) | $ | (211 | ) | $ | (168 | ) | |||
| State |
486 | (820 | ) | 1,119 | ||||||||
| Mexico |
92 | 298 | 300 | |||||||||
| Canada |
120 | 245 | 1,296 | |||||||||
| (94 | ) | (488 | ) | 2,547 | ||||||||
| Deferred taxes: |
||||||||||||
| Federal |
(3,609 | ) | 5,635 | (7,325 | ) | |||||||
| State |
(625 | ) | (417 | ) | 2,218 | |||||||
| Mexico |
— | — | (106 | ) | ||||||||
| Canada |
— | — | (131 | ) | ||||||||
| (4,234 | ) | 5,218 | (5,344 | ) | ||||||||
| Valuation Allowance |
||||||||||||
| Federal |
38,131 | 210 | 1,625 | |||||||||
| State |
3,446 | — | (907 | ) | ||||||||
| Mexico |
— | — | — | |||||||||
| Canada |
— | — | — | |||||||||
| 41,577 | 210 | 718 | ||||||||||
| Provision for (benefit from) income taxes |
$ | 37,249 | $ | 4,940 | $ | (2,079 | ) | |||||
F-36
Table of Contents
Quality Distribution, Inc. and Subsidiaries
Notes to Consolidated Financial Statements—(Continued)
For the Years Ended December 31, 2009, 2008 and 2007
The net deferred tax asset (liability) consisted of the following at December 31 (in thousands):
| 2009 | 2008 | |||||||
| Deferred tax assets: |
||||||||
| Environmental reserve |
$ | 7,848 | $ | 8,302 | ||||
| Tax credit carryforwards |
5,812 | 5,292 | ||||||
| Self-insurance reserves |
7,639 | 8,357 | ||||||
| Allowance for doubtful accounts |
699 | 1,109 | ||||||
| Pension |
7,409 | 7,414 | ||||||
| Net operating loss carryforwards |
36,596 | 37,559 | ||||||
| Accrued interest and original issue discount |
974 | — | ||||||
| Other accruals |
3,989 | 3,980 | ||||||
| Accrued losses and damage claims |
91 | 209 | ||||||
| 71,057 | 72,222 | |||||||
| Less valuation allowance |
(43,032 | ) | (1,855 | ) | ||||
| 28,025 | 70,367 | |||||||
| Deferred tax liabilities: |
||||||||
| Property and equipment basis differences |
(25,625 | ) | (24,687 | ) | ||||
| Intangible basis differences |
(2,400 | ) | (8,337 | ) | ||||
| Net deferred tax asset |
— | 37,343 | ||||||
| Comprised of: |
||||||||
| Current deferred tax asset |
5,506 | 14,707 | ||||||
| Long-term deferred tax asset |
— | 22,636 | ||||||
| Long-term deferred tax liability |
(5,506 | ) | — | |||||
| Net deferred tax asset |
$ | — | $ | 37,343 | ||||
We have established a 100% valuation allowance against net deferred tax assets as it is no longer more likely than not that the deferred asset will be realized. This determination is based on the weight of available evidence which includes cumulative historical losses in recent years. The valuation allowance against net deferred tax assets increased by $41.2 million from 2008 to 2009.
F-37
Table of Contents
Quality Distribution, Inc. and Subsidiaries
Notes to Consolidated Financial Statements—(Continued)
For the Years Ended December 31, 2009, 2008 and 2007
Our effective tax rate differs from the federal statutory rate. The reasons for those differences are as follows for the years ended December 31 (in thousands):
| 2009 | 2008 | 2007 | ||||||||||
| Tax (benefit) expense at the statutory rate |
$ | (50,150 | ) | $ | 5,968 | $ | (3,375 | ) | ||||
| State income taxes, net of federal benefit |
(225 | ) | (127 | ) | 299 | |||||||
| FIN 48 adjustments |
(937 | ) | (698 | ) | — | |||||||
| Goodwill impairment |
46,688 | — | — | |||||||||
| Restricted stock |
154 | 423 | — | |||||||||
| Pension adjustment |
— | (1,193 | ) | — | ||||||||
| Foreign taxes |
(86 | ) | 158 | 951 | ||||||||
| Valuation allowance |
41,577 | 210 | 1,625 | |||||||||
| Work Opportunity Tax Credit |
(206 | ) | — | — | ||||||||
| Increase in federal NOL |
— | — | (1,007 | ) | ||||||||
| IRC Section 956 income |
419 | 253 | 401 | |||||||||
| Foreign tax credit |
(190 | ) | (302 | ) | (1,122 | ) | ||||||
| Secondary offering costs |
— | — | (304 | ) | ||||||||
| Other |
205 | 248 | 453 | |||||||||
| Provision for (benefit from) income taxes |
$ | 37,249 | $ | 4,940 | $ | (2,079 | ) | |||||
At December 31, 2009, we had approximately $95.7 million in federal net operating loss carryforwards, $2.3 million in alternative minimum tax credit carry forwards and $3.1 million in foreign tax credit carryforwards. We do not have a history of net operating loss or tax credit carryforwards expiring unused; however, we have determined based on the weight of available evidence that it is more likely than not that some or all of the carryforwards may expire. As a result, we have established a valuation allowance of $43.0 million. The net operating loss carryforwards will expire in the years 2018 through 2027 while the alternative minimum tax credits may be carried forward indefinitely and the foreign tax credits may be carried forward for ten years. We have approximately $47.0 million in state net operating loss carryforwards, which expire over the next 1 to 18 years.
Significant judgment is required in determining our provision for income taxes. In the ordinary course of an international business, there are many transactions for which the ultimate tax outcome is uncertain. We review our tax contingencies on a regular basis and make appropriate accruals as needed. As of December 31, 2009, United States taxes were not provided on income of our foreign subsidiaries, as we have invested or expect to invest the undistributed earnings indefinitely.
Rollforward of valuation allowance (in thousands):
| 2009 | 2008 | |||||||
| Beginning balance |
$ | (1,855 | ) | $ | (1,645 | ) | ||
| (Increase)/decrease attributable to current year operations |
(417 | ) | — | |||||
| (Increase)/decrease attributable to other comprehensive income |
400 | — | ||||||
| (Increase)/decrease attributable to FIN 48 |
— | — | ||||||
| (Increase)/decrease attributable to AMT & foreign tax credit carryforwards |
(3,628 | ) | (210 | ) | ||||
| (Increase)/decrease attributable to Federal & State NOL carryforwards |
(37,532 | ) | — | |||||
| Ending balance |
$ | (43,032 | ) | $ | (1,855 | ) | ||
F-38
Table of Contents
Quality Distribution, Inc. and Subsidiaries
Notes to Consolidated Financial Statements—(Continued)
For the Years Ended December 31, 2009, 2008 and 2007
At December 31, 2009 and 2008, we had approximately $1.8 and $2.0 million, respectively, of total gross unrecognized tax benefits. Of the total gross unrecognized tax benefits at December 31, 2009, $1.2 million (net of federal benefit on state tax issues) represents the amount of unrecognized tax benefits that, if recognized would favorably affect the effective income tax rate in any future periods.
Included in the balance of gross unrecognized tax benefits at December 31, 2009 is $0.7 million related to tax positions for which it is reasonably possible that the total amounts could significantly change during the next twelve months due to expiration of the applicable statute of limitations. A reconciliation of the total amount of unrecognized tax benefits follows (in thousands):
| 2009 | 2008 | |||||||
| Total unrecognized tax benefits as of January 1, 2009 |
$ | 2,043 | $ | 3,193 | ||||
| Increases in tax positions taken during prior period |
— | 209 | ||||||
| Decreases in tax positions taken during prior period |
(118 | ) | (381 | ) | ||||
| Increases in tax positions taken during the current period |
10 | 32 | ||||||
| Settlements with taxing authorities |
— | (212 | ) | |||||
| Decrease due to lapse of applicable statute of limitations |
(159 | ) | (798 | ) | ||||
| Total unrecognized tax benefits as of December 31, 2009 |
$ | 1,776 | $ | 2,043 | ||||
Our continuing practice is to recognize interest and/or penalties related to income tax matters in income tax expense. For the year ended December 31, 2009, we recognized additional benefit of $0.7 million of interest and penalties in the provision for income taxes. As of January 1, 2009 we had accrued interest of $1.3 million (net of federal benefit) and $0.4 million accrued for penalties. At December 31, 2009 we had accrued interest of $0.7 million (net of federal benefit) and $0.3 million accrued for penalties.
We are subject to the income tax jurisdiction of U.S., Canada, and Mexico, as well as income tax of multiple state jurisdictions. We believe we are no longer subject to U.S. federal income tax examinations for the years before 2006, to international examinations for years before 2004 and with few exceptions, to state exams before 2005.
In accordance with FASB guidance, we updated the presentation of our deferred tax asset and valuation allowance to remove any unrecognized tax benefit. In the first quarter of 2007, we reversed the remaining $0.9 million deferred tax valuation allowance and the associated deferred tax asset on state tax net operating losses that contained unrecognized tax benefits.
16. EMPLOYEE BENEFIT PLANS
We maintain two noncontributory defined benefit plans resulting from a prior acquisition that cover certain full-time salaried employees (“CLC Plan”) and certain other employees under a collective bargaining agreement (“TTWU Plan”). Retirement benefits for employees covered by the salaried plan are based on years of service and compensation levels. The monthly benefit for employees under the collective bargaining agreement plan is based on years of service multiplied by a monthly benefit factor. Pension costs are funded in accordance with the provisions of the applicable law. Both pension plans have been frozen since prior to January 1, 1998. There are no new participants and no future accruals of benefits from the time the plans were frozen.
We use a December 31 measurement date for both of our plans.
We follow the recognition and disclosure requirements under the FASB guidance that require us to recognize the funded status of our postretirement benefit plans in the consolidated statement of financial position
F-39
Table of Contents
Quality Distribution, Inc. and Subsidiaries
Notes to Consolidated Financial Statements—(Continued)
For the Years Ended December 31, 2009, 2008 and 2007
at December 31, 2009, with a corresponding adjustment to accumulated other comprehensive income. The funded status is the difference between the fair value of plan assets and the benefit obligation. The adjustment to accumulated other comprehensive income represents the net unrecognized actuarial gains or losses and unrecognized prior service costs. Future actuarial gains or losses that are not recognized as net periodic benefit cost in the same periods will be recognized as a component of other comprehensive income (in thousands):
| 2009 | |||
| Items not yet recognized as a component of net periodic cost: |
|||
| Unrecognized net actuarial loss |
$ | 28,062 | |
| Unamortized prior service cost |
604 | ||
| Unrecognized loss and prior service costs recorded as a component of accumulated other comprehensive loss |
$ | 28,666 | |
| Items to be recognized in 2010 as a component of net periodic cost: |
|||
| Net actuarial loss |
$ | 1,200 | |
| Prior service cost |
94 | ||
| Net periodic cost to be recorded in 2010 as a component of accumulated other comprehensive loss |
$ | 1,294 | |
Obligations and Funded Status
The following table sets forth the change in the projected benefit obligation, change in plan assets and unfunded status of the two plans at December 31 (in thousands):
| 2009 | 2008 | |||||||
| Change in Projected Benefit Obligation |
||||||||
| Benefit obligation at beginning of year |
$ | 45,641 | $ | 45,827 | ||||
| Service cost |
203 | 214 | ||||||
| Interest cost |
2,752 | 2,729 | ||||||
| Actuarial loss |
2,175 | 354 | ||||||
| Benefits and expenses paid |
(3,469 | ) | (3,483 | ) | ||||
| Benefit obligation at end of year |
$ | 47,302 | $ | 45,641 | ||||
| 2009 | 2008 | |||||||
| Change in Plan Assets |
||||||||
| Fair value of plan assets at beginning of year |
$ | 26,989 | $ | 42,138 | ||||
| Actual return (loss) on plan assets |
3,964 | (12,545 | ) | |||||
| Contributions by company |
1,005 | 878 | ||||||
| Benefits and expenses paid |
(3,469 | ) | (3,483 | ) | ||||
| Fair value of plan assets at end of year |
$ | 28,489 | $ | 26,988 | ||||
| 2009 | 2008 | |||||||
| Unfunded Status of Plans |
||||||||
| Projected benefit obligation |
$ | (47,302 | ) | $ | (45,641 | ) | ||
| Fair value of plan assets |
28,489 | 26,988 | ||||||
| Unfunded status |
$ | (18,813 | ) | $ | (18,653 | ) | ||
F-40
Table of Contents
Quality Distribution, Inc. and Subsidiaries
Notes to Consolidated Financial Statements—(Continued)
For the Years Ended December 31, 2009, 2008 and 2007
The accumulated benefit obligation for both defined benefit pension plans equaled the projected benefit obligations of $47.3 million and $45.6 million at December 31, 2009 and 2008, respectively.
Accumulated Other Comprehensive Loss (in thousands)
| 2009 | 2008 | 2007 | ||||||||
| Net actuarial loss, net of tax of $0, $6,087 and ($1,009), respectively |
$ | 941 | $ | (9,755 | ) | $ | 1,507 | |||
| Prior service cost |
94 | 94 | 94 | |||||||
| Adjustment to pension benefit obligation |
$ | 1,035 | $ | (9,661 | ) | $ | 1,601 | |||
We had an accumulated net pension equity credit of $1.0 million at December 31, 2009 compared to a charge of $9.7 million at December 31, 2008. The equity charge in 2008 reflected the decline in our funded status as a result of significant negative asset returns during 2008.
Periodic Pension Costs
The components of net periodic pension cost are as follows for the years ended December 31 (in thousands):
| 2009 | 2008 | 2007 | ||||||||||
| Service cost |
$ | 203 | $ | 214 | $ | 256 | ||||||
| Interest cost |
2,752 | 2,729 | 2,680 | |||||||||
| Amortization of loss |
1,154 | 354 | 415 | |||||||||
| Amortization of prior service cost |
94 | 94 | 94 | |||||||||
| Expected return on plan assets |
(2,003 | ) | (3,202 | ) | (3,284 | ) | ||||||
| Net periodic pension cost |
$ | 2,200 | $ | 189 | $ | 161 | ||||||
Pension expense significantly increased in 2009 due to poor performance in the overall stock market in 2008.
Assumptions
Weighted average assumptions used to determine benefit obligations at December 31:
| 2009 | 2008 | 2007 | |||||||
| Discount rate |
5.60 | % | 6.28 | % | 6.13 | % |
Weighted average assumptions used to determine net periodic benefit cost at December 31:
| 2009 | 2008 | 2007 | |||||||
| TTWU Plan |
|||||||||
| Discount rate |
6.30 | % | 6.00 | % | 5.75 | % | |||
| Expected long-term rate of return on plan assets |
7.00 | % | 7.50 | % | 7.50 | % | |||
| CLC Plan |
|||||||||
| Discount rate |
6.25 | % | 6.25 | % | 5.50 | % | |||
| Expected long-term rate of return on plan assets |
8.00 | % | 8.00 | % | 8.00 | % |
F-41
Table of Contents
Quality Distribution, Inc. and Subsidiaries
Notes to Consolidated Financial Statements—(Continued)
For the Years Ended December 31, 2009, 2008 and 2007
The discount rate is based on a model portfolio of AA-rated bonds with a maturity matched to the estimated payouts of future pension benefits. The TTWU Plan’s expected return on plan assets is based on our expectation of the long-term average rate of return on assets in the pension funds, which is based on the allocation of assets and includes approximately 16% of the assets being held in a low return insurance company annuity. The CLC Plan’s expected return on plan assets is based on historical and future returns of the multiple asset classes from which a weighted average was developed based on the asset allocation of the Plan.
Asset Mix
Our pension plan weighted-average asset allocations by asset category at December 31 are as follows:
| 2009 | 2008 | |||||
| TTWU Plan |
||||||
| Equity securities and mutual funds |
58.7 | % | 57.3 | % | ||
| Debt securities |
11.2 | % | 22.6 | % | ||
| Other investments |
25.1 | % | 18.4 | % | ||
| Cash and cash equivalents |
5.0 | % | 1.7 | % | ||
| CLC Plan |
||||||
| Equity securities and mutual funds |
70.3 | % | 58.0 | % | ||
| Debt securities |
12.9 | % | 42.0 | % | ||
| Other investments |
10.3 | % | — | |||
| Cash and cash equivalents |
6.5 | % | — |
Plan Assets
Our investment policy is that plan assets will be managed utilizing an investment philosophy and approach characterized by all of the following, but listed in priority order: (1) emphasis on total return, (2) emphasis on high-quality securities, (3) sufficient income and stability of income, (4) safety of principal with limited volatility of capital through proper diversification and (5) sufficient liquidity. None of our equity or debt securities are included in plan assets.
Our retirement plans’ assets were accounted for at fair value and are classified in their entirety based on the lowest level of any input that is significant to the fair value measurement. For a description of the fair value hierarchy, see Note 3.
Our actual retirement plans’ asset allocations by level within the fair value hierarchy at December 31, 2009, are presented in the table below (in thousands):
| TTWU Plan | CLC Plan | |||||||||||||||||||||||||||
| Level 1 | Level 2 | Level 3 | Total | % Total | Level 1 | Level 2 | Level 3 | Total | % Total | |||||||||||||||||||
| Cash & cash equivalents |
$ | 366 | $ | — | $ | — | $ | 366 | 5.0% | $ | 1,374 | $ | — | $ | — | $ | 1,374 | 6.5% | ||||||||||
| Equity securities |
2,330 | — | — | 2,330 | 31.6% | 7,698 | — | — | 7,698 | 36.4% | ||||||||||||||||||
| Mutual funds |
1,999 | — | — | 1,999 | 27.1% | 7,165 | — | 7,165 | 33.9% | |||||||||||||||||||
| Corporate bonds |
— | 408 | — | 408 | 5.5% | — | 1,327 | — | 1,327 | 6.3% | ||||||||||||||||||
| Asset-backed securities |
— | 420 | — | 420 | 5.7% | — | 1,385 | — | 1,385 | 6.6% | ||||||||||||||||||
| Other investments |
— | 326 | 1,526 | 1,852 | 25.1% | — | 1,104 | 1,061 | 2,165 | 10.3% | ||||||||||||||||||
| Total assets |
$ | 4,695 | $ | 1,154 | $ | 1,526 | $ | 7,375 | 100.0% | $ | 16,237 | $ | 3,816 | $ | 1,061 | $ | 21,114 | 100.0% | ||||||||||
F-42
Table of Contents
Quality Distribution, Inc. and Subsidiaries
Notes to Consolidated Financial Statements—(Continued)
For the Years Ended December 31, 2009, 2008 and 2007
Level 1 includes investments in common stock and open-ended mutual funds. Fair values for these investments are measured using unadjusted quoted prices in active markets.
Level 2 includes investments in corporate bonds and asset-backed securities that are measured based on quoted prices for similar assets in active markets; quoted prices for identical or similar assets in inactive markets; inputs other than quoted prices that are observable for the asset; and inputs that are derived principally from or corroborated by observable market data by correlation or other means. The fair values for Level 2 assets are generally obtained from third-party broker quotes, independent pricing services and exchanges.
Level 3 includes investments in an insurance annuity contract and an interval fund containing a lock-up period that are valued using unobservable inputs. Valuation may be performed using a financial model with estimated inputs entered into the model.
The following is a reconciliation of assets in Level 3 of the fair value hierarchy (in thousands):
| TTWU | CLC | |||||
| Beginning balance at January 1, 2009 |
$ | 1,358 | $ | — | ||
| Return on plan assets |
69 | 42 | ||||
| Purchases, sales, settlements and expenses |
99 | 1,019 | ||||
| Ending balance at December 31, 2009 |
$ | 1,526 | $ | 1,061 | ||
Cash Flows
We expect to contribute $0.4 million to the TTWU pension plan and $2.2 million to the CLC pension plan during the year ending December 31, 2010.
The following benefit payments are expected to be paid (in thousands):
| 2010 |
$ | 3,491 | |
| 2011 |
3,457 | ||
| 2012 |
3,465 | ||
| 2013 |
3,438 | ||
| 2014 |
3,451 | ||
| 2015 – 2019 |
17,179 |
We charged to operations, payments to multi-employer pension plans required by collective bargaining agreements of approximately $2.7 million, $2.3 million and $2.2 million for the years ended December 31, 2009, 2008 and 2007, respectively. These defined benefit plans cover substantially all of our union employees not covered under the TTWU pension plan. The actuarial present value of accumulated plan benefits and net assets available for benefits to employees under these multi-employer plans is not readily available.
In 2001, we established a Deferred Compensation Plan for our executives and other key employees. The plan is a non-qualified deferral plan that allows participants to contribute a portion of their wages on a pre-tax basis and includes a death benefit. We may credit participants’ accounts with a discretionary contribution at our sole discretion. No contributions were made in 2009, 2008 and 2007.
Substantially all of our U.S. employees are entitled to participate in our profit sharing plan established under Section 401(k) of the U.S. Internal Revenue Code. Employees are eligible to contribute voluntarily to the plan after 90 days of employment. At our discretion, we may also contribute to the plan. Employees are always vested
F-43
Table of Contents
Quality Distribution, Inc. and Subsidiaries
Notes to Consolidated Financial Statements—(Continued)
For the Years Ended December 31, 2009, 2008 and 2007
in their contributed balance and become fully vested in our contributions after four years of service. The expenses related to contributions to the plan for the years ended December 31, 2008 and 2007 were approximately $0.4 million and $0.2 million, respectively. In 2009, we did not contribute to the plan.
17. CAPITAL STOCK
Authorized Capital Stock
In accordance with our Amended and Restated Articles of Incorporation dated November 4, 2003, the Company is authorized to issue 30 million shares of capital stock, 29 million shares of no par value common stock and 1 million shares of no par value preferred stock.
Our ABL Facility and indentures governing the 2013 Senior Notes and the 2013 PIK Notes contain restrictions on QDI’s ability to pay dividends on its common stock.
Preferred Stock
Of the 1 million shares of preferred stock authorized, 600,000 shares were designated as convertible preferred stock, of which 510,000 were issued and outstanding prior to the initial public offering of shares of our common stock, when they were converted into shares of common stock pursuant to our Amended and Restated Articles of Incorporation. The remaining shares of preferred stock may be issued from time to time in one or more classes or series, with such relative rights, preferences, qualifications, and limitations as our Board of Directors may adopt by resolution.
Warrants
On October 15, 2009 in conjunction with the note exchange offer, we issued 1,752,895 aggregate amount of warrants to purchase shares of the Company’s common stock at an exercise price of $0.01 per share. The warrants are exercisable during the period beginning April 16, 2010 and ending November 1, 2013. The warrants issued with the 2013 PIK Notes are detachable warrants because they can be traded separately from the note with which they were issued and are accounted for separately in accordance with FASB guidance. The warrants are classified as equity based. The warrants are accounted for at their fair value upon completion of the Exchange Offers on October 15, 2009, which is based on the closing price of the common stock of $3.82 on that date. $6.7 million representing the fair value of the warrants was recorded to equity with a corresponding entry to bond issuance discount. The discount will be amortized over the life of the 2013 PIK Notes. The balance of discount associated with the warrants at December 31, 2009 was $6.4 million.
Treasury Stock
As of December 31, 2009 and 2008, we had approximately 220,000 and 205,000 treasury shares carried at a cost of approximately $1.6 million and $1.6 million, respectively. These shares were acquired pursuant to our initial public offering, the return of shares under limited recourse secured loans to shareholders and forfeitures.
18. STOCK COMPENSATION PLANS
We account for our equity compensation plans and expense related to all stock option awards granted under the FASB guidance. We apply the Black-Scholes valuation model in determining the fair value of share-based payments to employees. The resulting compensation expense is recognized over the requisite service period, which is generally the vesting term of four years.
F-44
Table of Contents
Quality Distribution, Inc. and Subsidiaries
Notes to Consolidated Financial Statements—(Continued)
For the Years Ended December 31, 2009, 2008 and 2007
Performance Incentive Plans
As of December 31, 2009, we have two active stock-based compensation plans. As of December 31, 2008, there was an agreement regarding stock units which applied solely to Mr. Gerald L. Detter, our former Chief Executive Officer, and a third stock-based compensation plan, which expired in 2008.
2003 Stock Option Plan
The 2003 Stock Option Plan was adopted on November 5, 2003 in connection with our IPO and expires 10 years after adoption. It was amended on May 13, 2005. It provides for the grant of nonqualified stock options that become exercisable, with limited exceptions, in 25% increments on each of the first four anniversaries of the date upon which the options are granted or vest 50% in the third and 50% in the fourth year after issuance of the grant. The contractual term of each grant is ten years. The number of shares available for issuance under this plan automatically increases on January 1 of each year commencing with January 1, 2004 unless otherwise determined by the Board of Directors. The current year increase is 2.5% of the outstanding shares as of December 31 of the prior year. No more than 6,500,000 shares of common stock may be issued under the 2003 Stock Option Plan.
The 2003 Stock Option Plan activity for the year ended December 31, 2009 is as follows (in thousands, except per share data):
| Number of Shares Outstanding |
Weighted Average Exercise Price |
Weighted Average Remaining contractual Term (in years) |
Aggregate Intrinsic Value (in thousands)(a) | |||||||
| Options outstanding at December 31, 2008 |
1,947 | $ | 9.19 | |||||||
| 2009 option activity: |
||||||||||
| Granted |
1,094 | $ | 3.02 | |||||||
| Exercised(b) |
— | — | ||||||||
| Expired |
(338 | ) | $ | 6.48 | ||||||
| Canceled |
(532 | ) | $ | 11.10 | ||||||
| Options outstanding at December 31, 2009 |
2,171 | $ | 4.93 | |||||||
| Options exercisable at December 31, 2009 |
696 | $ | 7.93 | 4.8 | — | |||||
| (a) | The intrinsic value of a stock option is the amount by which the market value of the underlying stock as of December 31, 2009 exceeds the exercise price of the option. |
| (b) | Any options that are exercised are issued out of our treasury share account. |
During the years ended December 31, 2009, 2008 and 2007:
| • | the weighted-average grant date fair value per share of stock-based compensation granted to employees was $1.96, $2.30 and $5.56, respectively; |
| • | there were no options exercised in 2009 and 2008. The total intrinsic value of stock options exercised was nominal in 2007, and |
| • | the total fair value of stock options that vested during the three periods above was $344, $984 and $1,324, respectively. |
During the year ended December 31, 2009, cash was not used to settle any equity instruments previously granted.
F-45
Table of Contents
Quality Distribution, Inc. and Subsidiaries
Notes to Consolidated Financial Statements—(Continued)
For the Years Ended December 31, 2009, 2008 and 2007
1998 Stock Option Plan
Until adoption of the 2003 Stock Option Plan, we administered the 1998 Stock Option Plan pursuant to which a total of 377,400 shares of our common stock were available for grant at an exercise price of $23.53. The maximum term of granted options is ten years. Fifty percent of each new option granted vested in equal increments over four years. The remaining fifty percent of each new option will vest in nine years from grant date, subject to acceleration if certain per-share equity value targets are achieved or in the event of a sale of the Company. Vesting of the new options occurs only during an employee’s term of employment. The new options will become fully vested in the event of a termination of employment without “cause” or for “good reason” within nine months following a sale of the Company.
The 1998 Stock Option Plan activity for the year ended December 31, 2009 is as follows (in thousands, except per share data):
| Number of Shares Outstanding |
Weighted Average Exercise Price |
Weighted Average Remaining Contractual Term (in years) |
Aggregate Intrinsic Value (in thousands)(a) | ||||||
| Options outstanding at December 31, 2008 |
12 | $ | 23.53 | ||||||
| 2009 option activity: |
|||||||||
| Expired |
— | — | |||||||
| Canceled |
— | — | |||||||
| Options outstanding at December 31, 2009(b) |
12 | $ | 23.53 | ||||||
| Options exercisable at December 31, 2009 |
6 | $ | 23.53 | 0.7 | — | ||||
| (a) | The intrinsic value of a stock option is the amount by which the market value of the underlying stock as of December 31, 2009 exceeds the exercise price of the option. |
| (b) | Although we cannot issue additional stock options under the 1998 Stock Option Plan, stock options that were previously granted under the 1998 Stock Option Plan continue to be subject to its terms. |
During the years ended December 31, 2009, 2008 and 2007:
| • | no options were granted, respectively; |
| • | no options were exercised, and |
| • | no options vested during the three periods above. |
2003 Restricted Stock Incentive Plan
On November 5, 2003, our Board of Directors approved the 2003 Restricted Stock Incentive Plan, which terminates ten years from the approval date. The 2003 Restricted Stock Incentive Plan was amended on May 13, 2005. The restricted stock issuances to persons initially receiving a grant generally vest by December 31, 2009 regardless of when issued. The vesting periods for other grant recipients are at the discretion of the Compensation Committee of the Board of Directors. In subsequent years, participants in the plan may be granted an annual, aggregate amount of up to $1 million of shares, valued at our common stock closing price at the date of grant, at the direction of the Board of Directors. No more than 700,000 shares of common stock may be issued under this plan nor may more than $7.5 million of stock be issued under this plan.
F-46
Table of Contents
Quality Distribution, Inc. and Subsidiaries
Notes to Consolidated Financial Statements—(Continued)
For the Years Ended December 31, 2009, 2008 and 2007
The 2003 Restricted Stock Incentive plan activity for the year ended December 31, 2009 is as follows (in thousands, except per share data):
| Number of Shares Outstanding |
Weighted Average Grant Date Fair Value |
Aggregate Intrinsic Value | ||||||
| Stock unvested at December 31, 2008 |
136 | $ | 4.97 | |||||
| 2009 activity: |
||||||||
| Granted |
536 | $ | 3.66 | |||||
| Vested |
(47 | ) | $ | 5.78 | ||||
| Canceled |
(15 | ) | $ | 3.40 | ||||
| Stock unvested at December 31, 2009 |
610 | $ | 3.89 | 423 | ||||
Accounting for Stock-Based Compensation
Compensation expense is recognized only for those options expected to vest, with forfeitures estimated based on our historical experience and future expectations.
The fair value of options granted during 2009, 2008 and 2007 was based upon the Black-Scholes option-pricing model. The expected term of the options represents the estimated period of time until exercise giving consideration to the contractual terms, vesting schedules and expectations of future employee behavior. Expected stock price volatility is based on the historical volatility of our common stock, which began trading on November 13, 2003. The risk-free interest rate is based on the U.S. Treasury yield curve in effect at the time of grant with an equivalent remaining term. The Company has not paid dividends in the past and does not currently plan to pay any dividends in the foreseeable future. The Black-Scholes model was used with the following weighted-average assumptions:
| 2009 | 2008 | 2007 | |||||||
| Risk free rate |
2.05 | % | 3.18 | % | 4.35 | % | |||
| Expected life |
5 years | 5 years | 5 years | ||||||
| Volatility |
79 | % | 67 | % | 68 | % | |||
| Expected dividend |
nil | nil | nil |
Restricted stock awards and stock units are measured at fair value at time of issuance and recognized on a straight line basis over the vesting period.
Stock-based compensation expense recognized during the years ended December 31, 2009, 2008 and 2007 for each of the types of stock-based awards was (in thousands):
| 2009 | 2008 | 2007 | |||||||
| Stock options |
$ | 713 | $ | 995 | $ | 1,143 | |||
| Restricted stock |
388 | 333 | 420 | ||||||
| Total stock-based compensation expense |
$ | 1,101 | $ | 1,328 | $ | 1,563 | |||
All stock-based compensation expense is classified within “Compensation” on the Consolidated Statements of Operations. None of the stock-based compensation was capitalized during 2009. Fourteen of our employees and three members of our Board of Directors participated in an option exchange (the “Option Exchange”) on
F-47
Table of Contents
Quality Distribution, Inc. and Subsidiaries
Notes to Consolidated Financial Statements—(Continued)
For the Years Ended December 31, 2009, 2008 and 2007
March 11, 2009. Prior to the Option Exchange, the Compensation Committee recognized that due to the historically low trading prices of our common stock, many options previously granted under the 2003 Stock Option Plan ceased to satisfy their intended purpose. As such, the Option Exchange was initiated and certain stock option grants were canceled and new stock options were issued covering shares of our common stock at an exercise price equal to the closing price of our common stock on March 11, 2009. All options issued in the Option Exchange vest in four equal annual installments on the anniversary of grant. In connection with the Option Exchange, an incremental cost of less than $0.1 million was recognized in 2009.
The following table summarizes unrecognized stock-based compensation and the weighted average period over which such stock-based compensation is expected to be recognized as of December 31, 2009 (in thousands):
| In $ | Remaining years | ||||
| Stock options |
$ | 3,132 | 4 | ||
| Restricted stock |
2,105 | 4 | |||
| $ | 5,237 | ||||
These amounts do not include the cost of any additional awards that may be granted in future periods nor any changes in our forfeiture rate. These amounts do not include the cost of any additional options or restricted stock that may be granted in future periods or any changes in the Company’s forfeiture rate.
19. COMMITMENTS AND CONTINGENCIES
Operating Leases
We are obligated under various noncancelable operating leases for our office facilities, office equipment, revenue equipment and vehicles. Future noncancelable lease commitments (excluding any sublease income) as of December 31, 2009, are as follows (in thousands):
| 2010 |
$ | 15,906 | |
| 2011 |
10,515 | ||
| 2012 |
7,227 | ||
| 2013 |
4,218 | ||
| 2014 |
2,320 | ||
| 2015 and after |
6,198 | ||
| Total |
$ | 46,384 | |
The operating lease commitments include minimum lease commitments for tractors that we expect will be partially offset by rental revenue from sub-leasing the tractors to independent owner-operators or affiliates. Rent expense under operating leases was $21.6 million, $28.7 million and $23.5 million for the years ended December 31, 2009, 2008 and 2007, respectively.
Environmental Matters
It is our policy to comply with all applicable environmental, safety, and health laws. We also are committed to the principles of Responsible Care®, an international chemical industry initiative to enhance the industry’s responsible management of chemicals. We have obtained independent certification that our management system
F-48
Table of Contents
Quality Distribution, Inc. and Subsidiaries
Notes to Consolidated Financial Statements—(Continued)
For the Years Ended December 31, 2009, 2008 and 2007
is in place and functions according to professional standards and we continue to evaluate and continuously improve our Responsible Care® Management System performance.
Our activities involve the handling, transportation and storage of bulk chemicals, both liquid and dry, many of which are classified as hazardous materials or hazardous substances. Our operations involve the generation, storage, discharge and disposal of wastes that may contain hazardous substances, the inventory and use of cleaning materials that may contain hazardous substances and the control and discharge of storm-water from industrial sites. In addition, we may store diesel fuel, materials containing oil and other hazardous products at our terminals. As such, we and others who operate in our industry are subject to environmental, health and safety laws and regulation by U.S. federal, state and local agencies as well as foreign governmental authorities. Environmental laws and regulations are complex, and address emissions to the air, discharge onto land or water, and the generation, handling, storage, transportation, treatment and disposal of waste materials. These laws change frequently and generally require us to obtain and maintain various licenses and permits. Environmental laws have tended to become more stringent over time, and most provide for substantial fines and potential criminal sanctions for violations. Some of these laws and regulations are subject to varying and conflicting interpretations. Under certain of these laws, we could also be subject to allegations of liability for the activities of our affiliates or independent owner-operators.
We are potentially subject to strict, joint and several liability for investigating and rectifying the consequences of spills and other releases of such substances. From time to time, we have incurred remedial costs and regulatory penalties with respect to chemical or wastewater spills and releases at our facilities and on the road, and, notwithstanding the existence of our environmental management program, we cannot assure that such obligations will not be incurred in the future, predict with certainty the extent of future liabilities and costs under environmental, health, and safety laws, or assure that such liabilities will not result in a material adverse effect on our business, financial condition, operating results or cash flow. We have established reserves for remediation expenses at known contamination sites when it is probable that such efforts will be required of us and the related expenses can be reasonably estimated. Additional information about our reserves, our estimates underlying them and the known contamination sites may be found at Note 19 to our consolidated financial statements contained herein, “Commitments and Contingencies—Environmental Matters.”
We have also incurred in the past, and expect to incur in the future, capital and other expenditures related to environmental compliance for current and planned operations. Such expenditures are generally included in our overall capital and operating budgets and are not accounted for separately. However, we do not anticipate that compliance with existing environmental laws in conducting current and planned operations will have a material adverse effect on our capital expenditures, earnings or competitive position.
Reserves
Our policy is to accrue remediation expenses when it is probable that such efforts will be required and the related expenses can be reasonably estimated. Estimates of costs for future environmental compliance and remediation may be adversely affected by such factors as changes in environmental laws and regulatory requirements, the availability and application of technology, the identification of currently unknown potential remediation sites and the allocation of costs among the potentially responsible parties under the applicable statutes. The recorded liabilities are adjusted periodically as remediation efforts progress or as additional technical or legal information becomes available. As of December 31, 2009 and December 31, 2008, we had reserves in the amount of $11.6 million and $10.9 million, respectively, for all environmental matters of which the more significant are discussed below.
F-49
Table of Contents
Quality Distribution, Inc. and Subsidiaries
Notes to Consolidated Financial Statements—(Continued)
For the Years Ended December 31, 2009, 2008 and 2007
The balances presented include both long term and current environmental reserves. We expect these environmental obligations to be paid over the next five years. Additions to the environmental liability reserves are classified in our consolidated statements of operations within the “Selling and administrative” category.
Property Contamination Liabilities
We have been named as (or are alleged to be) a potentially responsible party under the Comprehensive Environmental Response, Compensation and Liability Act of 1980, as amended (“CERCLA”) and similar state laws at approximately 24 sites. At 17 of the 24 sites, we are one of many parties with alleged liability and are negotiating with Federal, State or private parties on the scope of our obligations, if any. At 2 of the 17 sites, we will be participating in the initial studies to determine site remediation objectives. Since our overall liability cannot be estimated at this time, we have set reserves for only the initial remedial investigation phase. At 3 of the 17 sites, we have explicitly denied any liability and since there has been no subsequent demand for payment we have not established a reserve for these matters. We have estimated future expenditures for these off-site multi-party environmental matters to be in the range of $2.5 million to $3.8 million.
At 7 of the 24 sites, we are the only responsible party and are in the process of conducting investigations and/or remediation projects. Four of these projects relate to operations conducted by CLC prior to our acquisition with CLC in 1998. These four sites are: (1) Bridgeport, New Jersey; (2) William Dick, Pennsylvania; (3) Tonawanda, New York; and (4) Scary Creek, West Virginia. The remaining three sites related to investigations and potential remediation that were triggered by the New Jersey Industrial Site Remediation Act (“ISRA”), which requires such investigations and remediation following the sale of industrial facilities. Each of these sites is discussed in more detail below. We have estimated future expenditures for these seven properties to be in the range of $9.1 million to $16.7 million.
Bridgeport, New Jersey
QDI is required under the terms of two federal consent decrees to perform remediation at this operating truck terminal and tank wash site. CLC entered into consent orders with the U.S. Environmental Protection Agency (“USEPA”) in May 1991 for the treatment of groundwater and in October 1998 for the removal of contamination in the wetlands. In addition, we were required to assess the remediation of contaminated soils.
The groundwater treatment remedy negotiated with USEPA calls for a treatment facility for in-place treatment of groundwater contamination and a local discharge. Treatment facility construction was completed in early 2007. After various start-up issues, we expect the treatment facility to begin operating in 2010. Wetlands contamination has been remediated with localized restoration expected to be completed in 2010. In regard to contaminated soils, we believe that USEPA is now in the process of finalizing a feasibility study for the limited areas that show contamination and warrant additional investigation or work. We have estimated expenditures to be in the range of $5.5 million to $8.5 million.
William Dick, Pennsylvania
CLC entered into a consent order with the Pennsylvania DEP and USEPA in October 1995 obligating it to provide a replacement water supply to area residents, treat contaminated groundwater, and perform remediation of contaminated soils at this former wastewater disposal site. The replacement water supply is complete. We completed construction of a treatment facility with local discharge for groundwater treatment in the fourth quarter of 2007. Plant start-up issues are on-going. The agencies have approved a contaminated soils remedy, which requires both thermal treatment of contaminated soils and treatment of residuals via soil vapor extraction.
F-50
Table of Contents
Quality Distribution, Inc. and Subsidiaries
Notes to Consolidated Financial Statements—(Continued)
For the Years Ended December 31, 2009, 2008 and 2007
The remedy expanded to include off-site shipment of contaminated soils. Soil treatment was completed in September 2007. Site sampling has been conducted and the results indicate that the soil clean-up objectives have not been fully achieved. Negotiations are on-going with USEPA over further remedial actions that may be needed at the site. We have estimated expenditures to be in the range of $1.1 million to $3.4 million.
Other Properties
Scary Creek, West Virginia: CLC received a clean up notice from the State environmental authority in August 1994. The State and we have agreed that remediation can be conducted under the State’s voluntary clean-up program (instead of the state superfund enforcement program). We are currently completing the originally planned remedial investigation and the additional site investigation work.
Tonawanda, New York: CLC entered into a consent order with the New York Department of Environmental Conservation on June 22, 1999 obligating it to perform soil and groundwater remediation at this former truck terminal and tank wash site. We have completed a remedial investigation and a feasibility study. The State issued a record of decision in May 2006. The site is currently in remedial design phase.
ISRA New Jersey Facilities: We are obliged to conduct investigations and remediation at three current or former New Jersey tank wash and terminal sites pursuant to the state’s Industrial Sites Remediation Act, which requires such remediation following the sale of facilities after 1983. These sites are in the process of remedial investigation with projections set in contemplation of limited soil remediation expense for contaminated areas.
We have estimated future expenditures for Scary Creek, Tonawanda and ISRA to be in the range of $2.5 million to $4.8 million.
Other Legal Matters
We are from time to time involved in routine litigation incidental to the conduct of our business. We believe that no such routine litigation currently pending against us, if adversely determined, would have a material adverse effect on our consolidated financial position, results of operations or cash flows.
20. TRANSACTIONS WITH RELATED PARTIES
At December 31, 2009, Apollo and its affiliated funds owned or controlled approximately 52.2% of QDI’s outstanding common stock. As a result, Apollo can influence substantially all matters requiring shareholder approval, including the election of directors, the approval of significant corporate transactions, such as acquisitions and the ability to block an unsolicited tender offer.
Two of our customers (Hexion Specialty Chemicals and Momentive Performance Materials) are controlled by Apollo. Revenues from these two customers was $12.6 million, $15.0 million and $15.9 million in 2009, 2008 and 2007, respectively. All pricing with the companies controlled by Apollo Management was based on market rates, including such factors as total expected revenue to be generated by the customer, number of loads to be hauled and the number of miles to be driven.
Of the $0.2 million stock subscription receivable, less than $0.1 million relates to current members of management.
F-51
Table of Contents
Quality Distribution, Inc. and Subsidiaries
Notes to Consolidated Financial Statements—(Continued)
For the Years Ended December 31, 2009, 2008 and 2007
21. GUARANTOR SUBSIDIARIES
The 2013 Senior Notes and 2012 Notes are our subsidiaries’, QD LLC and QD Capital, senior unsecured obligations and are fully and unconditionally guaranteed on a senior unsecured basis, jointly and severally, by QDI, our other subsidiary guarantors, and certain of our future U.S. restricted subsidiaries. The 2013 PIK Notes and 9% Notes are our subsidiaries’, QD LLC and QD Capital Corporation, unsecured and senior subordinated obligations and are fully and unconditionally guaranteed on an unsecured and senior subordinated basis, jointly and severally, by QDI, our other subsidiary guarantors, and certain of our future U.S. restricted subsidiaries. The subsidiary guarantors of all of the notes are all of our direct and indirect domestic subsidiaries. All non-domestic subsidiaries including Levy Transport, Ltd. are not guarantor subsidiaries. QD Capital has no material assets or operations. QD LLC, all its subsidiary guarantors and QD Capital are 100% owned by QDI.
QD LLC conducts substantially all of its business through and derives virtually all of its income from its subsidiaries. Therefore, its ability to make required principal and interest payments with respect to its indebtedness depends on the earnings of subsidiaries and its ability to receive funds from its subsidiaries through dividend and other payments. The subsidiary guarantors are 100% owned subsidiaries of QD LLC and have fully and unconditionally guaranteed the 9% Notes and the 2012 Notes, and the 2013 Senior Notes and the 2013 PIK Notes on a joint and several basis.
QDI has no significant restrictions on its ability to receive funds from its subsidiaries. The ABL Facility and the indentures governing our 2013 Senior Notes and our 2013 PIK Notes contain certain limitations on QD LLC’s ability to make distributions to QDI. We do not consider these restrictions to be significant, because QDI is a holding company with no significant operations or assets, other than ownership of 100% of QD LLC’s membership units. QD LLC’s direct and indirect wholly owned subsidiaries are generally permitted to make distributions to QD LLC, which is the principal obligor under the ABL Facility, the 9% Notes, the 2012 Notes, the 2013 Senior Notes and the 2013 PIK Notes.
We have not presented separate financial statements and other disclosures concerning subsidiary guarantors because management has determined such information is not material to the holders of the above-mentioned notes.
The following condensed consolidating financial information for QDI, QD LLC, QD Capital, which has no assets or operations), non-guarantor subsidiaries and combined guarantor subsidiaries presents:
| • | Condensed consolidating balance sheets at December 31, 2009 and 2008 and condensed consolidating statements of operations and of cash flows for each of the three years ended December 31, 2009, 2008 and 2007. |
| • | Elimination entries necessary to consolidate the parent company and all its subsidiaries. |
F-52
Table of Contents
Quality Distribution, Inc. and Subsidiaries
Notes to Consolidated Financial Statements—(Continued)
For the Years Ended December 31, 2009, 2008 and 2007
Condensed Consolidating Statement of Operations
For the Year Ended December 31, 2009
(in thousands)
| QDI | QD LLC & QD Capital |
Guarantor Subsidiaries |
Non-Guarantor Subsidiaries |
Eliminations | Consolidated | ||||||||||||||||||
| Operating revenues: |
|||||||||||||||||||||||
| Transportation |
$ | — | $ | — | $ | 454,658 | $ | — | $ | — | $ | 454,658 | |||||||||||
| Other service revenue |
— | — | 104,716 | 238 | — | 104,954 | |||||||||||||||||
| Fuel surcharge |
— | — | 53,997 | — | — | 53,997 | |||||||||||||||||
| Total operating revenues |
— | — | 613,371 | 238 | — | 613,609 | |||||||||||||||||
| Operating expenses: |
|||||||||||||||||||||||
| Purchased transportation |
— | — | 373,539 | — | — | 373,539 | |||||||||||||||||
| Compensation |
— | — | 76,955 | — | — | 76,955 | |||||||||||||||||
| Fuel, supplies and maintenance |
— | — | 62,448 | — | — | 62,448 | |||||||||||||||||
| Depreciation and amortization |
— | — | 20,218 | — | — | 20,218 | |||||||||||||||||
| Selling and administrative |
— | 268 | 24,259 | 45 | 24,572 | ||||||||||||||||||
| Insurance costs |
— | — | 14,096 | 23 | — | 14,119 | |||||||||||||||||
| Taxes and licenses |
— | — | 3,578 | — | — | 3,578 | |||||||||||||||||
| Communication and utilities |
— | — | 7,910 | — | — | 7,910 | |||||||||||||||||
| Gain on sale of tank wash assets |
— | — | (7,130 | ) | — | — | (7,130 | ) | |||||||||||||||
| Loss on disposal of property and equipment |
— | — | 450 | — | — | 450 | |||||||||||||||||
| Impairment charge |
— | — | 148,630 | — | — | 148,630 | |||||||||||||||||
| Restructuring costs |
— | — | 3,496 | — | — | 3,496 | |||||||||||||||||
| Operating (loss) income |
— | (268 | ) | (115,078 | ) | 170 | — | (115,176 | ) | ||||||||||||||
| Interest (income) expense, non-related party, net |
(5 | ) | 25,689 | 2,412 | (49 | ) | — | 28,047 | |||||||||||||||
| Interest (income) expense, related party, net |
— | (25,689 | ) | 26,116 | (427 | ) | — | — | |||||||||||||||
| Gain on extinguishment of debt |
— | (1,870 | ) | — | — | — | (1,870 | ) | |||||||||||||||
| Other expense (income) |
— | 2,343 | (206 | ) | (205 | ) | — | 1,932 | |||||||||||||||
| Income (loss) before income taxes |
5 | (741 | ) | (143,400 | ) | 851 | — | (143,285 | ) | ||||||||||||||
| Provision for income taxes |
119 | — | 37,038 | 92 | — | 37,249 | |||||||||||||||||
| Equity in loss of subsidiaries |
(180,420 | ) | (179,679 | ) | — | — | 360,099 | — | |||||||||||||||
| Net (loss) income |
$ | (180,534 | ) | $ | (180,420 | ) | $ | (180,438 | ) | $ | 759 | $ | 360,099 | $ | (180,534 | ) | |||||||
F-53
Table of Contents
Quality Distribution, Inc. and Subsidiaries
Notes to Consolidated Financial Statements—(Continued)
For the Years Ended December 31, 2009, 2008 and 2007
Condensed Consolidating Statement of Operations
For the Year Ended December 31, 2008
(in thousands)
| QDI | QD LLC & QD Capital |
Guarantor Subsidiaries |
Non-Guarantor Subsidiaries |
Eliminations | Consolidated | |||||||||||||||||||
| Operating revenues: |
||||||||||||||||||||||||
| Transportation |
$ | — | $ | — | $ | 565,814 | $ | — | $ | — | $ | 565,814 | ||||||||||||
| Other service revenue |
— | — | 103,661 | 378 | — | 104,039 | ||||||||||||||||||
| Fuel surcharge |
— | — | 145,437 | — | — | 145,437 | ||||||||||||||||||
| Total operating revenues |
— | — | 814,912 | 378 | — | 815,290 | ||||||||||||||||||
| Operating expenses: |
||||||||||||||||||||||||
| Purchased transportation |
— | — | 466,823 | — | — | 466,823 | ||||||||||||||||||
| Compensation |
— | — | 109,110 | — | — | 109,110 | ||||||||||||||||||
| Fuel, supplies and maintenance |
— | — | 114,351 | — | — | 114,351 | ||||||||||||||||||
| Depreciation and amortization |
— | — | 21,024 | (22 | ) | — | 21,002 | |||||||||||||||||
| Selling and administrative |
— | 234 | 35,539 | 63 | 35,836 | |||||||||||||||||||
| Insurance costs |
— | — | 15,007 | (8 | ) | — | 14,999 | |||||||||||||||||
| Taxes and licenses |
— | — | 5,241 | 1 | — | 5,242 | ||||||||||||||||||
| Communication and utilities |
— | — | 12,716 | — | — | 12,716 | ||||||||||||||||||
| (Gain) loss on disposal of property and equipment |
— | — | (3,067 | ) | (25 | ) | — | (3,092 | ) | |||||||||||||||
| Restructuring costs |
— | — | 5,325 | — | — | 5,325 | ||||||||||||||||||
| Operating (loss) income |
— | (234 | ) | 32,843 | 369 | — | 32,978 | |||||||||||||||||
| Interest (income) expense, non-related party, net |
(16 | ) | 33,150 | 2,086 | (100 | ) | — | 35,120 | ||||||||||||||||
| Interest (income) expense, related party, net |
— | (33,150 | ) | 33,669 | (519 | ) | — | — | ||||||||||||||||
| Write-off of debt issuance costs |
— | 283 | — | — | — | 283 | ||||||||||||||||||
| Gain on extinguishment of debt |
— | (16,532 | ) | — | — | — | (16,532 | ) | ||||||||||||||||
| Other (income) expense |
— | — | (2,831 | ) | (114 | ) | — | (2,945 | ) | |||||||||||||||
| Income (loss) before income taxes |
16 | 16,015 | (81 | ) | 1,102 | — | 17,052 | |||||||||||||||||
| Provision for (benefit from) income taxes |
18 | — | 4,643 | 279 | — | 4,940 | ||||||||||||||||||
| Equity in earnings (loss) of subsidiaries |
12,114 | (3,901 | ) | — | — | (8,213 | ) | — | ||||||||||||||||
| Net income (loss) |
$ | 12,112 | $ | 12,114 | $ | (4,724 | ) | $ | 823 | $ | (8,213 | ) | $ | 12,112 | ||||||||||
F-54
Table of Contents
Quality Distribution, Inc. and Subsidiaries
Notes to Consolidated Financial Statements—(Continued)
For the Years Ended December 31, 2009, 2008 and 2007
Condensed Consolidating Statement of Operations
For the Year Ended December 31, 2007
(in thousands)
| QDI | QD LLC & QD Capital |
Guarantor Subsidiaries |
Non-Guarantor Subsidiaries |
Eliminations | Consolidated | ||||||||||||||||||
| Operating revenues: |
|||||||||||||||||||||||
| Transportation |
$ | — | $ | — | $ | 580,676 | $ | — | $ | — | $ | 580,676 | |||||||||||
| Other service revenue |
— | — | 75,444 | 777 | — | 76,221 | |||||||||||||||||
| Fuel surcharge |
— | — | 94,661 | — | — | 94,661 | |||||||||||||||||
| Total operating revenues |
— | — | 750,781 | 777 | — | 751,558 | |||||||||||||||||
| Operating expenses: |
|||||||||||||||||||||||
| Purchased transportation |
— | — | 471,531 | — | — | 471,531 | |||||||||||||||||
| Compensation |
— | — | 85,838 | (18 | ) | — | 85,820 | ||||||||||||||||
| Fuel, supplies and maintenance |
— | — | 81,316 | — | — | 81,316 | |||||||||||||||||
| Depreciation and amortization |
— | — | 16,903 | 641 | — | 17,544 | |||||||||||||||||
| Selling and administrative |
1 | 1 | 31,166 | 123 | — | 31,291 | |||||||||||||||||
| Insurance costs |
— | — | 23,883 | — | — | 23,883 | |||||||||||||||||
| Taxes and licenses |
— | — | 3,980 | — | — | 3,980 | |||||||||||||||||
| Communication and utilities |
— | — | 11,381 | — | — | 11,381 | |||||||||||||||||
| Loss (gain) on disposal of property and equipment |
— | — | 1,150 | (191 | ) | — | 959 | ||||||||||||||||
| Operating (loss) income |
(1 | ) | (1 | ) | 23,633 | 222 | — | 23,853 | |||||||||||||||
| Interest (income) expense, non-related party, net |
(6 | ) | 29,580 | 1,025 | (75 | ) | — | 30,524 | |||||||||||||||
| Interest (income) expense, related party, net |
— | (29,019 | ) | 29,500 | (481 | ) | — | — | |||||||||||||||
| Write-off of debt issuance costs |
— | 2,031 | — | — | — | 2,031 | |||||||||||||||||
| Other expense (income) |
5 | 1,555 | (234 | ) | (386 | ) | — | 940 | |||||||||||||||
| (Loss) income before income taxes |
— | (4,148 | ) | (6,658 | ) | 1,164 | — | (9,642 | ) | ||||||||||||||
| (Benefit from) provision for income taxes |
(981 | ) | — | (1,562 | ) | 464 | — | (2,079 | ) | ||||||||||||||
| Equity in loss of subsidiaries |
(8,544 | ) | (4,396 | ) | — | — | 12,940 | — | |||||||||||||||
| Net (loss) income |
$ | (7,563 | ) | $ | (8,544 | ) | $ | (5,096 | ) | $ | 700 | $ | 12,940 | $ | (7,563 | ) | |||||||
F-55
Table of Contents
Quality Distribution, Inc. and Subsidiaries
Notes to Consolidated Financial Statements—(Continued)
For the Years Ended December 31, 2009, 2008 and 2007
Consolidating Balance Sheet, December 31, 2009
(in thousands)
| QDI | QD LLC and QD Capital |
Guarantor Subsidiaries |
Non-Guarantor Subsidiaries |
Eliminations | Consolidated | |||||||||||||||||||
| ASSETS |
||||||||||||||||||||||||
| Current Assets: |
||||||||||||||||||||||||
| Cash and cash equivalents |
$ | — | $ | — | $ | 3,531 | $ | 2,102 | $ | — | $ | 5,633 | ||||||||||||
| Accounts receivable, net |
52 | — | 69,477 | 96 | — | 69,625 | ||||||||||||||||||
| Prepaid expenses |
— | 96 | 8,473 | 15 | — | 8,584 | ||||||||||||||||||
| Deferred tax asset, net |
— | — | 5,506 | — | — | 5,506 | ||||||||||||||||||
| Other |
(104 | ) | — | 4,460 | 64 | — | 4,420 | |||||||||||||||||
| Total current assets |
(52 | ) | 96 | 91,447 | 2,277 | — | 93,768 | |||||||||||||||||
| Property and equipment, net |
— | — | 127,329 | — | — | 127,329 | ||||||||||||||||||
| Goodwill |
— | — | 27,023 | — | — | 27,023 | ||||||||||||||||||
| Intangibles, net |
— | — | 18,467 | — | — | 18,467 | ||||||||||||||||||
| Investment in subsidiaries |
(143,830 | ) | 456,186 | 21,229 | — | (333,585 | ) | — | ||||||||||||||||
| Other assets |
— | 9,204 | 3,825 | — | — | 13,029 | ||||||||||||||||||
| Total assets |
$ | (143,882 | ) | $ | 465,486 | $ | 289,320 | $ | 2,277 | $ | (333,585 | ) | $ | 279,616 | ||||||||||
| LIABILITIES, REDEEMABLE NONCONTROLLING INTEREST AND SHAREHOLDERS’ EQUITY (DEFICIT) |
||||||||||||||||||||||||
| Current Liabilities: |
||||||||||||||||||||||||
| Current maturities of indebtedness |
$ | — | $ | 16,031 | $ | 3,835 | $ | — | $ | — | $ | 19,866 | ||||||||||||
| Current maturities of capital lease obligations |
— | — | 5,322 | — | — | 5,322 | ||||||||||||||||||
| Accounts payable |
— | — | 6,182 | — | — | 6,182 | ||||||||||||||||||
| Intercompany |
(2,139 | ) | 312,705 | (283,664 | ) | (5,673 | ) | (21,229 | ) | — | ||||||||||||||
| Affiliates and independent owner-operators payable |
— | — | 9,734 | — | — | 9,734 | ||||||||||||||||||
| Accrued expenses |
— | 5,053 | 16,313 | 12 | — | 21,378 | ||||||||||||||||||
| Environmental liabilities |
— | — | 3,408 | — | — | 3,408 | ||||||||||||||||||
| Accrued loss and damage claims |
— | — | 8,862 | — | — | 8,862 | ||||||||||||||||||
| Total current liabilities |
(2,139 | ) | 333,789 | (230,008 | ) | (5,661 | ) | (21,229 | ) | 74,752 | ||||||||||||||
| Long-term indebtedness, less current maturities |
— | 275,527 | 8,726 | — | — | 284,253 | ||||||||||||||||||
| Capital lease obligations, less current maturities |
— | — | 11,843 | — | — | 11,843 | ||||||||||||||||||
| Environmental liabilities |
— | — | 8,241 | — | — | 8,241 | ||||||||||||||||||
| Accrued loss and damage claims |
— | — | 10,534 | — | — | 10,534 | ||||||||||||||||||
| Other non-current liabilities |
(1,007 | ) | — | 29,044 | 859 | — | 28,896 | |||||||||||||||||
| Total liabilities |
(3,146 | ) | 609,316 | (161,620 | ) | (4,802 | ) | (21,229 | ) | 418,519 | ||||||||||||||
| Redeemable noncontrolling interest in subsidiary |
— | — | 1,833 | — | — | 1,833 | ||||||||||||||||||
| Shareholders’ equity (deficit): |
||||||||||||||||||||||||
| Common Stock |
364,046 | 354,963 | 493,861 | 6,933 | (855,757 | ) | 364,046 | |||||||||||||||||
| Treasury stock |
(1,580 | ) | — | — | — | — | (1,580 | ) | ||||||||||||||||
| Accumulated (deficit) retained earnings |
(294,568 | ) | (290,784 | ) | (20,611 | ) | 1,174 | 310,221 | (294,568 | ) | ||||||||||||||
| Stock recapitalization |
(189,589 | ) | (189,589 | ) | — | (55 | ) | 189,644 | (189,589 | ) | ||||||||||||||
| Accumulated other comprehensive loss |
(25,587 | ) | (25,116 | ) | (24,143 | ) | (973 | ) | 50,232 | (25,587 | ) | |||||||||||||
| Stock purchase warrants |
6,696 | 6,696 | — | — | (6,696 | ) | 6,696 | |||||||||||||||||
| Stock subscriptions receivable |
(154 | ) | — | — | — | — | (154 | ) | ||||||||||||||||
| Total shareholders’ (deficit) equity |
(140,736 | ) | (143,830 | ) | 449,107 | 7,079 | (312,356 | ) | (140,736 | ) | ||||||||||||||
| Total liabilities, redeemable noncontrolling interest and shareholders’ (deficit) equity |
$ | (143,882 | ) | $ | 465,486 | $ | 289,320 | $ | 2,277 | $ | (333,585 | ) | $ | 279,616 | ||||||||||
F-56
Table of Contents
Quality Distribution, Inc. and Subsidiaries
Notes to Consolidated Financial Statements—(Continued)
For the Years Ended December 31, 2009, 2008 and 2007
Consolidating Balance Sheet, December 31, 2008
(in thousands)
| QDI | QD LLC and QD Capital |
Guarantor Subsidiaries |
Non-
Guarantor Subsidiaries |
Eliminations | Consolidated | |||||||||||||||||||
| ASSETS |
||||||||||||||||||||||||
| Current Assets: |
||||||||||||||||||||||||
| Cash and cash equivalents |
$ | — | $ | — | $ | 4,725 | $ | 2,062 | $ | — | $ | 6,787 | ||||||||||||
| Accounts receivable, net |
71 | — | 81,470 | 71 | — | 81,612 | ||||||||||||||||||
| Prepaid expenses |
— | 96 | 12,811 | 15 | — | 12,922 | ||||||||||||||||||
| Deferred tax asset, net |
— | — | 14,707 | — | — | 14,707 | ||||||||||||||||||
| Other |
(9 | ) | — | 7,888 | 71 | — | 7,950 | |||||||||||||||||
| Total current assets |
62 | 96 | 121,601 | 2,219 | — | 123,978 | ||||||||||||||||||
| Property and equipment, net |
— | — | 148,692 | — | — | 148,692 | ||||||||||||||||||
| Goodwill |
— | — | 173,519 | — | — | 173,519 | ||||||||||||||||||
| Intangibles, net |
— | — | 22,698 | — | — | 22,698 | ||||||||||||||||||
| Investment in subsidiaries |
28,523 | 635,195 | 21,234 | — | (684,952 | ) | — | |||||||||||||||||
| Non-current deferred tax asset, net |
1,007 | — | 21,629 | — | — | 22,636 | ||||||||||||||||||
| Other assets |
— | 9,496 | 1,084 | — | — | 10,580 | ||||||||||||||||||
| Total assets |
$ | 29,592 | $ | 644,787 | $ | 510,457 | $ | 2,219 | $ | (684,952 | ) | $ | 502,103 | |||||||||||
| LIABILITIES, REDEEMABLE NONCONTROLLING INTEREST AND SHAREHOLDERS’ EQUITY (DEFICIT) |
||||||||||||||||||||||||
| Current Liabilities: |
||||||||||||||||||||||||
| Current maturities of indebtedness |
$ | — | $ | 2,500 | $ | 5,861 | $ | — | $ | — | $ | 8,361 | ||||||||||||
| Current maturities of capital lease obligations |
— | — | 7,994 | — | — | 7,994 | ||||||||||||||||||
| Accounts payable |
— | — | 16,126 | — | — | 16,126 | ||||||||||||||||||
| Intercompany |
(1,428 | ) | 289,974 | (261,748 | ) | (5,564 | ) | (21,234 | ) | — | ||||||||||||||
| Affiliates and independent owner-operators payable |
— | — | 7,649 | — | — | 7,649 | ||||||||||||||||||
| Accrued expenses |
— | 4,375 | 20,970 | 12 | — | 25,357 | ||||||||||||||||||
| Environmental liabilities |
— | — | 4,819 | — | — | 4,819 | ||||||||||||||||||
| Accrued loss and damage claims |
— | — | 8,705 | — | — | 8,705 | ||||||||||||||||||
| Total current liabilities |
(1,428 | ) | 296,849 | (189,624 | ) | (5,552 | ) | (21,234 | ) | 79,011 | ||||||||||||||
| Long-term indebtedness, less current maturities |
— | 319,415 | 10,994 | — | — | 330,409 | ||||||||||||||||||
| Capital lease obligations, less current maturities |
— | — | 15,822 | — | — | 15,822 | ||||||||||||||||||
| Environmental liabilities |
— | — | 6,035 | — | — | 6,035 | ||||||||||||||||||
| Accrued loss and damage claims |
— | — | 12,815 | — | — | 12,815 | ||||||||||||||||||
| Other non-current liabilities |
— | — | 24,383 | 775 | — | 25,158 | ||||||||||||||||||
| Total liabilities |
(1,428 | ) | 616,264 | (119,575 | ) | (4,777 | ) | (21,234 | ) | 469,250 | ||||||||||||||
| Redeemable noncontrolling interest in subsidiary |
— | — | 1,833 | — | — | 1,833 | ||||||||||||||||||
| Shareholders’ equity (deficit): |
||||||||||||||||||||||||
| Common Stock |
362,945 | 354,963 | 493,866 | 7,629 | (856,458 | ) | 362,945 | |||||||||||||||||
| Treasury stock |
(1,580 | ) | — | — | — | — | (1,580 | ) | ||||||||||||||||
| Accumulated (deficit) retained earnings |
(114,034 | ) | (110,364 | ) | 159,827 | 415 | (49,878 | ) | (114,034 | ) | ||||||||||||||
| Stock recapitalization |
(189,589 | ) | (189,589 | ) | — | (55 | ) | 189,644 | (189,589 | ) | ||||||||||||||
| Accumulated other comprehensive income |
(26,488 | ) | (26,487 | ) | (25,494 | ) | (993 | ) | 52,974 | (26,488 | ) | |||||||||||||
| Stock subscriptions receivable |
(234 | ) | — | — | — | — | (234 | ) | ||||||||||||||||
| Total shareholders’ equity (deficit) |
31,020 | 28,523 | 628,199 | 6,996 | (663,718 | ) | 31,020 | |||||||||||||||||
| Total liabilities, redeemable noncontrolling interest and shareholders’ equity (deficit) |
$ | 29,592 | $ | 644,787 | $ | 510,457 | $ | 2,219 | $ | (684,952 | ) | $ | 502,103 | |||||||||||
F-57
Table of Contents
Quality Distribution, Inc. and Subsidiaries
Notes to Consolidated Financial Statements—(Continued)
For the Years Ended December 31, 2009, 2008 and 2007
Condensed Consolidating Statement of Cash Flows
For the Year Ended December 31, 2009
(in thousands)
| QDI | QD LLC and QD Capital |
Guarantor Subsidiaries |
Non-Guarantor Subsidiaries |
Eliminations | Consolidated | |||||||||||||||||||
| Cash flows from operating activities: |
||||||||||||||||||||||||
| Net (loss) income |
$ | (180,534 | ) | $ | (180,420 | ) | $ | (180,438 | ) | $ | 759 | $ | 360,099 | $ | (180,534 | ) | ||||||||
| Adjustments for non-cash charges |
180,420 | 159,261 | 228,567 | (427 | ) | (360,099 | ) | 207,722 | ||||||||||||||||
| Net changes in assets and liabilities |
(893 | ) | 970 | 12,482 | 9 | — | 12,568 | |||||||||||||||||
| Intercompany activity |
1,007 | 20,189 | (20,895 | ) | (301 | ) | — | — | ||||||||||||||||
| Net cash provided by operating activities |
— | — | 39,716 | 40 | — | 39,756 | ||||||||||||||||||
| Cash flows from investing activities: |
||||||||||||||||||||||||
| Capital expenditures |
— | — | (8,221 | ) | — | — | (8,221 | ) | ||||||||||||||||
| Boasso purchase adjustment |
— | 266 | — | — | — | 266 | ||||||||||||||||||
| Proceeds from sale of tank wash assets |
— | — | 10,000 | — | — | 10,000 | ||||||||||||||||||
| Proceeds from sales of property and equipment |
— | — | 7,532 | — | — | 7,532 | ||||||||||||||||||
| Net cash used in investing activities |
— | 266 | 9,311 | — | — | 9,577 | ||||||||||||||||||
| Cash flows from financing activities: |
||||||||||||||||||||||||
| Proceeds from issuance of long-term debt |
— | — | — | — | — | — | ||||||||||||||||||
| Principal payments on long-term debt and capital lease obligations |
— | (4,618 | ) | (13,124 | ) | — | — | (17,742 | ) | |||||||||||||||
| Proceeds from revolver |
— | 28,600 | — | — | — | 28,600 | ||||||||||||||||||
| Payments on revolver |
— | (47,600 | ) | — | — | — | (47,600 | ) | ||||||||||||||||
| Financing costs |
— | (2,323 | ) | — | — | — | (2,323 | ) | ||||||||||||||||
| Deferred financing costs |
— | (2,554 | ) | — | — | — | (2,554 | ) | ||||||||||||||||
| Other |
— | (145 | ) | (8,751 | ) | — | — | (8,896 | ) | |||||||||||||||
| Intercompany activity |
— | 28,374 | (28,374 | ) | — | — | — | |||||||||||||||||
| Net cash used in financing activities |
— | (266 | ) | (50,249 | ) | — | — | (50,515 | ) | |||||||||||||||
| Effect of exchange rate changes on cash |
— | — | 28 | — | — | 28 | ||||||||||||||||||
| Net (decrease) increase in cash and cash equivalents |
— | — | (1,194 | ) | 40 | — | (1,154 | ) | ||||||||||||||||
| Cash and cash equivalents, beginning of period |
— | — | 4,725 | 2,062 | — | 6,787 | ||||||||||||||||||
| Cash and cash equivalents, end of period |
$ | — | $ | — | $ | 3,531 | $ | 2,102 | $ | — | $ | 5,633 | ||||||||||||
F-58
Table of Contents
Quality Distribution, Inc. and Subsidiaries
Notes to Consolidated Financial Statements—(Continued)
For the Years Ended December 31, 2009, 2008 and 2007
Condensed Consolidating Statement of Cash Flows
For the Year Ended December 31, 2008
(in thousands)
| QDI | QD LLC and QD Capital |
Guarantor Subsidiaries |
Non-Guarantor Subsidiaries |
Eliminations | Consolidated | |||||||||||||||||||
| Cash flows from operating activities: |
||||||||||||||||||||||||
| Net income (loss) |
$ | 12,112 | $ | 12,114 | $ | (4,724 | ) | $ | 823 | $ | (8,213 | ) | $ | 12,112 | ||||||||||
| Adjustments for non-cash charges |
(12,112 | ) | (45,149 | ) | 53,353 | (47 | ) | 8,213 | 4,258 | |||||||||||||||
| Net changes in assets and liabilities |
8 | 2,936 | (18 | ) | 297 | — | 3,223 | |||||||||||||||||
| Intercompany activity |
(8 | ) | 30,099 | (29,111 | ) | (980 | ) | — | — | |||||||||||||||
| Net cash provided by operating activities |
— | — | 19,500 | 93 | — | 19,593 | ||||||||||||||||||
| Cash flows from investing activities: |
||||||||||||||||||||||||
| Capital expenditures |
— | — | (14,791 | ) | — | — | (14,791 | ) | ||||||||||||||||
| Acquisition of businesses and assets |
— | — | (1,399 | ) | — | — | (1,399 | ) | ||||||||||||||||
| Boasso purchase adjustment |
— | 1,318 | — | — | — | 1,318 | ||||||||||||||||||
| Proceeds from sales of property and equipment |
— | — | 6,348 | — | — | 6,348 | ||||||||||||||||||
| Net cash provided by (used in) investing activities |
— | 1,318 | (9,842 | ) | — | — | (8,524 | ) | ||||||||||||||||
| Cash flows from financing activities: |
||||||||||||||||||||||||
| Proceeds from issuance of long-term debt |
— | — | 1,049 | — | — | 1,049 | ||||||||||||||||||
| Principal payments on long-term debt and capital lease obligations |
— | (7,707 | ) | (9,028 | ) | — | — | (16,735 | ) | |||||||||||||||
| Proceeds from revolver |
— | 115,700 | — | — | — | 115,700 | ||||||||||||||||||
| Payments on revolver |
— | (112,830 | ) | — | — | — | (112,830 | ) | ||||||||||||||||
| Deferred financing costs |
— | (860 | ) | — | — | (860 | ) | |||||||||||||||||
| Other |
20 | (145 | ) | 316 | — | — | 191 | |||||||||||||||||
| Intercompany activity |
(20 | ) | 4,524 | (4,504 | ) | — | — | — | ||||||||||||||||
| Net cash used in financing activities |
— | (1,318 | ) | (12,167 | ) | — | — | (13,485 | ) | |||||||||||||||
| Effect of exchange rate changes on cash |
— | — | (105 | ) | (403 | ) | — | (508 | ) | |||||||||||||||
| Net decrease in cash and cash equivalents |
— | — | (2,614 | ) | (310 | ) | — | (2,924 | ) | |||||||||||||||
| Cash and cash equivalents, beginning of period |
— | — | 7,339 | 2,372 | — | 9,711 | ||||||||||||||||||
| Cash and cash equivalents, end of period |
$ | — | $ | — | $ | 4,725 | $ | 2,062 | $ | — | $ | 6,787 | ||||||||||||
F-59
Table of Contents
Quality Distribution, Inc. and Subsidiaries
Notes to Consolidated Financial Statements—(Continued)
For the Years Ended December 31, 2009, 2008 and 2007
Condensed Consolidating Statement of Cash Flows
For the Year Ended December 31, 2007
(in thousands)
| QDI | QD LLC and QD Capital |
Guarantor Subsidiaries |
Non-Guarantor Subsidiaries |
Eliminations | Consolidated | |||||||||||||||||||
| Cash flows from operating activities: |
||||||||||||||||||||||||
| Net (loss) income |
$ | (7,563 | ) | $ | (8,544 | ) | $ | (5,096 | ) | $ | 700 | $ | 12,940 | $ | (7,563 | ) | ||||||||
| Adjustments for non-cash charges |
7,563 | (24,699 | ) | 49,795 | 837 | (12,940 | ) | 20,556 | ||||||||||||||||
| Net changes in assets and liabilities |
(753 | ) | 218 | 725 | 869 | — | 1,059 | |||||||||||||||||
| Intercompany activity |
753 | 33,025 | (31,220 | ) | (2,558 | ) | — | — | ||||||||||||||||
| Net cash provided by (used in) operating activities |
— | — | 14,204 | (152 | ) | — | 14,052 | |||||||||||||||||
| Cash flows from investing activities: |
||||||||||||||||||||||||
| Capital expenditures |
— | — | (10,557 | ) | — | — | (10,557 | ) | ||||||||||||||||
| Acquisition of Boasso and business assets |
— | (60,251 | ) | — | — | — | (60,251 | ) | ||||||||||||||||
| Cash acquired in Boasso acquisition |
— | 1,015 | — | — | — | 1,015 | ||||||||||||||||||
| Proceeds from sales of property and equipment |
— | — | 5,325 | 1,069 | — | 6,394 | ||||||||||||||||||
| Net cash (used in) provided by investing activities |
— | (59,236 | ) | (5,232 | ) | 1,069 | — | (63,399 | ) | |||||||||||||||
| Cash flows from financing activities: |
||||||||||||||||||||||||
| Proceeds from the issuance of debt |
— | 46,809 | — | — | — | 46,809 | ||||||||||||||||||
| Principal payments of long-term debt and capital lease obligations |
— | (64,746 | ) | (2,500 | ) | — | — | (67,246 | ) | |||||||||||||||
| Proceeds from revolver |
— | 123,030 | — | — | — | 123,030 | ||||||||||||||||||
| Payments on revolver |
— | (41,400 | ) | — | — | — | (41,400 | ) | ||||||||||||||||
| Deferred financing fees |
— | (9,170 | ) | — | — | — | (9,170 | ) | ||||||||||||||||
| Other |
(717 | ) | (145 | ) | 1,033 | — | — | 171 | ||||||||||||||||
| Intercompany activity |
717 | 4,858 | (5,575 | ) | — | — | — | |||||||||||||||||
| Net cash provided by (used in) financing activities |
— | 59,236 | (7,042 | ) | — | — | 52,194 | |||||||||||||||||
| Effect of exchange rate changes on cash |
— | — | 23 | — | — | 23 | ||||||||||||||||||
| Net increase in cash and cash equivalents |
— | — | 1,953 | 917 | — | 2,870 | ||||||||||||||||||
| Cash and cash equivalents, beginning of period |
— | — | 5,386 | 1,455 | — | 6,841 | ||||||||||||||||||
| Cash and cash equivalents, end of period |
$ | — | $ | — | $ | 7,339 | $ | 2,372 | $ | — | $ | 9,711 | ||||||||||||
F-60
Table of Contents
Quality Distribution, Inc. and Subsidiaries
Unaudited Consolidated Financial Statements
As of June 30, 2010 and December 31, 2009 and for the
Three and Six Months Ended June 30, 2010 and 2009
F-61
Table of Contents
Quality Distribution, Inc. and Subsidiaries
Consolidated Statements of Operations
(Unaudited—in 000’s, Except Per Share Amounts)
| Three months ended June 30, |
Six months ended June 30, |
|||||||||||||||
| 2010 | 2009 | 2010 | 2009 | |||||||||||||
| OPERATING REVENUES: |
||||||||||||||||
| Transportation |
$ | 129,473 | $ | 112,083 | $ | 248,390 | $ | 223,110 | ||||||||
| Other service revenue |
26,473 | 25,840 | 51,379 | 53,448 | ||||||||||||
| Fuel surcharge |
21,606 | 11,863 | 39,116 | 22,960 | ||||||||||||
| Total operating revenues |
177,552 | 149,786 | 338,885 | 299,518 | ||||||||||||
| OPERATING EXPENSES: |
||||||||||||||||
| Purchased transportation |
123,071 | 88,985 | 233,975 | 170,876 | ||||||||||||
| Compensation |
14,980 | 19,540 | 28,872 | 42,751 | ||||||||||||
| Fuel, supplies and maintenance |
12,054 | 15,922 | 24,342 | 33,462 | ||||||||||||
| Depreciation and amortization |
4,067 | 5,304 | 8,310 | 10,639 | ||||||||||||
| Selling and administrative |
4,449 | 6,877 | 9,227 | 14,022 | ||||||||||||
| Insurance costs |
4,540 | 3,946 | 7,877 | 7,995 | ||||||||||||
| Taxes and licenses |
674 | 736 | 1,270 | 2,073 | ||||||||||||
| Communication and utilities |
1,192 | 2,074 | 2,238 | 4,808 | ||||||||||||
| Loss (gain) on disposal of property and equipment |
234 | (162 | ) | 652 | (265 | ) | ||||||||||
| Impairment charge |
— | 148,630 | — | 148,630 | ||||||||||||
| Restructuring costs |
1,068 | 1,165 | 2,215 | 1,765 | ||||||||||||
| Total operating expenses |
166,329 | 293,017 | 318,978 | 436,756 | ||||||||||||
| Operating income (loss) |
11,223 | (143,231 | ) | 19,907 | (137,238 | ) | ||||||||||
| Interest expense |
8,640 | 6,518 | 17,307 | 13,518 | ||||||||||||
| Interest income |
(156 | ) | (83 | ) | (317 | ) | (186 | ) | ||||||||
| Gain on extinguishment of debt |
— | — | — | (675 | ) | |||||||||||
| Other expense (income) |
220 | (419 | ) | 226 | (276 | ) | ||||||||||
| Income (loss) before income taxes |
2,519 | (149,247 | ) | 2,691 | (149,619 | ) | ||||||||||
| Provision for (benefit from) income taxes |
463 | 36,980 | (163 | ) | 36,910 | |||||||||||
| Net income (loss) |
$ | 2,056 | $ | (186,227 | ) | $ | 2,854 | $ | (186,529 | ) | ||||||
| PER SHARE DATA: |
||||||||||||||||
| Net income (loss) per common share |
||||||||||||||||
| Basic |
$ | 0.10 | $ | (9.58 | ) | $ | 0.14 | $ | (9.65 | ) | ||||||
| Diluted |
$ | 0.09 | $ | (9.58 | ) | $ | 0.13 | $ | (9.65 | ) | ||||||
| Weighted-average number of shares |
||||||||||||||||
| Basic |
20,256 | 19,441 | 19,880 | 19,331 | ||||||||||||
| Diluted |
21,748 | 19,441 | 21,585 | 19,331 | ||||||||||||
The accompanying notes are an integral part of these consolidated financial statements.
F-62
Table of Contents
Quality Distribution, Inc. and Subsidiaries
Consolidated Balance Sheets
(In 000’s)
Unaudited
| June 30, 2010 |
December 31, 2009 |
|||||||
| ASSETS |
||||||||
| Current assets: |
||||||||
| Cash and cash equivalents |
$ | 2,892 | $ | 5,633 | ||||
| Accounts receivable, net |
88,381 | 69,625 | ||||||
| Prepaid expenses |
7,325 | 8,584 | ||||||
| Deferred tax asset, net |
5,212 | 5,506 | ||||||
| Other |
6,192 | 4,420 | ||||||
| Total current assets |
110,002 | 93,768 | ||||||
| Property and equipment, net |
122,230 | 127,329 | ||||||
| Goodwill |
27,023 | 27,023 | ||||||
| Intangibles, net |
17,671 | 18,467 | ||||||
| Other assets |
14,774 | 13,029 | ||||||
| Total assets |
$ | 291,700 | $ | 279,616 | ||||
| LIABILITIES, REDEEMABLE NONCONTROLLING INTEREST AND SHAREHOLDERS’ DEFICIT |
||||||||
| Current liabilities: |
||||||||
| Current maturities of indebtedness |
$ | 18,978 | $ | 19,866 | ||||
| Current maturities of capital lease obligations |
4,358 | 5,322 | ||||||
| Accounts payable |
9,097 | 6,182 | ||||||
| Independent affiliates and independent owner-operators payable |
12,815 | 9,734 | ||||||
| Accrued expenses |
17,253 | 21,378 | ||||||
| Environmental liabilities |
4,904 | 3,408 | ||||||
| Accrued loss and damage claims |
7,334 | 8,862 | ||||||
| Total current liabilities |
74,739 | 74,752 | ||||||
| Long-term indebtedness, less current maturities |
298,050 | 284,253 | ||||||
| Capital lease obligations, less current maturities |
9,799 | 11,843 | ||||||
| Environmental liabilities |
6,439 | 8,241 | ||||||
| Accrued loss and damage claims |
9,519 | 10,534 | ||||||
| Other non-current liabilities |
27,459 | 28,896 | ||||||
| Total liabilities |
426,005 | 418,519 | ||||||
| Commitments and contingencies—Note 12 |
||||||||
| Redeemable noncontrolling interest |
1,833 | 1,833 | ||||||
| SHAREHOLDERS’ DEFICIT |
||||||||
| Common stock, no par value; 49,000 shares authorized; 21,674 issued and 21,454 outstanding at June 30, 2010 and 20,297 issued and 20,077 outstanding at December 31, 2009, respectively |
370,126 | 364,046 | ||||||
| Treasury stock, 220 shares at June 30, 2010 and December 31, 2009 |
(1,580 | ) | (1,580 | ) | ||||
| Accumulated deficit |
(291,714 | ) | (294,568 | ) | ||||
| Stock recapitalization |
(189,589 | ) | (189,589 | ) | ||||
| Accumulated other comprehensive loss |
(24,944 | ) | (25,587 | ) | ||||
| Stock purchase warrants |
1,696 | 6,696 | ||||||
| Stock subscriptions receivable |
(133 | ) | (154 | ) | ||||
| Total shareholders’ deficit |
(136,138 | ) | (140,736 | ) | ||||
| Total liabilities, redeemable noncontrolling interest and shareholders’ deficit |
$ | 291,700 | $ | 279,616 | ||||
The accompanying notes are an integral part of these consolidated financial statements.
F-63
Table of Contents
Quality Distribution, Inc. and Subsidiaries
Consolidated Statements of Shareholders’ Deficit
For the Six Months Ended June 30, 2010 and 2009
Unaudited (In 000’s)
| Shares of Common Stock |
Shares of Treasury Stock |
Common Stock |
Treasury Stock |
Accumulated Deficit |
Stock Recapitalization |
Accumulated Other Comprehensive Loss |
Stock Purchase Warrants |
Stock Subscription Receivables |
Total Shareholders’ Deficit |
|||||||||||||||||||||||||||
| Balance, December 31, 2008 |
19,754 | (205 | ) | $ | 362,945 | $ | (1,580 | ) | $ | (114,034 | ) | $ | (189,589 | ) | $ | (26,488 | ) | $ | — | $ | (234 | ) | $ | 31,020 | ||||||||||||
| Net loss |
— | — | — | — | (186,529 | ) | — | — | — | — | (186,529 | ) | ||||||||||||||||||||||||
| Issuance of restricted stock |
103 | — | — | — | — | — | — | — | — | — | ||||||||||||||||||||||||||
| Amortization of restricted stock |
— | — | 106 | — | — | — | — | — | — | 106 | ||||||||||||||||||||||||||
| Amortization of stock options |
— | — | 206 | — | — | — | — | — | — | 206 | ||||||||||||||||||||||||||
| Amortization of prior service costs and losses (pension plans), net of tax |
— | — | — | — | — | — | 624 | — | — | 624 | ||||||||||||||||||||||||||
| Foreign currency translation adjustment, net of tax |
— | — | — | — | — | — | 5 | — | — | 5 | ||||||||||||||||||||||||||
| Balance, June 30, 2009 |
19,857 | (205 | ) | $ | 363,257 | $ | (1,580 | ) | $ | (300,563 | ) | $ | (189,589 | ) | $ | (25,859 | ) | — | $ | (234 | ) | $ | (154,568 | ) | ||||||||||||
| Balance, December 31, 2009 |
20,297 | (220 | ) | $ | 364,046 | $ | (1,580 | ) | $ | (294,568 | ) | $ | (189,589 | ) | $ | (25,587 | ) | $ | 6,696 | $ | (154 | ) | $ | (140,736 | ) | |||||||||||
| Net income |
— | — | — | — | 2,854 | — | — | — | — | 2,854 | ||||||||||||||||||||||||||
| Issuance of restricted stock |
69 | — | — | — | — | — | — | — | — | — | ||||||||||||||||||||||||||
| Amortization of restricted stock |
— | — | 463 | — | — | — | — | — | — | 463 | ||||||||||||||||||||||||||
| Amortization of stock options |
— | — | 614 | — | — | — | — | — | — | 614 | ||||||||||||||||||||||||||
| Stock warrant exercise |
1,307 | — | 5,000 | — | — | — | — | (5,000 | ) | — | — | |||||||||||||||||||||||||
| Stock option exercise |
1 | — | 3 | — | — | — | — | — | — | 3 | ||||||||||||||||||||||||||
| Forgiveness of stock option receivable |
— | — | — | — | — | — | — | — | 21 | 21 | ||||||||||||||||||||||||||
| Amortization of prior service costs and losses (pension plans), net of tax |
— | — | — | — | — | — | 647 | — | — | 647 | ||||||||||||||||||||||||||
| Foreign currency translation adjustment, net of tax |
— | — | — | — | — | — | (4 | ) | — | — | (4 | ) | ||||||||||||||||||||||||
| Balance, June 30, 2010 |
21,674 | (220 | ) | $ | 370,126 | $ | (1,580 | ) | $ | (291,714 | ) | $ | (189,589 | ) | $ | (24,944 | ) | $ | 1,696 | $ | (133 | ) | $ | (136,138 | ) | |||||||||||
The accompanying notes are an integral part of these consolidated financial statements.
F-64
Table of Contents
Quality Distribution, Inc. and Subsidiaries
Consolidated Statements of Cash Flows
(Unaudited - In 000’s)
| Six Months Ended June 30, |
||||||||
| 2010 | 2009 | |||||||
| CASH FLOWS FROM OPERATING ACTIVITIES: |
||||||||
| Net income (loss) |
$ | 2,854 | $ | (186,529 | ) | |||
| Adjustments to reconcile net income (loss) to net cash (used in) provided by operating activities: |
||||||||
| Deferred income tax benefit |
— | (5,190 | ) | |||||
| Depreciation and amortization |
8,310 | 10,639 | ||||||
| Bad debt (recoveries) expense |
(314 | ) | 930 | |||||
| Loss (gain) on disposal of property and equipment |
652 | (265 | ) | |||||
| Impairment charge |
— | 148,630 | ||||||
| PIK interest on Senior Subordinated Notes |
1,120 | — | ||||||
| Gain on extinguishment of long-term debt |
— | (675 | ) | |||||
| Financing costs |
94 | — | ||||||
| Stock-based compensation |
1,077 | 312 | ||||||
| Amortization of deferred financing costs |
1,353 | 1,422 | ||||||
| Amortization of bond discount |
1,169 | 550 | ||||||
| Redeemable noncontrolling interest dividends |
72 | 72 | ||||||
| Provision for deferred tax asset valuation allowance |
— | 42,534 | ||||||
| Changes in assets and liabilities: |
||||||||
| Accounts and other receivables |
(18,446 | ) | 5,073 | |||||
| Prepaid expenses |
2,216 | 4,434 | ||||||
| Other assets |
(4,152 | ) | 1,819 | |||||
| Accounts payable |
2,318 | (1,254 | ) | |||||
| Accrued expenses |
(4,568 | ) | (4,460 | ) | ||||
| Environmental liabilities |
(305 | ) | 206 | |||||
| Accrued loss and damage claims |
(2,544 | ) | (71 | ) | ||||
| Independent affiliates and independent owner-operators payable |
3,081 | 4,627 | ||||||
| Other liabilities |
28 | 110 | ||||||
| Current income taxes |
(149 | ) | (416 | ) | ||||
| Net cash (used in) provided by operating activities |
(6,134 | ) | 22,498 | |||||
| CASH FLOWS FROM INVESTING ACTIVITIES: |
||||||||
| Capital expenditures |
(5,675 | ) | (5,706 | ) | ||||
| Proceeds from sales of property and equipment |
3,309 | 5,095 | ||||||
| Net cash used in investing activities |
(2,366 | ) | (611 | ) | ||||
| CASH FLOWS FROM FINANCING ACTIVITIES: |
||||||||
| Principal payments on long-term debt |
(2,595 | ) | (5,880 | ) | ||||
| Principal payments on capital lease obligations |
(3,059 | ) | (3,815 | ) | ||||
| Proceeds from revolver |
36,500 | 20,000 | ||||||
| Payments on revolver |
(25,000 | ) | (30,500 | ) | ||||
| Payments on acquisition notes |
(521 | ) | (464 | ) | ||||
| Financing costs |
(94 | ) | — | |||||
| Change in book overdraft |
597 | (5,025 | ) | |||||
| Redeemable noncontrolling interest dividends |
(72 | ) | (72 | ) | ||||
| Proceeds from purchase of stock options |
3 | — | ||||||
| Net cash provided by (used in) financing activities |
5,759 | (25,756 | ) | |||||
| Effect of exchange rate changes on cash |
— | 16 | ||||||
| Net decrease in cash and cash equivalents |
(2,741 | ) | (3,853 | ) | ||||
| Cash and cash equivalents, beginning of period |
5,633 | 6,787 | ||||||
| Cash and cash equivalents, end of period |
$ | 2,892 | $ | 2,934 | ||||
| Supplemental Disclosure of Cash Flow Information |
||||||||
| Cash paid during the period for: |
||||||||
| Interest |
$ | 15,563 | $ | 12,620 | ||||
| Income Taxes |
346 | 686 | ||||||
The accompanying notes are an integral part of these consolidated financial statements.
F-65
Table of Contents
Quality Distribution, Inc. and Subsidiaries
Quality Distribution, Inc. and Subsidiaries
Notes to Consolidated Financial Statements
(Unaudited)
1. Summary of Significant Accounting Policies
Basis of Presentation
In this quarterly report, unless the context otherwise requires or indicates, (i) the terms the “Company,” “our Company,” “Quality Distribution,” “QDI,” “we,” “us” and “our” refer to Quality Distribution, Inc. and its consolidated subsidiaries and their predecessors, (ii) the terms “Quality Distribution, LLC” and “QD LLC” refer to our wholly owned subsidiary, Quality Distribution, LLC, a Delaware limited liability company, and its consolidated subsidiaries and their predecessors, (iii) the term “QD Capital” refers to our wholly owned subsidiary, QD Capital Corporation, a Delaware corporation, (iv) the term “QCI” refers to our wholly owned subsidiary, Quality Carriers, Inc., an Illinois Corporation and (v) the term “Boasso” refers to our wholly owned subsidiary, Boasso America Corporation, a Louisiana corporation.
We are primarily engaged in truckload transportation of bulk chemicals and are also engaged in intermodal tank container transportation and depot services, logistics and other value-added services. We conduct a significant portion of our business through a network of independent affiliates and independent owner-operators. Independent affiliates are independent companies which enter into various term contracts with the Company. Independent affiliates are responsible for paying for their own power equipment (including debt service), fuel and other operating costs. Certain independent affiliates lease trailers from us. Independent owner-operators are independent contractors, who, through a contract with us, supply one or more tractors and drivers for our use. Contracts with independent owner-operators may be terminated by either party on short notice. We charge independent affiliates and third parties for the use of tractors and trailers as necessary. In exchange for the services rendered, independent affiliates and independent owner-operators are normally paid a percentage of the revenues collected on each load hauled.
Our accompanying unaudited consolidated financial statements have been prepared in accordance with the instructions to Form 10-Q and Article 10 of Regulation S-X and do not include all of the information and notes required by accounting principles generally accepted in the United States (“GAAP”) for complete financial statements. In the opinion of management, all adjustments (consisting of normal recurring adjustments and accruals) considered necessary for a fair statement of consolidated financial position, results of operations and cash flows have been included. The year ended consolidated balance sheet data was derived from audited financial statements, but does not include all the disclosures required by GAAP. For further information, refer to our Annual Report on Form 10-K for the year ended December 31, 2009, including the consolidated financial statements and accompanying notes.
During the financial statement close process for the three month period ended June 30, 2010, we identified prior period errors totaling $0.6 million, which were corrected and recorded as a credit to fuel, supplies and maintenance expense. We concluded that this adjustment was not material to our interim and annual consolidated financial statements for 2009 or to the financial statements for any prior period based on our consideration of quantitative and qualitative factors.
Operating results for the three and six months ended June 30, 2010 are not necessarily indicative of the results that may be expected for the entire fiscal year.
New Accounting Pronouncements
In June 2009, FASB issued new guidance which revises and updates previously issued guidance related to variable interest entities. The new guidance eliminates the exceptions to consolidating qualifying special-purpose
F-66
Table of Contents
Quality Distribution, Inc. and Subsidiaries
Quality Distribution, Inc. and Subsidiaries
Notes to Consolidated Financial Statements—(Continued)
(Unaudited)
entities that were included in the prior guidance. The new guidance contains new criteria for determining the primary beneficiary and increases the frequency of required reassessments to determine whether a company is the primary beneficiary of a variable interest entity. The guidance also contains a new requirement that any term, transaction, or arrangement that does not have a substantive effect on an entity’s status as a variable interest entity, a company’s power over a variable interest entity, or a company’s obligation to absorb losses or its right to receive benefits of an entity must be disregarded. The elimination of the qualifying special-purpose entity concept and its consolidation exceptions means more entities will be subject to consolidation assessments and reassessments. The new guidance became effective for our fiscal year beginning January 1, 2010. The Company has concluded that a majority of its relationships with independent affiliates does not represent variable interests and that the Company is not in a position to direct the significant economic activities of independent affiliates.
In June 2009, the FASB issued guidance that eliminates the concept of a qualifying special-purpose entity, creates more stringent conditions for reporting a transfer of a portion of a financial asset as a sale, clarifies other sale-accounting criteria, and changes the initial measurement of a transferor’s interest in transferred financial assets. This guidance became effective for our fiscal year beginning January 1, 2010 and had no impact on our consolidated financial statements.
Acquisition and Dispositions
During 2009 and the first six months of 2010, we did not complete any acquisitions or dispositions of businesses or independent affiliates except as described below.
On October 10, 2009, we sold substantially all of the operating assets of our tank wash subsidiary, Quala Systems, Inc, (“QSI”), for $13.0 million, of which $10.0 million was paid in cash and the remaining $3.0 million in a subordinated note. The subordinated note is a five year non-amortizing note which matures on December 31, 2014. The principal is payable in a lump sum at maturity. Interest is payable quarterly at 7% per annum commencing December 31, 2009. In connection with the sale, QSI entered into various agreements with the purchaser, which is not affiliated with us, including long-term leases of real estate used in the tank wash business and various operating agreements. The assets sold had a net book value of $4.9 million which included $4.3 million of equipment, $0.4 million of inventory, and $0.2 million of intangibles. The sold QSI business generated approximately $19.5 million of revenue in 2009 from tank wash and related operations. Following the sale of the QSI business, we have purchased tank wash services (which were previously provided by QSI) from the acquirer of QSI’s tank wash assets and we expect to continue to do so in the future. Since we expect these continuing cash outflows to be significant, the sold QSI business did not qualify as a discontinued operation under FASB guidance. Therefore, we recorded a pre-tax gain of $7.1 million in the fourth quarter of 2009 as part of our operating income.
2. Variable Interest Entities
Generally under FASB guidance, a variable interest entity is an entity with one or more of the following characteristics: (a) the total equity investment at risk is not sufficient to permit the entity to finance its activities without additional subordinated financial support; (b) as a group the holders of the equity investment at risk lack (i) the ability to make decisions about an entity’s activities through voting or similar rights, (ii) the obligation to absorb the expected losses of the entity, or (iii) the right to receive the expected residual returns of the entity; or (c) the equity investors have voting rights that are not proportional to their economic interests and substantially all of the entity’s activities either involve, or are conducted on behalf of, an investor that has disproportionately
F-67
Table of Contents
Quality Distribution, Inc. and Subsidiaries
Quality Distribution, Inc. and Subsidiaries
Notes to Consolidated Financial Statements—(Continued)
(Unaudited)
few voting rights. The primary beneficiary of a VIE is generally the entity that has (a) the power to direct the activities of the VIE that most significantly impact the VIE’s economic performance, and (b) the obligation to absorb losses or the right to receive benefits that could potentially be significant to the VIE.
In determining whether we are the primary beneficiary of a VIE, we consider qualitative and quantitative factors, including, but not limited to: which activities most significantly impact the VIE’s economic performance and which party controls such activities; the characteristics of our involvement; the obligation or likelihood for us to provide financial support. Significant judgments or estimates related to these determinations include review of contract arrangements, capitalization, and day-to-day operations.
At June 30, 2010, we hold a variable interest in one VIE for which we are not the primary beneficiary. We have concluded, based on our qualitative consideration of our contract with the VIE, the operating structure of the VIE and our role with the VIE that we do not have the power to direct activities of the VIE that most significantly impact the VIE’s economic performance. Therefore, we are not required to consolidate the operations of this VIE.
The one VIE at June 30, 2010 is an independent affiliate that is directly engaged with the management of three trucking terminals. We are involved with this VIE as a non-controlling interest. Our maximum exposure to loss as a result of our involvement with this unconsolidated VIE is limited to our recorded loan receivable from this VIE, which was approximately $2.9 million at June 30, 2010.
3. Fair Value of Financial Instruments
The three-level valuation hierarchy for fair value measurements is based upon observable and unobservable inputs. Observable inputs reflect market data obtained from independent sources, while unobservable inputs reflect our market assumptions. These two types of inputs create the following fair value hierarchy:
| • | Level 1—Quoted prices for identical instruments in active markets; |
| • | Level 2—Quoted prices for similar instruments in active markets; quoted prices for identical or similar instruments in markets that are not active; and model-derived valuations whose significant inputs are observable: and |
| • | Level 3—Instruments whose significant inputs are unobservable. |
Following is a description of the valuation methodologies we used for instruments measured at fair value, as well as the general classification of such instruments pursuant to the valuation hierarchy.
Fair Value Measurements on a Nonrecurring Basis
Long-term indebtedness
The fair values of our 9% Senior Subordinated Notes (“9% Notes”), our Senior Floating Rate Notes (“2012 Notes”), our 10% Senior Notes (“2013 Senior Notes”) and our 11.75% Senior Subordinated PIK Notes (“2013 PIK Notes”) were based on quoted market prices. As of June 30, 2010, the carrying value of our 9% Notes was $16.0 million with a fair value of $15.8 million. As of June 30, 2010, the carrying value of our 2012 Notes was $0.5 million with a fair value of $0.4 million. As of June 30, 2010, the carrying value of our 2013 Senior Notes was $134.5 million with a fair value of $132.8 million. As of June 30, 2010, the carrying value of our 2013 PIK Notes was $82.3 million with a fair value of $77.4 million. Our asset-based loan facility (the “ABL Facility”) is variable rate debt and approximates fair value.
F-68
Table of Contents
Quality Distribution, Inc. and Subsidiaries
Quality Distribution, Inc. and Subsidiaries
Notes to Consolidated Financial Statements—(Continued)
(Unaudited)
The carrying amounts reported in the accompanying balance sheets for cash and cash equivalents, accounts receivable and accounts payable approximate fair value because of the immediate or short-term maturities of these financial instruments.
4. Goodwill and Intangible Assets
Goodwill
Under the FASB guidance, goodwill and indefinite-lived intangible assets are subject to an annual impairment test as well as impairment assessments when certain triggering events occur. We evaluate goodwill for impairment by determining the fair value based on criteria in the FASB guidance for each reporting unit to which our goodwill relates. These reporting units may contain goodwill and other identifiable intangible assets as a result of previous business acquisitions. Our annual impairment test is performed during the second quarter with a measurement date of June 30th . The methodology applied in the analysis performed at June 30, 2010 was consistent with the methodology applied in prior years, but was based on updated assumptions, as appropriate. As a result of our analysis, we concluded no impairment had occurred as of June 30, 2010. As a result of our analysis as of June 30, 2009, we recorded a total impairment charge to goodwill of $146.2 million, of which $144.3 million was related to our trucking segment, eliminating 100% of the carrying amount of goodwill of that segment, and $1.9 million was related to our container services segment. In accordance with applicable guidance, we continued to evaluate indicators of impairment quarterly following our annual goodwill impairment test at June 30, 2009. There were no indications that a triggering event had occurred leading up to our analysis at June 30, 2010.
As the result of the June 30, 2009 impairment, we determined that we were in a cumulative loss position. Based on this negative evidence we concluded that it was no longer more likely than not that our net deferred tax asset was realizable. For purposes of assessing realizability of the deferred tax assets, this cumulative financial reporting loss position is considered significant negative evidence we will not be able to fully realize the deferred tax assets in the future. As a result, a $41.2 million deferred tax valuation allowance was recorded in 2009. Our judgments regarding future taxable income may change due to changes in market conditions, changes in tax laws, operating results or other factors. If any of these factors and related estimates changes in the future, it may increase or decrease the valuation allowance and related income tax expense in the same period.
Under the FASB guidance, the process of evaluating the potential impairment of goodwill requires significant judgment at many points during the analysis and involves a two-step process. In the first step, we determine whether there is an indication of impairment by comparing the fair value of a reporting unit to its carrying amount, including goodwill. If, based on the first step, we determine that there is an indication of goodwill impairment, the Company will measure any identified goodwill impairment in accordance with the FASB guidance.
In the first step, we determine the fair value for our reporting units using a combination of two valuation approaches: the market approach and the income approach. The market approach uses a guideline company methodology which is based upon a comparison of us to similar publicly-traded companies within our industry. We derive a market value of invested capital or business enterprise value for each comparable company by multiplying the price per share of common stock of the publicly traded companies by their total common shares outstanding and adding each company’s current level of debt. We calculate a business enterprise multiple based on revenue and earnings from each company, then apply those multiples to each reporting unit’s revenue and earnings to conclude a reporting unit business enterprise value. Assumptions regarding the selection of
F-69
Table of Contents
Quality Distribution, Inc. and Subsidiaries
Quality Distribution, Inc. and Subsidiaries
Notes to Consolidated Financial Statements—(Continued)
(Unaudited)
comparable companies are made based on, among other factors, capital structure, operating environment and industry. As the comparable companies were typically larger and more diversified than our reporting units, multiples were adjusted prior to application to our reporting units’ revenues and earnings to reflect differences in margins, long-term growth prospects and market capitalization.
The income approach uses a discounted debt-free cash flow analysis to measure fair value by estimating the present value of future economic benefits. To perform the discounted debt-free cash flow analysis, we develop a pro forma analysis of each reporting unit to estimate future available debt-free cash flow and discount estimated debt-free cash flow by an estimated industry weighted average cost of capital based on the same comparable companies used in the market approach. Per the FASB guidance, the weighted average cost of capital is based on inputs (e.g., capital structure, risk, etc.) from a market participant’s perspective and not necessarily from the reporting unit or QDI’s perspective. Future cash flow is projected based on assumptions for our economic growth, industry expansion, future operations and the discount rate, all of which require significant judgments by management.
As of June 30, 2010 and December 31, 2009, the goodwill balance was $27.0 million, all of which relates to our container services segment.
Intangible Assets
Intangible assets at June 30, 2010 are as follows (in thousands):
| Gross value |
Accumulated amortization |
Net book value |
Average lives (in years) | |||||||||
| Tradename |
$ | 7,400 | $ | — | $ | 7,400 | Indefinite | |||||
| Customer relationships |
11,900 | (2,479 | ) | 9,421 | 12 | |||||||
| Non-compete agreements |
2,593 | (1,743 | ) | 850 | 3 – 5 | |||||||
| $ | 21,893 | $ | (4,222 | ) | $ | 17,671 | ||||||
Amortization expense for the six months ended June 30, 2010 and 2009 was $0.8 million in both periods. Estimated amortization expense for intangible assets is as follows (in thousands):
| 2010 remaining |
$ | 747 | |
| 2011 |
1,369 | ||
| 2012 |
1,205 | ||
| 2013 |
996 | ||
| 2014 and after |
5,954 |
F-70
Table of Contents
Quality Distribution, Inc. and Subsidiaries
Quality Distribution, Inc. and Subsidiaries
Notes to Consolidated Financial Statements—(Continued)
(Unaudited)
5. Comprehensive Income (Loss)
Comprehensive income (loss) is as follows (in thousands):
| Three months ended June 30, |
Six months ended June 30, |
||||||||||||||
| 2010 | 2009 | 2010 | 2009 | ||||||||||||
| Net income (loss) |
$ | 2,056 | $ | (186,227 | ) | $ | 2,854 | $ | (186,529 | ) | |||||
| Other comprehensive income (loss): |
|||||||||||||||
| Amortization of prior service costs |
324 | 312 | 647 | 624 | |||||||||||
| Foreign currency translation adjustments |
48 | (121 | ) | (4 | ) | 5 | |||||||||
| Comprehensive income (loss) |
$ | 2,428 | $ | (186,036 | ) | $ | 3,497 | $ | (185,900 | ) | |||||
6. Income (Loss) Per Share
A reconciliation of the numerators and denominators of the basic and diluted income (loss) per share computations is as follows (in thousands, except per share amounts):
| Three months ended | ||||||||||||||||||
| June 30, 2010 | June 30, 2009 | |||||||||||||||||
| Net income (numerator) |
Shares (denominator) |
Per-share amount |
Net loss (numerator) |
Shares (denominator) |
Per-share amount |
|||||||||||||
| Basic income (loss) available to common shareholders: |
||||||||||||||||||
| Net income (loss) |
$ | 2,056 | 20,256 | $ | 0.10 | $ | (186,227 | ) | 19,441 | $ | (9.58 | ) | ||||||
| Effect of dilutive securities: |
||||||||||||||||||
| Stock options |
280 | — | ||||||||||||||||
| Unvested restricted stock |
205 | — | ||||||||||||||||
| Stock warrants |
1,007 | — | ||||||||||||||||
| Diluted income (loss) available to common shareholders: |
||||||||||||||||||
| Net income (loss) |
$ | 2,056 | 21,748 | $ | 0.09 | $ | (186,227 | ) | 19,441 | $ | (9.58 | ) | ||||||
| Six months ended | ||||||||||||||||||
| June 30, 2010 | June 30, 2009 | |||||||||||||||||
| Net income (numerator) |
Shares (denominator) |
Per-share amount |
Net loss (numerator) |
Shares (denominator) |
Per-share amount |
|||||||||||||
| Basic income (loss) available to common shareholders: |
||||||||||||||||||
| Net income (loss) |
$ | 2,854 | 19,880 | $ | 0.14 | $ | (186,529 | ) | 19,331 | $ | (9.65 | ) | ||||||
| Effect of dilutive securities: |
||||||||||||||||||
| Stock options |
168 | — | ||||||||||||||||
| Unvested restricted stock |
161 | — | ||||||||||||||||
| Stock warrants |
1,376 | — | ||||||||||||||||
| Diluted income (loss) available to common shareholders: |
||||||||||||||||||
| Net income (loss) |
$ | 2,854 | 21,585 | $ | 0.13 | $ | (186,529 | ) | 19,331 | $ | (9.65 | ) | ||||||
F-71
Table of Contents
Quality Distribution, Inc. and Subsidiaries
Quality Distribution, Inc. and Subsidiaries
Notes to Consolidated Financial Statements—(Continued)
(Unaudited)
There is no effect of our stock options and unvested restricted stock in the computation of diluted earnings per share for the three months and six months ended June 30, 2009 due to a net loss in the quarter.
The following securities were not included in the calculation of diluted earnings per share because such inclusion would be anti-dilutive (in thousands):
| Three months ended June 30, |
Six months ended June 30, | |||||||
| 2010 | 2009 | 2010 | 2009 | |||||
| Stock options |
1,921 | 1,694 | 2,033 | 1,694 | ||||
| Unvested restricted stock |
419 | 197 | 463 | 197 | ||||
7. Stock-Based Compensation
We maintain performance incentive plans under which stock options, restricted shares, and stock units may be granted to employees, non-employee directors, consultants and advisors. As of June 30, 2010, we had two active stock-based compensation plans.
We recognize expense for stock-based compensation based upon estimated grant date fair value. We apply the Black-Scholes valuation model in determining the fair value of share-based payments to employees. The resulting compensation expense is recognized over the requisite service period, which is generally the awards’ vesting term. Compensation expense is recognized only for those awards expected to vest, with forfeitures estimated based on our historical experience and future expectations. All stock-based compensation expense is classified within “Compensation” on the Consolidated Statement of Operations. None of the stock-based compensation was capitalized during the first six months of 2010.
The fair value of options granted during the first six months of 2010 was based upon the Black-Scholes option-pricing model. The expected term of the options represents the estimated period of time until exercise giving consideration to the contractual terms, vesting schedules and expectations of future employee behavior. For 2010, expected stock price volatility is based on the historical volatility of our common stock. The risk-free interest rate is based on the U.S. Treasury yield curve in effect at the time of grant with an equivalent remaining term. The Company has not paid dividends in the past and does not currently plan to pay any dividends in the foreseeable future. The Black-Scholes model was used with the following weighted-average assumptions:
| 2010 | 2009 | |||||
| Risk free rate |
2.54 | % | 1.57 | % | ||
| Expected life |
5 years | 5 years | ||||
| Volatility |
77.5 | % | 78.7 | % | ||
| Expected dividend |
nil | nil |
The following options and restricted shares were issued during the three months ended:
| Options Issued |
Restricted Shares Issued | |||
| March 31, 2010 |
— | 68,621 | ||
| June 30, 2010 |
85,000 | — |
F-72
Table of Contents
Quality Distribution, Inc. and Subsidiaries
Quality Distribution, Inc. and Subsidiaries
Notes to Consolidated Financial Statements—(Continued)
(Unaudited)
The following table summarizes stock-based compensation expense (in thousands):
| Three months ended June 30, |
Six months ended June 30, | |||||||||||
| 2010 | 2009 | 2010 | 2009 | |||||||||
| Stock options |
$ | 339 | $ | 113 | $ | 614 | $ | 206 | ||||
| Restricted stock |
249 | 43 | 463 | 106 | ||||||||
| $ | 588 | $ | 156 | $ | 1,077 | $ | 312 | |||||
The following table summarizes unrecognized stock-based compensation and the weighted average period over which such stock-based compensation is expected to be recognized as of June 30, 2010 (in thousands):
| Remaining years | |||||
| Stock options |
$ | 2,948 | 4.5 | ||
| Restricted stock |
1,964 | 3.5 | |||
| $ | 4,912 | ||||
These amounts do not include the cost of any additional awards that may be granted in future periods nor any changes in our forfeiture rate. Options for 1,250 shares were exercised during the three months ended June 30, 2010.
8. Employee Benefit Plans
We maintain two noncontributory defined benefit plans resulting from a prior acquisition that cover certain full-time salaried employees and certain other employees under a collective bargaining agreement. Retirement benefits for employees covered by the salaried plan are based on years of service and compensation levels. The monthly benefit for employees under the collective bargaining agreement plan is based on years of service multiplied by a monthly benefit factor. Pension costs are funded in accordance with the provisions of the applicable law. Both pension plans have been frozen since prior to January 1, 1998. There are no new participants and no future accruals of benefits from the time the plans were frozen.
We use a December 31st measurement date for both of our plans.
The components of estimated net periodic pension cost are as follows (in thousands):
| Three months ended June 30, |
Six months ended June 30, |
|||||||||||||||
| 2010 | 2009 | 2010 | 2009 | |||||||||||||
| Service cost |
$ | 51 | $ | 51 | $ | 101 | $ | 101 | ||||||||
| Interest cost |
644 | 688 | 1,287 | 1,376 | ||||||||||||
| Amortization of prior service cost |
23 | 23 | 47 | 47 | ||||||||||||
| Amortization of loss |
300 | 288 | 600 | 577 | ||||||||||||
| Expected return on plan assets |
(540 | ) | (509 | ) | (1,080 | ) | (1,019 | ) | ||||||||
| Net periodic pension cost |
$ | 478 | $ | 541 | $ | 955 | $ | 1,082 | ||||||||
F-73
Table of Contents
Quality Distribution, Inc. and Subsidiaries
Quality Distribution, Inc. and Subsidiaries
Notes to Consolidated Financial Statements—(Continued)
(Unaudited)
We contributed $0.7 million to our pension plans during the six months ended June 30, 2010. We expect to contribute an additional $1.8 million during the remainder of 2010.
9. Restructuring
We account for restructuring costs associated with one-time termination benefits, costs associated with lease and contract terminations and other related exit activities in accordance with the FASB’s guidance. We have made estimates of the costs to be incurred as part of our restructuring plan. During the quarter ended June 30, 2008, we committed to a plan of restructure resulting in the termination of non-driver positions and the consolidation, closure or affiliation of underperforming company terminals. We continued our plan of restructure throughout 2009 which resulted in charges of $3.5 million of which the majority related to our trucking segment. Our restructuring plan continued in 2010 and resulted in charges of $2.2 million for the six-month period ended June 30, 2010, of which the majority related to our trucking segment. The charges related to employee termination benefits and other related exit activities, and included the termination of approximately 380 non-driver positions. We expect to conclude our restructuring plan in 2010 and to take additional related charges during the year.
In the six months ended June 30, 2010, we had the following activity in our restructuring accruals:
| Balance at December 31, 2009 |
Additions | Payments | Reductions | Balance at June 30, 2010 | ||||||||||||
| Restructuring costs |
$ | 1,063 | $ | 2,215 | $ | (2,044 | ) | $ | — | $ | 1,234 | |||||
| 10. Segment | Reporting |
Reportable Segments
We have two reportable business segments for financial reporting purposes that are distinguished primarily on the basis of services offered:
| • | Trucking, which consists of truckload transportation of bulk chemicals, and |
| • | Container Services, specifically intermodal tank container transportation and depot services. |
Segment revenues and operating income include the allocation of fuel surcharge to the trucking and container services segments. The operating income reported in our segments excludes amounts reported in Other operating income, such as gains and losses on disposal of property and equipment, restructuring costs, impairment charge, corporate and other unallocated amounts. Corporate and unallocated amounts include depreciation and amortization and other gains and losses. Although these amounts are excluded from the business segment results, they are included in reported consolidated earnings. Included in Other revenue are revenues from our tank wash services and other value-added services. We have not provided specific asset information by segment, as it is not regularly provided to our chief operating decision maker for review.
F-74
Table of Contents
Quality Distribution, Inc. and Subsidiaries
Quality Distribution, Inc. and Subsidiaries
Notes to Consolidated Financial Statements—(Continued)
(Unaudited)
Summarized segment data and reconciliation to income (loss) before income taxes follows (in thousands):
| Three months ended June 30, |
Six months ended June 30, |
|||||||||||||||
| 2010 | 2009 | 2010 | 2009 | |||||||||||||
| Operating revenues: |
||||||||||||||||
| Trucking |
$ | 134,482 | $ | 113,470 | $ | 256,263 | $ | 224,618 | ||||||||
| Container Services |
26,238 | 17,878 | 49,433 | 37,779 | ||||||||||||
| Other revenue |
16,832 | 18,438 | 33,189 | 37,121 | ||||||||||||
| Total |
177,552 | 149,786 | 338,885 | 299,518 | ||||||||||||
| Operating income (loss): |
||||||||||||||||
| Trucking |
11,178 | 8,104 | 21,711 | 15,689 | ||||||||||||
| Container Services |
4,526 | 2,001 | 8,202 | 5,290 | ||||||||||||
| Other operating income |
888 | 1,601 | 1,171 | 2,552 | ||||||||||||
| Total segment operating income |
16,592 | 11,706 | 31,084 | 23,531 | ||||||||||||
| Depreciation and amortization expense |
4,067 | 5,304 | 8,310 | 10,639 | ||||||||||||
| Impairment charge(1) |
— | 148,630 | — | 148,630 | ||||||||||||
| Other expense |
1,302 | 1,003 | 2,867 | 1,500 | ||||||||||||
| Total |
11,223 | (143,231 | ) | 19,907 | (137,238 | ) | ||||||||||
| Interest expense |
8,640 | 6,518 | 17,307 | 13,518 | ||||||||||||
| Interest income |
(156 | ) | (83 | ) | (317 | ) | (186 | ) | ||||||||
| Other expense (income) |
220 | (419 | ) | 226 | (951 | ) | ||||||||||
| Income (loss) before income taxes |
$ | 2,519 | $ | (149,247 | ) | $ | 2,691 | $ | (149,619 | ) | ||||||
| (1) | The three months and the six months ended June 30, 2009, include an impairment charge of $144.3 million related to our trucking segment and an impairment charge of $4.3 million related to our container services segment. |
F-75
Table of Contents
Quality Distribution, Inc. and Subsidiaries
Quality Distribution, Inc. and Subsidiaries
Notes to Consolidated Financial Statements—(Continued)
(Unaudited)
Geographic Segments
Our operations are located primarily in the United States, Canada and Mexico. Inter-area sales are not significant to the total revenue of any geographic area. Information about our operations in different geographic areas for the three and six months ended June 30, 2010 and 2009 is as follows (in thousands):
| Three months ended June 30, 2010 | |||||||||||
| U. S. | International | Consolidated | |||||||||
| Total operating revenues |
$ | 167,675 | $ | 9,877 | $ | 177,552 | |||||
| Operating income |
9,984 | 1,239 | 11,223 | ||||||||
| Three months ended June 30, 2009 | |||||||||||
| U. S. | International | Consolidated | |||||||||
| Total operating revenues |
$ | 140,177 | $ | 9,609 | $ | 149,786 | |||||
| Operating (loss) income |
(144,561 | ) | 1,330 | (143,231 | ) | ||||||
| Six months ended June 30, 2010 | |||||||||||
| U. S. | International | Consolidated | |||||||||
| Total operating revenues |
$ | 319,852 | $ | 19,033 | $ | 338,885 | |||||
| Operating income |
17,742 | 2,165 | 19,907 | ||||||||
| As of June 30, 2010 | |||||||||||
| Long-term identifiable assets(1) |
$ | 114,605 | $ | 7,625 | $ | 122,230 | |||||
| Six months ended June 30, 2009 | |||||||||||
| U. S. | International | Consolidated | |||||||||
| Total operating revenues |
$ | 281,291 | $ | 18,227 | $ | 299,518 | |||||
| Operating (loss) income |
(139,344 | ) | 2,106 | (137,238 | ) | ||||||
| As of December 31, 2009 | |||||||||||
| Long-term identifiable assets(1) |
$ | 119,340 | $ | 7,989 | $ | 127,329 | |||||
| (1) | Includes property and equipment. |
F-76
Table of Contents
Quality Distribution, Inc. and Subsidiaries
Quality Distribution, Inc. and Subsidiaries
Notes to Consolidated Financial Statements—(Continued)
(Unaudited)
11. Income Taxes
At December 31, 2009, we had approximately $1.8 million of total gross unrecognized tax benefits. Of this total, $1.2 million (net of federal benefit on state tax issues) represents the amount of unrecognized tax benefits that, if recognized, would favorably affect the effective income tax rate in any future periods.
Included in the balance of gross unrecognized tax benefits at December 31, 2009, was $0.7 million related to tax positions for which it is reasonably possible that the total amounts could significantly change during the next 12 months due to expiration of the statute of limitations.
For the three months ended June 30, 2010, the change in unrecognized tax benefits was an increase of $0.1 million. Our total gross unrecognized tax benefit at June 30, 2010 was $1.6 million.
Our continuing practice is to recognize interest and/or penalties related to income tax matters in income tax expense. We had $0.7 million (net of federal tax benefit) accrued for interest and $0.3 million accrued for penalties at December 31, 2009. The total amount accrued for interest and penalties at June 30, 2010 was $0.8 million.
We are subject to the income tax jurisdictions of the U.S., Canada, and Mexico, as well as income tax of multiple state jurisdictions. We believe we are no longer subject to U.S. federal income tax examinations for years before 2006, to international examinations for years before 2005 and, with few exceptions, to state examinations before 2005.
The effective tax rates for the three months ended June 30, 2010 and 2009 were approximately 18.4% and (24.8%), respectively. The effective tax rates for the six months ended June 30, 2010 and 2009 were approximately (6.1%) and (24.7%) respectively. The difference in the effective tax rate for the three months and six months ended June 30, 2010 differs from the previous periods due to the tax expense adjustments related to an impairment recorded during the second quarter of 2009 of deductible and non-deductible goodwill as well as the recording of a 100% valuation allowance against the net deferred tax assets.
12. Commitments and Contingencies
Environmental Matters
It is our policy to comply with all applicable environmental, safety, and health laws. We also are committed to the principles of Responsible Care®, an international chemical industry initiative to enhance the industry’s responsible management of chemicals. We have obtained independent certification that our management system is in place and functions according to professional standards and we continue to evaluate and continuously improve our Responsible Care® Management System performance. Our activities involve the handling, transportation and storage of bulk chemicals, both liquid and dry, many of which are classified as hazardous materials or hazardous substances. Our operations involve the generation, storage, discharge and disposal of wastes that may contain hazardous substances, the inventory and use of cleaning materials that may contain hazardous substances and the control and discharge of storm-water from industrial sites. In addition, we may store diesel fuel, materials containing oil and other hazardous products at our terminals. As such, we and others who operate in our industry are subject to environmental, health and safety laws and regulation by U.S. federal, state and local agencies as well as foreign governmental authorities. Environmental laws and regulations are complex, and address emissions to the air, discharge onto land or water, and the generation, handling, storage,
F-77
Table of Contents
Quality Distribution, Inc. and Subsidiaries
Quality Distribution, Inc. and Subsidiaries
Notes to Consolidated Financial Statements—(Continued)
(Unaudited)
transportation, treatment and disposal of waste materials. These laws change frequently and generally require us to obtain and maintain various licenses and permits. Environmental laws have tended to become more stringent over time, and most provide for substantial fines and potential criminal sanctions for violations. Some of these laws and regulations are subject to varying and conflicting interpretations. Under certain of these laws, we could also be subject to allegations of liability for the activities of our independent affiliates or independent owner-operators.
We are potentially subject to strict, joint and several liability for investigating and rectifying the consequences of spills and other releases of such substances. From time to time, we have incurred remedial costs and regulatory penalties with respect to chemical or wastewater spills and releases at our facilities and on the road, and, notwithstanding the existence of our environmental management program, we cannot assure that such obligations will not be incurred in the future, predict with certainty the extent of future liabilities and costs under environmental, health, and safety laws, or assure that such liabilities will not result in a material adverse effect on our business, financial condition, operating results or cash flow. We have established reserves for remediation expenses at known contamination sites when it is probable that such efforts will be required of us and the related expenses can be reasonably estimated. We have also incurred in the past, and expect to incur in the future, capital and other expenditures related to environmental compliance for current and planned operations. Such expenditures are generally included in our overall capital and operating budgets and are not accounted for separately. However, we do not anticipate that compliance with existing environmental laws in conducting current and planned operations will have a material adverse effect on our capital expenditures, earnings or competitive position.
Reserves
Our policy is to accrue remediation expenses when it is probable that such efforts will be required and the related expenses can be reasonably estimated. Estimates of costs for future environmental compliance and remediation may be adversely affected by such factors as changes in environmental laws and regulatory requirements, the availability and application of technology, the identification of currently unknown potential remediation sites and the allocation of costs among the potentially responsible parties under the applicable statutes. The recorded liabilities are adjusted periodically as remediation efforts progress or as additional technical or legal information becomes available. As of June 30, 2010 and December 31, 2009, we had reserves in the amount of $11.3 million and $11.6 million, respectively, for all environmental matters of which the more significant are discussed below.
The balances presented include both long term and current environmental reserves. We expect these environmental obligations to be paid over the next five years. Additions to the environmental liability reserves are classified in our Consolidated Statements of Operations within the “Selling and administrative” category.
Property Contamination Liabilities
We have been named as (or are alleged to be) a potentially responsible party under the Comprehensive Environmental Response, Compensation and Liability Act of 1980, as amended (“CERCLA”) and similar state laws at approximately 25 sites. At 18 of the 25 sites, we are one of many parties with alleged liability and are negotiating with Federal, State or private parties on the scope of our obligations, if any. At 2 of the 18 sites, we will be participating in the initial studies to determine site remediation objectives. Since our overall liability cannot be estimated at this time, we have set reserves for only the initial remedial investigation phase. At 3 of the
F-78
Table of Contents
Quality Distribution, Inc. and Subsidiaries
Quality Distribution, Inc. and Subsidiaries
Notes to Consolidated Financial Statements—(Continued)
(Unaudited)
18 sites, we have explicitly denied any liability and since there has been no subsequent demand for payment we have not established a reserve for these matters. We have estimated future expenditures for these off-site multi-party environmental matters to be in the range of $2.1 million to $3.8 million.
At 7 of the 25 sites, we are the only responsible party and are in the process of conducting investigations and/or remediation projects. Four of these projects relate to operations conducted by our subsidiary, Chemical Leaman Corporation (“CLC”), and its subsidiaries prior to our acquisition of CLC in 1998. These four sites are: (1) Bridgeport, New Jersey; (2) William Dick, Pennsylvania; (3) Tonawanda, New York; and (4) Scary Creek, West Virginia. The remaining three sites relate to investigations and potential remediation that were triggered by the New Jersey Industrial Site Remediation Act (“ISRA”), which requires such investigations and remediation following the sale of industrial facilities. Each of these sites is discussed in more detail below. We have estimated future expenditures for these seven properties to be in the range of $9.2 million to $16.7 million.
Bridgeport, New Jersey
QDI is required under the terms of two federal consent decrees to perform remediation at this operating truck terminal and tank wash site. CLC entered into consent orders with the U.S. Environmental Protection Agency (“USEPA”) in May 1991 for the treatment of groundwater and in October 1998 for the removal of contamination in the wetlands. In addition, we were required to assess the remediation of contaminated soils.
The groundwater treatment remedy negotiated with USEPA calls for a treatment facility for in-place treatment of groundwater contamination and a local discharge. Treatment facility construction was completed in early 2007. After various start-up issues, the treatment facility began initial operations in June 2010. Wetlands contamination has been remediated with localized restoration completed. Monitoring of the restored wetlands is continuing. In regard to contaminated soils, USEPA finalized the feasibility study and issued a record of decision in 2009 for the limited areas that show contamination and warrant additional investigation or work. We are in negotiations with USEPA to enter a consent order to perform the remediation work. We have estimated expenditures to be in the range of $6.5 million to $8.5 million.
William Dick, Pennsylvania
CLC entered into a consent order with the Pennsylvania DEP and USEPA in October 1995 obligating it to provide a replacement water supply to area residents, treat contaminated groundwater, and perform remediation of contaminated soils at this former wastewater disposal site. The replacement water supply is complete. We completed construction of a treatment facility with local discharge for groundwater treatment in the fourth quarter of 2007. Plant start-up issues have been resolved and the treatment facility began operations in June 2010. The agencies approved a contaminated soils remedy, which required both thermal treatment of contaminated soils and treatment of residuals via soil vapor extraction. The remedy expanded to include off-site shipment of contaminated soils. Soil treatment was completed in September 2007. Site sampling has been conducted and the results indicate that the soil clean-up objectives have not been fully achieved. Negotiations are on-going with USEPA over further remedial actions that may be needed at the site. We have estimated expenditures to be in the range of $1.0 million to $3.4 million.
Other Properties
Scary Creek, West Virginia: CLC received a cleanup notice from the State environmental authority in August 1994. The State and we have agreed that remediation can be conducted under the State’s voluntary
F-79
Table of Contents
Quality Distribution, Inc. and Subsidiaries
Quality Distribution, Inc. and Subsidiaries
Notes to Consolidated Financial Statements—(Continued)
(Unaudited)
clean-up program (instead of the state superfund enforcement program). We are currently completing the originally planned remedial investigation and the additional site investigation work.
Tonawanda, New York: CLC entered into a consent order with the New York Department of Environmental Conservation on June 22, 1999 obligating it to perform soil and groundwater remediation at this former truck terminal and tank wash site. We have completed a remedial investigation and a feasibility study. The State issued a record of decision in May 2006. The site is currently in remedial design phase.
ISRA New Jersey Facilities: We are obliged to conduct investigations and remediation at three current or former New Jersey tank wash and terminal sites pursuant to the state’s Industrial Sites Remediation Act, which requires such remediation following the sale of facilities after 1983. These sites are in the process of remedial investigation with projections set in contemplation of limited soil remediation expense for contaminated areas.
We have estimated future expenditures for Scary Creek, Tonawanda and ISRA to be in the range of $1.7 million to $4.8 million.
Other Legal Matters
We are from time to time involved in routine litigation incidental to the conduct of our business. We believe that no such routine litigation currently pending against us, if adversely determined, would have a material adverse effect on our consolidated financial position, results of operations or cash flows.
13. Guarantor Subsidiaries
The 2013 Senior Notes and 2012 Notes are our subsidiaries’, QD LLC and QD Capital, senior unsecured obligations and are fully and unconditionally guaranteed on a senior unsecured basis, jointly and severally, by QDI, our other subsidiary guarantors, and certain of our future U.S. restricted subsidiaries. The 2013 PIK Notes and 9% Notes are our subsidiaries’, QD LLC and QD Capital Corporation, unsecured and senior subordinated obligations and are fully and unconditionally guaranteed on an unsecured and senior subordinated basis, jointly and severally, by QDI, our other subsidiary guarantors, and certain of our future U.S. restricted subsidiaries. The subsidiary guarantors of all of the notes are all of our direct and indirect domestic subsidiaries. All non-domestic subsidiaries including Levy Transport, Ltd. are not guarantor subsidiaries. QD Capital has no material assets or operations. QD LLC, all its subsidiary guarantors and QD Capital are 100% owned by QDI.
QD LLC conducts substantially all of its business through and derives virtually all of its income from its subsidiaries. Therefore, its ability to make required principal and interest payments with respect to its indebtedness depends on the earnings of subsidiaries and its ability to receive funds from its subsidiaries through dividend and other payments. The subsidiary guarantors are 100% owned subsidiaries of QD LLC and have fully and unconditionally guaranteed the 9% Notes and the 2012 Notes, and the 2013 Senior Notes and the 2013 PIK Notes on a joint and several basis.
QDI has no significant restrictions on its ability to receive funds from its subsidiaries. The ABL Facility and the indentures governing our 2013 Senior Notes and our 2013 PIK Notes contain certain limitations on QD LLC’s ability to make distributions to QDI. We do not consider these restrictions to be significant, because QDI is a holding company with no significant operations or assets, other than ownership of 100% of QD LLC’s membership units. QD LLC’s direct and indirect wholly owned subsidiaries are generally permitted to make distributions to QD LLC, which is the principal obligor under the ABL Facility, the 9% Notes, the 2012 Notes, the 2013 Senior Notes and the 2013 PIK Notes.
F-80
Table of Contents
Quality Distribution, Inc. and Subsidiaries
Quality Distribution, Inc. and Subsidiaries
Notes to Consolidated Financial Statements—(Continued)
(Unaudited)
We have not presented separate financial statements and other disclosures concerning subsidiary guarantors because management has determined such information is not material to the holders of the above-mentioned notes.
The following condensed consolidating financial information for QDI, QD LLC, QD Capital (which has no assets or operations), non-guarantor subsidiaries and combined guarantor subsidiaries presents:
| • | Condensed consolidating balance sheets at June 30, 2010 and December 31, 2009 and condensed consolidating statements of operations for the three and six month periods ended June 30, 2010 and June 30, 2009 and the condensed consolidating statements of cash flows for each of the six month periods ended June 30, 2010 and 2009. |
| • | Elimination entries necessary to consolidate the parent company and all its subsidiaries. |
F-81
Table of Contents
Quality Distribution, Inc. and Subsidiaries
Quality Distribution, Inc. and Subsidiaries
Notes to the Consolidated Financial Statements—(Continued)
(Unaudited)
Consolidating Statements of Operations
Three Months Ended June 30, 2010
Unaudited - (In 000’s)
| QDI | QD LLC & QD Capital |
Guarantor Subsidiaries |
Non-Guarantor Subsidiaries |
Eliminations | Consolidated | ||||||||||||||||
| Operating revenues: |
|||||||||||||||||||||
| Transportation |
$ | — | $ | — | $ | 129,473 | $ | — | $ | — | $ | 129,473 | |||||||||
| Other service revenue |
— | — | 26,318 | 155 | — | 26,473 | |||||||||||||||
| Fuel surcharge |
— | — | 21,606 | — | — | 21,606 | |||||||||||||||
| Total operating revenues |
— | — | 177,397 | 155 | — | 177,552 | |||||||||||||||
| Operating expenses: |
|||||||||||||||||||||
| Purchased transportation |
— | — | 123,071 | — | — | 123,071 | |||||||||||||||
| Compensation |
— | — | 14,980 | — | — | 14,980 | |||||||||||||||
| Fuel, supplies and maintenance |
— | — | 12,054 | — | — | 12,054 | |||||||||||||||
| Depreciation and amortization |
— | — | 4,067 | — | — | 4,067 | |||||||||||||||
| Selling and administrative |
— | 71 | 4,335 | 43 | — | 4,449 | |||||||||||||||
| Insurance costs |
— | — | 4,535 | 5 | — | 4,540 | |||||||||||||||
| Taxes and licenses |
— | — | 674 | — | — | 674 | |||||||||||||||
| Communication and utilities |
— | — | 1,192 | — | — | 1,192 | |||||||||||||||
| Loss on disposal of property and equipment |
— | — | 234 | — | — | 234 | |||||||||||||||
| Restructuring costs |
— | — | 1,068 | — | — | 1,068 | |||||||||||||||
| Operating (loss) income |
— | (71 | ) | 11,187 | 107 | — | 11,223 | ||||||||||||||
| Interest expense (income), non-related party, net |
— | 8,111 | 388 | (15 | ) | — | 8,484 | ||||||||||||||
| Interest (income) expense, related party, net |
— | (8,111 | ) | 8,213 | (102 | ) | — | — | |||||||||||||
| Other expense |
— | 94 | 63 | 63 | — | 220 | |||||||||||||||
| (Loss) income before income taxes |
— | (165 | ) | 2,523 | 161 | — | 2,519 | ||||||||||||||
| Provision for (benefit from) income taxes |
— | — | 422 | 41 | — | 463 | |||||||||||||||
| Equity in earnings of subsidiaries |
2,056 | 2,221 | — | — | (4,277 | ) | — | ||||||||||||||
| Net income |
$ | 2,056 | $ | 2,056 | $ | 2,101 | $ | 120 | $ | (4,277 | ) | $ | 2,056 | ||||||||
F-82
Table of Contents
Quality Distribution, Inc. and Subsidiaries
Quality Distribution, Inc. and Subsidiaries
Notes to the Consolidated Financial Statements—(Continued)
(Unaudited)
Consolidating Statements of Operations
Three Months Ended June 30, 2009
Unaudited - (In 000’s)
| QDI | QD LLC & QD Capital |
Guarantor Subsidiaries |
Non-Guarantor Subsidiaries |
Eliminations | Consolidated | ||||||||||||||||||
| Operating revenues: |
|||||||||||||||||||||||
| Transportation |
$ | — | $ | — | $ | 112,083 | $ | — | $ | — | $ | 112,083 | |||||||||||
| Other service revenue |
— | — | 25,789 | 51 | — | 25,840 | |||||||||||||||||
| Fuel surcharge |
— | — | 11,863 | — | — | 11,863 | |||||||||||||||||
| Total operating revenues |
— | — | 149,735 | 51 | — | 149,786 | |||||||||||||||||
| Operating expenses: |
|||||||||||||||||||||||
| Purchased transportation |
— | — | 88,985 | — | — | 88,985 | |||||||||||||||||
| Compensation |
— | — | 19,540 | — | — | 19,540 | |||||||||||||||||
| Fuel, supplies and maintenance |
— | — | 15,922 | — | — | 15,922 | |||||||||||||||||
| Depreciation and amortization |
— | — | 5,304 | — | — | 5,304 | |||||||||||||||||
| Selling and administrative |
— | 10 | 6,862 | 5 | — | 6,877 | |||||||||||||||||
| Insurance costs |
— | — | 3,941 | 5 | — | 3,946 | |||||||||||||||||
| Taxes and licenses |
— | — | 736 | — | — | 736 | |||||||||||||||||
| Communication and utilities |
— | — | 2,074 | — | — | 2,074 | |||||||||||||||||
| Gain on disposal of property and equipment |
— | — | (162 | ) | — | — | (162 | ) | |||||||||||||||
| Impairment charge |
— | — | 148,630 | — | — | 148,630 | |||||||||||||||||
| Restructuring costs |
— | — | 1,165 | — | — | 1,165 | |||||||||||||||||
| Operating (loss) income |
— | (10 | ) | (143,262 | ) | 41 | — | (143,231 | ) | ||||||||||||||
| Interest expense (income), non-related party, net |
— | 5,859 | 584 | (8 | ) | — | 6,435 | ||||||||||||||||
| Interest (income) expense, related party, net |
— | (5,859 | ) | 5,964 | (105 | ) | — | — | |||||||||||||||
| Other income |
— | — | (288 | ) | (131 | ) | — | (419 | ) | ||||||||||||||
| (Loss) income before income taxes |
— | (10 | ) | (149,522 | ) | 285 | — | (149,247 | ) | ||||||||||||||
| Provision for income taxes |
— | — | 36,939 | 41 | — | 36,980 | |||||||||||||||||
| Equity in loss of subsidiaries |
(186,227 | ) | (186,217 | ) | — | — | 372,444 | — | |||||||||||||||
| Net (loss) income |
$ | (186,227 | ) | $ | (186,227 | ) | $ | (186,461 | ) | $ | 244 | $ | 372,444 | $ | (186,227 | ) | |||||||
F-83
Table of Contents
Quality Distribution, Inc. and Subsidiaries
Quality Distribution, Inc. and Subsidiaries
Notes to the Consolidated Financial Statements—(Continued)
(Unaudited)
Consolidating Statements of Operations
Six Months Ended June 30, 2010
Unaudited - (In 000’s)
| QDI | QD LLC & QD Capital |
Guarantor Subsidiaries |
Non-Guarantor Subsidiaries |
Eliminations | Consolidated | |||||||||||||||||
| Operating revenues: |
||||||||||||||||||||||
| Transportation |
$ | — | $ | — | $ | 248,390 | $ | — | $ | — | $ | 248,390 | ||||||||||
| Other service revenue |
— | — | 51,071 | 308 | — | 51,379 | ||||||||||||||||
| Fuel surcharge |
— | — | 39,116 | — | — | 39,116 | ||||||||||||||||
| Total operating revenues |
— | — | 338,577 | 308 | — | 338,885 | ||||||||||||||||
| Operating expenses: |
||||||||||||||||||||||
| Purchased transportation |
— | — | 233,975 | — | — | 233,975 | ||||||||||||||||
| Compensation |
— | — | 28,872 | — | — | 28,872 | ||||||||||||||||
| Fuel, supplies and maintenance |
— | — | 24,342 | — | — | 24,342 | ||||||||||||||||
| Depreciation and amortization |
— | — | 8,310 | — | — | 8,310 | ||||||||||||||||
| Selling and administrative |
— | 94 | 9,070 | 63 | 9,227 | |||||||||||||||||
| Insurance costs |
— | — | 7,867 | 10 | — | 7,877 | ||||||||||||||||
| Taxes and licenses |
— | — | 1,270 | — | — | 1,270 | ||||||||||||||||
| Communication and utilities |
— | — | 2,238 | — | — | 2,238 | ||||||||||||||||
| Loss on disposal of property and equipment |
— | — | 652 | — | — | 652 | ||||||||||||||||
| Impairment charge |
— | — | — | — | — | — | ||||||||||||||||
| Restructuring costs |
— | — | 2,215 | — | — | 2,215 | ||||||||||||||||
| Operating (loss) income |
— | (94 | ) | 19,766 | 235 | — | 19,907 | |||||||||||||||
| Interest expense (income), non-related party, net |
— | 16,216 | 803 | (29 | ) | — | 16,990 | |||||||||||||||
| Interest (income) expense, related party, net |
— | (16,216 | ) | 16,420 | (204 | ) | — | — | ||||||||||||||
| Other expense |
— | 94 | 119 | 13 | — | 226 | ||||||||||||||||
| (Loss) income before income taxes |
— | (188 | ) | 2,424 | 455 | — | 2,691 | |||||||||||||||
| Provision for (benefit from) income taxes |
— | — | 495 | (658 | ) | — | (163 | ) | ||||||||||||||
| Equity in earnings of subsidiaries |
2,854 | 3,042 | — | — | (5,896 | ) | — | |||||||||||||||
| Net income |
$ | 2,854 | $ | 2,854 | $ | 1,929 | $ | 1,113 | $ | (5,896 | ) | $ | 2,854 | |||||||||
F-84
Table of Contents
Quality Distribution, Inc. and Subsidiaries
Quality Distribution, Inc. and Subsidiaries
Notes to the Consolidated Financial Statements—(Continued)
(Unaudited)
Consolidating Statements of Operations
Six Months Ended June 30, 2009
Unaudited - (In 000’s)
| QDI | QD LLC & QD Capital |
Guarantor Subsidiaries |
Non-Guarantor Subsidiaries |
Eliminations | Consolidated | ||||||||||||||||||
| Operating revenues: |
|||||||||||||||||||||||
| Transportation |
$ | — | $ | — | $ | 223,110 | $ | — | $ | — | $ | 223,110 | |||||||||||
| Other service revenue |
— | — | 53,349 | 99 | — | 53,448 | |||||||||||||||||
| Fuel surcharge |
— | — | 22,960 | — | — | 22,960 | |||||||||||||||||
| Total operating revenues |
— | — | 299,419 | 99 | — | 299,518 | |||||||||||||||||
| Operating expenses: |
|||||||||||||||||||||||
| Purchased transportation |
— | — | 170,876 | — | — | 170,876 | |||||||||||||||||
| Compensation |
— | — | 42,751 | — | — | 42,751 | |||||||||||||||||
| Fuel, supplies and maintenance |
— | — | 33,462 | — | — | 33,462 | |||||||||||||||||
| Depreciation and amortization |
— | — | 10,639 | — | — | 10,639 | |||||||||||||||||
| Selling and administrative |
— | 32 | 13,975 | 15 | 14,022 | ||||||||||||||||||
| Insurance costs |
— | — | 7,985 | 10 | — | 7,995 | |||||||||||||||||
| Taxes and licenses |
— | — | 2,073 | — | — | 2,073 | |||||||||||||||||
| Communication and utilities |
— | — | 4,808 | — | — | 4,808 | |||||||||||||||||
| Gain on disposal of property and equipment |
— | — | (265 | ) | — | — | (265 | ) | |||||||||||||||
| Impairment charge |
— | — | 148,630 | — | — | 148,630 | |||||||||||||||||
| Restructuring costs |
— | — | 1,765 | — | — | 1,765 | |||||||||||||||||
| Operating (loss) income |
— | (32 | ) | (137,280 | ) | 74 | — | (137,238 | ) | ||||||||||||||
| Interest expense (income), non-related party, net |
— | 12,090 | 1,266 | (24 | ) | — | 13,332 | ||||||||||||||||
| Interest (income) expense, related party, net |
— | (12,090 | ) | 12,296 | (206 | ) | — | — | |||||||||||||||
| Gain on extinguishment of debt |
— | (675 | ) | — | — | — | (675 | ) | |||||||||||||||
| Other income |
— | — | (264 | ) | (12 | ) | — | (276 | ) | ||||||||||||||
| Income (loss) before income taxes |
— | 643 | (150,578 | ) | 316 | — | (149,619 | ) | |||||||||||||||
| Provision for income taxes |
— | — | 36,816 | 94 | — | 36,910 | |||||||||||||||||
| Equity in loss of subsidiaries |
(186,529 | ) | (187,172 | ) | — | — | 373,701 | — | |||||||||||||||
| Net (loss) income |
$ | (186,529 | ) | $ | (186,529 | ) | $ | (187,394 | ) | $ | 222 | $ | 373,701 | $ | (186,529 | ) | |||||||
F-85
Table of Contents
Quality Distribution, Inc. and Subsidiaries
Quality Distribution, Inc. and Subsidiaries
Notes to the Consolidated Financial Statements—(Continued)
(Unaudited)
Consolidating Balance Sheet
June 30, 2010
Unaudited - (In 000’s)
| QDI | QD LLC and QD Capital |
Guarantor Subsidiaries |
Non-Guarantor Subsidiaries |
Eliminations | Consolidated | |||||||||||||||||||
| ASSETS |
||||||||||||||||||||||||
| Current Assets: |
||||||||||||||||||||||||
| Cash and cash equivalents |
$ | — | $ | — | $ | 522 | $ | 2,370 | $ | — | $ | 2,892 | ||||||||||||
| Accounts receivable, net |
36 | — | 88,283 | 62 | — | 88,381 | ||||||||||||||||||
| Prepaid expenses |
— | 46 | 7,274 | 5 | — | 7,325 | ||||||||||||||||||
| Deferred tax asset, net |
— | — | 5,212 | — | — | 5,212 | ||||||||||||||||||
| Other |
537 | — | 5,543 | 112 | — | 6,192 | ||||||||||||||||||
| Total current assets |
573 | 46 | 106,834 | 2,549 | — | 110,002 | ||||||||||||||||||
| Property and equipment, net |
— | — | 122,230 | — | — | 122,230 | ||||||||||||||||||
| Goodwill |
— | — | 27,023 | — | — | 27,023 | ||||||||||||||||||
| Intangibles, net |
— | — | 17,671 | — | — | 17,671 | ||||||||||||||||||
| Investment in subsidiaries |
(145,333 | ) | 456,771 | 21,046 | — | (332,484 | ) | — | ||||||||||||||||
| Other assets |
— | 7,851 | 6,923 | — | — | 14,774 | ||||||||||||||||||
| Total assets |
$ | (144,760 | ) | $ | 464,668 | $ | 301,727 | $ | 2,549 | $ | (332,484 | ) | $ | 291,700 | ||||||||||
| LIABILITIES, REDEEMABLE NONCONTROLLING INTEREST AND SHAREHOLDERS’ (DEFICIT) EQUITY |
||||||||||||||||||||||||
| Current Liabilities: |
||||||||||||||||||||||||
| Current maturities of indebtedness |
$ | — | 16,031 | $ | 2,947 | $ | — | $ | — | $ | 18,978 | |||||||||||||
| Current maturities of capital lease obligations |
— | — | 4,358 | — | — | 4,358 | ||||||||||||||||||
| Accounts payable |
— | — | 9,097 | — | — | 9,097 | ||||||||||||||||||
| Intercompany |
(8,185 | ) | 302,091 | (266,992 | ) | (5,868 | ) | (21,046 | ) | — | ||||||||||||||
| Independent affiliates and independent owner-operators payable |
— | — | 12,815 | — | — | 12,815 | ||||||||||||||||||
| Accrued expenses |
570 | 2,562 | 14,106 | 15 | — | 17,253 | ||||||||||||||||||
| Environmental liabilities |
— | — | 4,904 | — | — | 4,904 | ||||||||||||||||||
| Accrued loss and damage claims |
— | — | 7,334 | — | — | 7,334 | ||||||||||||||||||
| Total current liabilities |
(7,615 | ) | 320,684 | (211,431 | ) | (5,853 | ) | (21,046 | ) | 74,739 | ||||||||||||||
| Long-term indebtedness, less current maturities |
— | 289,317 | 8,733 | — | — | 298,050 | ||||||||||||||||||
| Capital lease obligations, less current maturities |
— | — | 9,799 | — | — | 9,799 | ||||||||||||||||||
| Environmental liabilities |
— | — | 6,439 | — | — | 6,439 | ||||||||||||||||||
| Accrued loss and damage claims |
— | — | 9,519 | — | — | 9,519 | ||||||||||||||||||
| Other non-current liabilities |
(1,007 | ) | — | 28,252 | 214 | — | 27,459 | |||||||||||||||||
| Total liabilities |
(8,622 | ) | 610,001 | (148,689 | ) | (5,639 | ) | (21,046 | ) | 426,005 | ||||||||||||||
| Redeemable noncontrolling interest |
— | — | 1,833 | — | — | 1,833 | ||||||||||||||||||
| Shareholders’ equity (deficit): |
||||||||||||||||||||||||
| Common Stock |
370,126 | 354,963 | 490,761 | 6,933 | (852,657 | ) | 370,126 | |||||||||||||||||
| Treasury stock |
(1,580 | ) | — | — | — | — | (1,580 | ) | ||||||||||||||||
| Accumulated (deficit) retained earnings |
(291,714 | ) | (287,930 | ) | (18,682 | ) | 2,287 | 304,325 | (291,714 | ) | ||||||||||||||
| Stock recapitalization |
(189,589 | ) | (189,589 | ) | — | (55 | ) | 189,644 | (189,589 | ) | ||||||||||||||
| Accumulated other comprehensive loss |
(24,944 | ) | (24,473 | ) | (23,496 | ) | (977 | ) | 48,946 | (24,944 | ) | |||||||||||||
| Stock purchase warrants |
1,696 | 1,696 | — | — | (1,696 | ) | 1,696 | |||||||||||||||||
| Stock subscriptions receivable |
(133 | ) | — | — | — | — | (133 | ) | ||||||||||||||||
| Total shareholders’ (deficit) equity |
(136,138 | ) | (145,333 | ) | 448,583 | 8,188 | (311,438 | ) | (136,138 | ) | ||||||||||||||
| Total liabilities, redeemable noncontrolling interest and shareholders’ (deficit) equity |
$ | (144,760 | ) | $ | 464,668 | $ | 301,727 | $ | 2,549 | $ | (332,484 | ) | $ | 291,700 | ||||||||||
F-86
Table of Contents
Quality Distribution, Inc. and Subsidiaries
Quality Distribution, Inc. and Subsidiaries
Notes to the Consolidated Financial Statements—(Continued)
(Unaudited)
Consolidating Balance Sheet
December 31, 2009
Unaudited - (In 000’s)
| QDI | QD LLC and QD Capital |
Guarantor Subsidiaries |
Non-Guarantor Subsidiaries |
Eliminations | Consolidated | |||||||||||||||||||
| ASSETS |
||||||||||||||||||||||||
| Current Assets: |
||||||||||||||||||||||||
| Cash and cash equivalents |
$ | — | $ | — | $ | 3,531 | $ | 2,102 | $ | — | $ | 5,633 | ||||||||||||
| Accounts receivable, net |
52 | — | 69,477 | 96 | — | 69,625 | ||||||||||||||||||
| Prepaid expenses |
— | 96 | 8,473 | 15 | — | 8,584 | ||||||||||||||||||
| Deferred tax asset, net |
— | — | 5,506 | — | — | 5,506 | ||||||||||||||||||
| Other |
(104 | ) | — | 4,460 | 64 | — | 4,420 | |||||||||||||||||
| Total current assets |
(52 | ) | 96 | 91,447 | 2,277 | — | 93,768 | |||||||||||||||||
| Property and equipment, net |
— | — | 127,329 | — | — | 127,329 | ||||||||||||||||||
| Goodwill |
— | — | 27,023 | — | — | 27,023 | ||||||||||||||||||
| Intangibles, net |
— | — | 18,467 | — | — | 18,467 | ||||||||||||||||||
| Investment in subsidiaries |
(143,830 | ) | 456,186 | 21,229 | — | (333,585 | ) | — | ||||||||||||||||
| Other assets |
— | 9,204 | 3,825 | — | — | 13,029 | ||||||||||||||||||
| Total assets |
$ | (143,882 | ) | $ | 465,486 | $ | 289,320 | $ | 2,277 | $ | (333,585 | ) | $ | 279,616 | ||||||||||
| LIABILITIES, REDEEMABLE NONCONTROLLING INTEREST AND SHAREHOLDERS’ (DEFICIT) EQUITY |
||||||||||||||||||||||||
| Current Liabilities: |
||||||||||||||||||||||||
| Current maturities of indebtedness |
$ | — | $ | 16,031 | $ | 3,835 | $ | — | $ | — | $ | 19,866 | ||||||||||||
| Current maturities of capital lease obligations |
— | — | 5,322 | — | — | 5,322 | ||||||||||||||||||
| Accounts payable |
— | — | 6,182 | — | — | 6,182 | ||||||||||||||||||
| Intercompany |
(2,139 | ) | 312,705 | (283,664 | ) | (5,673 | ) | (21,229 | ) | — | ||||||||||||||
| Independent affiliates and independent owner-operators payable |
— | — | 9,734 | — | — | 9,734 | ||||||||||||||||||
| Accrued expenses |
— | 5,053 | 16,313 | 12 | — | 21,378 | ||||||||||||||||||
| Environmental liabilities |
— | — | 3,408 | — | — | 3,408 | ||||||||||||||||||
| Accrued loss and damage claims |
— | — | 8,862 | — | — | 8,862 | ||||||||||||||||||
| Total current liabilities |
(2,139 | ) | 333,789 | (230,008 | ) | (5,661 | ) | (21,229 | ) | 74,752 | ||||||||||||||
| Long-term indebtedness, less current maturities |
— | 275,527 | 8,726 | — | — | 284,253 | ||||||||||||||||||
| Capital lease obligations, less current maturities |
— | — | 11,843 | — | — | 11,843 | ||||||||||||||||||
| Environmental liabilities |
— | — | 8,241 | — | — | 8,241 | ||||||||||||||||||
| Accrued loss and damage claims |
— | — | 10,534 | — | — | 10,534 | ||||||||||||||||||
| Other non-current liabilities |
(1,007 | ) | — | 29,044 | 859 | — | 28,896 | |||||||||||||||||
| Total liabilities |
(3,146 | ) | 609,316 | (161,620 | ) | (4,802 | ) | (21,229 | ) | 418,519 | ||||||||||||||
| Redeemable noncontrolling interest in subsidiary |
— | — | 1,833 | — | — | 1,833 | ||||||||||||||||||
| Shareholders’ (deficit) equity: |
||||||||||||||||||||||||
| Common Stock |
364,046 | 354,963 | 493,861 | 6,933 | (855,757 | ) | 364,046 | |||||||||||||||||
| Treasury stock |
(1,580 | ) | — | — | — | — | (1,580 | ) | ||||||||||||||||
| Accumulated (deficit) retained earnings |
(294,568 | ) | (290,784 | ) | (20,611 | ) | 1,174 | 310,221 | (294,568 | ) | ||||||||||||||
| Stock recapitalization |
(189,589 | ) | (189,589 | ) | — | (55 | ) | 189,644 | (189,589 | ) | ||||||||||||||
| Accumulated other comprehensive loss |
(25,587 | ) | (25,116 | ) | (24,143 | ) | (973 | ) | 50,232 | (25,587 | ) | |||||||||||||
| Stock purchase warrants |
6,696 | 6,696 | — | — | (6,696 | ) | 6,696 | |||||||||||||||||
| Stock subscriptions receivable |
(154 | ) | — | — | — | — | (154 | ) | ||||||||||||||||
| Total shareholders’ (deficit) equity |
(140,736 | ) | (143,830 | ) | 449,107 | 7,079 | (312,356 | ) | (140,736 | ) | ||||||||||||||
| Total liabilities, redeemable noncontrolling interest and shareholders’ (deficit) equity |
$ | (143,882 | ) | $ | 465,486 | $ | 289,320 | $ | 2,277 | $ | (333,585 | ) | $ | 279,616 | ||||||||||
F-87
Table of Contents
Quality Distribution, Inc. and Subsidiaries
Quality Distribution, Inc. and Subsidiaries
Notes to the Consolidated Financial Statements—(Continued)
(Unaudited)
Condensed Consolidating Statements of Cash Flows
Six Months Ended June 30, 2010
Unaudited - (In 000’s)
| QDI | QD LLC and QD Capital |
Guarantor Subsidiaries |
Non-Guarantor Subsidiaries |
Eliminations | Consolidated | |||||||||||||||||||
| Cash flows from operating activities: |
||||||||||||||||||||||||
| Net income |
$ | 2,854 | $ | 2,854 | $ | 1,929 | $ | 1,113 | $ | (5,896 | ) | 2,854 | ||||||||||||
| Adjustments for non-cash charges |
(1,777 | ) | (15,450 | ) | 25,068 | (204 | ) | 5,896 | 13,533 | |||||||||||||||
| Net changes in assets and liabilities |
(55 | ) | (1,088 | ) | (22,212 | ) | 834 | — | (22,521 | ) | ||||||||||||||
| Intercompany activity |
(1,022 | ) | 13,684 | (11,187 | ) | (1,475 | ) | — | — | |||||||||||||||
| Net cash (used in) provided by operating activities |
— | — | (6,402 | ) | 268 | — | (6,134 | ) | ||||||||||||||||
| Cash flows from investing activities: |
||||||||||||||||||||||||
| Capital expenditures |
— | — | (5,675 | ) | — | — | (5,675 | ) | ||||||||||||||||
| Proceeds from sales of property and equipment |
— | — | 3,309 | — | — | 3,309 | ||||||||||||||||||
| Net cash used in investing activities |
— | — | (2,366 | ) | — | — | (2,366 | ) | ||||||||||||||||
| Cash flows from financing activities: |
||||||||||||||||||||||||
| Principal payments on long-term debt and capital lease obligations |
— | — | (5,654 | ) | — | — | (5,654 | ) | ||||||||||||||||
| Proceeds from revolver |
— | 36,500 | — | — | — | 36,500 | ||||||||||||||||||
| Payments on revolver |
— | (25,000 | ) | — | — | — | (25,000 | ) | ||||||||||||||||
| Other |
3 | (166 | ) | 76 | — | — | (87 | ) | ||||||||||||||||
| Intercompany activity |
(3 | ) | (11,334 | ) | 11,337 | — | — | — | ||||||||||||||||
| Net cash provided by financing activities |
— | — | 5,759 | — | — | 5,759 | ||||||||||||||||||
| Effect of exchange rate changes on cash |
— | — | — | — | — | — | ||||||||||||||||||
| Net (decrease) increase in cash and cash equivalents |
— | — | (3,009 | ) | 268 | — | (2,741 | ) | ||||||||||||||||
| Cash and cash equivalents, beginning of period |
— | — | 3,531 | 2,102 | — | 5,633 | ||||||||||||||||||
| Cash and cash equivalents, end of period |
$ | — | $ | — | $ | 522 | $ | 2,370 | $ | — | $ | 2,892 | ||||||||||||
F-88
Table of Contents
Quality Distribution, Inc. and Subsidiaries
Quality Distribution, Inc. and Subsidiaries
Notes to the Consolidated Financial Statements—(Continued)
(Unaudited)
Condensed Consolidating Statements of Cash Flows
Six Months Ended June 30, 2009
Unaudited - (In 000’s)
| QDI | QD LLC and QD Capital |
Guarantor Subsidiaries |
Non-Guarantor Subsidiaries |
Eliminations | Consolidated | |||||||||||||||||||
| Cash flows from operating activities: |
||||||||||||||||||||||||
| Net (loss) income |
$ | (186,529 | ) | $ | (186,529 | ) | $ | (187,394 | ) | $ | 222 | $ | 373,701 | $ | (186,529 | ) | ||||||||
| Adjustments for non-cash charges |
186,529 | 175,496 | 210,841 | (206 | ) | (373,701 | ) | 198,959 | ||||||||||||||||
| Net changes in assets and liabilities |
(1,181 | ) | (37 | ) | 11,118 | 168 | — | 10,068 | ||||||||||||||||
| Intercompany activity |
1,181 | 11,070 | (11,916 | ) | (335 | ) | — | — | ||||||||||||||||
| Net cash provided by (used in) operating activities |
— | — | 22,649 | (151 | ) | — | 22,498 | |||||||||||||||||
| Cash flows from investing activities: |
||||||||||||||||||||||||
| Capital expenditures |
— | — | (5,706 | ) | — | — | (5,706 | ) | ||||||||||||||||
| Proceeds from sales of property and equipment |
— | — | 5,095 | — | — | 5,095 | ||||||||||||||||||
| Net cash used in investing activities |
— | — | (611 | ) | — | — | (611 | ) | ||||||||||||||||
| Cash flows from financing activities: |
||||||||||||||||||||||||
| Proceeds from issuance of long-term debt |
— | — | — | — | — | — | ||||||||||||||||||
| Principal payments on long-term debt and capital lease obligations |
— | (2,825 | ) | (6,870 | ) | — | — | (9,695 | ) | |||||||||||||||
| Proceeds from revolver |
— | 20,000 | — | — | — | 20,000 | ||||||||||||||||||
| Payments on revolver |
— | (30,500 | ) | — | — | — | (30,500 | ) | ||||||||||||||||
| Other |
— | (72 | ) | (5,489 | ) | — | — | (5,561 | ) | |||||||||||||||
| Intercompany activity |
— | 13,397 | (13,397 | ) | — | — | — | |||||||||||||||||
| Net cash used in financing activities |
— | — | (25,756 | ) | — | — | (25,756 | ) | ||||||||||||||||
| Effect of exchange rate changes on cash |
— | — | 16 | — | — | 16 | ||||||||||||||||||
| Net decrease in cash and cash equivalents |
— | — | (3,702 | ) | (151 | ) | — | (3,853 | ) | |||||||||||||||
| Cash and cash equivalents, beginning of period |
— | — | 4,725 | 2,062 | — | 6,787 | ||||||||||||||||||
| Cash and cash equivalents, end of period |
$ | — | $ | — | $ | 1,023 | $ | 1,911 | $ | — | $ | 2,934 | ||||||||||||
F-89
Table of Contents

Table of Contents
PART II
INFORMATION NOT REQUIRED IN PROSPECTUS
| Item 13. | Other Expenses of Issuance and Distribution |
The following table sets forth the costs and expenses payable by Quality Distribution, Inc. in connection with the issuance and distribution of the securities being registered. All amounts are estimates except the SEC registration fee and the FINRA filing fee.
| SEC registration fee |
$ | 4,635.00 | |
| FINRA filing fee |
$ | 7,000.00 | |
| Printing expenses |
$ | 100,000.00 | |
| Transfer agent fees |
$ | 20,000.00 | |
| Legal and accounting fees and expenses |
$ | 750,000.00 | |
| Miscellaneous |
$ | 50,000.00 | |
| Total |
$ | 931,635.00 | |
| Item 14. | Indemnification of Directors and Officers. |
Section 607.0850 of the Florida Business Corporation Act, or FBCA, permits, in general, a Florida corporation to indemnify any person who was or is a party to any proceeding (other than an action by, or in the right of, the corporation) by reason of the fact that he or she is or was a director or officer of the corporation, or served another entity in any capacity at the request of the corporation, against liability incurred in connection with such proceeding, including the estimated expenses of litigating the proceeding to conclusion and the expenses actually and reasonably incurred in connection with the defense or settlement of such proceeding, including any appeal thereof, if such person acted in good faith for a purpose he or she reasonably believed to be in, or not opposed to the best interest of the corporation and, in criminal actions or proceedings, additionally had no reasonable cause to believe that his or her conduct was unlawful. Section 607.0850(6) of the FBCA permits the corporation to pay such costs or expenses in advance of a final disposition of such action or proceeding upon receipt of an undertaking by or on behalf of the director or officer to repay such amount if he or she is ultimately found not to be entitled to indemnification under the FBCA. Section 607.0850 of the FBCA provides that the indemnification and advancement of expense provisions contained in the FBCA shall not be deemed exclusive of any rights to which a director or officer seeking indemnification or advancement of expenses may be entitled.
In accordance with the provisions of our bylaws, we shall indemnify, to the fullest extent permitted by law, any person who is or was a party, or is threatened to be made a party to, any threatened, pending or contemplated action, suit or other type of proceeding (other than an action by or in our right), whether civil, criminal, administrative, investigative or otherwise, and whether formal or informal, by reason of the fact that such person is or was our director or our officer or is or was serving at our request (as a director, officer, employee or agent of another corporation, partnership, joint venture, trust or other enterprise) against judgments, amounts paid in settlement, penalties, fines (including an excise tax assessed with respect to any employee benefit plan) and expenses (including counsel fees) actually and reasonably incurred in connection with any such action, suit or other proceeding, including any appeal thereof, if such person acted in good faith and in a manner such person reasonably believed to be in, or not opposed to, our best interests and, with respect to any criminal action or proceeding, had no reasonable cause to believe such person’s conduct was unlawful. The termination of any such action, suit or other proceeding by judgment, order, settlement or conviction, or upon a plea of nolo contendere or its equivalent, shall not, of itself, create a presumption that the person did not act in good faith and in a manner that such person reasonably believed to be in, or not opposed to, our best interests or, with respect to any criminal action or proceeding, had reasonable cause to believe that such person’s conduct was unlawful. In addition, we also carry insurance on behalf of our directors, officers, employees or agents that may cover liabilities under the Securities Act.
II-1
Table of Contents
At present, there is no pending litigation or proceeding involving any of our directors, officers or employees regarding which indemnification is sought, nor are we aware of any threatened litigation that may result in claims for indemnification.
| Item 15. | Recent Sales of Unregistered Securities |
Set forth below in chronological order is certain information regarding securities issued by the Registrant since April 1, 2007 in transactions that were not registered under the Securities Act of 1933 as amended (the “Securities Act”), including the consideration, if any, received by the Registrant for such issuances.
| 1. | On December 18, 2007, Quality Distribution, LLC and QD Capital Corporation issued in a private offering an aggregate of $50.0 million of their Senior Floating Rate Notes due 2012 to Credit Suisse Securities (USA), as initial purchaser, who subsequently resold the 2006 Notes at an offering price of 93.00% to qualified institutional buyers pursuant to Rule 144A under the Securities Act and to non-U.S. persons outside of the United States in reliance on Regulation S under the Securities Act. The Senior Floating Rate Notes due 2012 were sold to the initial purchaser at a price of 90.675% of par value. |
| 2. | On December 18, 2007, the Registrant issued a promissory note (the “Boasso Note”) in the principal amount of $2.5 million for the benefit of Walter J. Boasso in connection with the Registrant’s acquisition of all the outstanding capital stock of Boasso America Corporation, which promissory note has been paid in full. The Boasso Note had a term of two years, and the holder had the right to require that the Boasso Note be paid in full on the first anniversary of the acquisition. The Boasso Note was convertible into shares of the Registrant’s common stock following the first anniversary of the acquisition at the election of the holder at a price of $4.47 per share (the closing price of the shares reported on NASDAQ on the day before the acquisition). If the conversion option was exercised, the Registrant had the right, instead of issuing shares to pay the holder a cash amount equal to the number of shares of common stock into which the Boasso Note was then convertible multiplied by the 10-day trailing average closing price for the common stock plus any accrued and unpaid interest. The Registrant issued the Boasso Note in reliance upon the exemption from registration in Section 4(2) of the Securities Act of 1933 for the offer and sale of securities not involving a public offering because, among other things, the Boasso Note was issued to a single, accredited, sophisticated investor on terms negotiated as an integral part of the terms that were negotiated for the Registrant’s acquisition of all capital stock of Boasso America Corporation. |
| 3. | On October 15, 2009, Quality Distribution, LLC and QD Capital Corporation issued in a private offering to qualified institutional buyers pursuant to Rule 144A under the Securities Act and to non-U.S. persons outside of the United States in reliance on Regulation S under the Securities Act an aggregate of $134.5 million of their 10% Senior Notes due 2013 in exchange for $134.5 million of their Senior Floating Rate Notes due 2012. |
| 4. | On October 15, 2009, Quality Distribution, LLC and QD Capital Corporation issued in a private offering to qualified institutional buyers pursuant to Rule 144A under the Securities Act and to non-U.S. persons outside of the United States in reliance on Regulation S under the Securities Act an aggregate of $80.7 million of their 11.75% Senior Subordinated PIK Notes due 2013 and 1.75 million warrants (as described below) in exchange for $134.5 million of their 9% Senior Subordinated Notes due 2010. |
| 5. | On October 15, 2009, the Registrant issued warrants to purchase approximately 1.75 million shares of its common stock at an exercise price of $0.01 per share to qualified institutional buyers pursuant to Rule 144A under the Securities Act and to non-U.S. persons outside of the United States in reliance on Regulation S under the Securities Act as partial consideration, together with $80.7 million of the Registrant’s 11.75% Senior Subordinated PIK Notes due 2013, in exchange for $83.6 million aggregate principal amount of Quality Distribution, LLC’s and QD Capital Corporation’s 9% Senior Subordinated Notes due 2010. The warrants are exercisable to purchase shares of the Registrant’s common stock at an exercise price of $0.01 per share, during the period beginning April 16, 2010 and ending on November 1, 2013. |
II-2
Table of Contents
Each of the above-described transactions were exempt from registration under the Securities Act, as described above. With respect to each transaction listed above, no general solicitation was made by either the Registrant or any person acting on its behalf; the securities sold were subject to transfer restrictions upon issuance; and the certificates for the securities contained an appropriate legend stating such securities have not been registered under the Securities Act and may not be offered or sold absent registration or pursuant to an exemption therefrom. Except as described above, no underwriters were involved in connection with any of the sales of securities referred to in this Item 15.
| Item 16. | Exhibits and Financial Statement Schedules. |
(a) Exhibits
See the Index to Exhibits immediately following the signature pages included in this Registration Statement.
(b) Financial Statement Schedules
All financial statement schedules are omitted because they are inapplicable, not required or the information is contained in the financial statements and related notes appearing in our Annual Report on Form 10-K for the fiscal year ended December 31, 2009, which has been incorporated by reference into this registration statement.
| Item 17. | Undertakings. |
(a) The undersigned hereby undertakes to deliver or cause to be delivered with the prospectus, to each person to whom the prospectus is sent or given, the latest annual report, to security holders that is incorporated by reference in the prospectus and furnished pursuant to and meeting the requirements of Rule 14a-3 or Rule 14c-3 under the Securities Exchange Act of 1934; and, where interim financial information required to be presented by Article 3 of Regulation S-X is not set forth in the prospectus, to deliver, or cause to be delivered to each person to whom the prospectus is sent or given, the latest quarterly report that is specifically incorporated by reference in the prospectus to provide such interim financial information.
(b) Insofar as indemnification for liabilities arising under the Securities Act of 1933 may be permitted to directors, officers, or controlling persons of the registrant pursuant to the foregoing provisions, or otherwise, the registrant has been advised that in the opinion of the Securities and Exchange Commission such indemnification is against public policy as expressed in the Securities Act of 1933 and is therefore unenforceable. In the event that a claim for indemnification by the registrant against such liabilities, other than the payment by the registrant of expenses incurred or paid by a director, officer or controlling person of the registrant in the successful defense of any action, suit or proceeding, is asserted by such director, officer or controlling person in connection with the securities being registered, the registrant will, unless in the opinion of its counsel the matter has been settled by controlling precedent, submit to a court of appropriate jurisdiction the question whether such indemnification by it is against public policy as expressed in the Act and will be governed by the final adjudication of such issue.
(c) The undersigned registrant hereby undertakes that:
(i) For purposes of determining any liability under the Securities Act of 1933, the information omitted from the form of prospectus filed as part of this registration statement in reliance upon Rule 430A and contained in a form of prospectus filed by the registrant pursuant to Rule 424(b)(1) or (4) or 497(h) under the Securities Act of 1933 shall be deemed to be part of this registration statement as of the time it was declared effective.
(ii) For the purpose of determining any liability under the Securities Act of 1933, each post-effective amendment that contains a form of prospectus shall be deemed to be a new registration statement relating to the securities offered therein, and the offering of such securities at that time shall be deemed to be the initial bona fide offering thereof.
II-3
Table of Contents
SIGNATURES
Pursuant to the requirements of the Securities Act of 1933, the Registrant has duly caused this Registration Statement to be signed on its behalf by the undersigned, thereunto duly authorized, in the City of Tampa, State of Florida, on the 10th day of September, 2010.
| QUALITY DISTRIBUTION, INC. | ||
| By: |
/s/ GARY R. ENZOR | |
| Gary R. Enzor Chief Executive Officer | ||
Pursuant to the requirements of the Securities Act of 1933, this Registration Statement has been signed by the following persons in the capacities and on the dates indicated:
| Signature |
Title |
Date | ||||
| /s/ GARY R. ENZOR Gary R. Enzor |
Chief Executive Officer and Director (Principal Executive Officer) |
September 10, 2010 | ||||
| /s/ STEPHEN R. ATTWOOD Stephen R. Attwood |
President and Chief Operating Officer (Principal Executive Officer) |
September 10, 2010 | ||||
| /s/ JOSEPH J. TROY Joseph J. Troy |
Executive Vice President and Chief Financial Officer (Principal Financial and Accounting Officer) |
September 10, 2010 | ||||
| * Thomas M. White |
Director |
September 10, 2010 | ||||
| * Marc E. Becker |
Director |
September 10, 2010 | ||||
| * Richard B. Marchese |
Director |
September 10, 2010 | ||||
| * Alan H. Schumacher |
Director |
September 10, 2010 | ||||
| * Kevin E. Crowe |
Director |
September 10, 2010 | ||||
| * Thomas R. Miklich |
Director |
September 10, 2010 | ||||
| * M. Ali Rashid |
Director |
September 10, 2010 | ||||
| *By: |
/s/ GARY R. ENZOR | |||||
| Attorney-in-fact | ||||||
II-4
Table of Contents
INDEX TO EXHIBITS
| Exhibit No. |
Description | |
| 1.1* | Form of Underwriting Agreement. | |
| 3.1 | Amended and Restated Articles of Incorporation of Quality Distribution, Inc., dated November 4, 2003. Incorporated herein by reference to Exhibit 3.1 to Quality Distribution, Inc.’s Amendment No. 3 to Registration Statement on Form S-1 filed on November 5, 2003 (Registration No. 333-108344). | |
| 3.2 | Amended and Restated Bylaws of Quality Distribution. Inc., dated June 28, 2005. Incorporated herein by reference to Exhibit 3.2 to Quality Distribution, Inc.’s Current Report on Form 8-K filed on June 28, 2005 (Registration No. 333-108344). | |
| 3.3 | Articles of Amendment, dated June 28, 2005 to Amended and Restated Articles of Incorporation of Quality Distribution, Inc. Incorporated herein by reference to Exhibit 3.1 to Quality Distribution, Inc.’s Current Report on Form 8-K filed on June 28, 2005. | |
| 3.4 | Articles of Amendment to Articles of Incorporation of Quality Distribution, Inc. Incorporated herein by reference to Exhibit 3.1 to Quality Distribution, Inc.’s Current Report on Form 8-K filed on May 28, 2010. | |
| 4.1 | Indenture governing the 9% Senior Subordinated Notes due 2010, dated as of November 13, 2003, among Quality Distribution, LLC, QD Capital Corporation, the guarantors named therein and The Bank of New York, as trustee. Incorporated herein by reference to Exhibit 4.5 to Quality Distribution, Inc.’s Annual Report on Form 10-K filed on March 30, 2004. | |
| 4.2 | Supplemental Indenture to the Indenture governing the 9% Senior Subordinated Notes due 2010, dated as of December 18, 2007, among Quality Distribution, LLC, QD Capital Corporation, Boasso America Corporation and The Bank of New York Trust Company, N.A., as trustee. Incorporated herein by reference to Exhibit 10.6 to Quality Distribution, Inc.’s Current Report on Form 8-K filed on December 24, 2007. | |
| 4.3 | Second Supplemental Indenture to the Indenture governing the 9% Senior Subordinated Notes due 2010, dated as of August 27, 2009, among Quality Distribution, LLC, QD Capital Corporation, QD Risk Services, Inc. and The Bank of New York Mellon, as trustee. Incorporated herein by reference to Exhibit 10.1 to Quality Distribution, Inc.’s Current Report on Form 8-K filed on August 31, 2009. | |
| 4.4 | Third Supplemental Indenture to the Indenture governing the Quality Distribution, LLC and QD Capital Corporation’s 9% Senior Subordinated Notes due 2010, dated as of October 14, 2009, among Quality Distribution, LLC, QD Capital Corporation, the guarantors named therein and The Bank of New York Mellon, as trustee. Incorporated herein by reference to Exhibit 4.1 to Quality Distribution, Inc.’s Current Report on Form 8-K filed on October 14, 2009. | |
| 4.5 | Form of Exchange Note for the 9% Senior Subordinated Notes due 2010 (included as Exhibit B to Exhibit 4.1). | |
| 4.6 | Indenture governing the Senior Floating Rate Notes due 2012, dated as of January 28, 2005, among Quality Distribution, LLC, QD Capital Corporation, the guarantors named therein and The Bank of New York Trust Company, N.A. as trustee. Incorporated herein by reference to Exhibit 10.2 to Quality Distribution, Inc.’s Current Report on Form 8-K filed on January 28, 2005. | |
| 4.7 | Supplemental Indenture to the Indenture governing the Senior Floating Rate Notes due 2012, dated as of December 18, 2007, among Quality Distribution, LLC, QD Capital Corporation, the guarantors named therein, Boasso America Corporation and The Bank of New York Trust Company, N.A., as trustee. Incorporated herein by reference to Exhibit 10.7 to Quality Distribution, Inc.’s Current Report on Form 8-K filed on December 24, 2007. | |
| 4.8 | Second Supplemental Indenture to the Indenture governing the Senior Floating Rate Notes due 2012, Series A, dated as of August 27, 2009, among Quality Distribution, LLC, QD Capital Corporation, the guarantors named therein, QD Risk Services, Inc. and The Bank of New York Mellon Trust Company, N.A., as trustee. Incorporated herein by reference to Exhibit 10.2 to Quality Distribution, Inc.’s Current Report on Form 8-K filed on August 31, 2009. | |
Table of Contents
| Exhibit No. |
Description | |
| 4.9 | Third Supplemental Indenture to the Indenture governing the Senior Floating Rate Notes due 2012, Series A, dated as of September 29, 2009, among Quality Distribution, LLC, QD Capital Corporation, the guarantors named therein and The Bank of New York Mellon Trust Company, N.A., as trustee. Incorporated herein by reference to Exhibit 4.1(a) to Quality Distribution, Inc.’s Current Report on Form 8-K filed on September 30, 2009. | |
| 4.10 | Form of Exchange Note for the Senior Floating Rate Notes due 2012, Series A (included as Exhibit B to Exhibit 4.6). | |
| 4.11 | Indenture with respect to the Senior Floating Rate Notes due 2012, Series B, dated as of December 18, 2007, among Quality Distribution, LLC, QD Capital Corporation, the guarantors named therein and The Bank of New York Trust Company, N.A., as trustee. Incorporated herein by reference to Exhibit 10.1 to Quality Distribution, Inc.’s Current Report on Form 8-K filed on December 24, 2007. | |
| 4.12 | Supplemental Indenture to the Indenture governing the Senior Floating Rate Notes due 2012, Series B, dated as of August 27, 2009, among Quality Distribution, LLC, QD Capital Corporation, the guarantors named therein, QD Risk Services, Inc. and The Bank of New York Mellon Trust Company, N.A., as trustee. Incorporated herein by reference to Exhibit 10.3 to Quality Distribution, Inc.’s Current Report on Form 8-K filed on August 31, 2009. | |
| 4.13 | Second Supplemental Indenture to the Indenture governing the Senior Floating Rate Notes due 2012, Series B, dated as of September 29, 2009, among Quality Distribution, LLC, QD Capital Corporation, the guarantors named therein and The Bank of New York Mellon Trust Company, N.A., as trustee. Incorporated herein by reference to Exhibit 4.1(b) to Quality Distribution, Inc.’s Current Report on Form 8-K filed on September 30, 2009. | |
| 4.14 | Form of Exchange Note for the Senior Floating Rate Notes due 2012, Series B (included as Exhibit B to Exhibit 4.11). | |
| 4.15 | Credit Agreement, dated as of December 18, 2007, among Quality Distribution, Inc., Quality Distribution, LLC, Credit Suisse, Cayman Islands Branch, as administrative agent, General Electric Capital Corporation, as collateral agent, SunTrust Bank, as syndication agent the lenders party thereto. Incorporated herein by reference to Exhibit 10.3 to Quality Distribution, Inc.’s Current Report on Form 8-K filed on December 24, 2007. | |
| 4.16 | Current Asset Revolving Facility Guarantee and Collateral Agreement, dated as of December 18, 2007, among Quality Distribution, Inc., Quality Distribution, LLC, its subsidiaries party thereto, Credit Suisse, Cayman Islands Branch, as current asset revolving facility administrative agent, General Electric Capital Corporation, as current asset revolving facility collateral agent and SunTrust Bank, as syndication agent. Incorporated herein by reference to Exhibit 10.4 to Quality Distribution, Inc.’s Current Report on Form 8-K filed on December 24, 2007. | |
| 4.17 | Fixed Asset Revolving Facility Guarantee and Collateral Agreement, dated as of December 18, 2007, among Quality Distribution, Inc., Quality Distribution, LLC, its subsidiaries party thereto, Credit Suisse, Cayman Islands Branch, as fixed asset revolving facility administrative agent, and General Electric Capital Corporation, as fixed asset revolving facility collateral agent. Incorporated herein by reference to Exhibit 10.5 to Quality Distribution, Inc.’s Current Report on Form 8-K filed on December 24, 2007. | |
| 4.18 | Indenture with respect to the 10% Senior Notes due 2013, dated as of October 15, 2009, among Quality Distribution, LLC, QD Capital Corporation, the guarantors named therein and The Bank of New York Mellon Trust Company, N.A., as trustee. Incorporated herein by reference to Exhibit 4.1 to Quality Distribution, Inc.’s Current Report on Form 8-K filed on October 16, 2009. | |
| 4.19 | Form of Exchange Note for the 10% Senior Notes due 2013 (included as Exhibit B to Exhibit 4.18). | |
Table of Contents
| Exhibit No. |
Description | |
| 4.20 | Registration Rights Agreement with respect to the 10% Senior Notes due 2013, dated as October 15, 2009, among Quality Distribution, LLC, QD Capital Corporation, the guarantors named therein, and Credit Suisse Securities (USA) LLC and Moelis & Company LLC, as dealer managers. Incorporated herein by reference to Exhibit 4.2 to Quality Distribution, Inc.’s Current Report on Form 8-K filed on October 16, 2009. | |
| 4.21 | Indenture with respect to the 11.75% Senior Subordinated PIK Notes due 2013, dated as of October 15, 2009, among Quality Distribution, LLC, QD Capital Corporation, the guarantors named therein and The Bank of New York Mellon Trust Company, N.A., as trustee. Incorporated herein by reference to Exhibit 4.3 to Quality Distribution, Inc.’s Current Report on Form 8-K filed on October 16, 2009. | |
| 4.22 | Form of Exchange Note for the 11.75% Senior Subordinated PIK Notes due 2013 (included as Exhibit B to Exhibit 4.21). | |
| 4.23 | Registration Rights Agreement with respect to the 11.75% Senior Subordinated PIK Notes due 2013, dated as October 15, 2009, among Quality Distribution, LLC, QD Capital Corporation, the guarantors named therein and Credit Suisse Securities (USA) LLC and Moelis & Company LLC, as dealer managers. Incorporated herein by reference to Exhibit 4.4 to Quality Distribution, Inc.’s Current Report on Form 8-K filed on October 16, 2009. | |
| 4.24 | Warrant Agreement, dated as October 15, 2009, between Quality Distribution, Inc. and The Bank of New York Mellon Trust Company, N.A., as warrant agent. Incorporated herein by reference to Exhibit 4.5 to Quality Distribution, Inc.’s Current Report on Form 8-K filed on October 16, 2009. | |
| 5.1† | Form of Opinion of Shumaker, Loop & Kendrick, LLP. | |
| 10.1 | Amended and Restated Shareholders’ Agreement, dated as of February 10, 1998, among MTL, Apollo Investment Fund III, L.P., Apollo Overseas Partners III, L.P., Apollo U.K. Fund III, L.P. and certain shareholders of QDI. Incorporated herein by reference to Exhibit No. 4.13 to Quality Distribution, Inc.’s Annual Report on Form 10-K filed with the Securities and Exchange Commission on March 29, 2002. | |
| 10.2 | Amended and Restated Common and Preferred Stock Purchase and Shareholders’ Agreement, dated as of August 28, 1998, among BT Investment Partners, Inc., MTL Equity Investors, L.L.C., Apollo Investment Fund III, L.P., Apollo Overseas Partners III, L.P., Apollo U.K. Fund III, L.P. and MTL. Incorporated herein by reference to Exhibit No. 4.14 to Quality Distribution, Inc.’s Annual Report on Form 10-K filed with the Securities and Exchange Commission on March 29, 2002. | |
| 10.3 | Amendment No. 1, dated as of April 2, 2002, to the Amended and Restated Common and Preferred Stock Purchase and Shareholders’ Agreement, dated as of August 28, 1998, among BT Investment Partners, Inc., MTL Equity Investors, L.L.C., Apollo Investment Fund III, L.P., Apollo Overseas Partners III, L.P., Apollo U.K. Fund III, L.P. and MTL. Incorporated herein by reference to Exhibit No. 10.3 to Quality Distribution, LLC’s Registration Statement on Form S-4 filed with the Securities and Exchange Commission on August 14, 2002 (Registration No. 333-98077). | |
| 10.4 | Second Amended and Restated Registration Rights Agreement, dated as of May 30, 2002, among Apollo Investment Fund III, L.P., Apollo Overseas Partners III, L.P., Apollo U.K. Fund III, L.P., QDI and certain shareholders of QDI. Incorporated herein by reference to Exhibit No. 10.4 to Quality Distribution, LLC’s Registration Statement on Form S-4 filed with the Securities and Exchange Commission on August 14, 2002 (Registration No. 333-98077). | |
| 10.5 | Agreement, dated as of May 30, 2002, among Apollo Investment Fund III, L.P., Apollo Overseas Partners III, L.P., Apollo U.K. Fund III, L.P., QDI and certain shareholders of QDI. Incorporated herein by reference to Exhibit No. 10.5 to Quality Distribution, LLC’s Registration Statement on Form S-4 filed with the Securities and Exchange Commission on August 14, 2002 (Registration No. 333-98077). | |
Table of Contents
| Exhibit No. |
Description | |
| 10.6 | Quality Distribution, Inc. 1998 Stock Option Plan of Incorporated herein by reference to Exhibit 10.1 to Quality Distribution, Inc.’s Registration Statement on Form S-4 filed on November 3, 1998 (Registration No. 333-66711). | |
| 10.7 | Employment Agreement, dated June 23, 1998, between Quality Distribution, Inc. and Dennis R. Copeland. Incorporated herein by reference to Exhibit 10.7 to Quality Distribution, Inc.’s Annual Report on Form 10-K filed on March 29, 2002. | |
| 10.8 | Warrant Agreement (including form of warrant certificate), dated as of May 30, 2002, between Quality Distribution, Inc. and The Bank of New York. Incorporated herein by reference to Exhibit 10.32 to Quality Distribution, Inc.’s Amendment No. 2 to Registration Statement on Form S-1 filed on October 24, 2003 (Registration No. 333-108344). | |
| 10.9 | Form of Stock Option Agreement Under 2003 Stock Option Plan of Quality Distribution, Inc. Incorporated herein by reference to Exhibit 10.34 to Quality Distribution, Inc.’s Amendment No. 3 to Registration Statement on Form S-1 filed on November 5, 2003 (Registration No. 333-108344). | |
| 10.10 | Form of Restricted Award Agreement Under 2003 Restricted Stock Plan of Quality Distribution, Inc. Incorporated herein by reference to Exhibit 10.36 to Quality Distribution, Inc.’s Amendment No. 3 to Registration Statement on Form S-1 filed on November 5, 2003 (Registration No. 333-108344). | |
| 10.11 | Employment Agreement dated November 3, 2004 between Quality Distribution, Inc. and Gary Enzor. Incorporated herein by reference to Exhibit 99.2 to Quality Distribution, Inc.’s Current Report on Form 8-K filed on November 9, 2004. | |
| 10.12 | Quality Distribution, Inc. 2003 Stock Option Plan, as amended. Incorporated herein by reference to Exhibit 10.1 to Quality Distribution, Inc.’s Current Report on Form 8-K filed on May 16, 2005. | |
| 10.13 | Quality Distribution, Inc. 2003 Restricted Stock Incentive Plan, as amended. Incorporated herein by reference to Exhibit 10.1 to Quality Distribution, Inc.’s Current Report on Form 8-K filed on May 28, 2010. | |
| 10.14 | Form of Non Qualified Stock Option Agreement. Incorporated herein by reference to Exhibit 10.5 to Quality Distribution, Inc.’s Current Report on Form 8-K filed on June 7, 2005. | |
| 10.15 | Form of Restricted Stock Award Agreement. Incorporated herein by reference to Exhibit 10.6 to Quality Distribution, Inc.’s Current Report on Form 8-K filed on June 7, 2005. | |
| 10.16 | Employment Agreement dated April 1, 2007 between Quality Distribution, Inc. and Jonathan C. Gold. Incorporated herein by reference to Exhibit 10.2 to Quality Distribution, Inc.’s Quarterly Report on Form 10-Q filed on May 9, 2007. | |
| 10.17 | Agreement and Release, effective as of April 24, 2008, between Quality Distribution, Inc. and Virgil Leslie. Incorporated herein by reference to Exhibit 10.1 to Quality Distribution, Inc.’s Quarterly Report on Form 10-Q filed on August 8, 2008. | |
| 10.18 | Separation Agreement and General Release, effective as of July 25, 2008, between Quality Distribution, Inc. and Timothy B. Page. Incorporated herein by reference to Exhibit 10.1 to Quality Distribution, Inc.’s Quarterly Report on Form 10-Q filed on November 7, 2008. | |
| 10.19 | Employment Agreement, dated July 28, 2008, between Quality Distribution, Inc. and Stephen R. Attwood. Incorporated herein by reference to Exhibit 10.2 to Quality Distribution, Inc.’s Quarterly Report on Form 10-Q filed on November 7, 2008. | |
| 10.20 | Quality Distribution, Inc. Key Employee Deferred Compensation Plan, as Amended and Restated January 1, 2009. Incorporated herein by reference to Exhibit 10.23 to Quality Distribution, Inc.’s Annual Report on Form 10-K filed on March 13, 2009. | |
| 10.21 | Separation Agreement and General Release dated December 31, 2009, between Quality Distribution, Inc. and Dennis R. Copeland. Incorporated herein by reference to Exhibit 10.26 to Quality Distribution, LLC and QD Capital Corporation’s Amendment No. 1 to Registration Statement on Form S-4 (Registration No. 333-163868) filed on February 5, 2010. | |
Table of Contents
| Exhibit No. |
Description | |
| 10.22 | Professional Services Agreement, dated December 31, 2009, between Quality Distribution, Inc. and Dennis R. Copeland. Incorporated herein by reference to Exhibit 10.27 to Quality Distribution, LLC and QD Capital Corporation’s Amendment No. 1 to Registration Statement on Form S-4 (Registration No. 333-163868) filed on February 5, 2010. | |
| 10.23 | Employment Agreement, dated March 12, 2010, between Quality Distribution, Inc. and Randall Strutz. Incorporated by reference to Exhibit 10.23 to Quality Distribution, LLC and QD Capital Corporation’s Amendment No. 3 to Registration Statement on Form S-4 (Registration No. 333-163868) filed on April 7, 2010. | |
| 10.24 | Employment Agreement between Joseph J. Troy and Quality Distribution, Inc., dated as of July 16, 2010. Incorporated herein by reference to Exhibit 3.1 to Quality Distribution, Inc.’s Current Report on Form 8-K filed on July 22, 2010. | |
| 21.1 | Subsidiaries of the Registrant. Incorporated herein by reference to Exhibit 21.1 to Quality Distribution, LLC and QD Capital Corporation’s Registration Statement on Form S-4, filed on December 18, 2009. | |
| 23.1† | Consent of PricewaterhouseCoopers LLP. | |
| 23.2† | Consent of Shumaker, Loop & Kendrick, LLP (included in Exhibit 5.1). | |
| 24.1†† | Power of Attorney. | |
| * | To be filed by amendment. |
| † | Filed herewith. |
| †† | Previously filed. |