Attached files
| file | filename |
|---|---|
| EX-99.1 - EX-99.1 - FINISAR CORP | f56811exv99w1.htm |
| 8-K - FORM 8-K - FINISAR CORP | f56811e8vk.htm |
Exhibit 99.2
| The World's Largest Supplier of Optical Solutions for the Communications Industry (c) 2010 Finisar Corporation *Financial guidance for Q211 is per earnings call on Sept. 2, 2010 and is not being updated or confirmed as of any other date. |
| Financial Presentation and Forward Looking Statements Forward Looking Statements This presentation contains forward-looking statements as defined under the Private Securities Litigation Act of 1995. Except for historical information, the matters discussed in this presentation contain forward-looking statements regarding future trends or events that involve risks and uncertainties. Please be aware that these statements are only predictions and that actual events or results may differ materially. Please refer to the Company's Form 10-K and other interim reports as filed with the Securities and Exchange Commission for a discussion of those risk factors. The Company assumes no obligation to update the information in this presentation. GAAP Reconciliation References to financial measures in this presentation will include references to non-GAAP financial measures. Finisar provides a complete reconciliation between GAAP and non-GAAP financial information in its earnings release which is posted on the company's web site www.finisar.com. 2 (c) 2010 Finisar Corporation |
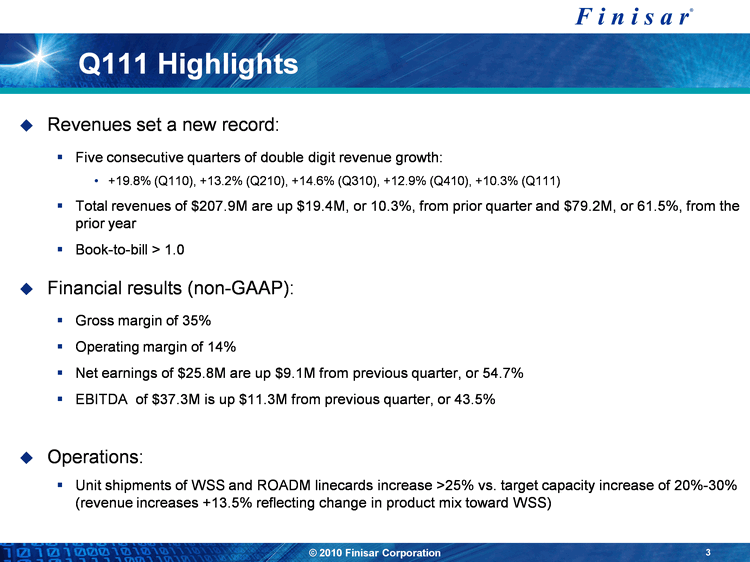
| Q111 Highlights Revenues set a new record: Five consecutive quarters of double digit revenue growth: +19.8% (Q110), +13.2% (Q210), +14.6% (Q310), +12.9% (Q410), +10.3% (Q111) Total revenues of $207.9M are up $19.4M, or 10.3%, from prior quarter and $79.2M, or 61.5%, from the prior year Book-to-bill > 1.0 Financial results (non-GAAP): Gross margin of 35% Operating margin of 14% Net earnings of $25.8M are up $9.1M from previous quarter, or 54.7% EBITDA of $37.3M is up $11.3M from previous quarter, or 43.5% Operations: Unit shipments of WSS and ROADM linecards increase >25% vs. target capacity increase of 20%-30% (revenue increases +13.5% reflecting change in product mix toward WSS) 3 (c) 2010 Finisar Corporation |
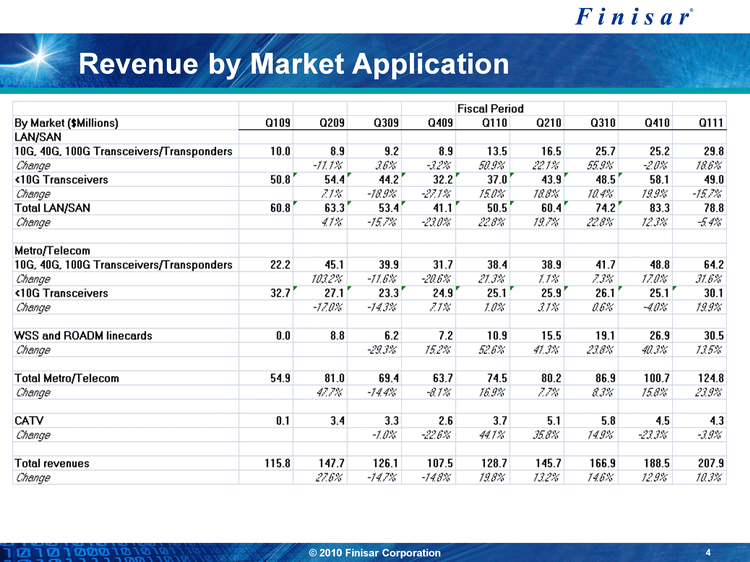
| Revenue by Market Application 4 (c) 2010 Finisar Corporation |
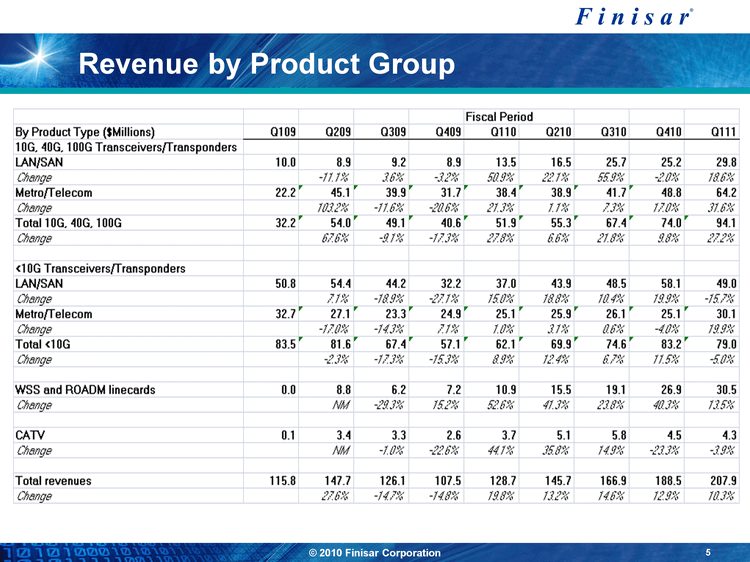
| Revenue by Product Group 5 (c) 2010 Finisar Corporation |
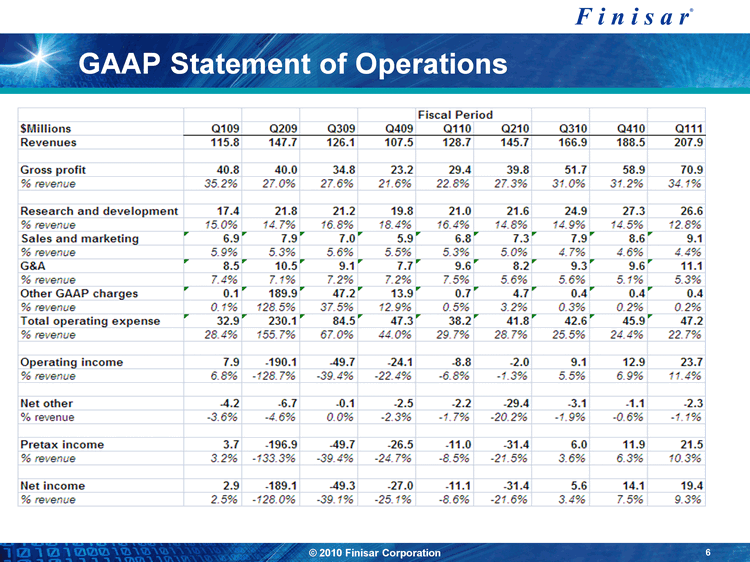
| GAAP Statement of Operations 6 (c) 2010 Finisar Corporation |
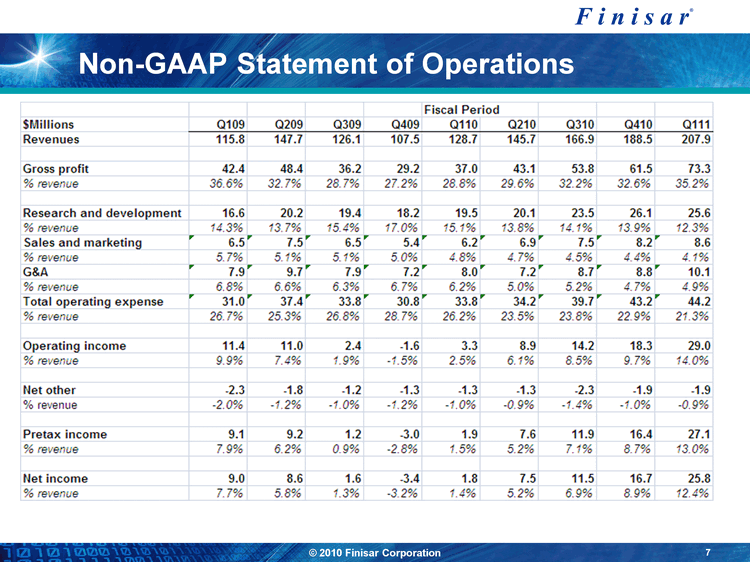
| Non-GAAP Statement of Operations 7 (c) 2010 Finisar Corporation |
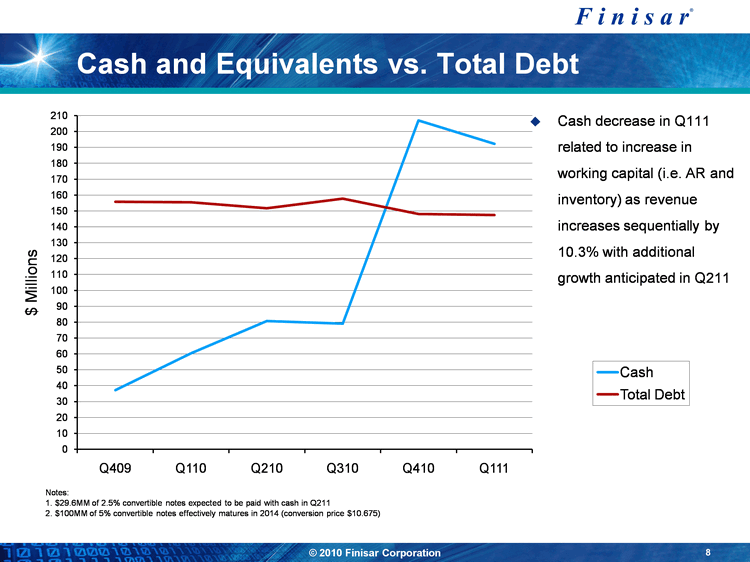
| Cash and Equivalents vs. Total Debt 8 (c) 2010 Finisar Corporation Notes: $29.6MM of 2.5% convertible notes expected to be paid with cash in Q211 $100MM of 5% convertible notes effectively matures in 2014 (conversion price $10.675) (CHART) Cash decrease in Q111 related to increase in working capital (i.e. AR and inventory) as revenue increases sequentially by 10.3% with additional growth anticipated in Q211 |
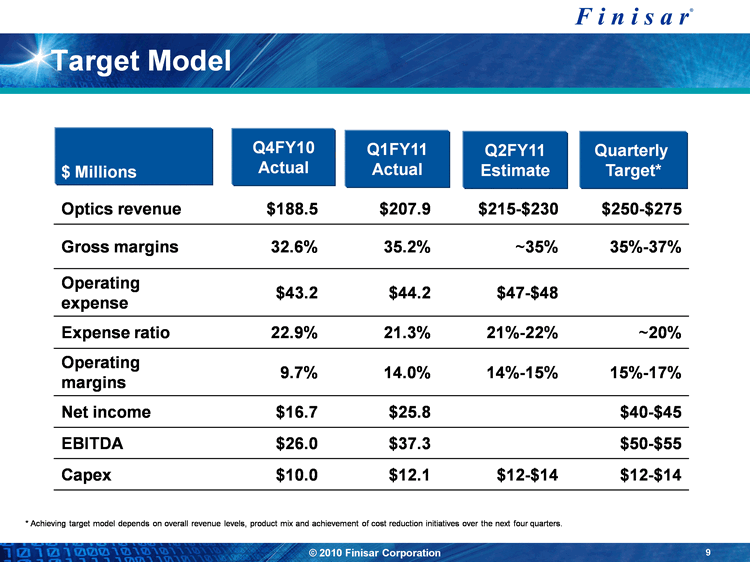
| Q4FY10 Actual Target Model Target Model * Achieving target model depends on overall revenue levels, product mix and achievement of cost reduction initiatives over the next four quarters. 9 (c) 2010 Finisar Corporation Quarterly Target* Q1FY11 Actual Q2FY11 Estimate |
