Attached files
Table of Contents
UNITED STATES
SECURITIES AND EXCHANGE COMMISSION
WASHINGTON, D.C. 20549
FORM 10-K
| x | ANNUAL REPORT PURSUANT TO SECTION 13 OR 15(d) OF THE SECURITIES EXCHANGE ACT OF 1934 |
For the Fiscal Year Ended July 3, 2010
OR
| ¨ | TRANSITION REPORT PURSUANT TO SECTION 13 OR 15(d) OF THE SECURITIES EXCHANGE ACT OF 1934 |
Commission File Number 0-26634
LeCROY CORPORATION
(Exact name of registrant as specified in its charter)
| DELAWARE | 13-2507777 | |
| (State or other jurisdiction of incorporation or organization) |
(I.R.S. Employer Identification No.) | |
| 700 CHESTNUT RIDGE ROAD CHESTNUT RIDGE, NEW YORK |
10977 | |
| (Address of principal executive office) | (Zip Code) | |
(845) 425-2000
(Registrant’s telephone number, including area code)
Securities registered pursuant to Section 12(b) of the Act:
| Title of each class | Name of exchange on which registered | |
| Common Stock, Par Value $.01 Per Share | The NASDAQ Global Select Market |
Securities registered pursuant to Section 12(g) of the Act:
None
Indicate by check mark whether the registrant is a well-known seasoned issuer, as defined in Rule 405 of the Securities Act.
YES ¨ NO x
Indicate by check mark if the registrant is not required to file reports pursuant to Section 13 or Section 15(d) of the Act.
YES ¨ NO x
Indicate by check mark whether the registrant: (1) has filed all reports to be filed by Section 13 or 15(d) of the Securities Exchange Act of 1934 during the preceding 12 months (or for such shorter period that the registrant was required to file such reports), and (2) has been subject to such filing requirements for the past 90 days.
YES x NO ¨
Indicate by check mark whether the registrant has submitted electronically and posted on its corporate web site, if any, every Interactive Data File required to be submitted and posted pursuant to Rule 405 of Regulation S-T (Section 229.405 of this chapter) during the preceding 12 months (or for such shorter period that the registrant was required to submit and post such files).
YES ¨ NO ¨
Indicate by check mark if disclosure of delinquent filers pursuant to Item 405 of Regulation S-K is not contained herein, and will not be contained, to the best of the registrant’s knowledge, in definitive proxy or information statements incorporated by reference in Part III of this Form 10-K or any amendment to this Form 10-K. x
Indicate by check mark (“X”) whether the registrant is a large accelerated filer, an accelerated filer, a non-accelerated filer, or a smaller reporting company. See the definitions of “large accelerated filer”, “accelerated filer” and “smaller reporting company” in Rule 12b-2 of the Exchange Act.
Large accelerated filer ¨ Accelerated filer ¨ Non-Accelerated filer x Smaller reporting company ¨
Indicate by check mark whether the registrant is a shell company (as defined in Rule 12b-2 of the Exchange Act).
YES ¨ NO x
The number of shares outstanding of the registrant’s common stock, as of August 23, 2010, was 12,780,878 shares. The aggregate market value of shares of common stock held by non-affiliates as of the last business day of the registrant’s most recently completed second fiscal quarter was $41,244,606.
Documents Incorporated by Reference
Portions of the Definitive Proxy Statement to be delivered to shareholders in connection with the 2010 Annual Meeting of Stockholders are incorporated by reference in Part III hereof.
Table of Contents
LeCROY CORPORATION
ANNUAL REPORT ON FORM 10-K
FOR THE FISCAL YEAR ENDED JULY 3, 2010
LeCroy® , Wavelink®, WaveMaster®, WavePro®, WaveJet®, WaveRunner®, WaveScan™, WaveSurfer™, WaveExpert™, MAUI™, CATC™, WaveAce® and QualiPHY® are our trademarks, among others not referenced in this document. All other trademarks or servicemarks referred to in this Annual Report on Form 10-K are the property of their respective owners.
2
Table of Contents
CAUTIONARY STATEMENT REGARDING FORWARD-LOOKING STATEMENTS
Certain information included in or incorporated by reference in this Annual Report on Form 10-K, in press releases, written statements or other documents filed with or furnished to the SEC, or in our communications and discussions through webcasts, phone calls, conference calls and other presentations and meetings, other than purely historical information, including, without limitation, those statements relating to the Company’s future business prospects, projected operating or financial results, revenues, business plans and objectives, trends, seasonality, cyclicality and growth in the markets we sell into, our strategic direction, our future effective tax rate and tax valuation allowance, earnings from our foreign subsidiaries, new product introductions, changes to our manufacturing processes, the use of contract manufacturers, the impact of local government regulations, our ability to generate cash from continuing operations, working capital, liquidity, capital needs, plans for future operations, expectations regarding capital expenditures and operating expenses, growth in our business, the potential impact of adopting new accounting pronouncements, our purchase commitments, our cost-control activities, savings and headcount reduction recognized from our business realignment programs, convertible note repurchase programs, the existence or length of an economic recovery, and the assumptions upon which those statements are based, are “forward-looking statements” within the meaning of the Private Securities Litigation Reform Act of 1995. These forward-looking statements generally are identified by the words “believe,” “project,” “expect,” “could,” “forecast,” “anticipate,” “estimate,” “intend,” “strategy,” “plan,” “future”, “may,” “should,” “will,” “would,” “will be,” “will continue,” “will likely result,” and similar expressions.
Any such forward-looking statements are not guarantees of future performance and actual results, developments and business decisions may differ materially from those envisaged by such forward-looking statements. These forward-looking statements speak only as of the date of the report, press release, statement, document, webcast, or oral discussion in which they were made. We undertake no obligation to update or revise publicly any forward-looking statements, whether as a result of new information, future events or otherwise. A detailed discussion of these and other risks and uncertainties that could cause actual results and events to differ materially from such forward-looking statements is included in the section entitled “Risk Factors” (refer to Part I, Item 1A), as well as “Critical Accounting Estimates,” “Quantitative and Qualitative Disclosures About Market Risk,” and “Liquidity and Capital Resources” sections contained in this Annual Report on Form 10-K. We urge you to consider these factors carefully in evaluating the forward-looking statements contained in this Annual Report on Form 10-K.
3
Table of Contents
PART I
| ITEM 1. | BUSINESS |
Our Company
LeCroy Corporation (the “Company,” “LeCroy,” “us,” “we” or “our”) was founded in 1964 and is incorporated in the State of Delaware. Our principal executive offices and manufacturing facilities are located at 700 Chestnut Ridge Road, Chestnut Ridge, New York 10977 and our telephone number is (845) 425-2000. Our website is located at www.lecroy.com. We sell our products and provide service worldwide through direct sales, including our wholly-owned subsidiaries, manufacturers’ representatives, telesales, distributors, and electronic commerce.
We develop, manufacture, sell and license high-performance oscilloscopes and communication protocol analyzers. Our oscilloscopes are tools used by designers and engineers to measure and analyze complex electronic signals in order to develop high-performance systems, validate electronic designs and improve time to market. We offer seven families of oscilloscopes, which provide different solutions for the industry sectors we serve: WaveExpert, our line of sampling oscilloscopes; WaveMaster, our high performance product family; WavePro and WaveRunner, designed for the mid-performance sector; WaveSurfer and WaveJet, designed for value-oriented users in the low-bandwidth sector of the market; and WaveAce, our entry-level oscilloscope products. Our protocol analyzers are used by designers and engineers to reliably and accurately monitor communications traffic and diagnose operational problems in a variety of communications devices to ensure that they comply with industry standards.
We generate revenue in a single segment within the Test and Measurement industry, primarily from the sale of our oscilloscopes, protocol analyzers, probes, accessories, and applications solutions. To a lesser extent, we also generate revenue from the sales of our extended warranty contracts, maintenance contracts and repairs and calibrations on our instruments after their warranties expire. We sell our products into a broad range of industry sectors, including Computer/Semiconductor/Consumer Electronics, Data Storage, Automotive/Industrial, Military/Aerospace and Telecommunication. We believe designers in all of these industry sectors are developing products which rely on increasingly complex electronic signals to provide the features and performance their customers require.
Test and Measurement Industry
Test and Measurement equipment is used in the design, development, manufacture, deployment and operation of electronic products and systems. This equipment is required to verify functionality and performance of new product designs and to ensure compliance to industry standards and overall product quality. These instruments are used across all electronic equipment industries, including computer, semiconductor, consumer, automotive, defense, and telecommunication. In addition, Test and Measurement instruments are utilized to install, maintain and monitor wireless and wire-line communications and broadcast networks. This Test and Measurement equipment aids in the research and development of new products, testing of products in production, and maintenance and service of products in the field.
According to Prime Data, Inc., an independent market research firm tracking the Test and Measurement industry, the market for this equipment was approximately $5.9 billion in 2009. Certain segments of the Test and Measurement industry have historically experienced greater volatility than the overall industry because of their exposure to certain end markets, such as communications, that experienced rapid growth in the late 1990s, followed by rapid declines.
Growth in the Test and Measurement industry is driven by improvements in electronic systems performance, growth in the electronics sector and emerging technologies and standards. Designers in a wide variety of industries are being constantly driven to increase the performance of their products and to add new features and capabilities. These improvements rely on advanced semiconductor technology and require the design of faster, more powerful and complex electronic systems. As a result, the underlying technological advances in communications and
4
Table of Contents
electronic signals are increasing exponentially in complexity and speed. This is driving the demand for analysis tools that allow designers and manufacturers of these devices to improve new-product-development cycle time. With each advance in technology, engineers designing next generation technologies and products must contend with both a reduced margin for error and a progressively more difficult task of fully characterizing new product design.
While the overall test and measurement industry is made up of hundreds of different types of instruments and measurement tools, one of the largest single product categories is oscilloscopes. We estimate that oscilloscopes represented approximately $800 million of the overall $5.9 billion industry in 2009 and protocol analyzers, inclusive of versions for telecommunication protocols, represented approximately $618 million. Protocol analyzers address specific communications standards in the wide area network (WAN), local area network (LAN), storage area network (SAN), computer peripheral interconnect market spaces and wireless networks and systems. LeCroy presently focuses on the storage area network and computer peripheral interconnect space. We believe the potential total available market for the Company’s protocol analyzers lies in the $80 million range of the total protocol analyzer product category.
Oscilloscope Product Category
Oscilloscopes are among several instrument types used by engineers for testing and analyzing electronic signals. Engineers also use logic analyzers, spectrum analyzers, digitizers, bit error rate testers (“BERTs”), and vector network analyzers, among other instruments, to test and analyze these signals. An oscilloscope utilizes a graphical display device that allows an engineer to view an electronic signal. The most basic display of an oscilloscope plots a signal’s voltage versus time (typically in billionths and trillionths of a second), providing a user insight into the performance of an electronic circuit.
The three primary specifications of an oscilloscope are its bandwidth or the capacity to capture a signal of a particular speed; sample rate, or number of data points that can be captured within a specific time, typically billions of samples per second in modern oscilloscopes; and memory length, or the number of data points that may be captured at one time. Higher bandwidths allow capture of higher speed signals, increased sample rate improves resolution, and longer memory allows capture of longer, more complex signals. The merit of a specific oscilloscope depends on the combination of these specifications. Real-time oscilloscopes with bandwidths ranging from 20 Megahertz (“MHz”) up to 32 Gigahertz (“GHz”) are currently available. Generally, the prices of oscilloscopes increase as the primary specifications increase. We believe oscilloscopes generally fall into five major categories:
| • | High-end oscilloscopes. Comprises instruments with the ability to capture and analyze signals ranging from 4 GHz up to the highest available real-time bandwidths, including the super high-end with bandwidths greater than 20 GHz. These instruments generally sell from approximately $50,000 to approximately $300,000 depending on their capabilities. |
| • | Mid-range oscilloscopes. The largest part of the sector consists of general purpose lab and bench instruments and comprises instruments with the ability to capture and analyze signals ranging from 300 MHz up to 6 GHz. These instruments generally sell from approximately $3,000 to over $50,000 depending on their capabilities. |
| • | Economy oscilloscopes. Include less complex instruments with the ability to capture and analyze signals ranging from 20 MHz to 300 MHz. These instruments generally sell for below $3,000. |
| • | Handheld oscilloscopes. This includes a variety of handheld oscilloscopes. Selling prices for these handheld instruments are generally between $1,000 and approximately $3,000. |
| • | Sampling oscilloscopes. For certain high signal speed applications where repetitive signals are available it is possible to use sampling oscilloscopes to view and measure the signals. Sampling oscilloscopes can not capture real time data and are therefore, generally, less expensive than real time oscilloscopes. Sampling oscilloscopes can have bandwidths up to 100 GHz and can range in price generally from approximately $22,000 to approximately $50,000. |
5
Table of Contents
Protocol Analyzer Product Category
The demand for digital information has accelerated the need for communication among multiple electronic devices in various markets, including computers, telecommunications, networking, storage, consumer electronics, aerospace, automotive, industrial automation and medical instrumentation. This growing demand centers on the widespread need to transmit digital information. Communication among digital devices, or connectivity, occurs over a variety of physical media, such as copper wire and fiber optic cable, as well as using wireless technology.
Computer technology initially provided connectivity only among internal devices, such as the processor, memory and storage, and with external peripheral devices, such as the keyboard, mouse and printer. Today, computer technology also enables connectivity among multiple computing devices and across networks, such as LAN, WAN, SAN, MAN, home area networks, personal area networks and the Internet. Consumer electronics technology is progressively enabling connectivity among devices, such as Internet appliances, digital cameras, mobile telephones, gaming systems, audio systems and televisions.
Digital devices communicate by sending electronic signals through a transmission channel according to a specified protocol. A protocol is a set of detailed rules that govern and regulate the manner in which the signals are sent, received, and interpreted. The channel and the protocol are both typically specified in a formal communications standard. For communication to be successful, each device must implement and conform to the same standard.
Early communications standards were relatively simple, typically involving low-speed communications between two simple devices connected directly by copper wire. Current standards are increasingly complex, typically involving high-speed communications among multiple sophisticated devices indirectly linked to other devices and across various physical media, including copper wire and fiber optic cables, or wireless technologies with rapidly fluctuating frequencies. As a result, standards that were specified initially in only a few pages of text may now extend to over one thousand pages. The specifications for these standards are broadly available, which facilitates interoperability of hardware and software products from different manufacturers.
A standard is implemented over a lifecycle that includes three overlapping phases: development, production and market deployment. During the development phase, key component manufacturers develop and produce important building blocks such as semiconductors, embedded software, protocol stacks and device drivers which will be used by others in the industry to create products. During the production phase, system and device manufacturers apply these building blocks to construct their unique products and applications. The market deployment phase includes the introduction and sale of products and applications to end users in the market. Similarly, products associated with a particular standard follow their own unique lifecycle from development through production and deployment.
Protocol analyzers are “standard specific” tools; they enable a design engineer to analyze the “conversation” between two devices which employ the specific standard. Many distinct communications standards are emerging to meet the growing demand for digital connectivity in the Computer/Semiconductor/Consumer Electronics, Data Storage, Automotive/Industrial, and Military/Aerospace industries. The characteristics of each standard, including its principal uses, physical medium, transmission speed and distance covered, vary greatly. Examples of existing and emerging standards supported by our products in the computer peripheral interconnect and storage space include the following:
| • | Fibre Channel. Fibre Channel enables reliable, cost-effective information storage and delivery at very high-speeds. Fibre Channel development started in 1988 and the American National Standards Institute (ANSI) standards body approved the first revision in 1994. Fibre Channel is designed to operate at speeds of 1, 2, 4, and 8 Gbps and gives users the option to develop storage networks with configuration choices at different price points, levels of scalability and availability. |
6
Table of Contents
| • | PCI Express. PCI Express is an emerging standard first introduced in 2002 and is intended to enhance the Peripheral Connect Interface (PCI) architecture spanning multiple computer market segments: clients (desktop and mobile), servers (standard and enterprise), embedded computers and communication devices. PCI Express provides system original equipment manufacturers, or OEMs, and peripheral developers the ability to realize product versatility and market differentiation without the burden of maintaining obsolete interfaces or losing compatibility. PCI Express runs at 2.5 Gbps per lane in each direction, providing a total bandwidth of 80 Gbps in a 16-lane configuration. PCI Express, Generation 2 or Gen 2, runs at 5.0 Gbps per lane in each direction, providing a total bandwidth of 160 Gbps for a 16-lane configuration. The latest generation of PCI Express, Generation 3 or Gen 3, runs at 8.0 Gbps per lane in each direction and due to certain protocol optimization, runs provide a total bandwidth of 320 Gbps in a 16-lane configuration. |
| • | Serial ATA. The Serial ATA standard (Serial Advanced Technology Attachment, or SATA) enables high-speed, low-cost internal storage connections for desktops and mobile computers. Serial ATA was introduced in 2000 and has replaced Parallel ATA, the standard used to connect storage devices such as hard drives, DVD and CD drives to the motherboard. Serial ATA operates over copper wire at speeds up to 6 Gbps over distances of up to one meter. Broad based adoption of Serial ATA in the storage market has led to the use of SATA in new applications including server, networked storage and consumer electronics devices. |
| • | Serial Attached SCSI. Initiated in December 2001 by the Small Computer System Interface (SCSI) Trade Association, Serial Attached SCSI (SAS) was designed to be the logical evolution of SCSI to satisfy the data center requirements of scalability, performance, reliability and manageability, while leveraging a common low-cost electrical and physical connection interface from Serial ATA. SAS provides universal interconnect with Serial ATA, while offering logical SCSI compatibility along with the reliability, performance and manageability of parallel SCSI. SAS is positioned primarily for enterprise class storage applications. SAS allows each host to address up to 4,096 devices via expanders. SAS’s flexibility allows single or multiple lane communications with devices, with a 3 Gbps four lane wide connection providing 12 Gbps total throughput. The SAS-2 specification initiated in May of 2005 runs at 6.0 Gbps per lane in each direction, providing a total bandwidth of 24 Gbps. Early adopters began sampling 6.0 Gbps devices in the second half of fiscal 2007. |
| • | Universal Serial Bus. The Universal Serial Bus standard (USB) enables low, medium and high-speed connectivity between computers and peripheral devices, including keyboards, mice, printers, scanners, joysticks and cameras, using plug and play technology. In addition, it is becoming widely used as the replacement technology for proprietary cabling on medical and industrial control equipment. USB was introduced in 1995 and replaces the serial, parallel, mouse and keyboard ports. The specifications for the second version of USB, or USB 2.0, were released in April 2000. USB 2.0 enabled connectivity through copper wires at speeds of up to 480 Mbps over distances of up to five meters. USB 3.0 was ratified in November 2008 and introduced a new connectivity speed of 5.0 Gbps over distances of up to five meters. |
LeCroy is a provider of protocol analyzers for existing and emerging digital communications standards. Our products are used by semiconductor, device, system and software companies at each phase of their products’ lifecycles from development through production and market deployment.
7
Table of Contents
Our Competitive Strengths
We are a leading, worldwide provider of oscilloscopes and protocol analyzers as well as a provider of related test and measurement equipment used by electronic designers and engineers to measure and analyze complex electronic signals and communication protocols. Our key competitive strengths include:
Technology leadership. We are a recognized technology leader in the Test and Measurement industry and continue to leverage our core strengths to develop new and innovative products for the changing requirements of the industry sectors we serve. Most recently, we have focused on incorporating our internally developed operating system and our advanced methodology for enabling high-speed signal acquisition into our entire oscilloscope product line. We are a major participant in the various standards groups found in our portfolio of supported protocols. Our expertise has helped make it possible for protocol technologies to increase in scope of utility and stability. We believe this has allowed us to transform general purpose oscilloscopes into application-specific analysis tools, providing a competitive advantage to our products. These, and our other core technologies, are currently protected by 116 U.S. patents. We also have a significant number of pending U.S. patent applications, as well as foreign patents and applications where we believe seeking such protection will provide us a competitive advantage.
Broad product portfolio. We offer a broad range of oscilloscope and protocol analyzer products which are designed to capture and analyze a wide range of electronic signals and data packets. We believe our breadth of product offerings, coupled with our ability to create application-specific analysis tools, address the specific needs of design engineers and systems integration teams in many industries.
Leading customer relationships. Our major customers are leaders in a range of industries, including Computer/Semiconductor/Consumer Electronics, Data Storage, Automotive/Industrial, and Military/Aerospace. Our ability to work with innovative, industry-leading customers allows us to continuously refine our products to better address the needs of the latest technologies.
Global sales and distribution. We have a global sales force and distribution structure covering the Americas, Europe/Middle East and Asia/Pacific. Each of these regions is a major contributor to our revenue. We currently have direct sales personnel in 12 countries and operate in over 50 smaller geographies through regional managers, distributors and manufacturers’ sales representatives. We believe that our sales engineers are recognized by our customers for their technical expertise. Our sales force often works in tandem with design engineers to create solutions to complex applications.
Experienced management team. Our management team has a long and successful track record in the Test and Measurement industry with an average of over 20 years of experience in the industry. Our management team has overseen the introduction of many new products over the recent years and has restructured our operations, enhancing our focus on our core sectors while developing our ongoing business strategy, which encourages product innovation.
Our Strategy
In order to enhance our position as a leading provider of oscilloscopes and protocol analyzers, our objective is to grow our Company and our share in the overall test and measurement industry. In addition, we may pursue strategic alliances that have strong adjacent market positions or complement our current product lines.
Our key strategy is to broaden our solutions aimed at high speed data communication and serial data test applications. The sector for testing important serial data standards, including PCI Express, Serial ATA, SAS, and USB, is rapidly growing. The primary tools associated with testing serial data links are oscilloscopes, high speed signal generators, BERTs, logic analyzers, network analyzers and protocol analyzers, among others. Our oscilloscope and protocol analyzer development efforts are aimed primarily at satisfying the needs of customers in this important applications area.
8
Table of Contents
Products and Services
Oscilloscopes
We currently offer six major real-time oscilloscope families: WaveMaster, WavePro, WaveRunner, WaveSurfer, WaveJet and WaveAce, and one sampling oscilloscope family, WaveExpert. Each oscilloscope model is capable of capturing and analyzing electronic signals at different bandwidth and performance points in the market. Each oscilloscope family is also offered with a selection of general software packages that expand its capabilities and allow customization of the operation and measurements of the specific product.
| Product Family |
Number of Models |
Bandwidth Range |
U.S. List Price Range |
Market | ||||
| WaveExpert Sampling Oscilloscope Series |
1 | Up to 100 GHz | $22,000 - $50,000 | April 2005 | ||||
| WaveMaster /SDA/DDA 8Zi Series |
18 | 4 - 30 GHz | $68,490 - $229,490 | January 2009 | ||||
| WavePro/SDA/DDA 7Zi Series |
11 | 1.5 - 6 GHz | $25,990 - $78,840 | July 2008 | ||||
| WaveRunner Xi A Series |
14 | 400 - 2000 MHz | $11,325 - $23,450 | February 2009 | ||||
| WaveSurfer Xs A Series |
13 | 200 - 1000 MHz | $7,390 - $15,390 | March 2009 | ||||
| WaveJet 300 A Series |
8 | 100 - 500 MHz | $3,050 - $6,930 | April 2009 | ||||
| WaveAce Series |
11 | 40 - 300 MHz | $695 - $2,855 | October 2008 | ||||
The PeRT3 (Protocol-enabled Receiver and Transmitter Tolerance Tester) is a new line of products from LeCroy targeted at the important area of electronic design known as receiver testing. It allows parameters to be varied in the physical layer while incorporating protocol and link layer connectivity to enable seamless control of the device under test to create fully automated test environments for both compliance and margin testing. PeRT3 is a Bit Error Rate (BER) Tester based instrument with a 6.125 Gbps pattern generator and error detector, featuring a full range of stress injection capabilities including random jitter, sinusoidal jitter, common mode noise, pre-emphasis and spread spectrum clocking (SSC). The protocol enabled generators and detectors are capable of performing loopback initialization directly with the device under test without any external tools, and analysis can be performed for both BER and frame error rate (FER).
Supporting Analyzers and Application Software
Our general purpose oscilloscope products are tailored with proprietary software and hardware to create application specific analyzers which function as industry-specific oscilloscopes for use in:
| • | Data storage applications — Disk Drive Analyzer products, using WaveMaster and WavePro platforms; |
| • | Serial data applications — Serial Data Analyzer products (SDA 7Zi and SDA 8Zi series), based on the WaveMaster and WavePro platforms; and |
| • | Automotive applications — Hardware and software applications based on the WaveRunner platform for use in understanding serial communications in automobiles and industrial systems. |
9
Table of Contents
Protocol Analyzers
Our protocol analyzer products are advanced verification systems that assist hardware and software manufacturers in the efficient design of reliable and interoperable systems and devices. Most of these systems utilize our proprietary intuitive expert analysis software, the CATC Trace, which displays communications traffic in searchable, color-coded packets. Highlights include:
| • | Summit™ T3-16 PCI Express Analyzer features full bi-directional decode and capture of x1 up to x16 PCI Express lanes at 2.5, 5, and 8 GT/s (Giga-Transfers per second) per lane. |
| • | Summit™ Z3-16 PCI Express Exerciser is capable of emulating PCI Express root complex and end point devices. It supports x1 up to x16 lane training at 2.5, 5, and 8 GT/s speeds. |
| • | Summit™ T2-16 PCI Express Analyzer features full bi-directional decode and capture of x1 up to x16 PCI Express lanes at both 2.5 and 5 GT/s (Giga-Transfers per second) per lane. |
| • | Summit™ Z2-16 PCI Express Exerciser is capable of emulating PCI Express root complex and end point devices. It supports x1 up to x16 lane training at both 2.5 and 5 GT/s speeds. |
| • | Sierra M6-4 and M6-2 test platforms provide a complete protocol test tool for 6G SAS and/or SATA development, including protocol analysis, traffic generation, device emulation, error injection and compliance test, all in one package. |
| • | STX Series are integrated analyzer/exerciser systems designed to address the serial storage protocol test and verification market. The STX 231 and 431 series offer support for Serial ATA (SATA) and Serial Attached SCSI (SAS) 1.5 and 3 Gbps signaling speeds. |
| • | Voyager Analyzer/Exerciser system, introduced in 2008, is LeCroy’s flagship USB development and test tool. Voyager supports all speeds of the new USB 3.0 specification with both an analyzer and exerciser in a single unit. |
Other Products and Services
We offer our customers a variety of complementary oscilloscope probes and accessory products. Probes provide the critical physical electrical or optical connection from the customer’s circuit to the oscilloscope. We believe our WaveLink high frequency differential probes provide the high bandwidth performance necessary to measure serial data signals in the expanding serial data communications market.
We also provide support, repairs, maintenance, recalibration and a variety of post sale upgrades and installations. We maintain field service centers in Chestnut Ridge, New York; Santa Clara, California; Geneva, Switzerland; Tokyo, Japan; Seoul, South Korea; Beijing, China; and Singapore.
Our Customers and End Users
Our products are used primarily by electronic designers and engineers principally in the research and development of new products. These end users typically use oscilloscopes and other test and measurement tools to validate the performance of electronic designs and components. Our protocol analyzers are used by designers and engineers whose products are in development and production and also for products deployed in the field. We currently provide products to customers in four primary industry sectors, including Computer/Semiconductor/Consumer Electronics, Data Storage, Automotive/Industrial, and Military/Aerospace. Our customers also include leading original equipment manufacturers.
10
Table of Contents
Computer/Semiconductor/Consumer Electronics. This sector includes companies providing components, interfaces, subsystems and complete products for high speed and general purpose computing, network servers, and related devices and systems. Requirements in this sector have been driven by:
| • | growth in the capability and complexity of devices, which now provide a higher level of integration and functionality; |
| • | a dramatic increase in the use of high speed serial data communications interfaces in both the computer and semiconductor market; and |
| • | new interface standards, which enable increased interoperability and higher levels of bandwidth between devices and peripherals. |
Data Storage. This sector includes companies that provide magnetic and optical storage devices such as hard disk drives, removable media, tape, CDs and DVDs. Requirements in this sector are being driven by:
| • | continued pressure to reduce product development life cycle time; |
| • | increasing need to store more information on storage media, which requires the encoding of signals to achieve higher density; and |
| • | migration of hard disk drives to portable media applications and consumer devices, such as MP3 players and digital video recorders. |
Automotive/Industrial. The automotive sector includes automobile OEMs, component suppliers to automobile OEMs and industrial equipment manufacturers. Requirements in this sector are being driven by:
| • | proliferation of Electronic Control Units, or ECUs, to various automotive subsystems, such as engine control, braking, and traction control; |
| • | progression to networked ECUs; and |
| • | serial data topologies managing complex inbound and outbound signals. |
Military/Aerospace. The military and aerospace sector includes companies that provide components and systems for defense and commercial airplane applications. Requirements in this sector are being driven by:
| • | applications that use complex communications signals in challenging environments; |
| • | extraordinarily high need for precision and reliability given the consequences of failure; and |
| • | need for long-term support due to long military program life. |
Sales, Marketing and Distribution
We maintain a direct sales force of highly trained, technically sophisticated sales engineers who are knowledgeable in the use of oscilloscopes and protocol analyzers and the features and advantages of our products. Our sales engineers are skilled in performing product demonstrations for current and prospective customers.
We sell our oscilloscopes and protocol analyzers through our own direct sales force, and through third party distributors and manufacturer representatives in the United States. Our products, in addition to being sold through distributors and manufacturer representatives internationally, are also sold through a direct sales force in Switzerland, Germany, Italy, France, the United Kingdom, Sweden, Japan, China, South Korea and Singapore, with regional sales headquarters located in Chestnut Ridge, New York; Santa Clara, California; and Geneva, Switzerland.
11
Table of Contents
We support our customers through a worldwide network of specialized applications engineers. We maintain service, repair and calibration facilities in Chestnut Ridge, New York; Santa Clara, California; Geneva, Switzerland; Seoul, South Korea; Tokyo, Japan; Beijing, China; and Singapore.
In order to raise market awareness of our products, we maintain an informative website (www.lecroy.com), advertise in trade publications, distribute promotional materials, conduct marketing programs and seminars, issue press releases regarding new products, publish technical articles and participate in industry trade shows and conferences.
Technology and Product Development
We believe we are a technology leader in both the oscilloscope and protocol analyzer markets. We have developed core capabilities in the design of high-performance, high-speed signal conditioning, sampling and analog-to-digital conversion circuitry. We believe we are also a leader in the design of technologies related to the storage, movement and processing of the large amounts of data produced by oscilloscopes and protocol analyzers.
In protocol analyzers, with the acquisition of Computer Access Technology Corporation (“CATC”) in October 2004 and Catalyst Enterprises Inc. (“Catalyst”) in October 2006, we believe we have a competitive advantage as a result of our knowledge and expertise in multiple communications standards, computer and software architecture and advanced ASIC and programmable logic design. This expertise is enhanced by our advanced design tools and collaboration among our various design teams. We have a broad, vertically integrated technology base that includes the knowledge and expertise to design advanced ASICs, use programmable logic in the form of microcontrollers and programmable logic devices in real-time embedded applications, design electronic circuit boards and systems, and design and develop embedded software, software drivers and software applications. In October of 2006, LeCroy acquired Catalyst to broaden its protocol product line and increase penetration of certain new customer and market segments. The combination of Catalyst with the LeCroy Protocol Solutions Group allows the combined division to bring next-generation products to market faster, and satisfy more customer requirements.
Our product development efforts are focused on hardware, software and mechanical development initiatives. Our hardware product development team is focused on developing innovative signal conditioning, data acquisition and electrical circuit probing technologies that allow better waveform fidelity and circuit connection capabilities. This is accomplished through the use of advanced integrated circuit techniques and processes, innovative design tools and methodologies and key technology partnerships.
Our software engineering group continues to develop and advance our protocol, wave shape analysis and measurement technologies in order to offer new and innovative analysis tools for our customers. This group also develops application solutions to perform specific analysis for specific communications protocols, data storage, power measurement, communications and other markets.
We have also entered into technology agreements that have provided us access to technologies that enable extremely high-speed, high-fidelity signal capture capabilities and very high throughput data movement capabilities. We intend to continue to develop and leverage such key partnerships in areas that complement or enhance our own internal strengths.
Manufacturing and Suppliers
We have consolidated and streamlined our manufacturing and operational activity to focus on our core expertise of oscilloscope and protocol analyzer product introduction and development. Our WaveExpert, WaveMaster, WavePro, WaveRunner and WaveSurfer oscilloscopes and related products are manufactured at our facility in Chestnut Ridge, New York. Protocol analyzer products are manufactured in our Santa Clara, California facility. Our focus on supply chain execution has allowed us to improve the cycle time required to build our instruments as well as reduce the time required to test and deliver products to our customers. For example, we have partnered with manufacturing companies in the U.S. and Asia that have allowed us to design and develop innovative
12
Table of Contents
products at reduced costs. This has allowed us to lower the costs of our products to our customers while improving our margins. Our WaveJet products are manufactured in Japan, while our WaveAce products are manufactured in China.
Competition
Oscilloscopes
The oscilloscope sector is highly competitive and characterized by rapid and continual advances in technology. Competitors include Tektronix, Inc., a subsidiary of Danaher Corporation (“Tektronix”), Agilent Technologies, Inc. (“Agilent”), Rigol Technologies, Inc., Yokogawa Electric Corporation, Iwatsu Electric Company Ltd., National Instruments and Rhode & Schwarz International, among others. A number of competitors have substantially greater sales and marketing, development and financial resources than we do. We believe that our competitors offer a range of products that attempt to address most industry sectors.
We believe that the bases of competition for oscilloscopes, include, among others, a product’s performance characterized by the confluence of bandwidth, sample rate, memory length and processing power, its price and quality, the vendor’s name recognition and reputation, product availability and the quality of post-sale support. We believe that we currently compete effectively with respect to each of the bases of competition for oscilloscopes. We also believe that our future success will depend in part on our ability to maintain and develop the advanced technology used in our oscilloscope products and our ability to offer high-performance products at a favorable “price-to-performance” ratio.
Protocol Analyzers
Our protocol analyzers are highly competitive, and we expect competition to intensify in the future. We compete with a number of companies, such as Agilent and JDS Uniphase Corporation, our largest competitors. These competitors are diverse and offer a variety of solutions directed at various industry sectors of this marketplace. We believe the principal factors of competition include:
| • | Product functionality; |
| • | Time to market with new products; |
| • | Ease of product use; |
| • | Product speed, reliability, stability and accuracy; and |
| • | Local support and service for products. |
We believe we compete favorably with respect to each of these factors and have gained significant share in some of our target areas as a result. We believe our success has been driven by our vertically integrated technology, ability to generate customer loyalty and ability to anticipate industry trends.
Backlog
Our backlog of unshipped customer orders was approximately $8.0 million and $1.6 million as of July 3, 2010 and June 27, 2009, respectively. Customers may cancel or reschedule orders at any time. We believe that our level of backlog, at any particular time, is not necessarily indicative of our future operating performance.
13
Table of Contents
Intellectual Property
We rely on a combination of patents, trademarks and trade secret laws, non-disclosure agreements and other intellectual property protection methods, as well as technical expertise and continuing technological research and development to establish and protect proprietary rights in our products. We believe, however, that because of the rapid pace of change and advancement in oscilloscope technology, legal intellectual property protection is and will continue to be a less significant factor in our success than our core competency of wave shape analysis and the experience and expertise of our personnel.
We protect significant technologies, products and processes that we consider important to our business by, among other things, filing applications for patent protection. We currently hold 116 U.S. patents. We also have a significant number of pending U.S. patent applications, as well as foreign patents and applications. Although none of our products depends exclusively on any single patent, we believe our patents, in the aggregate, are important to our business and contribute to our competitive advantage.
We license or otherwise acquire key enabling technologies from third parties in order to gain access to technologies that would be too expensive or too time consuming to develop internally or that would give us a competitive advantage or shorten our product development time-to-market. The capabilities licensed or otherwise acquired through these agreements, and additional license agreements we entered into, could be developed by us, but would require considerable time and expense.
Although we believe that our products and technologies do not infringe the proprietary rights of third parties, there can be no assurance that third parties will not assert claims against us based on the infringement or alleged infringement of any such rights. Such claims are typically costly to defend, regardless of the legal outcome. There can be no assurance that we would prevail with respect to any such claim, or that a license to third party rights, if needed, would be available on acceptable terms. In any event, patent and proprietary rights litigation can be extremely protracted and expensive.
Regulatory Matters
As we manufacture our products in the United States and sell our products and purchase parts, components and sub-assemblies in a number of countries, we are subject to legal and regulatory requirements, particularly the imposition of tariffs and customs, in a variety of countries. Our products are also subject to United States export control restrictions. In certain cases, we may not be permitted to export products without obtaining an export license. U.S. export laws also prohibit the export of our products to a number of countries deemed by the United States to be hostile. The export of our high-performance oscilloscopes from the United States is also subject to regulation under the Treaty for Nuclear Non-Proliferation. We cannot be certain that the U.S. government will approve any pending or future export license requests. In addition, the list of products and countries for which export approval is required, and the regulatory policies with respect thereto, could be revised.
Employees
As of July 3, 2010, we had 419 full-time employees, 170 of whom work in our Chestnut Ridge, New York facility. Our employees are not represented by a labor union and we have not experienced any work stoppages. We believe that our employee relations are satisfactory.
Investor Information
Our Internet website address is www.lecroy.com. We make available, free of charge on our website, by clicking on “About LeCroy” and then selecting the “Investor Relations” link and the “SEC Filings” link, our annual reports on Form 10-K, quarterly reports on Form 10-Q, current reports on Form 8-K, and amendments to those reports filed or furnished pursuant to Section 13(a) or 15(d) of the Securities Exchange Act of 1934, as amended (the “Exchange Act”), as soon as reasonably practicable after electronically filing such material with, or furnishing it to, the Securities and Exchange Commission (“SEC”). The content on any website referred to in this Form 10-K is not incorporated by reference into this Form 10-K unless expressly noted.
14
Table of Contents
Executive Officers of the Registrant
Unless otherwise set forth, below are the names, ages, positions, and a brief account of the business experience of each of our executive officers as of August 31, 2010:
| Name |
Age | Position(s) | ||
| Thomas H. Reslewic |
51 | President; Chief Executive Officer and Director | ||
| Roberto Petrillo |
50 | Vice President, Sales, Americas, Europe, Middle East and Africa | ||
| David C. Graef |
53 | Vice President, Chief Technology Officer | ||
| Sean B. O’Connor |
45 | Vice President, Finance; Chief Financial Officer; Secretary and Treasurer | ||
| Conrad J. Fernandes |
49 | Vice President, Sales, Asia/Pacific | ||
| Corey L. Hirsch |
53 | Vice President, Chief Information Officer |
Thomas H. Reslewic was named to our Board of Directors in January 2002. He joined us in 1990 and has served as President and Chief Executive Officer since January 2002. Mr. Reslewic previously served as President from October 2000 until December 2001, and Executive Vice President and Chief Operating Officer from February 1998 until October 2000. Mr. Reslewic has a Bachelor of Science degree in physics from the College of the Holy Cross and a Master of Business Administration degree from the University of Oregon.
Roberto Petrillo was appointed Vice President Sales, Americas, Europe, Middle East and Africa in January 2007. Previously he held the position of Vice President — LeCroy EMEA (Europe, Middle East and Africa) since August 2002. Mr. Petrillo held various sales management positions during an eleven year tenure with another leading oscilloscope manufacturer where he led the European Telecommunication Business Unit and the European Indirect Channel teams that generated $100 million in annual revenue. Earlier in his career, Mr. Petrillo also worked for Hewlett Packard as an Account Manager. Prior to Hewlett Packard, Mr. Petrillo worked at GTE Telecommunication as an R&D Electronic Engineer. Mr. Petrillo has a Bachelor of Electronic Engineering degree. He received his MBA from Pacific Western University in California.
David C. Graef has served as Vice President, Chief Technology Officer since April 2003. Previously, he served as Vice President, Research and Development from January 1999 through March 2003, Engineering Manager from June 1996 through January 1999 and Senior Engineer from January 1989 through May 1996. Mr. Graef has a Bachelor of Science degree in Electrical Engineering from the University of Bridgeport.
Sean B. O’Connor was appointed Vice President, Finance and Chief Financial Officer in November 2005. Previously he served as Vice President, Legal Affairs and Chief Compliance Officer, and from August 2001 to May 2005 he served as the Company’s Tax Director. Prior to joining LeCroy, he was an attorney at the law firm of McDermott Will and Emory. Previously Mr. O’Connor served as Director of Taxation and Finance at Movado Group and as a senior consultant in the New York office of PricewaterhouseCoopers LLP. Mr. O’Connor, a CPA, received his B.B.A. from Pace University and his J.D. from Seton Hall University School of Law.
Conrad J. Fernandes was appointed Vice President, Sales, Asia/Pacific in July 2008. Previously he served as General Manager-Oscilloscope Division. From August 2006 through March 2007 he served as Vice President of Corporate Development and Strategy and as Vice President, Worldwide Sales from July 2001 to August 2006, Vice President, International Sales from 1999 until 2001, Director of Asia/Pacific Sales from 1994 until 1999 and Product Marketing Manager from 1990 until 1994. Mr. Fernandes has a Bachelor of Electronic Engineering degree and a Master of Business Administration degree from City University of London.
Dr. Corey L. Hirsch has served as Vice President, Information Systems and Facilities since January 2002, and was named Chief Information Officer in May 2005. He joined LeCroy in September 2001, after a twenty-four year tenure with another leading oscilloscope manufacturer, most recently as Director of European Operations, and Acting European Vice President. He completed his Doctorate degree in Business Administration from Brunel University, London and his Masters in Business Administration from the University of Oregon.
15
Table of Contents
| ITEM 1A. | RISK FACTORS |
An investment in our common stock and Convertible notes involves a high degree of risk. You should carefully consider the risks described below together with all of the other information included in this Form 10-K when evaluating the Company and its business. If any of the following risks actually occurs, our business, financial condition, or results of operations could suffer. In that case, the trading price of our common stock and convertible note could decline and you may lose all or part of your investment.
Depressed general economic conditions and uncertainties in the credit markets leading to a prolonged economic downturn in the U.S. and around the world could materially harm our business by decreasing capital spending and affect our ability to satisfy our financial covenants.
The disruption to the capital and credit markets and resulting volatility have significantly and adversely impacted global economic conditions including research and development capital expenditure. These conditions have led and could further lead to continuing substantial declines in capital spending over the foreseeable future. While we have seen recent improvements in capital equipment spending, the uncertain outlook in the global economy could have a material adverse impact on the Company’s business, financial condition, liquidity and results of operations.
Negative trends in the general economy, including trends resulting from actual or threatened military action by the United States and threats of terrorist attacks in the United States and abroad, could cause a decrease in capital spending in many of the industry sectors we serve. In particular, a downward cycle affecting the computer and semiconductor, data storage devices, automotive and industrial, and military and aerospace markets would likely result in a reduction in demand for our products and would have a material adverse effect on our business, results of operations, financial condition and liquidity. In addition, if customers’ markets decline, we may not be able to collect outstanding amounts due to us. Such declines could harm our consolidated financial position, results of operations, cash flows, stock price and Convertible notes valuation, and could limit our ability to maintain operating income profitability. During an economic downturn, demand for our products may decrease. Restrictions on credit globally and foreign currency exchange rate fluctuations in certain countries may impact economic activity and our results.
A substantial or prolonged material adverse impact on our results of operations and financial condition could affect our ability to satisfy the financial covenants in our Amended and Restated Senior Secured Credit Agreement, which could result in our having to seek amendments or waivers from our lenders to avoid the termination of commitments and/or the acceleration of the maturity of amounts that are outstanding under our credit facility. The cost of obtaining an amendment or waiver could be significant, and could substantially increase our cost of borrowing over the remaining term of our credit agreement. Further, there can be no assurance that we would be able to obtain an amendment or waiver. If our lenders were unwilling to enter into an amendment or provide a waiver, all amounts outstanding under our term loan and revolving credit facility would become immediately due and payable.
If the Company is unable to fully realize and sustain its expense reduction plans, its future operating results could suffer.
During fiscal 2009, the Company implemented expense reduction plans designed to streamline operations, reduce expenses, and improve efficiencies and effectiveness across the Company’s global organization. The Company may not be able to fully realize its expense reductions and sustain them in subsequent periods. In addition, the Company could incur additional unforeseen expenses that may fully or partially offset these expected expense savings. These expense reductions could have the effect of reducing our talent pool and available resources and, consequently, could have long-term effects on our business by decreasing or slowing improvements in our products, affecting our ability to respond to customers, limiting our ability to increase production quickly if and when the demand for our products increases and limiting our ability to hire and retain key personnel. Furthermore, there are risks that the Company’s human resources could be strained as a result of the streamlining of operations and the reduction of its workforce. The inability to successfully implement its expense reduction plans could adversely affect the Company’s future financial condition, cash flows, and results of operations. These circumstances could cause our income to be lower than it otherwise might be and, as a result, adversely affecting our stock price and Convertible notes valuation.
16
Table of Contents
If the Company misjudges the demand for its products, unplanned inventory levels could adversely affect future operating results, cash flows and profitability.
Demand for the Company’s products can affect inventory levels. If customer demand is lower than expected, inventory levels can rise causing a strain on operating cash flow. If the inventory cannot be sold, additional reserves or write-offs to future earnings could be necessary. Conversely, if demand is higher than expected, insufficient inventory levels could result in unfulfilled customer orders, loss of revenue and an unfavorable impact on customer relationships. Failure to properly judge demand and properly manage inventory could have a material adverse effect on profitability, liquidity and financial position.
Changes in the sales mix of the Company’s products could impact gross profit margins.
The product families that are sold by the Company are sold at a wide range of price points and yield a variety of gross profit margins. Thus, the mix of sales by product family can have an impact on the gross profit margins of the Company. If the Company’s sales mix shifts unfavorably toward products with lower gross profit margins than the Company’s historical consolidated gross profit margin, it could have an adverse effect on the results of operations and cash flows.
We have experienced varied operating results and they could continue to fluctuate and may not meet our financial guidance or published analyst forecasts, which may cause the price of our common stock, or value of our Convertible notes, to decline significantly.
Our past operating results, including our gross profits, have fluctuated from fiscal period to fiscal period. We expect our future operating results and gross profits will continue to fluctuate from fiscal period to fiscal period due to a number of factors, many of which are outside our control and any of which could cause our stock price and Convertible notes valuation to fluctuate. The primary factors that affect our operating results include the following:
| • | visibility into our markets is limited, our quarterly sales and operating results are highly dependent on the volume and timing of orders received during a fiscal quarter, which are difficult to forecast; |
| • | changes in overall demand for our products; |
| • | the timing of the announcement, introduction and market acceptance of new products by us or competing companies; |
| • | the timing and magnitude of research and development expenses; |
| • | changes in the estimation of the future size and growth rates of our markets; |
| • | changes in our production efficiency; |
| • | disruptions in operations at any of our facilities, third party suppliers, or the facilities of any of our contract manufacturers for any reason; |
| • | changes in the selling prices of our products; and |
| • | changes in foreign currency exchange risks. |
In addition, we have historically experienced somewhat lower activity during our first fiscal quarter than in other fiscal quarters which, we believe, is due principally to the lower level of orders and market activity during the summer months, particularly in Europe. We believe this seasonal aspect of our business is likely to continue in the future.
17
Table of Contents
Our common stock price and Convertible notes valuation may be subject to significant fluctuations and volatility.
The market price of our common stock and valuation of our Convertible notes fluctuates significantly. The stock price and Convertible notes valuation could fluctuate in the future due to a number of factors, some of which are beyond our control. These factors include:
| • | historically low trading volume in our stock and Convertible notes relative to alternative investments; |
| • | announcements of developments related to our business, including additions or departures of key personnel; |
| • | announcements of technological innovations or new products or enhancements by us or our competitors; |
| • | sales by competitors, including sales to our customers; |
| • | sales of common stock into the public market, including those by directors and members of management; |
| • | developments in our relationships with our customers, partners, distributors and suppliers; |
| • | shortfalls or changes from analysts’ expectations in revenue, gross profits, earnings or losses, or other financial results; |
| • | changes to or discontinuance of our stock or convertible note repurchase programs; |
| • | regulatory developments; |
| • | fluctuations in results of operations; |
| • | failure to meet our financial obligations and covenants under any loans or financing agreements; |
| • | the availability and terms of future financing options, in order to refinance existing debt; |
| • | trends in the seasonality of our sales; and |
| • | general conditions in our market or the markets served by our customers. |
In addition, in recent years the stock market in general and the market for shares of technology stocks in particular have experienced extreme price fluctuations, which have often been due, in part, to factors other than the operating performance of the affected companies. We cannot ensure that the market price of our common stock and valuation of our Convertible notes will not decline substantially, or otherwise continue to experience significant fluctuations in the future, including fluctuations that are unrelated to our operating performance.
If demand for our products does not match manufacturing capacity, we may underutilize our capacity or, alternatively, be unable to fulfill orders in a timely manner, and in either situation our operating results and cash flows may suffer.
The sale of our products is dependent, to a large degree, on customers whose industries are subject to cyclical trends in the demands for their products. We may not be able to adapt production capacity and related cost structures to rapidly changing market conditions in a timely manner. When demand does not meet expectations, manufacturing capacity will likely exceed production requirements. We have at times increased our production capacity, purchasing and the overhead that supports production based on anticipated market demand which has not always developed as expected. As a result, we have periodically underutilized our capacity, which has adversely affected our earnings due to existing fixed costs. In addition, conversely, if during a market upturn we cannot increase manufacturing capacity to meet product demand, we will be unable to fulfill orders in a timely manner, which in turn may have a negative effect on operating results and cash flows of our overall business.
18
Table of Contents
If our operating results decline, we may be required to establish an additional valuation allowance against our deferred tax assets.
We evaluate whether our deferred tax assets can be realized and assess the need for a valuation allowance on an ongoing basis. As of July 3, 2010, we have recorded approximately $16.8 million of deferred tax assets related to the future tax benefit of certain temporary differences between our financial statements and our tax returns. Realization of our deferred tax assets is mainly dependent on our ability to generate future taxable income within the statutory carryforward period, in addition to reversal of taxable temporary differences, and the utilization of available tax planning strategies that could be implemented to realize the deferred tax assets. As of July 3, 2010, we recorded a valuation allowance of approximately $2.0 million to reserve for those deferred tax assets we believe are not more likely than not to be realized in future periods. At July 3, 2010, the Company requires approximately $38.0 million in cumulative domestic future taxable income to be generated at various times in the future to realize the domestic net deferred tax assets. If facts or financial results were to change, thereby impacting the likelihood of realizing the deferred tax assets, our tax rate and therefore our earnings and financial position could be adversely affected as a result of recording a valuation allowance against deferred tax assets. An additional valuation allowance would be recorded if it was deemed more likely than not that some or all of our deferred assets will not be realized. If we establish additional valuation allowances, we would record a tax expense in our Consolidated Statements of Operations, which would have an adverse impact on our operating results and financial position.
Changes to our tax rates or exposures to additional income tax liabilities could affect our operating results and cash flows. Additionally, audits by tax authorities could result in additional tax payments for prior year periods.
We are subject to incomes taxes in the U.S. and in various foreign jurisdictions. Domestic and international tax liabilities are subject to the allocation of income among various tax jurisdictions. Our effective tax rate can be impacted by changes in the mix of earning in countries with differing statutory tax rates, changes in the valuation of deferred tax assets and liabilities, accruals related to uncertain tax positions, the results of audits and examinations of previously filed tax returns and changes in tax laws. Any of these factors may negatively impact our tax rate and as a result, decrease our operating results and cash flows. The amount of income taxes we pay is subject to ongoing audits in the U.S. federal, state and local tax authorities and by non-U.S. authorities. If these audits result in assessments different from our reserves, our future operating results and cash flows may include unfavorable adjustments to our tax liabilities.
We face risks from fluctuations in the value of foreign currency versus the U.S. dollar and the cost of currency exchange, which affect our revenue, cost of revenue and operating margins and could result in exchange losses.
A large portion of our sales and expenses are denominated in foreign currencies. We purchase materials from suppliers and sell our products around the world and maintain investments in foreign subsidiaries, all denominated in a variety of currencies. As a consequence, we are exposed to risks from fluctuations in foreign currency exchange rates with respect to a number of currencies, changes in government policies and legal and regulatory requirements, political instability, transportation delays and the imposition of tariffs and export controls. Changes in the relation of foreign currencies to the U.S. dollar will affect revenues, our cost of revenue and operating margins and could result in exchange losses. Among the more significant potential risks to us of relative fluctuations in foreign currency exchange rates is the relationship among and between the U.S. dollar and the Euro, Swiss franc, British pound, Swedish krona, Japanese yen, Korean won, and Singapore dollar.
We have a program of entering into foreign exchange forward contracts to minimize a portion of the risks associated with currency fluctuations on assets, liabilities or other transactions denominated in other than the functional currency of our US operations or our subsidiaries. It cannot be assured, however, that this program will effectively offset all of our foreign currency risk related to these assets or liabilities, or that the Company will choose to offset 100% of these risks. These foreign exchange forward contracts do not qualify for hedge accounting. Other than this program, we do not attempt to reduce our foreign currency exchange risks by entering into foreign currency management programs. As a consequence, there can be no assurance that fluctuations in foreign currency exchange rates in the future will not result in mismatches between local currency revenues and expenses, and will not adversely affect our results of operations and cash flows. Moreover, fluctuations in exchange rates could affect the demand for our products.
19
Table of Contents
No assurance can be given that our strategies will prevent future currency fluctuations from having a material adverse affect on our business, financial condition, results of operations or liquidity.
We face numerous risks associated with our international operations, which could cause a material adverse effect on our business and results of operations since approximately two-thirds of our revenues are derived from international sales.
We market and sell our products and services outside the United States, and currently have employees located in China, France, Germany, Italy, India, Japan, Singapore, South Korea, Sweden, Switzerland and the United Kingdom. Many of our customers and licensees are located outside the United States. As part of our strategy, we have expanded our international sales, particularly in China. We face numerous risks in doing business outside the United States, including:
| • | dependence on sales representatives or foreign distributors and their sales channels; |
| • | longer accounts receivable collection cycles; |
| • | less effective and less predictable recognition, protection and enforcement of intellectual property rights, specifically in areas of Asia and particularly in China; |
| • | trade protection measures, import or export licensing requirements, tariffs and other trade barriers; |
| • | highly cyclical business environments; |
| • | unusual or burdensome foreign laws or regulatory requirements or unexpected changes to those laws or requirements; |
| • | strengthening of the U.S. dollar, which could make our products more expensive; |
| • | changes in the political or economic condition of a specific country or region, particularly in emerging markets; and |
| • | potentially adverse tax consequences. |
Such factors could cause our future international sales to decline.
We may be greatly impacted by the political, economic, and military conditions in China, Taiwan, Japan, North Korea, and South Korea. In the recent past, these countries have conducted military exercises in or near the others’ territorial waters and airspace. Such disputes may continue or escalate, resulting in economic embargoes, disruptions in shipping, or even military hostilities. This could severely harm our business by interrupting or delaying supplies of components and materials and/or shipment of our products to or through these areas, as well as reducing our sales in these areas.
Our business practices in international markets subjects us to the requirements of additional regulation. If we or any of our employees are found to have violated these regulations, we could be subject to significant fines and other penalties.
We manufacture certain products in the United States, and sell our products and purchase parts, components and sub-assemblies in a number of foreign countries. Our international activities subject us to United States export control restrictions and various significant international, federal, state and local regulations, including but not limited to health and safety, product content, labor and import/export regulations. In certain cases, we may not be permitted to export products without obtaining an export license. U.S. export laws also prohibit the export of our
20
Table of Contents
products to a number of countries deemed by the United States to be hostile. The export of our high-performance oscilloscopes from the United States, which accounts for a material portion of our internationally derived revenue, is also subject to regulation under the Treaty for Nuclear Non-Proliferation. However, only a small portion of those oscilloscopes are sold in countries where that treaty restricts the end-user. These restrictions may make foreign competitors facing less stringent controls on their products more competitive in the global market. We cannot be certain that the U.S. government will approve any pending or future export license requests. In addition, the list of products and countries for which export approval is required, and the regulatory policies with respect thereto, could be revised. Our international sales and, because approximately two- thirds of our revenue is derived from sales outside the United States, our sales in general, could be materially harmed by our inability to obtain required licenses or by the costs of compliance.
The regulations related to our international sales are complex, change frequently and have tended to become more stringent over time. We may be required to incur significant expenses to comply with these regulations or to remedy violations of these regulations. Any failure by us to comply with applicable government regulations could also result in cessation of our operation or portions of our operations, product recalls or impositions of fines and restrictions on our ability to carry on or expand our operations. In addition, because many of our products are regulated or sold into regulated industries, we must comply with additional regulations in marketing our products.
If we suffer loss to our facilities or distribution system due to catastrophe, our operations could be negatively impacted.
Our facilities and distribution system are subject to catastrophic loss due to fire, flood, terrorism or other natural or man-made disasters. If any of our facilities were to undergo a catastrophic loss, it could interrupt our operations, delay production, shipments and revenue and could result in large expenses to repair or replace the facilities.
We depend on single-source suppliers for some of our products, and the loss of these suppliers could harm our business by interrupting or terminating our manufacture of those products.
We purchase a small number of parts from single-source suppliers. In particular, several key integrated circuits that we use are made by IBM and Toshiba. Although we have not experienced significant production delays attributable to supply changes, we believe that, for integrated circuits in particular, alternative sources of supply would be difficult to develop over a short period of time. Because we have no direct control over our third-party suppliers, interruptions or delays in the products and services provided by these third parties may be difficult to remedy in a timely fashion. In addition, if such suppliers are unable or unwilling to deliver the necessary parts or products, we may be unable to redesign or adapt our technology to work without such parts or find alternative suppliers or manufacturers. In such events, we could experience interruptions, delays, increased costs or quality control problems and loss of revenues.
Adverse changes in our relationships with, or the financial condition or performance of key distributors could adversely impact our operating results and/or cash flows.
We sell certain products through key distributors that have valuable relationships with our end customers. Adverse changes in our relationship could negatively impact our ability to generate revenue in certain markets and negatively impact our results of operations and/or cash flows.
We depend upon key personnel and qualified future hires to implement our corporate strategy, and if we are unable to retain or attract personnel we may not be able to manage and operate successfully and we may not be able to meet our strategic objectives.
Our success depends on the efforts and abilities of senior management and key employees in the sales, marketing, research and development, and manufacturing areas. Many of these employees would be difficult to replace. We do not have employment contracts with most of our key personnel. If we cannot retain existing key
21
Table of Contents
managers and employ additional qualified senior employees, our business, financial condition, liquidity and results of operations could be materially and adversely affected. We do not maintain “key man” life insurance policies on any of our personnel. Future expansion of operations will require us to attract, train and retain new personnel. In addition, we may be limited by non-solicitation agreements entered into by our key personnel with respect to hiring employees from our competitors. These factors could increase our operating expenses. If we are unable to recruit or retain a sufficient number of qualified employees, or the costs of compensation or employee benefits increase substantially, our business, results of operations, cash flows or financial condition could be materially and adversely affected.
We may not be successful in protecting our intellectual and proprietary rights, which would deprive us of a competitive advantage and thereby negatively impact our ability to compete.
As a technology-based company, our success depends on developing and protecting our intellectual property. We rely generally on patent, copyright, trademark and trade secret laws in the United States and abroad. Electronic equipment as complex as most of our products, however, is generally not patentable in its entirety. We also license intellectual property from third parties and rely on those parties to maintain and protect their technology. We cannot be certain that actions we take to establish and protect proprietary rights will be adequate, particularly in countries where intellectual property rights are not highly developed or protected. If we are unable to adequately protect our technology, or if we are unable to continue to obtain or maintain licenses for protected technology from third parties, it may be difficult to design alternatives to such technology without incurring significant costs. Thus, the loss of intellectual property rights to technology could have a material adverse effect on our business, results of operations, cash flows or financial condition. From time to time, in the ordinary course of business, we receive notices from third parties regarding intellectual property infringement or take action against others with regard to intellectual property rights. Even where we are successful in defending or pursuing such claims, we may incur significant costs. In the event of a successful claim against us, we could lose our rights to needed technology or be required to pay license fees for the infringed rights, either of which could have an adverse impact on our business.
We license certain intellectual property from third parties, and the loss of these licenses could delay development of future products or prevent the sale or enhancement of existing products.
We rely on licenses of intellectual property for our businesses, including technology used in our products. We cannot ensure that these licenses will be available in the future on favorable terms or at all. The loss of these licenses or the ability to maintain any of them on acceptable terms could delay development of future products or prevent the further sale or enhancement of existing products. Such loss could adversely affect our business, results of operations, cash flows and financial condition.
Our Protocol Solutions Group outsources a portion of its research and development activities to a third party in a foreign jurisdiction; the failure of this third party to adequately protect our proprietary rights in the technologies developed for us by this third party or a change in the laws of its jurisdiction may result in the loss of those proprietary rights.
Our Protocol Solutions Group currently outsources a portion of its research and development activities to a third party engineering firm located in Malaysia. We do not have any long-term contractual commitment from this engineering firm to continue to provide such services. The discontinuance of such services on short notice or any significant cost increases in the services they provide could harm our results of operations and cash flows, as well as slow our introduction of new products. In addition, the failure of this engineering firm to adequately protect our proprietary rights in the technologies developed by this firm, including the failure to comply with the intellectual property laws of Malaysia, may result in the loss of some or all of the proprietary rights in such technologies. In addition, any changes in the laws of Malaysia could also result in the loss of some or all of the proprietary rights in technologies developed in that country. It may also be more difficult to obtain a judgment enforcing our intellectual property rights in Malaysia than in the United States.
22
Table of Contents
Strategic alliances and joint ventures may result in financial results that are different than expected.
In the normal course of business, we engage in discussions with third parties relating to possible strategic alliances and joint ventures. Transactions that we may consummate in the future may cause our financial results to differ from the investment community’s expectations in a given quarter and year. In addition, strategic alliances may require us to integrate a different company culture, management team and business infrastructure. We may have difficulty developing, manufacturing and marketing products of a strategic alliance or joint venture in a way that enhances the performance of our combined businesses or product lines to realize the value from expected synergies. Depending on the size and complexity, a successful partnership depends on a variety of factors, including:
| • | the retention of key employees; |
| • | the management of facilities and employees in different geographic areas; |
| • | the retention of key customers; and |
| • | the integration or coordination of different research and development, product manufacturing and sales programs and facilities. |
All of these efforts require varying levels of management resources, which may divert our attention from other business operations. Further, if market conditions or other factors lead us to change our strategic direction, we may not realize the expected value from such transactions. If we do not realize the expected benefits or synergies of such transactions, our consolidated financial position, results of operations, cash flows, Convertible notes valuation and stock price could be negatively impacted.
We may not be able to obtain the capital we need to maintain or grow our business and refinance existing debt as it matures.
Our ability to execute our long-term strategy may depend, to a significant degree, on our ability to obtain long-term debt and equity capital. We have no commitments for additional borrowings at this time, other than our $50.0 million amended and restated revolver (the “New Credit Agreement”) with Manufacturers and Traders Trust Company (“M&T”), and the other lenders party thereto, which is subject to continuing and new financial covenants, including limitations on total borrowings which could require us to reduce our total debt below current levels and limit the amount we may borrow. The New Credit Agreement matures January 2014 and includes the right to increase the total revolving commitment to $60.0 million, upon meeting certain covenants within twenty-four months. We cannot determine the precise amount and timing of our funding needs at this time. We may be unable to obtain future additional financing on terms acceptable to us, or at all. If we fail to comply with certain covenants relating to our indebtedness, we may need to refinance our indebtedness or repay it. In addition, certain covenants relating to our $50.0 million credit facility impose limitations on additional indebtedness. Pursuant to our New Credit Agreement with M&T and other syndicated lenders, we granted the banks a security interest in all of the domestic assets of LeCroy and its domestic subsidiaries.
The following factors could affect our ability to obtain additional financing on favorable terms, or at all and could impact the satisfaction of covenants under our existing debt:
| • | our results of operations and cash flows; |
| • | general economic conditions, and conditions in our industry; |
| • | the perception in the global credit and capital markets of our business; |
| • | the credit availability and/or financial condition of potential lenders; |
| • | our ratio of debt to equity; |
23
Table of Contents
| • | our financial condition; |
| • | risk of greater exposure to variable interest rates, and its affect on our results of operations and cash flows; |
| • | our business prospects; and |
| • | changes in interest rates and foreign exchange. |
In fiscal 2009, the U.S. and global credit and equity markets underwent significant disruption, making it difficult for many businesses to obtain financing on acceptable terms. Although the market has improved, if these conditions worsen, the Company’s cost of borrowing may increase and it may be more difficult to obtain financing for the Company’s operations or to refinance long-term obligations as they become payable. Also, the Company could be required to reduce its total debt outstanding and availability under the credit agreement may be restricted. In addition, the Company’s borrowing costs can be affected by independent rating agencies’ short and long-term debt ratings which are based largely on the Company’s performance as measured by credit metrics including interest coverage and leverage ratios. A decrease in these ratings would likely also increase the Company’s cost of borrowing and make it more difficult for it to obtain financing. If we are unable to obtain sufficient capital in the future, we may have to curtail our capital expenditures and reduce research and development expenditures, which could put us at a competitive disadvantage and reduce our flexibility in planning for, or responding to, changing conditions in the economy or our industry. Any such actions could have a material adverse effect on our business results, financial condition, results of operations and liquidity.
We have a credit facility that contains financial covenants, and the failure to comply with these covenants could harm our financial condition because our credit facility may be unavailable to us or our total debt may have to be reduced.
We have a $50.0 million revolving credit facility with M&T and the other lenders party thereto. We are subject to financial covenants under this credit facility. Failure to comply with the financial covenants under our credit facility would cause us to be in default under the facility, which could result in the acceleration of the indebtedness under the credit facility. The acceleration of our indebtedness under the credit facility would adversely affect our business, results of operations, liquidity and financial condition. The acceleration of our indebtedness under the credit facility would also likely cause an acceleration of the indebtedness due under our notes. Additionally, although the Company does not anticipate needing additional capital in the near term due to our available credit and current financial position, the financial market disruption may make it difficult to raise additional capital, if needed, on acceptable terms or at all.
We have significantly increased our leverage as a result of the sale of the notes.
In connection with the previous sale of our 4.00% Convertible Senior Notes, we have principal indebtedness of $39.7 million. The degree to which we are leveraged could, among other things:
| • | make it difficult for us to make payments on the notes; |
| • | make it difficult for us to obtain financing for working capital or other purposes on favorable terms, if at all; |
| • | make us more vulnerable to industry downturns and competitive pressures; and |
| • | limit our flexibility in planning for, or reacting to changes in, our business. |
Our ability to meet our debt service obligations will depend upon our future performance, which will be subject to financial, business and other factors affecting our operations, many of which are beyond our control.
24
Table of Contents
The notes are effectively subordinated to all liabilities of our subsidiaries and to our secured debt and do not restrict certain corporate actions such as the payment of dividends and issuance of new debt.
None of our subsidiaries guarantee our obligations under, or have any obligation to pay amounts due on, the notes. As a result, the notes are “structurally subordinated” to all indebtedness and other liabilities, including trade payables and lease obligations, of our existing and future subsidiaries (unless such indebtedness is by its terms subordinated to the notes). In addition, the notes are not secured by any of our assets or those of our subsidiaries. As a result, the notes are effectively subordinated to our $50.0 million credit facility and any secured debt that we, including our subsidiaries, incur. In the event of our bankruptcy, liquidation or reorganization or upon acceleration of the notes, payment on the notes could be less, ratably, than on any secured indebtedness. We may not have sufficient assets remaining to pay amounts due on any or all of the notes then outstanding. At July 3, 2010, the Company had $17.0 million in net borrowings, excluding the notes. Our subsidiaries had trade payables and other accrued liabilities (excluding obligations that are inter-company in nature) of approximately $5.1 million in the aggregate.
In addition, the indenture does not restrict us, including any of our subsidiaries, from paying dividends or issuing or repurchasing securities. If we, including our subsidiaries, were to incur additional debt or liabilities, our ability to pay our obligations on the notes could be adversely affected. Certain of our other debt instruments may, however, restrict these and other actions.
We may be unable to repay, repurchase or redeem the notes.
At maturity, the entire outstanding principal amount of the notes will become due and payable by us. Upon a designated event, as defined in the indenture, or on each of October 15, 2011, October 15, 2016 and October 15, 2021, or upon conversion, the holders may require the Company to repurchase all or a portion of the notes at a repurchase price of 100% of the principal amount of the notes, plus accrued and unpaid interest and additional interest, if any, to, but excluding, the date of the repurchase of the notes. We cannot assure the note holders that we will have enough funds or be able to arrange for additional financing to pay the principal at maturity or to repurchase the notes upon a designated event or that our then-existing debt agreements will permit us to repay the principal amount at maturity or repurchase notes.
Our failure to repay the notes at maturity or to repurchase tendered notes upon a designated event or on each of October 15, 2011, October 15, 2016 and October 15, 2021, would constitute an event of default under the indenture that governs the notes and may also constitute an event of default under any other indenture or other agreement governing then-existing indebtedness, which could prevent us from repurchasing the notes. If a designated event occurred and accelerated our other indebtedness, we cannot assure you that we would have sufficient financial resources, or be able to arrange for additional financing, to repay the principal amount at maturity or pay the repurchase price for the notes and amounts due under any other indebtedness. The change in control feature of the notes could make it more difficult for a third party to acquire us, even if such an acquisition would be beneficial to the note holders and our stockholders. Our obligation to offer to repurchase the notes upon a designated event would not necessarily afford protection in the event of a highly leveraged transaction, reorganization, merger or similar transaction involving us.
Holders of notes will not be entitled to any rights with respect to our common stock, but will be subject to all changes made with respect to our common stock.
Holders of notes will not be entitled to any rights with respect to our common stock (including, without limitation, voting rights and rights to receive any dividends or other distributions on our common stock), but will be subject to all changes affecting the common stock. Holders will only be entitled to rights on the common stock if and when we deliver shares of common stock, in exchange for the notes and in limited cases under the anti-dilution adjustments of the notes. For example, in the event that an amendment is proposed to our certification of incorporation or bylaws requiring stockholder approval and the record date for determine the stockholders of record entitled to vote on the amendment occurs prior to delivery of the common stock, note holders will not be entitled to vote on the amendment, although they will nevertheless be subject to any changes in the powers, preferences or special rights of our common stock.
25
Table of Contents
Conversion of the notes will dilute the ownership interest of existing stockholders, including stockholders who had previously converted their notes.
The conversion of the notes into shares of our common stock, to the extent we choose not to deliver all cash for the conversion value in excess of the principal amount, will dilute the ownership interests of existing stockholders. Any sales in the public market of the common stock issuable upon conversion of the notes could adversely affect prevailing market prices of our common stock. In addition, the existence of the notes may encourage short selling by market participants due to this dilution or facilitate trading strategies involving the notes and our common stock.
Issuance of shares in connection with financing transactions or under stock plans will dilute current stockholders.
Pursuant to our stock plans, our management is authorized to grant restricted stock awards or stock options to our employees, directors and consultants. Our stockholders will incur dilution upon exercise of any outstanding stock options. In addition, if we raise additional funds by issuing additional common stock, or securities convertible into or exchangeable or exercisable for common stock, further dilution to our existing stockholders will result, and new investors could have rights superior to existing stockholders.
Anti-takeover provisions under our charter document and Delaware law could delay or prevent a change of control and could also limit the market price of our stock.
Our certificate of incorporation and bylaws contain provisions that could delay or prevent a change of control of our company that our stockholders might consider favorable. Certain provisions of our certificate of incorporation and bylaws allow us to:
| • | authorize the issuance of preferred stock which can be created and issued by the board of directors without prior stockholder approval, with rights senior to those of the common stock; |
| • | provide for a classified board of directors, with each director serving a staggered three-year term; |
| • | prohibit stockholders from filling board vacancies, calling special stockholder meetings, or taking action by written consent; and |
| • | require advance written notice of stockholder proposals and director nominations. |
We are governed by the provisions of Section 203 of the Delaware General Corporate Law, which may prohibit certain business combinations with stockholders owning 15% or more of our outstanding voting stock. These and other provisions in our certificate of incorporation, bylaws and Delaware law could make it more difficult for stockholders or potential acquirers to obtain control of our board of directors or initiate actions that are opposed by the then-current board of directors, resulting in, but not limited to, delaying or impeding a merger, tender offer, or proxy contest involving the Company. Any delay or prevention of a change of control transaction or changes in our board of directors could cause the market price of our common stock to decline. Any of these results could adversely affect the price of our common stock and, therefore, the price of our notes. We may in the future issue shares of authorized preferred stock at any time.
Because we do not intend to pay dividends, stockholders will benefit from an investment in our common stock only if it appreciates in value.
We have never declared or paid any cash dividends on our common stock. For the foreseeable future, it is expected that earnings, if any, generated from our operations will be used to finance the growth of our business and repay existing debt, and that no dividends will be paid to holders of the common stock. As a result, the success of an investment in our common stock will depend upon any future appreciation in its value. There is no guarantee our common stock will appreciate in value.
26
Table of Contents
We could incur substantial costs as a result of violations of or liabilities under environmental laws.
Our operations and products are subject to laws and regulations relating to the protection of the environment, including those governing the discharge of pollutants into the air or water, the management and disposal of hazardous substances or wastes and the cleanup of contaminated sites. Some of our operations require environmental permits and controls to prevent and reduce air and water pollution, and these permits are subject to modification, renewal and revocation by issuing authorities. We could incur substantial costs, including cleanup costs, fines and civil or criminal sanctions and third-party claims for property damage and personal injury as a result of violations of or liabilities under environmental laws or noncompliance with environmental permits.
Our former subsidiary, Digitech Industries, Inc., has been involved in environmental remediation activities, the liability for which was retained by us and the estimated remediation cost was reserved for after the sale of the Vigilant Networks business and the residual assets of Digitech. Any liability beyond what is currently expected and reserved for could have a material adverse affect on our results of operations, liquidity and financial condition.
We are subject to laws and regulations governing government contracts, and failure to address these laws and regulations or comply with government contracts could harm our business by leading to a reduction in revenue associated with these customers.
We have agreements relating to the sale of our products to government entities and, as a result, we are subject to various statutes and regulations that apply to companies doing business with the government. The laws governing government contracts differ from the laws governing private contracts. For example, many government contracts contain pricing terms and conditions that are not applicable to private contracts. We are also subject to investigation for compliance with the regulations governing government contracts. A failure to comply with these regulations might result in suspension of these contracts, or administrative penalties.
We must successfully execute our strategy to introduce new products.
One of our key strategies is to expand our addressable portion of the oscilloscope and protocol analysis markets by introducing new products such as high-end oscilloscopes and protocol exercisers and probes. We have in the past withdrawn product lines due to implementation and financial concerns. The success of our new product offerings will depend on a number of factors, including our ability to identify customers’ existing and future needs properly and quickly, timely perform the necessary research and development to define and create the products, timely manufacture and deliver the products that address these needs in sufficient volumes, differentiate the offerings from competitors’ offerings, price products competitively and anticipate competitors’ development of new products or technological innovations.
Without the timely introduction of competitive products, our products may become technologically obsolete.
We generally sell our products in industries that are characterized by rapid technological changes, frequent new product announcements and introductions and changing industry standards. The development of new, technologically advanced products is a complex and uncertain process requiring high levels of innovation, highly skilled engineering and development personnel, qualification of and coordination with suppliers, and accurate anticipation of technological and market trends. Consequently, product development delays are typical in our industry. If we fail to introduce competitive products in a timely manner, customers may defer placing orders in anticipation of future releases or may purchase products from competitors. Product development delays may result from numerous factors, including:
| • | changing product specifications and customer requirements; |
| • | unanticipated engineering complexities; |
| • | difficulties with or delays by contract manufacturers or suppliers of key components or technologies; |
| • | difficulties in allocating engineering resources and overcoming resource limitations; and |
| • | difficulties in hiring and retaining necessary technical personnel. |
27
Table of Contents
Without the timely introduction of new products, services and enhancements, our products may become technologically obsolete, in which case our operating results and cash flows could suffer.
If we devote resources to developing products for emerging communications standards that ultimately are not widely accepted, our business could be harmed.
Our future growth depends, in part, upon our ability to develop, manufacture and sell in volume advanced verification systems for existing, emerging and yet unforeseen communications standards. We have little or no control over the conception, development or adoption of new standards. Moreover, even in relation to currently emerging standards, the markets are rapidly evolving and we have virtually no ability to impact the adoption of those standards. As a result, there is significant uncertainty as to whether markets for new and emerging standards ultimately will develop at all or, if they do develop, their potential size or future growth rate. We may incur significant expenses and dedicate significant time and resources to develop products for standards that fail to gain broad acceptance. Failure of a standard for which we devote substantial resources to gain widespread acceptance would likely harm our corporate growth strategies.
If we fail to maintain and expand our relationships with the core or promoter companies in our target markets, we may have difficulty developing and marketing certain protocol analyzer products.
It is important to our success that we establish, maintain and expand our relationships with technology and infrastructure leader companies developing emerging communications standards in our target markets. We must work closely with these companies to gain valuable insights into new market demands, obtain early access to standards as they develop and help us design new or enhanced products. Generally, we do not enter into contracts obligating these companies to work or share their technology. Industry leaders could choose to work with other companies in the future. If we fail to establish, maintain and expand our industry relationships, we could lose first-mover advantage with respect to emerging standards and it would likely be more difficult for us to develop and market products that address these standards.
We operate in highly competitive industry and this competition could reduce our market share and harm our business.
The Test and Measurement industry is highly competitive and characterized by rapid and continual advances in technology and has been subject to consolidation. Competitors include Tektronix, a division of Danaher Corporation, Agilent, JDS Uniphase, Rigol Technologies, Inc., Yokogawa Electric Corporation, Iwatsu Electric Company Ltd., National Instruments and Rhode & Schwarz International, among others. A number of our competitors have substantially greater sales and marketing, development and financial resources. We believe that our competitors offer a wide range of products that attempt to address most sectors for oscilloscopes and protocol analyzers. We expect that competition will continue to be intense and that our competitors’ products may be less costly, provide better performance or include additional features. In addition, lower barriers to entry for certain products segments result in introducing new technologies and new and growing competitors to challenge our offerings. We also believe that further consolidation in the Test and Measurement industry could result in our competitors increasing their market share through business combinations.
We believe that the principal bases of competition in the oscilloscope and protocol analyzer sectors include, among others, a product’s performance, its price and quality, the vendor’s name recognition and reputation, product availability and the quality of post-sale support. If any of our competitors surpass us or are perceived to have surpassed us with respect to one or more of these factors, we may lose customers. We also believe that our success will depend, in part, on our ability to maintain and develop the advanced technology used in our oscilloscope products and protocol analyzers and our ability to offer high-performance products timely and at a favorable “price-to-performance” ratio. We cannot assure that we will continue to compete effectively and successfully.
We may be unable to comply with NASDAQ listing standards.
Our business has been and may continue to be affected by worldwide macroeconomic factors, which include uncertainties in the credit and capital markets. External factors that affect our stock price, such as liquidity
28
Table of Contents
requirements of our investors, as well as our performance, could impact our market capitalization, revenue and operating results, which could result in our failure to remain in compliance with the NASDAQ’s listing standards for market value or equity value or total assets and total revenue. If our stock price declines to the point where our compliance with the listing standard relating to market capitalization is in jeopardy, we will consider such actions, including equity issuances, as we deem appropriate under the circumstances.
Our reported financial results may be adversely affected by changes in United States Generally Accepted Accounting Principles (“U.S. GAAP”).
U.S. GAAP is subject to interpretation by the Financial Accounting Standards Board (“FASB”), the American Institute of Certified Public Accountants, the SEC and various bodies formed to promulgate and interpret appropriate accounting principles. A change in these principles or interpretations could have a significant effect on our reported financial results, and could affect the reporting of transactions completed before the announcement of a change. In addition, the SEC has announced a multi-year plan that could ultimately lead to the use of International Financial Reporting Standards by United States issuers in their SEC filings. Any such change could have a significant impact on our reported results and how we report our financial position and cash flows.
Our results of operations could vary as a result of the methods, estimates and judgments that we use in applying our accounting policies.
The methods, estimates and judgments that we use in applying our accounting policies have significant impact on our results of operations (see “Critical Accounting Estimates”). Such methods, estimates and judgments are, by their nature, subject to substantial risks, uncertainties and assumptions, and factors may arise over time that could lead us to change our methods, estimates and judgments. Changes in those methods, estimates and judgments could significantly affect our financial position and results of operations.
| ITEM 1B. | UNRESOLVED STAFF COMMENTS |
There are no unresolved comments to be reported pursuant to Item 1B.
| ITEM 2. | PROPERTIES |
We own our land, executive offices and manufacturing facility, which is an approximately 95,000 square foot building in Chestnut Ridge, New York. Pursuant to our secured credit agreement with M&T and other syndicated lenders, we granted the banks a security interest in this property. In addition, we lease other office space around the world to support our local sales and service operations and to support our research and development activities. Our Santa Clara, California premises also serve as a manufacturing facility for a limited number of products. We believe that our facilities are in good condition and are suitable and sufficient for our current operations.
| ITEM 3. | LEGAL PROCEEDINGS |
From time to time, the Company is involved in lawsuits, claims, investigations and proceedings, including intellectual property, contracts, distribution agreements, employee relations and environmental matters, which arise in the ordinary course of business. At least quarterly, we review the status of each significant matter and assess its financial exposure. If the potential loss from any claim or legal proceeding is considered probable and the amount or the range of loss can be estimated, we accrue a liability for the estimated loss. There are no matters pending that the Company expects to be material to its business, results of operations, financial condition or cash flows.
| ITEM 4. | REMOVED AND RESERVED |
29
Table of Contents
PART II
| ITEM 5. | MARKET FOR REGISTRANT’S COMMON EQUITY, RELATED STOCKHOLDER MATTERS AND ISSUER PURCHASES OF EQUITY SECURITIES |
Price Range of Common Stock
Our common stock is traded on the NASDAQ Stock Market under the symbol “LCRY.” As of August 23, 2010, there were 290 stockholders of record of our common stock. The following table sets forth, for the periods indicated, the high and low closing prices per share of our common stock as reported on the NASDAQ Stock Market.
| High | Low | |||||
| Year Ended July 3, 2010: |
||||||
| First Quarter |
$ | 4.23 | $ | 3.51 | ||
| Second Quarter |
4.20 | 3.59 | ||||
| Third Quarter |
5.07 | 3.56 | ||||
| Fourth Quarter |
6.03 | 4.54 | ||||
| Year Ended June 27, 2009: |
||||||
| First Quarter |
$ | 9.00 | $ | 7.78 | ||
| Second Quarter |
7.96 | 2.11 | ||||
| Third Quarter |
3.36 | 1.12 | ||||
| Fourth Quarter |
4.40 | 2.57 | ||||
Issuer Purchases of Equity Securities
On May 25, 2006, LeCroy’s Board of Directors approved the adoption of a share repurchase plan authorizing the Company to purchase up to 2 million shares, not to exceed $25 million, of its common stock. Purchases under this buyback program may be made from time to time on the open market and in privately negotiated transactions. The timing of these purchases is dependent upon several factors, including market conditions, the market price of the Company’s common stock, the effect of the share dilution on earnings, available cash and any other potential risks the Company may encounter. The share repurchase plan may be discontinued at any time at the discretion of the Company.
During fiscal 2010, 2009, and 2008, the Company repurchased zero, approximately 0.1 million and approximately 0.3 million shares, respectively, of Company common stock in open market transactions at a cost of zero, approximately $0.7 million and approximately $2.4 million, respectively. During the quarter ended April 3, 2010, the Company retired these shares of its treasury stock.
The terms of our New Credit Agreement prohibit us from repurchasing shares of our common stock without the prior consent of lenders.
Equity Compensation Plan Information
Information regarding LeCroy’s equity compensation plans, including both stockholder approved plans and plans not approved by stockholders, is set forth in LeCroy’s Proxy Statement, to be filed within 120 days after LeCroy’s fiscal year end of July 3, 2010 (the “2010 Proxy Statement”), which information is incorporated herein by reference.
Convertible Notes
On October 12, 2006, the Company sold and issued $72.0 million in convertible senior subordinated notes to qualified institutional buyers pursuant to Rule 144A of the Securities Act of 1933, as amended (the “Notes”). The Notes bear interest at a rate of 4.00% per annum, payable in cash semi-annually in arrears on each April 15 and October 15, beginning April 15, 2007. The Notes mature on October 15, 2026 unless earlier redeemed, repurchased
30
Table of Contents
or converted. Holders of the Notes will have the right to require the Company to repurchase for cash all or a portion of their Notes on each of October 15, 2011, October 15, 2016 and October 15, 2021, at a repurchase price equal to 100% of the principal amount of the Notes to be repurchased plus accrued and unpaid interest, if any, up to but not including, the repurchase date. The Company may, from time to time, at its option repurchase the Notes in the open market. In addition, the Company may redeem the Notes for cash, either in whole or in part, anytime after October 20, 2011 at a redemption price equal to 100% of the principal amount of the Notes to be redeemed plus accrued and unpaid interest, if any, up to but not including the redemption date. The Notes are convertible into Company common stock by the holders at an initial conversion rate equal to 68.7285 shares per $1,000 principal amount of the Notes (equal to an initial conversion price of approximately $14.55 per share), subject to adjustment as described in the indenture. During fiscal 2010 and 2009, the Company repurchased approximately $8.7 million and $19.1 million of principal, respectively, of the outstanding Convertible notes. The remaining principal balances at July 3, 2010 and June 27, 2009 were approximately $39.7 million and $48.4 million, respectively.
Dividend Policy
We have never declared or paid cash dividends on our common stock and do not anticipate paying any dividends in the foreseeable future. We currently intend to retain future earnings, if any, to operate and expand our business. Subject to the terms of our revolving credit agreement, our payment of any future dividends will be at the discretion of our board of directors after taking into account various factors, including our financial condition, operating results, cash needs and growth plans. Under the terms of our New Credit Agreement, we are not permitted to declare or pay dividends other than dividends payable solely in additional shares of our equity securities.
Performance Graph
The performance graph set forth below compares the cumulative total stockholder return of our common stock for the last five fiscal years through the fiscal year ended July 3, 2010 with that of the U.S. NASDAQ® stock market index, and a peer group comprising the S&P Information Technology index. The graph assumes an investment of $100 on June 30, 2005 and the reinvestment of dividends (where applicable). The comparisons in this table are set forth in response to SEC disclosure requirements, and are not intended to forecast or be indicative of future performance of the common stock.
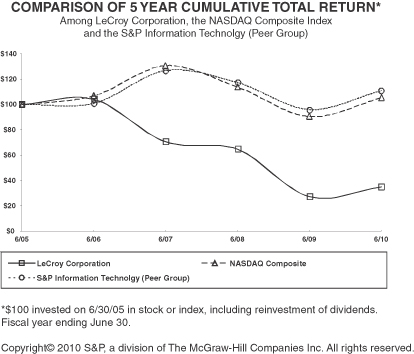
31
Table of Contents
| ITEM 6. | SELECTED FINANCIAL DATA |
The following selected consolidated financial data has been derived from our consolidated financial statements from each of the five prior fiscal years. The following information should be read in conjunction with “Management’s Discussion and Analysis of Financial Condition and Results of Operations” and the consolidated financial statements and related notes appearing elsewhere in this Annual Report on Form 10-K, or the respective prior fiscal years’ Form 10-K.
Consolidated Statements of Operations Data:
| Years Ended | ||||||||||||||||||||
| July 3, 2010 (1) |
June 27, 2009 (2) |
June 28, 2008 (2) |
June 30, 2007 (2) |
July 1, 2006 |
||||||||||||||||
| (In thousands, except per share amounts) | ||||||||||||||||||||
| Revenues: |
||||||||||||||||||||
| Test and measurement products |
$ | 119,633 | $ | 125,456 | $ | 151,077 | $ | 143,244 | $ | 151,197 | ||||||||||
| Service and other |
9,703 | 8,511 | 9,409 | 8,056 | 9,339 | |||||||||||||||
| Total revenues |
129,336 | 133,967 | 160,486 | 151,300 | 160,536 | |||||||||||||||
| Cost of revenues |
53,477 | 63,598 | 70,756 | 69,953 | 63,598 | |||||||||||||||
| Gross profit |
75,859 | 70,369 | 89,730 | 81,347 | 96,938 | |||||||||||||||
| Operating expenses: |
||||||||||||||||||||
| Selling, general and administrative |
42,265 | 46,991 | 51,299 | 53,218 | 49,901 | |||||||||||||||
| Legal settlements |
— | — | — | — | 2,792 | |||||||||||||||
| Research and development |
27,992 | 30,851 | 32,576 | 38,302 | 31,722 | |||||||||||||||
| Reimbursement from escrow account |
— | — | (240 | ) | — | — | ||||||||||||||
| Impairment of goodwill |
— | 105,771 | — | — | — | |||||||||||||||
| Total operating expenses |
70,257 | 183,613 | 83,635 | 91,520 | 84,415 | |||||||||||||||
| Operating income (loss) |
5,602 | (113,244 | ) | 6,095 | (10,173 | ) | 12,523 | |||||||||||||
| Gain on extinguishment of convertible debt, net of issue cost write-off |
761 | 9,627 | 292 | — | — | |||||||||||||||
| Write-off of deferred bank financing fees |
— | — | — | (997 | ) | — | ||||||||||||||
| Interest income |
32 | 90 | 298 | 124 | 813 | |||||||||||||||
| Interest expense |
(3,112 | ) | (3,443 | ) | (4,128 | ) | (4,196 | ) | (3,096 | ) | ||||||||||
| Amortization of debt discount on convertible notes |
(2,287 | ) | (2,872 | ) | (3,083 | ) | (2,077 | ) | — | |||||||||||
| Other, net |
(443 | ) | 260 | (632 | ) | (99 | ) | (204 | ) | |||||||||||
| Income (loss) before income taxes |
553 | (109,582 | ) | (1,158 | ) | (17,418 | ) | 10,036 | ||||||||||||
| Provision (benefit) for income taxes |
810 | (1,165 | ) | (983 | ) | (2,934 | ) | 3,463 | ||||||||||||
| Net (loss) income |
$ | (257 | ) | $ | (108,417 | ) | $ | (175 | ) | $ | (14,484 | ) | $ | 6,573 | ||||||
| Net (loss) income per common share: |
||||||||||||||||||||
| Basic |
$ | (0.02 | ) | $ | (9.03 | ) | $ | (0.01 | ) | $ | (1.24 | ) | $ | 0.54 | ||||||
| Diluted |
(0.02 | ) | (9.03 | ) | (0.01 | ) | (1.24 | ) | 0.53 | |||||||||||
| Weighted average number of common shares: |
||||||||||||||||||||
| Basic |
12,425 | 12,003 | 11,749 | 11,702 | 12,218 | |||||||||||||||
| Diluted |
12,425 | 12,003 | 11,749 | 11,702 | 12,474 | |||||||||||||||
| Consolidated Balance Sheet Data: |
||||||||||||||||||||
| Cash and cash equivalents |
$ | 7,822 | $ | 6,413 | $ | 10,224 | $ | 10,448 | $ | 16,972 | ||||||||||
| Working capital |
47,765 | 51,021 | 45,117 | 54,710 | 46,997 | |||||||||||||||
| Total assets |
102,654 | 107,678 | 222,476 | 225,272 | 201,974 | |||||||||||||||
| Total debt and capital leases |
56,716 | 66,169 | 68,053 | 85,029 | 38,130 | |||||||||||||||
| Total stockholders’ equity |
19,776 | 17,318 | 126,401 | 122,536 | 129,703 | |||||||||||||||
| (1) | Represents a 53-week year. |
| (2) | Adjustments have been made to prior years’ amounts to reflect the retrospective adoption of the Financial Accounting Standards Board (“FASB”) staff position related to the accounting for convertible debt instruments that may be settled in cash upon conversion (including partial cash settlement), which was adopted by the Company on June 28, 2009. |
32
Table of Contents
| ITEM 7. | MANAGEMENT’S DISCUSSION AND ANALYSIS OF FINANCIAL CONDITION AND RESULTS OF OPERATIONS |
The following discussion and analysis should be read in conjunction with the other financial information and consolidated financial statements and related notes appearing elsewhere in this Form 10-K and the documents incorporated by reference herein. This discussion contains forward-looking statements that involve risks and uncertainties. Our actual results could differ materially from those anticipated in the forward-looking statements as a result of a variety of factors, including those discussed in Item 1A, “Risk Factors”, and elsewhere in this Form 10-K.
Fiscal Year
Our fiscal years end on the Saturday closest to June 30, resulting in an extra week of results every five or six years. Fiscal 2010 is a 53-week year, while fiscal 2009 and 2008 represent 52-week years.
Overview
We were founded in 1964 to develop, manufacture and sell high performance signal analysis tools to scientists engaged in high-energy physics research. In 1985 we introduced our first oscilloscope using our core competency of designing signal acquisition and digitizing technology.
We are a leading, worldwide provider of oscilloscopes and protocol analyzers as well as a provider of related test and measurement equipment and currently operate as one business segment in the Test and Measurement industry. Our oscilloscopes are tools used by designers and engineers to measure and analyze complex electronic signals in order to develop high-performance systems, to validate electronic designs and to improve time to market. We currently offer seven families of oscilloscopes, which address different solutions: WaveExpert, a powerful family of sampling oscilloscopes and modules; WaveMaster, one of our high performance product families; WavePro, which is targeted at the mid- to high-performance sector; WaveRunner, designed for the mid-performance sector; WaveSurfer, designed for users in the low bandwidth sector of the market; WaveJet, designed for value-oriented users in the low bandwidth sector of the market; and WaveAce, our entry-level oscilloscope products. Our protocol analyzers are tools used by designers and engineers to generate and monitor traffic over high speed serial data interfaces, including USB 2.0, USB 3.0, Bluetooth, PCI Express, Serial ATA, Serial Attached SCSI (SAS) and others.
We sell our products into a broad range of industry sectors, including Computer/Semiconductor/Consumer Electronics, Data Storage, Automotive/Industrial, and Military/Aerospace. We believe that our products offer a strong value proposition in these sectors by providing advanced analysis capabilities coupled with innovative and proprietary technology features. We believe designers in all of these sectors are developing products which rely on increasingly complex electronic signals to provide the features and performance their customers require.
We employ a direct sales model utilizing a highly skilled global sales force where it makes economic sense to do so. We supplement our direct sales force with a combination of manufacturers’ representatives and distributors in certain geographic areas. We divide the world into three areas — the Americas, Europe/Middle East and Asia/Pacific. In the Americas, we primarily sell our products directly in the United States. In Europe/Middle East, we sell our products directly in Switzerland, Germany, Italy, France, the United Kingdom and Sweden. In Asia/Pacific, we sell our products directly in South Korea, Singapore, Japan and China.
We generate revenue in a single segment within the Test and Measurement industry, primarily from the sale of our oscilloscopes, protocol analyzers, probes, accessories, and applications solutions. To a lesser extent, we also generate revenue from the sales of our extended warranty, maintenance contracts and repairs and calibrations on our instruments after their warranties expire.
Generally, we transact revenues and pay our operating expenses in the local currencies of the countries in which we have a direct distribution presence or other operations, with limited exceptions, most notably in China
33
Table of Contents
where our sales are principally denominated in U.S. dollars. In Europe/Middle East, we transact business in Euros, Swiss francs, British pounds, Swedish krona and U.S. dollars. In Japan, we transact business in Japanese yen. In South Korea, we transact business in Korean won and in Singapore, we transact business in both U.S. dollars and Singapore dollars.
Historically, we have, at times, experienced lower levels of demand during our first fiscal quarter than in other fiscal quarters which, we believe, have been principally due to the lower level of general market activity during the summer months, particularly in Europe.
Cost of revenues represents manufacturing and service costs, which primarily comprise materials, labor and factory overhead. Gross profit represents revenues less cost of revenues. Additional factors integral to gross profit earned on our products are mix, as the list prices of our products range from $695 to $229,490 and the effects of foreign currencies, as approximately two-thirds of our revenues are derived overseas, much of which is denominated in local currencies while product manufacturing costs are primarily U.S. dollar denominated.
Selling, general and administrative expenses consist primarily of salaries, share based compensation, and related overhead costs for sales, marketing and administrative personnel as well as legal, accounting and other professional services.
Research and development expenses consist primarily of salaries, share based compensation, and related overhead costs associated with employees engaged in research, design and development activities, as well as the cost of masks, wafers and other materials and related test services and equipment used in the development process.
Our results of operations and financial position are affected by a variety of factors. As discussed below, we believe the most significant recurring factors are the economic strength of the technology industry sectors into which we sell our products, our ability to identify market demands and develop competitive products to meet those demands, the announcements and actions of our competitors and our ability to enter into new industry sectors and broaden our presence in existing sectors.
Our sales are largely dependent on the health and growth of technology companies whose operations tend to be cyclical. Consequently, demand for our products tends to coincide with the increase or decrease in capital spending in the Computer/Semiconductor/Consumer Electronics, Data Storage, Automotive/Industrial, and Military/Aerospace industries.
In addition, in response to fluctuations in the technology sectors we target, we continually assess and adopt programs aimed at positioning us for long-term success. These programs may include streamlining operations, discontinuing older and less profitable product lines, changing our future product strategy, and reducing operating expenses when necessary.
We face significant competition in our target industry sectors. We believe that in order to continue to compete successfully, we need to anticipate, recognize and respond to changing market demands by providing products that serve our customers’ needs as they arise at acceptable prices. We believe that we compete favorably with our competition in each of these areas. Consequently, we are constantly reviewing our product development strategy and invest time, resources and capital in development projects we deem most likely to succeed.
We transformed our entire oscilloscope product lines by introducing a brand new line of WaveAces in the economy segment and a new line of WavePros and WaveMasters on the high end. We also refreshed our mid-range product lines by introducing updated versions of WaveRunners, WaveSurfers and WaveJet product lines. We believe that our diversified product mix, along with continued enhancements, strategically positions us to expand our presence in oscilloscopes in addition to the improving economic cycle. There are also emerging opportunities for the protocol analyzers for which we have deployed next-generation standards.
34
Table of Contents
Our Business Risks
Our results of operations and financial position are affected by a variety of factors. We believe the most significant recurring factors are the economic strength of the technology industry sectors into which we sell our products, our ability to identify market demands and develop competitive products to meet those demands, the announcements and actions of our competitors and our ability to enter into new industry sectors and broaden our presence in existing sectors. Our sales are largely dependent on the health and growth of technology companies whose operations tend to be cyclical. Consequently, demand for our products tends to coincide with the increase or decrease in capital spending in the Computer/Semiconductor/Consumer Electronics, Data Storage, Automotive/Industrial, and Military/Aerospace industries.
Critical Accounting Policies and Estimates
The discussion and analysis of our financial position and results of operations are based upon our Consolidated Financial Statements, which have been prepared in accordance with U.S. Generally Accepted Accounting Principles. Our significant accounting policies are described in Note 1 to the Consolidated Financial Statements. The preparation of our financial statements requires management to make estimates and assumptions that affect the reported amounts of assets and liabilities, revenues and expenses, and related disclosures of contingent assets and liabilities in the Consolidated Financial Statements and accompanying notes. These estimates and assumptions are based on management’s judgment and available information and, consequently, actual results could differ from these estimates.
The accounting policies that we believe are the most critical in understanding and evaluating our reported financial results include: revenue recognition; reserves on accounts receivable; allowance for excess and obsolete inventory; uncertain tax positions; valuation of deferred tax assets; the effective income tax rate and geographical distribution of taxable income; valuation of long-lived assets and goodwill; estimation of warranty liabilities; share-based compensation expense and separation of Convertible notes between debt and equity.
Revenue Recognition. We enter into agreements to sell products, services, and other arrangements that include combinations of products and services. Revenues from products are included in revenues from Test and measurement products in the Consolidated Statements of Operations, net of any applicable sales or value added taxes. Revenue from product sales, net of allowances for anticipated returns, is recognized provided that persuasive evidence of an arrangement exists, delivery has occurred, the selling price is fixed or determinable, and collection is reasonably assured. Delivery is considered to have occurred when title and risk of loss have transferred to the customer, or when services have been provided. The price is considered fixed or determinable when it is not subject to refund or adjustments.
Revenue from services is deferred and recognized on a straight-line basis over the contractual period or as services are rendered and accepted by the customer. When arrangements include multiple elements, we use relative fair values to allocate revenue to the elements and recognize revenue when the criteria for revenue recognition have been met for each element. The amount of revenue recognized is affected by our judgments as to whether an arrangement includes multiple elements and if so, whether objective and reliable evidence of fair value exists for those elements. Changes to the elements in an arrangement and the ability to establish objective and reliable evidence of fair value for those elements could affect the timing of the revenue recognition.
Currently, we recognize revenue on the sale of our protocol analyzer products, due to their significant software content, in accordance with specific revenue recognition guidance, upon shipment provided there is persuasive evidence of an arrangement, the product has been delivered, the price is fixed or determinable and collection is probable. Software maintenance support revenue is deferred based on its vendor specific objective evidence of fair value (“VSOE”) and recognized ratably over the maintenance support periods. Provisions for warranty costs are recorded at the time sales of related products are recognized as revenue. Revenues from protocol analyzer products are included in Test and measurement products in the Consolidated Statements of Operations.
35
Table of Contents
In October 2009, the FASB issued amendments to the accounting and disclosure for revenue recognition. These amendments are effective at the beginning of our 2011 fiscal year and they modify the criteria for revenue recognition in multiple arrangements and what constitutes a non-software deliverable, as referenced below under “Recent Accounting Pronouncements”.
In an effort to provide end-user customers an alternative to purchasing the Company’s higher end products under its standard terms and conditions, the Company offers customers an opportunity to enter into sales-type or direct financing leases for these products. In order to qualify as a sales-type or direct financing lease, the lease must meet one of the same criteria used for lessees to classify a lease as a capital lease, in addition to two criteria dealing with future uncertainties. Leases not meeting the criteria are considered operating leases and are accounted for like rental property. We classify the transactions as sales type, direct financing leases or operating leases based on (1) review for transfers of ownership of the property to the lessee by the end of the lease term, (2) review of the lease terms to determine if it contains an option to purchase the leased property for a price which is sufficiently lower than the expected fair value of the property at the date of the option, (3) review of the lease term to determine if it is equal to or greater than 75% of the economic life of the equipment and (4) review of the present value of the minimum lease payments to determine if they are equal to or greater than 90% of the fair market value of the equipment at the inception of the lease. Additionally, we consider the cancelability of the contract and any related uncertainty of collections or risk in recoverability of the lease investment at lease inception. Revenue from sales type leases is recognized at the inception of the lease. Revenues from equipment rentals under operating leases are recognized as earned over the lease term on a straight-line basis. Lease and rental revenues are reported within Test and measurement product revenue.
Reserves on Accounts Receivable. We maintain an allowance for anticipated returns and doubtful accounts relating to the portion of the accounts receivable which we estimate is non-collectible. We analyze historical bad debts, customer concentrations, customer creditworthiness, current economic trends and changes in customer payment patterns when evaluating the adequacy of the allowance for doubtful accounts. Changes in the overall economic environment or in the financial condition of our customers may require adjustments to the allowance for doubtful accounts which could have a material adverse effect on our consolidated financial position, results of operations and cash flows.
Allowance for Excess and Obsolete Inventory. We assess the valuation of our inventory and provide an allowance for the value of estimated excess and obsolete inventory. Our marketing department plays a key role in our inventory review process by providing updated sales forecasts, managing product rollovers and working with our manufacturing department to maximize recovery of excess inventory. Based upon management’s forecast, inventory items no longer expected to be used in the future are considered obsolete and the difference between an inventory’s quantity and its forecasted usage are classified as excess. If actual market conditions are less favorable than those projected by management, additional inventory allowances for excess or obsolete inventory may be required. (See Note 4 to the Consolidated Financial Statements — Inventories, net for additional information).
Uncertain Tax Positions. The recognition and measurement of uncertain tax positions that we have taken or expect to take is inherently difficult and requires subjective estimations. We reevaluate the uncertain tax positions each quarter based on factors including, but not limited to, changes in facts or circumstances, changes in tax law, effectively settled issues, and new audit activity. Such a change in recognition or measurement could result in the recognition of a tax benefit or an additional charge to the tax provision in the period. Although we believe the measurement of our liabilities for uncertain tax positions is reasonable, no assurance can be given that the final outcome of these matters will not be different than what is reflected in the historical income tax provisions and accruals. If additional taxes are assessed as a result of an audit or litigation, it could have a material effect on our income tax provision and net income in the period or periods for which that determination is made.
Beginning on July 1, 2007, we have applied a comprehensive model for how a company should recognize, measure, present, and disclose in its financial statements uncertain tax positions that the Company has taken or expects to take on a tax return. A tax benefit from an uncertain tax position may be recognized only if it is “more
36
Table of Contents
likely than not” that the position is sustainable, based on its technical merits. The tax benefit of a qualifying position is the largest amount of tax benefit greater than 50% likely of being realized upon settlement with a taxing authority having full knowledge of all relevant information. This measurement is inherently difficult and requires subjective estimations. A tax benefit from an uncertain position was previously recognized if it was probable of being sustained. Currently, the liability for unrecognized tax benefits is classified as non-current unless the liability is expected to be settled in cash within twelve months of the reporting date. (See Note 11 to the Consolidated Financial Statements — Income Taxes for additional information).
Valuation of Deferred Tax Assets. We must make certain estimates and judgments in determining income tax expense for financial statement purposes. These estimates and judgments occur in the calculation of tax credits, benefits and deductions, and in the calculation of certain tax assets and liabilities, including liabilities which arise from differences in the timing of recognition of revenue and expense for tax and financial statement purposes, as well as interest and penalties related to uncertain tax positions. Significant changes to these estimates may result in an increase or decrease to our tax provision in a subsequent period.
The Company is required to recognize a valuation allowance for all or a portion of its deferred tax assets if it believes that it is not more likely than not, given the weight of all available evidence, that all or a portion of its deferred tax assets will be realized. Management assesses the realizability of the deferred tax assets based on actual and forecasted operating results. The Company assessed both its positive and negative evidence to determine the proper amount of its required valuation allowance. Factors considered include the Company’s current and cumulative losses in certain jurisdictions and management’s projection that the Company expects to utilize its domestic net operating loss carryforwards well prior to the initial expiration in fiscal 2027.
In the assessment for a valuation allowance, appropriate consideration is given to all positive and negative evidence related to the realization of the deferred tax assets. This assessment considers, among other matters, the nature, frequency and severity of current and cumulative losses, forecasts of future profitability, excess of appreciated asset value over the basis of net assets, the duration of statutory carryforward periods, the Company’s experience with operating loss and tax credit carryforwards not expiring unused, and tax planning alternatives. The Company’s analysis of the need for a valuation allowance recognizes that the Company has incurred a cumulative loss for its domestic operations over the recent years, which was principally due to a non-recurring goodwill impairment charge in fiscal 2009, acquisition and business realignment charges and non-cash amortization of the Convertible notes. The Company believes it will be able to realize all of its domestic deferred tax assets, net of the $1.4 million valuation allowance. Consideration has also been given to the period over which these net deferred tax assets can be realized, and the Company’s history of not having federal tax loss carryforwards expire unused. In addition, the Company has considered tax planning strategies that are both prudent and feasible that will be implemented in a timely manner, if necessary, which will allow the Company to recognize the future tax attributes by increasing taxable income in the United States.
A valuation allowance of approximately $2.0 million and $1.9 million existed as of July 3, 2010 and June 27, 2009, respectively, for certain tax credit carryforwards, capital loss carryforwards and foreign deferred tax assets due to the uncertainty surrounding the utilization of these deferred tax assets. During the years ended July 3, 2010 and June 27, 2009, the valuation allowance increased by less than $0.1 million and approximately $0.2 million, respectively. The increases were mainly due to increases in foreign net operating loss carryforwards and uncertainty surrounding the utilization of such carryforwards. Management believes that it is more likely than not that the Company will realize the benefits of the Company’s net deductible temporary differences, net of the valuation allowance. The factors that management considered in assessing the likelihood of realization of the deferred tax assets included, the forecast of future taxable income, reversal of taxable temporary differences and available tax planning strategies that could be implemented to realize the deferred tax assets. Management will continue to assess the realizability of the deferred tax assets at each interim and annual balance sheet date based on actual and forecasted operating results. Adjustments to the valuation allowance may be made in the future if it is determined that the realizable amount of net operating losses and other deferred tax assets is greater or less than the amount recorded. Such adjustments may be material to the Company’s financial position, and results of operations.
37
Table of Contents
At July 3, 2010, the Company’s net U.S. domestic deferred tax assets amounted to approximately $10.6 million. Management has considered the realizability of the deferred tax assets and has concluded that a domestic valuation allowance of approximately $1.4 million should be recorded, mainly related to certain tax credit carryforwards that are not anticipated to be realized. Although management determined that a valuation allowance was not required with respect to the remaining net U.S. domestic deferred tax assets, realization of these assets is primarily dependent on achieving the forecast of future taxable income, as well as prudent and feasible tax planning strategies. At July 3, 2010, the Company requires approximately $38.0 million in cumulative domestic future operating income to be generated at various times in the future to realize the domestic net deferred tax assets. Based upon projections, the domestic net operating loss carryforwards and federal tax credit carryforwards would be fully utilized before the expiration. (See Note 11 to the Consolidated Financial Statements — Income Taxes for additional information).
Income Tax Rate and Geographical distribution of taxable income. We calculate income tax expense or benefit based upon an annual estimated effective tax rate that includes estimates and assumptions that may change. The differences between the annual estimated effective tax rate and the U.S. federal statutory rate principally result from the Company’s geographical distribution of taxable income and differences between the book and tax treatment of certain items. (See Note 11 to the Consolidated Financial Statements — Income Taxes for additional information).
Valuation of Long-Lived Asset and Goodwill. We assess the recoverability of our long-lived assets whenever events or changes in circumstances indicate that the carrying values may not be recoverable. When such events or changes in circumstances occur, we assess the recoverability of long-lived assets by determining whether the carrying values of such assets will be recovered through undiscounted expected future cash flows. If the undiscounted cash flows are less than the carrying amounts, an impairment loss is recorded to the extent that the carrying amounts exceed the fair value. Factors which could trigger an impairment review include, but are not limited to the following: significant underperformance by us relative to historical or projected operating results; significant changes in the manner of our use of the assets or the strategy for the overall business; and significant negative industry or economic trends.
Goodwill is to be tested for impairment annually, or more frequently, if events or changes in circumstances indicate that the carrying amount of the asset might be impaired. In fiscal 2008, the Company changed its annual impairment testing date from fiscal year end to the last day of the eleventh month of the fiscal year. Impairment is assessed at the “reporting unit” level by applying a fair value-based test. A reporting unit is defined as the same as or one level below the operating segment level. The Company has one reporting unit, in the Test and Measurement business, because none of the components of the Company constitute a business for which discrete financial information is available and for which Company management regularly reviews the results of operations.
The goodwill impairment test is a two-step process which requires management to make judgmental assumptions regarding fair value. Testing is required between annual tests if events occur or circumstances change that would, more likely than not, reduce the fair value of the reporting unit below its carrying value. Such an event may occur if, for an extended period of time, the market value of the Company’s common stock plus a control premium were less than the carrying value of the Company. The determination as to whether a write-down of goodwill is necessary, and the amount of the impairment charge, involves significant judgment around the assumptions used to determine the impairment charge. As a result of the decline in our stock price, we recorded a goodwill impairment charge of approximately $105.8 million in fiscal 2009, resulting in a carrying value as of June 27, 2009 of zero.
Warranty Liabilities. Provisions for estimated expenses related to product warranties are made at the time products are sold. These estimates are derived from historical data of product reliability and for certain new products, third party published expected failure rates. The expected failure is arrived at in terms of units, which are then converted into labor hours to which an average fully burdened cost per hour is applied to derive the amount of accrued warranty required. On a quarterly basis, we study trends of warranty claims, review estimates of costs to repair and take action to improve the quality of our products and minimize our warranty exposure. Management believes that the warranty reserve is appropriate; however, actual claims incurred could differ from the original estimates, requiring adjustments to the reserve, which may be material to our results of operations when made (See Note 10 to the Consolidated Financial Statements — Warranties and Guarantees for additional information).
38
Table of Contents
Share-based Compensation Expense. We recognize the cost resulting from all share-based payment transactions in the financial statements at their fair values. We use the Black-Scholes option pricing model to estimate the fair value of options and stock appreciation rights settled in cash. The fair value of stock options is estimated on the date of grant, while the fair value for stock appreciation rights is estimated on the date of grant and remeasured at each subsequent reporting period, since they are liability-classified. Determining the fair value of options and stock appreciation rights requires certain estimates by management including the expected volatility and expected term of the option. Management also makes decisions regarding the risk free interest rate used in the model and makes estimates regarding forfeiture rates. If our actual forfeiture rate is materially different from our estimate or if we reevaluate the forfeiture rate in the future, the share-based compensation expense could be significantly different from what was recorded in the current periods. Further, fluctuations in the market that affect these estimates could have an impact on the resulting compensation cost. (See Note 13 to the Consolidated Financial Statements — Share-Based Compensation for additional information).
Convertible Notes Allocation between Debt and Equity. On June 28, 2009, we adopted new accounting guidance which requires issuers of certain types of convertible notes to separately account for the liability and equity components of such convertible notes in a manner that reflects the entity’s nonconvertible debt borrowing rate when interest cost is recognized in subsequent periods. Prior to adoption, the liability of the Convertible notes was carried at its principal value and only the contractual interest expense was recognized in our financial statements. Because the new guidance requires retrospective application, LeCroy was required to adjust all periods for which the Convertible notes were outstanding prior to the date of adoption.
Upon adoption and effective as of the issuance date of the Convertible notes, LeCroy recorded approximately $17.9 million of the principal amount to equity, representing a debt discount for the difference between LeCroy’s estimated nonconvertible debt borrowing rate of 10.5% at the time and the 4.0% coupon rate of the Convertible notes. This debt discount is amortized as interest expense over the contractual term of the notes using the effective interest method. Upon convertible note repurchase, the fair value of the liability component immediately prior to extinguishment was measured first and the difference between the fair value of the aggregate consideration paid and the fair value of the liability component was attributed to the reacquisition of the equity component. (See Note 12 to the Consolidated Financial Statements — Debt and Capital Leases for additional information).
39
Table of Contents
Results of Operations
The following table sets forth certain operating data as a percentage of our total revenues for the fiscal years indicated:
| Year Ended | |||||||||
| July 3, 2010 (53 weeks) |
June 27, 2009 (As Adjusted) (52 weeks)(1) |
June 28, 2008 (As Adjusted) (52 weeks)(1) |
|||||||
| Revenues: |
|||||||||
| Test and measurement products |
92.5 | % | 93.6 | % | 94.1 | % | |||
| Service and other |
7.5 | 6.4 | 5.9 | ||||||
| Total revenues |
100.0 | 100.0 | 100.0 | ||||||
| Cost of revenues |
41.3 | 47.5 | 44.1 | ||||||
| Gross profit |
58.7 | 52.5 | 55.9 | ||||||
| Operating expenses: |
|||||||||
| Selling, general and administrative |
32.8 | 35.1 | 31.9 | ||||||
| Research and development |
21.6 | 23.0 | 20.3 | ||||||
| Reimbursement from escrow account |
— | — | (0.1 | ) | |||||
| Impairment of goodwill |
— | 78.9 | — | ||||||
| Total operating expenses |
54.4 | 137.0 | 52.1 | ||||||
| Operating income (loss) |
4.3 | (84.5 | ) | 3.8 | |||||
| Other income (expense): |
|||||||||
| Gain on extinguishment of convertible debt, net of issue cost write-off |
0.6 | 7.1 | 0.2 | ||||||
| Interest income |
— | 0.1 | 0.2 | ||||||
| Interest expense |
(2.4 | ) | (2.6 | ) | (2.6 | ) | |||
| Amortization of debt discount on convertible notes |
(1.8 | ) | (2.1 | ) | (1.9 | ) | |||
| Other, net |
(0.3 | ) | 0.2 | (0.4 | ) | ||||
| Other (expense) income, net |
(3.9 | ) | 2.7 | (4.5 | ) | ||||
| Income (loss) before income taxes |
0.4 | (81.8 | ) | (0.7 | ) | ||||
| Provision (benefit) for income taxes |
0.6 | (0.9 | ) | (0.6 | ) | ||||
| Net loss |
(0.2 | )% | (80.9 | )% | (0.1 | )% | |||
| (1) | Adjustments have been made to prior years’ amounts to reflect the retrospective adoption of the Financial Accounting Standards Board (“FASB”) staff position related to the accounting for convertible debt instruments that may be settled in cash upon conversion (including partial cash settlement), which was adopted by the Company on June 28, 2009. |
40
Table of Contents
Business Realignment, Restructuring Initiatives and Related Asset Impairments
The table below summarizes the charges for business realignment, restructuring initiatives and related asset impairments for the fiscal years ended 2010, 2009 and 2008 (See Note 2 to the Consolidated Financial Statements — Business Realignment, Restructuring Initiatives and Related Asset Impairments for additional information).
(in thousands):
| Years Ended | |||||||||
| July 3, 2010 (53 weeks) |
June 27, 2009 (52 weeks) |
June 28, 2008 (52 weeks) | |||||||
| Charges for: |
|||||||||
| Severance and related costs |
$ | — | $ | 695 | $ | — | |||
| Cost of revenue total |
$ | — | $ | 695 | $ | — | |||
| Charges for: |
|||||||||
| Severance and related costs |
$ | — | $ | 1,563 | $ | — | |||
| Research and development total |
$ | — | $ | 1,563 | $ | — | |||
| Charges for: |
|||||||||
| Impaired intangible asset |
$ | — | $ | — | $ | 699 | |||
| Severance and related costs |
414 | 2,079 | 954 | ||||||
| Facility closure/lease restructure |
— | 749 | — | ||||||
| Selling, general and administrative total |
$ | 414 | $ | 2,828 | $ | 1,653 | |||
Comparison of Fiscal Years 2010 and 2009
Total revenues were approximately $129.3 million for the year ended July 3, 2010, compared to approximately $134.0 million in the prior year, representing a decrease of 3.5%, or approximately $4.6 million, primarily as a result of a decline in sales of Test and measurement products, driven by the worldwide economic downturn. In fiscal 2010, positive foreign currency fluctuations impacted revenue by approximately $0.8 million and an additional week of sales was included due to the 53rd week. Our year to date sales were impacted by our customers reducing staff levels and therefore their need for capital equipment, as well as postponing and reducing spending, a trend that began to reverse itself in the second half of the fiscal year.
Service and other revenues consist primarily of service revenues and maintenance fees. Service and other revenues were approximately $9.7 million for the year ended July 3, 2010, representing an increase of 14.0% or approximately $1.2 million, as compared to approximately $8.5 million for the prior year. The increase was primarily the result of revenue earned from a research and development arrangement in the amount of $1.0 million, along with positive foreign currency impact, slightly offset by a decline in customer upgrade purchases attributable to the economic downturn.
Our geographic breakdown of revenues by area in total dollars and as a percentage of total revenues is as follows (dollars in thousands):
| July 3, 2010 (53 weeks) |
July 3, 2010 percentage |
June 27, 2009 (52 weeks) |
June 27, 2009 percentage |
|||||||||
| Americas |
$ | 46,091 | 35.6 | % | $ | 39,911 | 29.8 | % | ||||
| Europe/Middle East |
44,083 | 34.1 | 54,193 | 40.5 | ||||||||
| Asia/Pacific |
39,162 | 30.3 | 39,863 | 29.7 | ||||||||
| Total revenues |
$ | 129,336 | 100.0 | % | $ | 133,967 | 100.0 | % | ||||
41
Table of Contents
For the year end July 3, 2010, revenues were higher in terms of dollars and percentages in the Americas due to strong sales of our high bandwidth oscilloscopes. Revenues were lower in terms of dollars in Europe/Middle East and Asia/Pacific, due to the worldwide economic downturn and timing of shipments, despite positive foreign currency impact. The losses in these geographic locations more than offset the gains in the Americas.
Gross profit for the year ended July 3, 2010 was approximately $75.9 million, or 58.7% gross margin, compared to $70.4 million, or 52.5% gross margin, for the same period last year. The gross margin in fiscal 2010 was positively impacted by revenue earned from a research and development arrangement in the amount of $1.0 million which was entered into in the first quarter of the fiscal year, slightly offset by an increase in share-based compensation expense of approximately $0.1 million. Share-based compensation expense was approximately $0.2 million and $0.1 million for the year ended July 3, 2010 and June 27, 2009, respectively. The lower gross margin in fiscal 2009 was negatively impacted by a decreased demand for our Test and measurement products, and greater discounting practices necessary to drive sales in an economic downturn, partially offset by increased sales of our higher end products which slightly improved margins. Also contributing to the lower gross margins in fiscal 2009 was $5.8 million of costs associated with an inventory write-down, as a result of a change in our product strategy due to deteriorating market conditions and approximately $0.7 million in severance costs, as a result of our realignment initiatives.
Selling, general and administrative (“SG&A”) expense was approximately $42.3 million in fiscal 2010 compared to approximately $47.0 million in fiscal 2009, representing a decrease of 10.1% or approximately $4.7 million. The decrease was primarily attributable to our extensive cost-reduction program that began in the second quarter of fiscal 2009, along with a decrease in business realignment and restructuring charges of approximately $2.4 million, partially offset by an increase in share-based compensation expense of approximately $1.3 million, as a result of the increase in fair value of the stock appreciation rights (SARs), an additional week of compensation expense and other expenses, as the current fiscal year period represented a 53-week period versus a 52-week period in fiscal 2009. As a percentage of revenue, SG&A expense decreased from 35.1% in fiscal 2009 to 32.8% in fiscal 2010.
Research and development (“R&D”) expense was approximately $28.0 million in fiscal 2010 compared to approximately $30.9 million in fiscal 2009, a decrease of 9.3% or approximately $2.9 million. The decrease was primarily attributable to our extensive cost-reduction program that began in the second quarter of fiscal 2009, along with no business realignment charges in fiscal 2010 as compared to approximately $1.6 million of charges in fiscal 2009, partially offset by an increase in share-based compensation expense of approximately $0.2 million and an additional week of compensation expense and other expenses in fiscal 2010 versus fiscal 2009. As a percentage of revenue, R&D expense decreased from 23.0% in fiscal 2009 to 21.6% in fiscal 2010.
Other (expense) income, net, which consists primarily of: gains on the extinguishment of our convertible debt, net of issue cost write-off, interest income and expense, foreign exchange gains and losses and amortization of debt discount on Convertible notes was an expense of approximately $5.0 million in fiscal 2010 compared to income of approximately $3.7 million in fiscal 2009. Net interest expense was approximately $3.1 million in fiscal 2010 as compared to approximately $3.4 million for the comparable prior period. In addition, there was a net loss of approximately $0.5 million for fiscal 2010 as compared to a net gain of approximately $0.3 million in the prior fiscal year, resulting from the changes in our foreign exchange forward contracts and on transactions denominated in other than our functional currencies.
Fiscal 2010 also included a gain on the extinguishment of convertible debt, net of issue cost write-off of approximately $0.8 million, as we repurchased $8.7 million of principal of our outstanding Convertible notes in fiscal 2010 as compared to a net gain of approximately $9.6 million when we repurchased $19.1 million of principal of our notes during the prior fiscal year. Due to the adoption of new accounting guidance related to our Convertible notes, we recorded approximately $2.3 million of non-cash amortization expense on a year to date basis in fiscal 2010 as compared to approximately $2.9 million of non-cash amortization expense in prior fiscal year. The decrease is due to the impact of convertible note repurchases more than offsetting the accretion of the debt discount. (See Note 12 to the Consolidated Financial Statements — Debt and Capital Leases for additional information).
42
Table of Contents
The effective tax rate for fiscal 2010 was 146.5%, compared to an effective tax rate of 1.1% for fiscal 2009. The effective tax rate for fiscal 2010 is significantly higher due to the relatively low pre-tax income and the higher proportional impact of permanent differences between book and taxable income and state income taxes, as well as the write-off of a tax credit. In addition, the fiscal 2010 tax rate includes a decrease in tax expense of approximately $0.5 million from the recognition of unrecognized tax benefits due to the expiration of the statute of limitations, offset by an increase in tax expense of approximately $0.5 million for the write-down of the deferred tax asset related to equity-based compensation that resulted in a shortfall of cumulative tax benefits. The effective tax rate for fiscal 2009 includes: a reduction of the tax benefit of approximately $35.4 million related to the impairment of goodwill that is not amortizable for tax purposes; an increase in the tax benefit of approximately $0.2 million resulting from the true-up of the prior year’s tax accrual upon filing the actual tax returns related to research and development tax credits; an increase in the tax benefit of approximately $0.3 million from the recognition of unrecognized tax benefits due to the expiration of the statute of limitations; and a reduction of the tax benefit of approximately $0.7 million for the write-down of the deferred tax asset related to restricted stock grants that resulted in a shortfall of cumulative tax benefits. The Company calculates income tax expense (benefit) based upon an annual estimated effective tax rate that includes estimates and assumptions that may change. The differences between the annual estimated effective tax rate and the U.S. federal statutory rate of 35% principally result from the Company’s geographical distribution of taxable income, and differences between the book and tax treatment of certain items.
Comparison of Fiscal Years 2009 and 2008
Total revenues were approximately $134.0 million for the year ended June 27, 2009, compared to approximately $160.5 million in the prior year, representing a decrease of 16.5%, or approximately $26.5 million, primarily as a result of a measurable decline in sales of Test and measurement products driven by the worldwide economic downturn, as well as negative foreign currency impact. Foreign currency fluctuations decreased total revenues by approximately $3.3 million in fiscal 2009, as compared to fiscal 2008. Our sales were impacted by our customers reducing staffing levels and therefore their need for capital equipment, as well as postponing spending, mostly for our mid-range oscilloscopes and protocol analyzers.
Service and other revenues primarily consist of service revenues and maintenance fees. Service and other revenues were approximately $8.5 million for the year ended June 27, 2009, representing a decrease of 9.5% or approximately $0.9 million, as compared to approximately $9.4 million for the prior year. The decrease was primarily the result of a decline in upgrade purchases furthered by the economic downturn, as customers delayed or cancelled servicing of their products, as well as negative foreign currency impact.
Our geographic breakdown of revenues by area in total dollars and as a percentage of total revenues is as follows (dollars in thousands):
| June 27, 2009 |
June 27, 2009 percentage |
June 28, 2008 |
June 28, 2008 percentage |
|||||||||
| Americas |
$ | 39,911 | 29.8 | % | $ | 52,883 | 33.0 | % | ||||
| Europe/Middle East |
54,193 | 40.5 | 57,982 | 36.1 | ||||||||
| Asia/Pacific |
39,863 | 29.7 | 49,621 | 30.9 | ||||||||
| Total revenues |
$ | 133,967 | 100.0 | % | $ | 160,486 | 100.0 | % | ||||
For the year end June 27, 2009, the geographic revenues in terms of dollars were lower in all regions due to the worldwide economic downturn and negative foreign currency impact.
Gross profit for the year ended June 27, 2009 was approximately $70.4 million, or 52.5% gross margin, compared to $89.7 million, or 55.9% gross margin, for the same period last year. The lower gross margin in fiscal 2009 was primarily attributable to decreased demand for our Test and measurement products, and greater discounting practices necessary to drive sales in an economic downturn, partially offset by increased sales of our higher end products which slightly improved margins. Also contributing to the lower gross margins in fiscal 2009
43
Table of Contents
was $5.8 million of costs associated with an inventory write-down, as a result of a change in our product strategy due to deteriorating market conditions and approximately $0.7 million in severance costs, as a result of our realignment initiatives. The gross margin in fiscal 2008 included approximately $3.2 million for inventory write-downs. Absent these charges in both years, fiscal 2009 margins as a percentage of sales were 57.4%, as compared to 57.9% for fiscal 2008.
Selling, general and administrative (“SG&A”) expense was approximately $47.0 million in fiscal 2009 compared to approximately $51.3 million in fiscal 2008, representing a decrease of 8.4% or approximately $4.3 million. The decrease was primarily attributable to our extensive cost-reduction program that began in the second quarter of fiscal 2009 which included reductions in workforce, compensation and other employee benefits. Also contributing to the decrease was a reduction in our share-based compensation expense of approximately $1.5 million, as a result of the reduction in fair value of the stock appreciation rights (SARs). These cost reductions more than offset approximately $2.8 million of business realignment and restructuring costs in the current year for severance and lease charges. In fiscal 2008, the Catalyst trade name failed the intangible asset impairment test due to a change in our product strategy, and accordingly we took a non-cash charge of approximately $0.7 million. Additionally, there was approximately $1.0 million of business realignment charges in the prior year. As a percentage of revenue, SG&A expense increased from 31.9% in fiscal 2008 to 35.1% in fiscal 2009, primarily as a result of a lower sales base.
Research and development (“R&D”) expense was approximately $30.9 million in fiscal 2009 compared to approximately $32.6 million in fiscal 2008, a decrease of 5.3% or approximately $1.7 million. The decrease was primarily attributable to our extensive cost-reduction program that began in the second quarter of fiscal 2009, partially offset by approximately $1.6 million of business realignment charges. As a percentage of total revenues, R&D expense increased from 20.3% in fiscal 2008 to 23.0% in fiscal 2009, primarily as a result of a lower sales base in fiscal 2009.
Impairment of goodwill was approximately $105.8 million in fiscal 2009, representing the write-off of our goodwill balance associated with our Catalyst and CATC acquisitions. This resulted from the sustained decline in our stock price, which affected our market capitalization and reduced the fair value of our reporting unit below its carrying amount. As of June 27, 2009, no goodwill remains on our Consolidated Balance Sheet.
Other income (expense), net, consists primarily of: a gain on the extinguishment of our convertible debt, net of issue cost write-off, interest income and expense, foreign exchange gains and losses and the amortization of debt discount on Convertible notes. In fiscal 2009, there was a total net gain of approximately $3.7 million, compared to a total net loss of approximately $7.3 million in fiscal 2008. In 2009, we recognized a gain on the extinguishment of convertible debt, net of issue cost write-offs, of approximately $9.6 million, resulting from the repurchase of approximately $19.1 million of principal of Convertible notes, compared to a gain of approximately $0.3 million in fiscal 2008 from the repurchase of $4.5 million of principal of Convertible notes. Net interest expense, which decreased in fiscal 2009 as a result of our purchases of Convertible notes at a discount, was approximately $3.4 million and $3.8 million in fiscal 2009 and 2008, respectively. Additionally, we recorded net foreign exchange gains of approximately $0.3 million in fiscal 2009 compared to a net loss of approximately $0.6 million in the prior year, resulting from the changes in our foreign exchange forward contracts and on transactions denominated in other than our functional currencies.
Due to the adoption of new accounting guidance related to our Convertible notes, we recorded approximately $2.9 million of non-cash amortization expense in fiscal 2009 compared to approximately $3.1 million of non-cash amortization expense in fiscal 2008. The decrease is due to the impact of convertible note repurchases more than offsetting the accretion of the debt discount. (See Note 12 to the Consolidated Financial Statements — Debt and Capital Leases for additional information).
The effective tax rate for fiscal 2009 was 1.1%, compared to an effective tax rate of 84.9% for fiscal 2008. The effective tax rate for fiscal 2009 includes: a reduction of the tax benefit of approximately $35.4 million related to the impairment of goodwill that is not amortizable for tax purposes; an increase in the tax benefit of approximately $0.2 million resulting from the true-up of the prior year’s tax accrual upon filing the actual tax returns related to research
44
Table of Contents
and development tax credits; an increase in the tax benefit of approximately $0.3 million from the recognition of unrecognized tax benefits due to the expiration of the statute of limitations; and a reduction of the tax benefit of approximately $0.7 million for the write-down of the deferred tax asset related to restricted stock grants that resulted in a shortfall of cumulative tax benefits.
The effective tax rate for fiscal 2008 includes: the effect of a reduction of tax expense of approximately $0.5 million resulting from both the final true-up of the prior year’s tax accrual upon filing the actual tax returns and an election for certain R&D credits made by the Company in the second quarter of fiscal 2008; a reduction of tax expense of approximately $0.4 million from the recognition of unrecognized tax benefits due to the expiration of the statute of limitations; and an increase in tax expense of approximately $0.6 million for the write-down of the deferred tax asset related to restricted stock grants that resulted in a shortfall of cumulative tax benefits; all of which were treated as discrete items. The Company calculates income tax expense (benefit) based upon an annual estimated effective tax rate that includes estimates and assumptions that may change. The differences between the annual estimated effective tax rate and the U.S. federal statutory rate of 34% principally result from the Company’s geographical distribution of taxable income, and differences between the book and tax treatment of certain items.
Liquidity and Capital Resources
Cash and cash equivalents at July 3, 2010 were approximately $7.8 million, compared to approximately $6.4 million at June 27, 2009.
We have $17.0 million in borrowings outstanding under the existing credit facility and approximately $39.7 million principal outstanding under the Convertible notes at July 3, 2010. The Notes mature on October 15, 2026 unless earlier redeemed, repurchased or converted. Holders of the Notes will have the right to require us to repurchase for cash all or a portion of their Notes on October 15, 2011, at a repurchase price equal to 100% of the principal plus accrued and unpaid interest, if any.
We believe that our cash and cash equivalents on hand, cash flow expected to be generated by our operations and availability under our revolving credit line will be sufficient to fund our operations, working capital and capital expenditure requirements for the foreseeable future, as well as repurchase or retire our Notes.
On July 29, 2010, we reached an agreement with our lending partners, M&T Bank, RBS Citizens Bank and Capital One, to amend and extend our $50 million revolving line of credit through January 2014 (the “New Credit Agreement”). We believe the amendment and extension of our credit facility will provide long-term liquidity and position us to augment our internal cash generation capabilities. The repurchase or retirement of the Convertible notes will be done through a combination of cash generated from operations, working capital and the new secured bank debt, subject to maximum debt and other financial covenants, and may also include possible future financing sources such as: (i) the sale or monetization of certain assets; (ii) new unsecured debt or amendment to existing debt; and (iii) issuance of equity and/or equity-like securities.
Major factors that could adversely impact our forecasted operating cash flows and our financial condition are described in Part I, Item 1A. Risk Factors. In addition, our liquidity and financial condition will continue to be affected by changes in prevailing interest rates on the portion of debt that bears interest at variable interest rates. (See Note 12 to the Consolidated Financial Statements — Debt and Capital Leases and Note 23 to the Consolidated Financial Statements — Subsequent Events for additional information).
Operating Activities
Net cash provided by operating activities was approximately $12.1 million for the year ended July 3, 2010 compared to net cash used in operating activities of approximately $7.7 million for the year ended June 27, 2009. The net cash provided by operating activities in fiscal 2010 was attributable to a net loss of approximately $0.3 million, non-cash gain on the extinguishment of convertible debt, net of issue cost write-off of approximately $0.8 million and working capital and other requirements of approximately $0.5 million, more than offset by non-cash depreciation and amortization of approximately $5.3 million, share-based compensation expense of approximately
45
Table of Contents
$4.4 million, debt related amortization of approximately $2.8 million and deferred income taxes of approximately $1.2 million. The approximate $19.9 million increase from the prior year is primarily attributable to improvements in working capital and other consumption of approximately $7.1 million and a lower net loss, adjusted for gains on the extinguishment of Convertible notes, net of issue cost write-offs and impairment of goodwill .
Investing Activities
Net cash used in investing activities was approximately $1.8 million in fiscal 2010 compared to approximately $4.4 million in fiscal 2009. Net cash used in both fiscal years relates to the purchase of property, plant and equipment. The decrease was due to less discretionary capital spending under our cost-reduction program. Although the covenants under our credit agreement limit the amount of our capital expenditures on an annual basis, we believe that we have sufficient capacity under those covenants to fund planned expenditures.
Financing Activities
Net cash used in financing activities was approximately $8.7 million in fiscal 2010 compared to net cash provided by financing activities of approximately $8.9 million in fiscal 2009. Net cash used in financing activities in fiscal 2010 was primarily due to the repurchase of Convertible notes of approximately $8.6 million, cash payments for principal. Net cash provided by financing activities in fiscal 2009 primarily resulted from $17.5 million in net borrowings under the credit line, partially offset by approximately $8.4 million repurchase of Convertible notes.
Debt
Credit Facility
As of July 3, 2010, we had a $50.0 million credit agreement (the “Prior Credit Agreement”), which was amended from time to time. The terms of the Prior Credit Agreement provided us with a $50.0 million revolving credit facility (“Revolver”), which included a $5.0 million swingline loan subfacility and a $5.0 million letter of credit subfacility. The performance of our obligations under the Prior Credit Agreement was secured by all of the domestic assets of LeCroy Corporation and its domestic subsidiaries, and was guaranteed by our domestic subsidiaries. As of July 3, 2010, we had $17.0 million in outstanding borrowings against the Revolver and zero against the letter of credit subfacility and the swingline loan subfacility.
We were required to comply with certain financial covenants, measured quarterly, including a minimum interest coverage ratio, minimum total net worth, maximum leverage ratio, minimum fixed charge coverage ratio and limitations on capital expenditures. As of July 3, 2010, we were in compliance with financial covenants under the Prior Credit Agreement.
On July 29, 2010, we reached an agreement with our lending partners, M&T Bank, RBS Citizens Bank and Capital One, to amend and extend our $50 million revolving line of credit through January 2014 (the “New Credit Agreement”). (See Note 12 to the Consolidated Financial Statements — Debt and Capital Leases and Note 23 to the Consolidated Financial Statements — Subsequent Events for additional information on the Amended and Restated Credit Agreement).
Convertible Debt
On October 12, 2006, we sold and issued $72.0 million in convertible senior subordinated notes to qualified institutional buyers pursuant to Rule 144A of the Securities Act of 1933, as amended (the “Notes”). The Notes bear interest at a rate of 4.00% per annum, payable in cash semi-annually in arrears on each April 15 and October 15, beginning April 15, 2007. The Notes are direct, unsecured, senior subordinated obligations and rank: (i) subordinate in right of payment to all of our existing and future secured indebtedness; (ii) equal in right of payment with all of our existing and future senior unsecured indebtedness, and (iii) senior in right of payment to all of our existing and future subordinated indebtedness, except that the Notes rank equally with the $3.5 million note issued in connection with the Catalyst acquisition, which is subordinated to our credit facility. The $3.5 million note was fully repaid in
46
Table of Contents
fiscal 2008. In connection with the issuance and sale of the Notes, we entered into an indenture dated as of October 12, 2006, with U.S. Bank National Association as trustee. The terms of the Notes are governed by the indenture.
The Notes mature on October 15, 2026 unless earlier redeemed, repurchased or converted. Holders of the Notes will have the right to require us to repurchase for cash all or a portion of their Notes on each of October 15, 2011, October 15, 2016 and October 15, 2021, at a repurchase price equal to 100% of the principal amount of the Notes to be repurchased plus accrued and unpaid interest, if any, up to but not including, the repurchase date. We may, from time to time, at our option repurchase the Notes in the open market. In addition, we may redeem the Notes for cash, either in whole or in part, anytime after October 20, 2011 at a redemption price equal to 100% of the principal amount of the Notes to be redeemed plus accrued and unpaid interest, if any, up to but not including the redemption date. The Notes are convertible into our common stock by the holders at an initial conversion rate equal to 68.7285 shares per $1,000 principal amount of the Notes, equal to an initial conversion price of approximately $14.55 per share, subject to adjustment as described in the indenture. Upon conversion, we will deliver for each $1,000 principal amount of Notes, an amount consisting of cash equal to the lesser of $1,000 and the conversion value as defined in the indenture, and to the extent that the conversion value exceeds $1,000, at our election, cash or shares of our common stock in respect of the remainder. Prior to September 15, 2026, holders may convert their notes into cash and shares of our common stock, if any, at the applicable conversion rate, at their option, only under limited circumstances described in the indenture. On or after September 15, 2026, holders may convert their notes into cash and shares of our common stock, if any, at the applicable conversion price, at our option, at any time prior to the close of business on the business day immediately preceding the maturity date. Upon conversion of each $1,000 principal amount of the notes, the holder will receive an amount in cash equal to the lesser of (i) $1,000 or (ii) the conversion value, as described in the indenture; if the conversion value exceeds $1,000 on the conversion date, we will also deliver, at our election, cash or common stock or combination of each with a value equal to such excess.
In fiscal 2010 and 2009, we repurchased approximately $8.7 million and $19.1 million of principal, respectively, of the outstanding Convertible notes (See Note 12 to the Consolidated Financial Statements — Debt and Capital Leases for additional information).
Foreign Credit Facilities
We maintain certain short-term foreign credit facilities. Our Swiss subsidiary has an overdraft facility totaling 1.0 million Swiss francs, or approximately $0.9 million as of July 3, 2010. As of July 3, 2010, approximately 0.4 million Swiss francs were held against supplier obligations leaving an available balance of 0.6 million Swiss francs under this credit facility. These obligations to Swiss suppliers, such as rent and utilities, are payable under the credit facility only in the event that the subsidiary is unable to meet its financial obligations to those suppliers. We had a 50.0 million yen Japanese facility that was cancelled in the third quarter of fiscal 2009.
Share Purchase Plan
On May 25, 2006, our Board of Directors approved the adoption of a share repurchase plan authorizing the purchase of up to 2.0 million shares, not to exceed $25.0 million, of our common stock for treasury. Purchases under this buyback program may be made from time to time on the open market and in privately negotiated transactions, including pursuant to the terms of a 10b5-1 plan. A 10b5-1 plan allows a company to purchase shares during a blackout period, provided the company communicates its share purchase instructions to the broker prior to the blackout period, pursuant to a written plan that may not be changed. The timing of these purchases is dependent upon several factors, including market conditions, the market price of our common stock, the effect of the share dilution on earnings, available cash and any other potential risks we may encounter. The share repurchase plan may be discontinued at any time at the discretion of the Company. In fiscal 2010, we retired the remaining balance of treasury stock related to prior period repurchases. (See Note 14 to the Consolidated Financial Statements — Common Stock and Treasury Stock for additional information).
47
Table of Contents
Off-Balance Sheet Arrangements
It is not our business practice to enter into off-balance sheet arrangements. We do not enter into off-balance sheet transactions specifically structured to provide income or tax benefits or to avoid recognizing or disclosing assets or liabilities.
Our 4.00% notes payable are convertible into shares of our common stock at a conversion price of $14.55 per share and therefore pose a potential for significant dilution. The maximum potential dilutive effect of conversion of the 4.00% notes is approximately 2.7 million shares (See Note 12 to the Consolidated Financial Statements — Debt and Capital Leases for additional information).
In addition, stock options to purchase approximately 2.3 million shares of our common stock at a weighted average exercise price of $6.89 per share and approximately 0.1 million restricted stock units were outstanding at July 3, 2010 that represent additional potential dilution (See Note 13 to the Consolidated Financial Statements — Share-Based Compensation for additional information).
Contractual Obligations and Other Commitments
Our contractual obligations and commitments include obligations associated with our employee severance agreements, supplier agreements, operating and capital leases, revolving credit and convertible note obligations, as set forth in the table below (in thousands):
| Payments due by period as of July 3, 2010 | |||||||||||||||
| Total | Less than 1 Year |
1-3 Years | 3-5 Years | More than 5 Years | |||||||||||
| Severance |
$ | 380 | $ | 303 | $ | 77 | $ | — | $ | — | |||||
| Supplier agreements |
1,712 | 1,712 | — | — | — | ||||||||||
| Operating lease obligations |
4,870 | 2,064 | 2,272 | 534 | — | ||||||||||
| Vendor supplied capital lease agreement |
66 | 66 | — | — | — | ||||||||||
| Revolving credit obligation(1) |
17,000 | — | 17,000 | — | — | ||||||||||
| Convertible notes principal amount(2) |
39,650 | — | 39,650 | — | — | ||||||||||
| Convertible notes, contractual interest(2) |
2,379 | 1,586 | 793 | — | — | ||||||||||
| Total(3) |
$ | 66,057 | $ | 5,731 | $ | 59,792 | $ | 534 | $ | — | |||||
| (1) | The revolving credit facility expires on July 15, 2011, unless, in the absence of any default, extended by the Company to April 15, 2012, contingent on the waiver or extension of the first redemption date of the Company’s Convertible notes. On July 29, 2010, we reached an agreement with our lending partners to amend and extend our $50 million revolving line of credit through January 2014, which is subject to new financial covenants. (See Note 12 to the Consolidated Financial Statements — Debt and Capital Leases and Note 23 to the Consolidated Financial Statements — Subsequent Events for additional information). |
| (2) | The Convertible notes mature on October 15, 2026. Holders of the Convertible notes have the right to require the Company to purchase all or a portion of the Convertible notes on October 15, 2011, which is reflected above. The Convertible notes bear interest at a rate of 4.00% per annum, payable in cash semi-annually in arrears on each April 15 and October 15. The contractual interest assumes the Convertible notes principal amount remains unchanged. (See Note 12 to the Consolidated Financial Statements — Debt and Capital Leases for additional information). |
| (3) | The Contractual Obligations and Other Commitments does not include any reserves for income taxes because we are unable to reasonably predict the ultimate amount or timing of settlement of our reserves. (See Note 11 to the Consolidated Financial Statements — Income Taxes for additional information). |
48
Table of Contents
Recent Accounting Pronouncements
The following recent accounting pronouncements are not yet adopted:
In October 2009, the FASB issued amendments to the accounting and disclosure for revenue recognition. These amendments, effective for fiscal years beginning on or after June 15, 2010, modify the criteria for recognizing revenue in multiple element arrangements and the scope of what constitutes a non-software deliverable. We will apply the new revenue recognition guidance in our first quarter of fiscal 2011 and believe its adoption will not have a material impact on the Company’s consolidated financial position or results of operations, but may require enhanced disclosures. (See Note 1 to the Consolidated Financial Statements — Summary of Significant Accounting Policies for additional information).
Forward-Looking Information
This Form 10-K contains forward-looking statements. When used in this Form 10-K, the words “anticipate,” “believe,” “estimate,” “will,” “plan,” “intend,” and “expect” and similar expressions identify forward-looking statements. Although we believe that our plans, intentions, and expectations reflected in any forward-looking statements are reasonable, these plans, intentions, or expectations may not be achieved. Our actual results, performance, or achievements could differ materially from those contemplated, expressed, or implied, by the forward-looking statements contained in this Form 10-K. Important factors that could cause actual results to differ materially from our forward-looking statements are set forth in this Form 10-K, including those under the heading “Risk Factors.” All forward-looking statements attributable to us or persons acting on our behalf are expressly qualified in their entirety by the cautionary statements set forth in this Form 10-K. Except as required by federal securities laws, we are under no obligation to update any forward-looking statement, whether as a result of new information, future events, or otherwise.
49
Table of Contents
| ITEM 7A. | QUANTITATIVE AND QUALITATIVE DISCLOSURE ABOUT MARKET RISK |
We purchase materials from suppliers and sell our products around the world and maintain investments in foreign subsidiaries, all denominated in a variety of currencies. As a consequence, we are exposed to risks from fluctuations in foreign currency exchange rates with respect to a number of currencies, changes in government policies and legal and regulatory requirements, and political instability. Among the more significant potential risks to us of relative fluctuations in foreign currency exchange rates is the relationship among and between the U.S. dollar, Euro, Swiss franc, British pound, Swedish krona, Japanese yen, Korean won and Singapore dollar.
Our operations generate non-functional currency cash flows such as third-party vendor payments, revenues and intercompany payments. In anticipation of these foreign currency cash flows, we have a program of entering into foreign exchange forward contracts to decrease the risks associated with currency fluctuations on assets or liabilities denominated in other than the functional currency of us or our subsidiaries. It cannot be assured, however, that this program will effectively offset all of our foreign currency risk related to these assets or liabilities. These foreign exchange forward contracts do not qualify for hedge accounting.
Other than this program, we do not attempt to reduce our foreign currency exchange risks by entering into foreign currency management programs. As a consequence, there can be no assurance that fluctuations in foreign currency exchange rates in the future resulting in mismatches between local currency revenues and expenses, the translation of foreign currencies into the U.S. dollar, our financial reporting currency, or otherwise, will not adversely affect our results of operations. Moreover, fluctuations in exchange rates could affect the demand for our products.
During fiscal 2010, 2009, and 2008, foreign currency exchange gains and losses on both forward contracts and on transactions denominated in other than the subsidiaries’ functional currencies was a net loss of approximately $0.5 million, a net gain of approximately $0.3 million and a net loss of approximately $0.6 million, respectively. These net gains and losses are included in Other, net in the Consolidated Statements of Operations. At July 3, 2010 and June 27, 2009, the notional amounts of the Company’s open foreign exchange forward contracts, all with maturities of less than six months, were approximately $19.5 million and $17.5 million, respectively, with a net unrealized loss of approximately $0.1 million and a net unrealized gain of approximately $0.1 million, respectively. (See Note 21 to the Consolidated Financial Statements — Derivative Instruments and Fair Value for additional information).
We performed a sensitivity analysis at July 3, 2010, assuming a hypothetical 10% adverse change in foreign currency exchange rates on our open foreign exchange forward contracts and our assets and liabilities denominated in other than their functional currencies. A 10% adverse change in foreign currency exchange rates would have no material impact on our consolidated results of operations, financial position and cash flows from operations.
On October 15, 2006, we completed the sale of $72.0 million of 4.00% convertible senior notes (the “Notes”) due October 15, 2026. The Notes will pay interest semiannually through maturity and will be convertible at an initial conversion rate of 68.7285 shares of common stock per $1,000 principal amount of Notes, which is equivalent to a conversion price of approximately $14.55 per share of our common stock. The conversion rate will be subject to adjustment upon the occurrence of specified events. Upon conversion of the Notes, holders will receive cash up to the principal amount of each note, and any excess conversion value will be delivered in cash or shares of our common stock, at our option. During fiscal 2010 and 2009, we repurchased approximately $8.7 million and $19.1 million of principal, respectively, of the outstanding Convertible notes, resulting in a balance of approximately $39.7 million and $48.4 million at July 3, 2010 and June 27, 2009, respectively. As of July 3, 2010 and June 27, 2009, the market value of the Convertible notes was approximately $37.5 million and $27.7 million, respectively.
We are exposed to adverse changes in interest rates primarily due to our investment in cash and cash equivalents, as well as, our $50.0 million credit facility. Market risk is estimated as the potential change in fair value resulting from a hypothetical 1% adverse change in interest rates, which would have been an incremental charge of approximately $0.1 million, after tax, to our results of operations, financial position and cash flows in fiscal 2010. In addition, the Company’s liquidity and financial condition will continue to be affected by changes in prevailing interest rates on the portion of debt that bears interest at variable interest rates.
50
Table of Contents
| ITEM 8. | FINANCIAL STATEMENTS AND SUPPLEMENTARY DATA |
INDEX TO CONSOLIDATED FINANCIAL STATEMENTS
51
Table of Contents
Report of Independent Registered Public Accounting Firm
The Board of Directors and Stockholders
LeCroy Corporation:
We have audited the accompanying consolidated balance sheets of LeCroy Corporation and subsidiaries as of July 3, 2010 and June 27, 2009, and the related consolidated statements of operations, stockholders’ equity, and cash flows for the 53 week period ended July 3, 2010 and the 52 week periods ended June 27, 2009 and June 28, 2008. In connection with our audits of the consolidated financial statements, we also have audited the valuation and qualifying accounts financial statement schedule. These consolidated financial statements and financial statement schedule are the responsibility of the Company’s management. Our responsibility is to express an opinion on these consolidated financial statements and financial statement schedule based on our audits.
We conducted our audits in accordance with the standards of the Public Company Accounting Oversight Board (United States). Those standards require that we plan and perform the audit to obtain reasonable assurance about whether the financial statements are free of material misstatement. An audit includes examining, on a test basis, evidence supporting the amounts and disclosures in the financial statements. An audit also includes assessing the accounting principles used and significant estimates made by management, as well as evaluating the overall financial statement presentation. We believe that our audits provide a reasonable basis for our opinion.
In our opinion, the consolidated financial statements referred to above present fairly, in all material respects, the financial position of LeCroy Corporation and subsidiaries as of July 3, 2010 and June 27, 2009, and the results of their operations and their cash flows for the 53 week period ended July 3, 2010 and the 52 week periods ended June 27, 2009 and June 28, 2008, in conformity with U.S. generally accepted accounting principles. Also in our opinion, the related financial statement schedule, when considered in relation to the basic consolidated financial statements taken as a whole, presents fairly, in all material respects, the information set forth therein.
As discussed in Note 1 to the consolidated financial statements, the Company has changed its method of accounting for its convertible notes on a retrospective basis due to the adoption of new accounting guidance for convertible debt instruments that may be settled in cash upon conversion (including partial cash settlement).
/s/ KPMG LLP
Short Hills, New Jersey
September 7, 2010
52
Table of Contents
CONSOLIDATED BALANCE SHEETS
(In thousands, except par value and share data)
| July 3, 2010 |
June 27, 2009 As Adjusted (Note 12) |
|||||||
| ASSETS | ||||||||
| Current assets: |
||||||||
| Cash and cash equivalents |
$ | 7,822 | $ | 6,413 | ||||
| Accounts receivable, net of reserves of $499 and $692 at July 3, 2010 and June 27, 2009, respectively |
26,840 | 25,209 | ||||||
| Inventories, net |
30,308 | 34,987 | ||||||
| Other current assets |
8,771 | 11,564 | ||||||
| Total current assets |
73,741 | 78,173 | ||||||
| Property, plant and equipment, net |
20,806 | 21,817 | ||||||
| Intangible assets, net |
409 | 502 | ||||||
| Other non-current assets |
7,698 | 7,186 | ||||||
| Total assets |
$ | 102,654 | $ | 107,678 | ||||
| LIABILITIES AND STOCKHOLDERS’ EQUITY | ||||||||
| Current liabilities: |
||||||||
| Accounts payable |
$ | 13,649 | $ | 14,169 | ||||
| Accrued expenses and other current liabilities |
12,327 | 12,983 | ||||||
| Total current liabilities |
25,976 | 27,152 | ||||||
| Long-term bank debt |
17,000 | 17,500 | ||||||
| Convertible notes, net of unamortized discount of $3,044 and $6,277 respectively |
36,606 | 42,073 | ||||||
| Deferred revenue and other non-current liabilities |
3,296 | 3,635 | ||||||
| Total liabilities |
82,878 | 90,360 | ||||||
| Commitments and contingencies |
||||||||
| Stockholders’ equity: |
||||||||
| Preferred stock, $.01 par value (authorized 5,000,000 shares; none issued and outstanding as of July 3, 2010 and June 27, 2009) |
— | — | ||||||
| Common stock, $.01 par value (authorized 45,000,000 shares; 12,764,413 shares issued and outstanding at July 3, 2010 and 12,900,551 issued at June 27, 2009) |
128 | 129 | ||||||
| Additional paid-in capital |
125,392 | 125,904 | ||||||
| Accumulated other comprehensive income |
1,992 | 1,862 | ||||||
| Accumulated deficit |
(107,736 | ) | (107,479 | ) | ||||
| Treasury stock, at cost (403,215 shares at June 27, 2009) |
— | (3,098 | ) | |||||
| Total stockholders’ equity |
19,776 | 17,318 | ||||||
| Total liabilities and stockholders’ equity |
$ | 102,654 | $ | 107,678 | ||||
The accompanying notes are an integral part of these consolidated financial statements.
53
Table of Contents
CONSOLIDATED STATEMENTS OF OPERATIONS
(In thousands, except per share data)
| Years Ended | ||||||||||||
| July 3, 2010 (53 weeks) |
June 27, 2009 As Adjusted (Note 12) (52 weeks) |
June 28, 2008 As Adjusted (Note 12) (52 weeks) |
||||||||||
| Revenues: |
||||||||||||
| Test and measurement products |
$ | 119,633 | $ | 125,456 | $ | 151,077 | ||||||
| Service and other |
9,703 | 8,511 | 9,409 | |||||||||
| Total revenues |
129,336 | 133,967 | 160,486 | |||||||||
| Cost of revenues |
53,477 | 63,598 | 70,756 | |||||||||
| Gross profit |
75,859 | 70,369 | 89,730 | |||||||||
| Operating expenses: |
||||||||||||
| Selling, general and administrative |
42,265 | 46,991 | 51,299 | |||||||||
| Research and development |
27,992 | 30,851 | 32,576 | |||||||||
| Reimbursement from escrow account |
— | — | (240 | ) | ||||||||
| Impairment of goodwill |
— | 105,771 | — | |||||||||
| Total operating expenses |
70,257 | 183,613 | 83,635 | |||||||||
| Operating income (loss) |
5,602 | (113,244 | ) | 6,095 | ||||||||
| Other income (expense): |
||||||||||||
| Gain on extinguishment of convertible debt, net of issue cost write-off |
761 | 9,627 | 292 | |||||||||
| Interest income |
32 | 90 | 298 | |||||||||
| Interest expense |
(3,112 | ) | (3,443 | ) | (4,128 | ) | ||||||
| Amortization of debt discount on convertible notes |
(2,287 | ) | (2,872 | ) | (3,083 | ) | ||||||
| Other, net |
(443 | ) | 260 | (632 | ) | |||||||
| Other (expense) income, net |
(5,049 | ) | 3,662 | (7,253 | ) | |||||||
| Income (loss) before income taxes |
553 | (109,582 | ) | (1,158 | ) | |||||||
| Provision (benefit) for income taxes |
810 | (1,165 | ) | (983 | ) | |||||||
| Net loss |
$ | (257 | ) | $ | (108,417 | ) | $ | (175 | ) | |||
| Net loss per common share: |
||||||||||||
| Basic |
$ | (0.02 | ) | $ | (9.03 | ) | $ | (0.01 | ) | |||
| Diluted |
$ | (0.02 | ) | $ | (9.03 | ) | $ | (0.01 | ) | |||
| Weighted average number of common shares: |
||||||||||||
| Basic |
12,425 | 12,003 | 11,749 | |||||||||
| Diluted |
12,425 | 12,003 | 11,749 | |||||||||
The accompanying notes are an integral part of these consolidated financial statements.
54
Table of Contents
CONSOLIDATED STATEMENTS OF STOCKHOLDERS’ EQUITY
(In thousands)
| Common Stock | Additional Paid-in Capital As Adjusted (Note 12) |
Accumulated Other Comprehensive Income (loss) |
(Accumulated Deficit) Retained Earnings As Adjusted (Note 12) |
Treasury Stock |
Total Equity As Adjusted (Note 12) |
||||||||||||||||||||||
| Number of Shares |
Par Value |
||||||||||||||||||||||||||
| Balance at June 30, 2007, as adjusted |
12,343 | $ | 123 | $ | 119,795 | $ | 1,409 | $ | 1,209 | $ | — | $ | 122,536 | ||||||||||||||
| Comprehensive income: |
|||||||||||||||||||||||||||
| Net loss, as adjusted |
— | — | — | — | (175 | ) | — | (175 | ) | ||||||||||||||||||
| Foreign currency translation(a) |
— | — | — | 2,042 | — | — | 2,042 | ||||||||||||||||||||
| Total comprehensive income |
1,867 | ||||||||||||||||||||||||||
| Exercise of stock options and employee stock purchases |
151 | 2 | 834 | — | — | — | 836 | ||||||||||||||||||||
| Issuance of restricted stock |
227 | 2 | (2 | ) | — | — | — | — | |||||||||||||||||||
| Forfeitures of restricted stock for terminated employees |
(64 | ) | — | — | — | — | — | — | |||||||||||||||||||
| Share-based compensation expense |
— | — | 4,148 | — | — | — | 4,148 | ||||||||||||||||||||
| Unrecognized tax benefit, initial adoption adjustment |
— | — | — | — | 58 | — | 58 | ||||||||||||||||||||
| Sabbatical leave, initial adoption adjustment |
— | — | — | — | (154 | ) | — | (154 | ) | ||||||||||||||||||
| Purchase of treasury shares |
— | — | — | — | — | (2,413 | ) | (2,413 | ) | ||||||||||||||||||
| Adjustment for retrospective adoption of new convertible debt guidance (Note 12): |
|||||||||||||||||||||||||||
| Reacquisition of conversion option, net of tax(b) |
— | — | (477 | ) | — | — | — | (477 | ) | ||||||||||||||||||
| Balance at June 28, 2008, as adjusted |
12,657 | $ | 127 | $ | 124,298 | $ | 3,451 | $ | 938 | $ | (2,413 | ) | $ | 126,401 | |||||||||||||
| Comprehensive loss: |
|||||||||||||||||||||||||||
| Net loss, as adjusted |
— | — | — | — | (108,417 | ) | — | (108,417 | ) | ||||||||||||||||||
| Foreign currency translation(a) |
— | — | — | (1,589 | ) | — | — | (1,589 | ) | ||||||||||||||||||
| Total comprehensive loss |
(110,006 | ) | |||||||||||||||||||||||||
| Exercise of stock options and employee stock purchases |
204 | 2 | 681 | — | — | — | 683 | ||||||||||||||||||||
| Issuance of restricted stock |
65 | — | — | — | — | — | — | ||||||||||||||||||||
| Forfeitures of restricted stock for terminated employees |
(25 | ) | — | — | — | — | — | — | |||||||||||||||||||
| Share-based compensation expense |
— | — | 2,681 | — | — | — | 2,681 | ||||||||||||||||||||
| Purchase of treasury shares |
— | — | — | — | — | (685 | ) | (685 | ) | ||||||||||||||||||
| Adjustment for retrospective adoption of new convertible debt guidance (Note 12): |
|||||||||||||||||||||||||||
| Reacquisition of conversion option, net of tax(b) |
— | — | (1,756 | ) | — | — | — | (1,756 | ) | ||||||||||||||||||
| Balance at June 27, 2009, as adjusted |
12,901 | $ | 129 | $ | 125,904 | $ | 1,862 | $ | (107,479 | ) | $ | (3,098 | ) | $ | 17,318 | ||||||||||||
| Comprehensive loss: |
|||||||||||||||||||||||||||
| Net loss |
— | — | — | — | (257 | ) | — | (257 | ) | ||||||||||||||||||
| Foreign currency translation(a) |
— | — | — | 161 | — | — | 161 | ||||||||||||||||||||
| Defined benefit pension plan, net of taxes(c) (Note 17) |
— | — | — | (31 | ) | — | — | (31 | ) | ||||||||||||||||||
| Total comprehensive loss |
(127 | ) | |||||||||||||||||||||||||
| Exercise of stock options and employee stock purchases |
228 | 3 | 615 | — | — | — | 618 | ||||||||||||||||||||
| Issuance of restricted stock |
42 | — | — | — | — | — | — | ||||||||||||||||||||
| Forfeitures of restricted stock for terminated employees |
(4 | ) | — | — | — | — | — | — | |||||||||||||||||||
| Share-based compensation expense |
— | — | 2,323 | — | — | — | 2,323 | ||||||||||||||||||||
| Retirement of treasury shares |
(403 | ) | (4 | ) | (3,094 | ) | — | — | 3,098 | — | |||||||||||||||||
| Reacquisition of conversion option, net of tax(b) |
— | — | (356 | ) | — | — | — | (356 | ) | ||||||||||||||||||
| Balance at July 3, 2010 |
12,764 | $ | 128 | $ | 125,392 | $ | 1,992 | $ | (107,736 | ) | $ | — | $ | 19,776 | |||||||||||||
| (a) | The Company has not provided deferred taxes related to the currency translation adjustments because its intention is to repatriate a portion of the earnings of foreign subsidiaries in a manner that will not affect cumulative translation adjustments and to reinvest remaining earnings indefinitely. |
| (b) | Net of tax of approximately $193, $966 and $262 in fiscal 2010, 2009, and 2008, respectively. |
| (c) | Net of tax of approximately $10 in fiscal 2010. |
The accompanying notes are an integral part of these consolidated statements.
55
Table of Contents
CONSOLIDATED STATEMENTS OF CASH FLOWS
(In thousands)
| Years Ended | ||||||||||||
| July 3, 2010 (53 weeks) |
June 27, 2009 As Adjusted (Note 12) (52 weeks) |
June 28, 2008 As Adjusted (Note 12) (52 weeks) |
||||||||||
| CASH FLOWS FROM OPERATING ACTIVITIES: |
||||||||||||
| Net loss |
$ | (257 | ) | $ | (108,417 | ) | $ | (175 | ) | |||
| Adjustments to reconcile net loss to net cash provided by (used in) operating activities: |
||||||||||||
| Impairment of goodwill |
— | 105,771 | — | |||||||||
| Depreciation and amortization |
5,250 | 6,234 | 7,105 | |||||||||
| Share-based compensation |
4,371 | 2,783 | 4,695 | |||||||||
| Amortization of debt issuance costs |
484 | 533 | 539 | |||||||||
| Amortization of debt discount on convertible notes |
2,287 | 2,872 | 3,083 | |||||||||
| Deferred income taxes |
1,223 | (432 | ) | (1,683 | ) | |||||||
| Gain on extinguishment of convertible debt, net of issue cost write-off |
(761 | ) | (9,627 | ) | (292 | ) | ||||||
| Impairment of intangible assets |
— | — | 699 | |||||||||
| Loss (gain) on disposal of property, plant and equipment, net |
10 | 60 | (97 | ) | ||||||||
| Gross profit on non-cash sale |
— | — | (44 | ) | ||||||||
| Change in operating assets and liabilities: |
||||||||||||
| Accounts receivable |
(1,450 | ) | 7,229 | 547 | ||||||||
| Inventories |
2,341 | (3,960 | ) | 3,866 | ||||||||
| Other current and non-current assets |
553 | (402 | ) | 1,031 | ||||||||
| Accounts payable, accrued expenses and other liabilities |
(1,936 | ) | (10,380 | ) | 2,763 | |||||||
| Net cash provided by (used in) operating activities |
12,115 | (7,736 | ) | 22,037 | ||||||||
| CASH FLOWS FROM INVESTING ACTIVITIES: |
||||||||||||
| Purchase of property, plant and equipment |
(1,817 | ) | (4,434 | ) | (4,483 | ) | ||||||
| Net cash used in investing activities |
(1,817 | ) | (4,434 | ) | (4,483 | ) | ||||||
| CASH FLOWS FROM FINANCING ACTIVITIES: |
||||||||||||
| Borrowings under credit line |
8,500 | 20,500 | — | |||||||||
| Repayment of borrowings under credit line |
(9,000 | ) | (3,000 | ) | (9,410 | ) | ||||||
| Repurchase of convertible notes |
(8,603 | ) | (8,378 | ) | (3,583 | ) | ||||||
| Purchase of treasury shares |
— | (685 | ) | (2,413 | ) | |||||||
| Payments made on capital leases |
(253 | ) | (234 | ) | (283 | ) | ||||||
| Payment of note payable to related party for business acquisition |
— | — | (3,500 | ) | ||||||||
| Proceeds from employee stock purchase and option plans |
618 | 683 | 836 | |||||||||
| Net cash (used in) provided by financing activities |
(8,738 | ) | 8,886 | (18,353 | ) | |||||||
| Effect of exchange rate changes on cash and cash equivalents |
(151 | ) | (527 | ) | 575 | |||||||
| Net increase (decrease) in cash and cash equivalents |
1,409 | (3,811 | ) | (224 | ) | |||||||
| Cash and cash equivalents, beginning of year |
6,413 | 10,224 | 10,448 | |||||||||
| Cash and cash equivalents, end of year |
$ | 7,822 | $ | 6,413 | $ | 10,224 | ||||||
| Supplemental Cash Flow Disclosure |
||||||||||||
| Cash paid, net of refunds, during the year for: |
||||||||||||
| Interest |
$ | 2,579 | $ | 2,645 | $ | 3,860 | ||||||
| Income taxes, net |
(93 | ) | 371 | 869 | ||||||||
| Non-cash transactions: |
||||||||||||
| Property, plant and equipment acquired under capital lease |
— | — | 718 | |||||||||
| Receipt of advertising in exchange for test and measurement product |
— | — | 62 | |||||||||
| Transfer of inventory into property, plant and equipment |
2,389 | 1,773 | 2,047 | |||||||||
| Repurchase of convertible notes, unpaid at year-end |
— | 1,175 | 448 | |||||||||
The accompanying notes are an integral part of these consolidated financial statements.
56
Table of Contents
NOTES TO CONSOLIDATED FINANCIAL STATEMENTS
(In thousands, except share and per share amounts)
1. Summary of Significant Accounting Policies
Organization
LeCroy Corporation (the “Company” or “LeCroy”), was founded and incorporated in the State of New York in 1964 and reincorporated in the State of Delaware in 1995. The Company develops, manufactures, sells and licenses high-performance oscilloscopes and communication protocol analyzers. Oscilloscopes are tools used by designers and engineers to measure and analyze complex electronic signals in order to develop high-performance systems, to validate electronic designs and to improve time to market. Protocol analyzers are tools used by designers and engineers to generate and monitor traffic over high speed serial data interfaces, including USB 2.0, USB 3.0, Bluetooth, PCI Express, Serial ATA, Serial Attached SCSI (SAS) and others. The Company’s products are sold worldwide into a broad range of industry sectors, including Computer/Semiconductor/Consumer Electronics, Data Storage, Automotive/Industrial, and Military/Aerospace. Revenues are also generated from the sale of probes, accessories, and applications solutions, and to a lesser extent, extended warranty and maintenance contracts, repairs and calibrations performed on instruments after the expiration of their warranties.
Basis of Presentation and Use of Estimates
The Consolidated Financial Statements include the accounts of LeCroy Corporation and its wholly-owned subsidiaries. Intercompany transactions and balances have been eliminated in consolidation. On June 28, 2009, the Company retrospectively adopted the Financial Accounting Standards Board (“FASB”) staff position related to the accounting for convertible debt instruments that may be settled in cash upon conversion (including partial settlement) (See Note 12 — Debt and Capital Leases for additional information).
The Company’s Consolidated Financial Statements have been prepared in accordance with U.S. Generally Accepted Accounting Principles (“US GAAP”), which require management to make estimates and assumptions. These estimates and assumptions affect the reported amounts of assets and liabilities and disclosure of contingent assets and liabilities at the date of the Consolidated Financial Statements and the revenues and expenses reported during the period. The most significant of these estimates and assumptions relate to revenue recognition, reserves for accounts receivable, allowance for excess and obsolete inventory, uncertain tax positions, valuation of deferred tax assets, the effective income tax rate and geographical distribution of taxable income, valuation of long-lived assets and goodwill, share-based compensation expense, estimation of warranty liabilities and the separation of the Convertible notes between debt and equity. These estimates and assumptions are based on management’s judgment and available information and, consequently, actual results could differ from these estimates.
The Company’s fiscal years end on the Saturday closest to June 30, resulting in an additional week of results every five or six years. The fiscal year ended July 3, 2010 represented a 53-week year, while the fiscal years ended June 27, 2009 and June 28, 2008 represented a 52 week period.
Revenue
LeCroy recognizes product and service revenue, net of allowances for anticipated returns, provided that (1) persuasive evidence of an arrangement exists, (2) delivery has occurred, (3) the selling price is fixed or determinable and (4) collection is reasonably assured. Delivery is considered to have occurred when title and risk of loss have transferred to the customer, or when services have been provided. The price is considered fixed or determinable when it is not subject to refund or adjustments.
The Company maintains an allowance for doubtful accounts relating to accounts receivable estimated to be non-collectible. The Company analyzes historical bad debts, customer concentrations, customer creditworthiness,
57
Table of Contents
current economic trends and changes in customer payment terms when evaluating the adequacy of the allowance for doubtful accounts. In addition, the Company maintains, when appropriate, an allowance for anticipated sales returns. The Company analyzes historical return trends as well as in-transit product returns to evaluate the adequacy of the allowance for anticipated returns.
Test and measurement products revenue. The Company generates Test and measurement product revenue from the sales of oscilloscopes and application solutions, protocol analyzers, probes and accessories. Provisions for warranty costs are recorded at the time products are shipped.
Application solutions, which provide oscilloscopes with additional analysis capabilities, are either delivered via compact disc or are already loaded in the oscilloscopes and activated via a key code after the sale is made to the customer. No post-contract support is provided on the application solutions. All sales of Test and measurement products are based upon separately established prices for the items and are recorded as revenue according to the above revenue recognition criteria. Revenues from oscilloscope products are included in revenues from Test and measurement products in the Consolidated Statements of Operations, net of any applicable sales or value added taxes. Certain software is embedded in the Company’s oscilloscopes, but the embedded software component is considered incidental.
Currently, the Company recognizes revenue on the sales of its protocol analyzer products, due to their significant software content, in accordance with specific software revenue recognition guidance, upon shipment, provided there is persuasive evidence of an arrangement, the product has been delivered, the price is fixed or determinable and collection is probable. Software maintenance support revenue is deferred based on its vendor specific objective evidence of fair value (“VSOE”) and recognized ratably over the maintenance support periods. In limited circumstances where VSOE does not exist for software maintenance support, the Company recognizes revenue and accrues costs, if applicable, as determined by the facts and circumstances of each transaction. Provisions for warranty costs are recorded at the time sales of related products are recognized as revenue. Revenues from protocol analyzer products are included in Test and measurement products in the Consolidated Statements of Operations, net of any applicable sales or value added taxes. In October 2009, the FASB issued amendments to the accounting and disclosure for revenue recognition. These amendments are effective at the beginning of fiscal 2011 and they modify the criteria for revenue recognition in multiple arrangements and what constitutes a non-software deliverable, as described below, under “New Accounting Pronouncements”.
In an effort to provide end-user customers an alternative to purchasing the Company’s higher end products under its standard terms and conditions, the Company offers customers an opportunity to enter into sales-type or direct financing leases for these products. Lease and rental revenues are reported within Test and measurement product revenue and were approximately $0.9 million, $0.7 million and $1.8 million for the years ended July 3, 2010, June 27, 2009 and June 28, 2008, respectively.
Service and other revenue. Service and other revenue includes extended warranty contracts, software maintenance agreements, repairs and calibrations performed on instruments after the expiration of their normal warranty period and direct service accessories and packages. The Company records deferred revenue for extended warranty contracts, software maintenance agreements and calibrations services and recognizes such revenue on a straight-line basis over the related service period. When arrangements include multiple elements, the Company uses relative fair values to allocate revenue to the elements and recognizes revenue when the criteria for revenue recognition have been met for each element.
Effective in the first quarter of fiscal 2010, the Company entered into a research and development and distribution agreement with a third party. Both the Company and the third party are active participants in the development efforts and are exposed to risks and rewards dependent on the commercial success of the product development. LeCroy is solely responsible for providing the development efforts contemplated under the agreement and will retain all title and intellectual property rights for any product developed under the agreement. The Company will utilize its own personnel, facilities, equipment, computer software and information in order to meet the obligations under the agreement. The payments owed by the third party are nonrefundable and are not based on milestone deliverables and are not tied directly to any development spending made by the Company. The Company
58
Table of Contents
recognized $1.0 million in Service and other revenue related to this agreement in fiscal 2010. Revenue is being recognized ratably over the three year term of the agreement. Any research and development costs incurred in conjunction with this arrangement are recognized as incurred.
Deferred license revenue. Revenue from license fees under agreements that have exclusivity clauses and, from the licensee’s perspective, have ongoing requirements or expectations that are more than perfunctory, are recognized on a straight-line basis over the terms of the related agreements. An ongoing requirement or expectation would be considered more than perfunctory if any party to the contract considers it to be “essential to the functionality” of the delivered product or service or failure to complete the activities would result in the customer receiving a full or partial refund or rejecting the products delivered or services performed to date.
Share -Based Compensation
The Company recognizes the cost resulting from all share-based payment transactions in the financial statements at their fair values. The Company uses the Black-Scholes option pricing model to estimate the fair value of options and stock appreciation rights. The fair value of stock options is estimated on the date of grant, while the fair value for cash settled stock appreciation rights is estimated on the date of grant and remeasured at each subsequent reporting period, since it is liability-classified. Determining the fair value of options and stock appreciation rights requires certain estimates by management including the expected volatility and expected term of the option. Management also makes decisions regarding the risk free interest rate used in the model and makes estimates regarding forfeiture rates. Fluctuations in the market or other factors that affect these estimates could have a material impact on the resulting compensation cost. The fair value of restricted stock grants (referred to as non-vested stock) is determined based on the closing price of the Company’s common stock on the date of grant. Related compensation expense is recognized ratably over the associated requisite service period, giving effect to estimated forfeitures.
During the second quarter of fiscal 2007, the Company made the election to use the alternative transition method of calculating the pool of excess tax benefits available to absorb tax deficiencies (the “APIC Pool”); however, the alternative method does not have an impact on the Company’s results of operations or financial condition due to the Company’s net operating loss position for tax purposes.
Business Realignment and Related Asset Impairment Costs
The Company records realignment charges related to workforce reductions, including contractual termination benefits related to employee severance when they are probable and estimable, in accordance with the ongoing severance policy. The Company’s policy for recording the impairment of long-lived assets is described below in the section titled, “Impairment of Long-Lived Assets and Acquired Intangible Assets”.
Restructuring Charges
Charges associated with an exit or disposal activity are measured and recognized initially at fair value, only when the liability is incurred. Related to restructuring (exit) activities, the Company may also have involuntary terminations that are accounted for under the severance policy discussed above or as restructuring charges, if the severance and related costs are considered to be a one-time benefit arrangement outside of the Company’s ongoing severance policy.
Shipping and Handling Costs
Beginning in fiscal 2009, the Company changed its accounting policy to classify certain shipping and handling costs as Cost of revenues in the Consolidated Statement of Operations. The amounts classified as Cost of revenues represent shipping and handling costs associated with the distribution of finished product from their point of manufacturing directly to customers, distributors and wholly-owned international subsidiaries. Management
59
Table of Contents
believes that the classification of these shipping and handling costs as Cost of revenues better reflects the cost of producing and distributing its products and aligns external financial reporting with the results used internally to evaluate the Company’s operational performance. Shipping and handling costs associated with the transportation of demonstration units shipped to sales personnel and customers, as well as distribution costs associated with servicing the Company’s international customers through its foreign sales offices are recorded as Selling, general and administrative (“SG&A”), as they are considered direct selling expenses.
For purposes of comparability, approximately $1.8 million of shipping and handling costs previously classified as SG&A for fiscal year ending June 28, 2008 have been reclassified to Cost of revenues to apply the new policy. The remaining shipping and handling costs within SG&A totaled approximately $1.2 million, $1.3 million and $1.3 million for the fiscal years ended July 3, 2010, June 27, 2009 and June 28, 2008, respectively. This change in accounting principle and reclassification had no impact on operating (loss) income, net (loss) income, or net (loss) income per share.
Advertising Costs
The costs of general advertising, promotion and marketing programs are charged to Selling, general and administrative expense in the Consolidated Statements of Operations in the fiscal year incurred. The costs of advertising related to new product introductions are deferred until such advertising first takes place, which generally coincides with product introduction. Advertising expense for the fiscal years ended July 3, 2010, June 27, 2009 and June 28, 2008 was approximately $2.0 million, $2.4 million and $2.8 million, respectively.
Research and Development
The costs related to research, design and development of test and measurement products are charged to Research and development expense as incurred. The Company evaluates the requirement to capitalize certain software development costs for protocol analyzers. The costs incurred to develop or significantly enhance computer software products are charged to Research and development expense as incurred until technological feasibility has been established. The nature of the Company’s development for protocol analyzers is generally such that the Company can measure technological feasibility most effectively using the working model method where the time between establishment of a working model and general availability is of short duration which results in very little or no costs that qualify for capitalization. As such, the Company has not capitalized any software development costs for the years ended July 3, 2010, June 27, 2009 and June 28, 2008.
Cash and Cash Equivalents
Cash in excess of current operating requirements are invested in cash equivalents, which are short-term, highly liquid interest bearing investments with maturities of three months or less at the date of purchase and are stated at cost, which approximates fair value.
Property, Plant and Equipment
Property, plant and equipment are stated at cost less accumulated depreciation. Replacements, maintenance and repairs which do not improve or extend the life of the respective asset are expensed as incurred and major betterments are capitalized. Depreciation of property, plant and equipment is provided on a straight-line basis over the asset’s estimated useful life or related lease term, if shorter, as follows:
| Building and improvements |
10-32 years | |
| Furniture, machinery and equipment |
2-10 years | |
| Computer software and hardware |
2-7 years |
60
Table of Contents
Inventories
Inventories are stated at the lower of cost (first-in, first-out method) or market, with the exception of demonstration units in finished goods. Costs include material, labor and overhead charges. Demonstration units are accounted for as inventory since they are sold in the normal course of business and are stated at lower of cost (specific identification method) or market.
The Company reviews the valuation of inventory on a quarterly basis and provides an allowance for the value of estimated excess and obsolete raw materials and work in process inventory. The Company’s marketing department plays a key role in the inventory review process by providing updated sales forecasts, managing product rollovers and working with the manufacturing department to maximize recovery of excess inventory. Based upon management’s forecast, inventory items no longer expected to be used or saleable in the future are considered obsolete and the difference between an inventory’s quantity and its forecasted usage or sale are classified as excess. If actual market conditions are less favorable than those projected by management, additional inventory allowances for excess or obsolete inventory may be required.
Warranty
The Company provides a warranty on its products, generally extending between one and three years after delivery, and is accounted for as a contingency. Estimated future warranty obligations related to products are provided by charges to Cost of revenues in the period that the related revenue is recognized. These estimates are derived from historical data of product reliability and, for certain new products, third party published expected failure rates. The expected failure rate is arrived at in terms of units, which are then converted into labor hours to which an average fully burdened cost per hour is applied to derive the amount of accrued warranty required. The Company studies trends of warranty claims and performance of specific products and adjusts its warranty obligation through charges or credits to Cost of revenues.
Impairment of Long-Lived Assets and Acquired Intangible Assets
The Company monitors events and changes in circumstances that could indicate that the carrying amounts of long-lived assets, including amortizable intangible assets, may not be recoverable. When such events or changes in circumstances occur, the Company assesses the recoverability by determining whether the carrying value of such assets will be recovered through undiscounted expected future cash flows. If the undiscounted cash flows are less than the carrying amount, an impairment loss is recorded to the extent that the carrying amount exceeds the fair value.
Impairment of Goodwill
Goodwill is tested for impairment annually, or more frequently, if events or changes in circumstances indicate that the carrying amount of the asset might be impaired. The goodwill impairment test is a two-step process which requires the Company to make judgmental assumptions regarding fair value. Testing is required between annual tests if events occur or circumstances change that could reduce the fair value of the reporting unit below its carrying value. Such an event may occur if, for an extended period of time, the market value of the Company’s common stock plus a control premium were less than the carrying value of the Company.
Impairment is assessed at the “reporting unit” level by applying a fair value-based test. A reporting unit is defined as the same as or one level below the operating segment level. The Company has one reporting unit, in the Test and Measurement business, because none of the components of the Company constitute a business for which discrete financial information is available and for which Company management regularly reviews the results of operations.
The first step of the impairment test is to identify if an impairment of goodwill has occurred by comparing the fair value of the reporting unit with its carrying amount, including goodwill. If the fair value of the reporting unit
61
Table of Contents
exceeds its carrying amount, goodwill of the reporting unit is not considered impaired. If the carrying amount of the reporting unit exceeds its fair value, the second step of the goodwill test is performed to measure the amount of the impairment loss, if any. In this second step, the “implied” fair value of the reporting unit’s goodwill is compared with the carrying amount of the goodwill. If the carrying amount of the reporting unit’s goodwill exceeds the implied fair value of that goodwill, an impairment loss is recognized in an amount equal to that excess, not to exceed the carrying amount of the goodwill.
As the Company consists of only one reporting unit, and is publicly traded, management estimates the fair value of its reporting unit utilizing the Company’s market capitalization, multiplying the number of actual shares outstanding by an average market price over a reasonable period of time considered appropriate to determine fair value, as reflected on the NASDAQ Stock Market, LLC, and applying an additional premium to give effect to the Company’s best estimate of a control premium, as if the Company were to be acquired by a single stockholder, which seeks to give effect to the increased consideration a potential acquirer would be willing to pay in order to gain sufficient ownership to set policies, direct operations and make decisions related to the Company.
The control premium is not a standard amount based on broad assumptions; rather, the amount is based on detailed analysis that considers appropriate industry, market, economic and other pertinent factors, including, indications of such premiums from data on recent acquisition transactions. The control premium is reviewed taking into consideration current industry, market and economic conditions along with other factors or available information specific to the Company’s business. Management’s estimate of an appropriate control premium to apply in determining fair value is an important variable in the Company’s goodwill impairment assessment.
In the fourth quarter of fiscal 2008, the Company changed its annual impairment testing date from fiscal year end to the last day of the eleventh month of the fiscal year. The Company believes the last day of the eleventh month of the fiscal year is preferable as it provides the Company additional time to complete the impairment test and report the results of that test in the Company’s annual filing on Form 10-K.
In the second quarter of fiscal 2009, as a result of the deteriorating economic environment and sustained decline in the Company’s stock price since September 27, 2008, which affected the Company’s market capitalization, the Company performed the first step of its goodwill impairment test and determined that its carrying value exceeded its fair value, indicating that goodwill was impaired. The Company performed the second step of the goodwill impairment test which calculated the implied fair value of the goodwill by allocating the fair value of the Company determined in the first step to all assets and liabilities other than goodwill, including both recognized and unrecognized intangible assets, and compared it to the carrying amount of goodwill in order to determine the amount of the goodwill impairment. As a result, in fiscal 2009 the Company recorded approximately $105.8 million of goodwill impairment, reducing the carrying value of Goodwill to zero.
Concentration of Credit Risk
The Company develops, manufactures, sells and licenses high-performance oscilloscopes, serial data analyzers and communication protocol test solutions. The Company’s products are sold into a broad range of end markets, including Computer/Semiconductor/Consumer Electronics, Data Storage, Automotive/Industrial, and Military/Aerospace markets. Sales occur in all regions of the United States as well as a many foreign countries. No customer accounted for more than 10% of the Company’s consolidated revenues in any of the last three fiscal years. There is no significant concentration of the Company’s accounts receivable portfolio in any customer or geographical region that presents a risk to the Company based on that concentration. The Company performs on-going credit evaluations of its customers. Credit risk may sometimes be partially mitigated through collateral such as letters of credit, bank guarantees or payment terms such as cash in advance. The Company maintains allowances for potential credit losses. Credit losses have been minimal in fiscal 2010, 2009 and 2008.
62
Table of Contents
Income Taxes
Deferred tax assets and liabilities are recognized under the asset and liability method based upon the difference between the amounts reported for financial reporting and tax purposes. These deferred taxes are measured by applying current enacted tax rates. The effect on deferred tax assets and liabilities of a change in tax rates is recognized in operations in the period that includes the enactment date. Significant management judgment is required in determining whether deferred tax assets will be realized in full or in part. When it is more likely than not that all or some portion of specific deferred tax assets, such as net operating losses or foreign tax credit carryforwards, will not be realized, a valuation allowance must be established for the amount of the deferred tax assets that are not expected to be realized. The Company considers all available positive and negative evidence on a jurisdiction-by-jurisdiction basis when assessing whether it is more likely than not that deferred tax assets are realizable.
The realization of deferred tax assets, after accounting for tax exposures, is based on the assessment that it is more likely than not that the Company will be able to generate sufficient future taxable income within statutory carryforward periods to realize the deferred tax assets. Adjustments to the valuation allowance may be made in the future if it is determined that the realizable amount of net operating losses and other deferred tax assets is greater or less than the amount recorded. Such adjustments may be material to the Company’s financial position and results of operations.
The Company’s policy is not to provide for U.S. taxes on undistributed earnings of foreign subsidiaries to the extent such earnings are determined to be permanently invested outside the United States.
Effective July 1, 2007, the Company adopted a comprehensive model for how a company should recognize, measure, present, and disclose in its financial statements uncertain tax positions that the Company has taken or expects to take on a tax return. A tax benefit from an uncertain tax position may be recognized only if it is “more likely than not” that the position is sustainable, based on its technical merits. The tax benefit of a qualifying position is the largest amount of tax benefit greater than 50% likely of being realized upon settlement with a taxing authority having full knowledge of all relevant information. A tax benefit from an uncertain position was previously recognized if it was probable of being sustained. The liability for unrecognized tax benefits is classified as non-current unless the liability is expected to be settled in cash within twelve months of the reporting date. Interest and penalties related to income taxes is included in the benefit (provision) for income taxes line of the Consolidated Statement of Operations.
Foreign Exchange
The Company’s foreign subsidiaries generally use their local currency as the functional currency and translate all assets and liabilities at fiscal year-end exchange rates and all income and expenses at average fiscal year exchange rates with translation adjustments recorded in Accumulated other comprehensive income, a separate component of Stockholders’ equity in the Consolidated Balance Sheets. Transaction gains and losses that arise from exchange rate fluctuations on transactions denominated in a currency other than the functional currency are included in Other, net in the Consolidated Statements of Operations. Foreign currency transaction gains and losses, related to short-term intercompany loans, are recorded in the Consolidated Statements of Operations as incurred. The foreign currency transaction gains and losses are recorded in Accumulated other comprehensive income, a component of Stockholders’ equity, for intercompany loans that are considered long-term in nature.
Financial Instruments
Cash and cash equivalents, accounts receivable, accounts payable, and accrued expenses and other current liabilities in the Consolidated Balance Sheets equal or approximate their fair value due to their short term to maturity. Borrowings under the revolving line of credit have variable interest rates and their carrying amounts are considered by management to be a reasonable estimate of their fair value.
63
Table of Contents
Derivative Instruments
The Company is exposed to global market exchange rate risks and, as a result, enters into forward exchange contracts to manage financial exposures resulting from changes in foreign currency rates. All derivative instruments are recorded on the balance sheet at their respective fair values. The accounting for changes in the fair value (i.e., gains or losses) of a derivative instrument is dependent upon whether the derivative has been designated and qualifies as part of a hedging relationship and further, on the type of hedging relationship. The Company’s foreign exchange forward contracts are not accounted for as hedges and therefore, any changes in fair value of these contracts are recorded in Other, net in the Consolidated Statements of Operations.
The Company manages its foreign exchange exposure by entering into short-term forward exchange agreements to purchase foreign currencies at set rates in the future. These foreign currency forward exchange agreements are used to reduce exposure to fluctuations in foreign currency exchange rates on assets and liabilities denominated in currencies other than the Company’s functional currencies. The Company records these short-term forward exchange agreements on the balance sheet at fair value in Other current assets and Accrued expenses and other current liabilities. The changes in the fair values of these contracts are recorded in Other, net in the Consolidated Statements of Operations and are inversely correlated to changes in the value of certain of the Company’s foreign currency-denominated assets and liabilities. The Company does not use derivative financial instruments for trading or other speculative purposes.
New Accounting Pronouncements
Recent pronouncements not yet adopted
In October 2009, the FASB issued amendments to the accounting and disclosure for revenue recognition. These amendments, effective for fiscal years beginning on or after June 15, 2010, modify the criteria for recognizing revenue in multiple element arrangements and the scope of what constitutes a non-software deliverable.
The FASBs amendments related to multiple element arrangements include:
| 1. | Updated guidance on whether multiple deliverables exist, how the deliverables in an arrangement should be separated and how the consideration should be allocated; |
| 2. | Establishment of a selling price hierarchy as a means to determine the selling price of a deliverable. If an entity does not have vendor-specific objective evidence of selling price (“VSOE”) or third-party evidence of selling price (“TPE”), then estimated selling price (“ESP”) may be used; |
| 3. | Eliminating the use of the residual method by requiring an entity to allocate revenue using the relative selling price method; and |
| 4. | Enhanced disclosures to provide information about a vendor’s multiple-deliverable revenue arrangements, including information about the nature and terms, significant deliverables and its performance within arrangements. The amendments also require disclosure of significant judgments and how the application of the relative selling-price method affects the timing or amount of revenue recognition. |
Non-software deliverables
The FASB amended the accounting standards for revenue recognition to remove tangible products containing software components and non-software components that function together to deliver the product’s essential functionality from the scope of industry-specific software revenue recognition guidance. The new guidance includes factors to help companies determine what software elements are considered “essential to the functionality.” These changes allow software-enabled products to be scoped out of specific software revenue recognition models. Software-enabled products will be subject to other revenue guidance and disclosure requirements, such as the guidance surrounding revenue arrangements with multiple deliverables, as discussed above.
64
Table of Contents
The Company will prospectively apply the new revenue recognition guidance in the first quarter of fiscal 2011 and believes its adoption will not have a material impact on the Company’s consolidated financial position or results of operations, but may require enhanced disclosures.
Recent pronouncements adopted
In September 2006, FASB issued new accounting guidance on fair value measurements, effective beginning in fiscal 2009. This guidance established a framework for measuring fair value and requires enhanced disclosures about fair value measurements. The FASB deferred the effective date until the beginning of the Company’s 2010 fiscal year, as it relates to fair value measurement requirements for non-financial assets and liabilities that are not remeasured at fair value on a recurring basis. This includes fair value calculated in impairment assessments of long-lived assets. The Company adopted the new guidance as it relates to non-financial assets and liabilities and it did not have any impact on the Company’s consolidated financial position and results of operations at the date of adoption, although it may impact the way that fair value for non-financial assets and liabilities is determined in future periods.
In December 2007, the FASB issued new guidance on business combinations. It established the principles and requirements for how an acquirer in a business combination recognizes and measures in its financial statements the identifiable assets acquired, the liabilities assumed, and any noncontrolling interest in the acquiree at the acquisition date fair value. Further, it required that acquisition-related costs be expensed as incurred, restructuring costs be expensed in periods subsequent to the acquisition date and changes in accounting for deferred income tax asset valuation allowances and acquired income tax uncertainties after the measurement period be included in income tax expense. Additionally, disclosure requirements were established to enable users of the financial statements to evaluate the nature and financial effects of the business combination. The new accounting guidance applied prospectively to business combinations for which the acquisition date is on or after the beginning of the first annual reporting period beginning on or after December 15, 2008, with the exception of adjustments made to valuation allowances on deferred taxes and acquired tax contingencies. The Company will apply the provisions under the new guidance to future adjustments made to valuation allowances on deferred taxes and acquired tax contingencies associated with acquisitions that closed prior to the beginning of the Company’s 2010 fiscal year. At July 3, 2010, approximately $2.5 million of unrecognized tax benefits are related to a prior acquisition and would impact the effective tax rate, if recognized.
In May 2008, the FASB issued a staff position on new accounting for convertible debt instruments that may be settled in cash upon conversion (including partial cash settlement). The staff position requires cash settled convertible debt to be separated into debt and equity components at issuance and a value to be assigned to each. The value assigned to the debt component will be the estimated fair value, as of the issuance date, of a similar bond without the conversion feature. The difference between the cash proceeds and this estimated fair value will be recorded as a debt discount, with an offset to equity, and will be amortized to interest expense, using the effective interest method, over the life of the Convertible notes. The guidance was effective for financial statements issued for fiscal years beginning after December 15, 2008 and for interim periods within those years and required retrospective application. The Company adopted the staff position in fiscal 2010 and has retrospectively applied it to prior periods (See Note 12 — “Debt and Capital Leases” for additional information).
In April 2009, the FASB issued a staff position requiring fair value disclosures in both interim as well as annual financial statements in order to provide more timely information about the effects of current market conditions on financial instruments. The guidance was effective for interim reporting periods ending after June 15, 2009. The Company adopted the enhanced disclosures required in the first quarter of fiscal 2010 and adoption did not have any impact on the Company’s consolidated financial position or results of operations.
In June 2009, the FASB Accounting Standards Codification (“Codification”) was issued. The Codification is the source of authoritative U.S. GAAP recognized by the FASB to be applied by nongovernmental entities. The Codification does not change U.S. GAAP; instead, it introduces a new structure that is organized in an easily accessible, user-friendly online research system. The Codification, which changes the referencing of financial standards, becomes effective for interim and annual periods ending on or after September 15, 2009. The implementation of the Codification did not have any impact on the Company’s consolidated financial position or results of operations.
65
Table of Contents
2. Business Realignment, Restructuring Initiatives and Related Asset Impairments
The table below summarizes the charges for business realignments, restructuring initiatives and related asset impairments for the fiscal years ended 2010, 2009 and 2008.
(in thousands):
| Years Ended | |||||||||
| July 3, 2010 (53 weeks) |
June 27, 2009 (52 weeks) |
June 28, 2008 (52 weeks) | |||||||
| Charges for: |
|||||||||
| Severance and related costs |
$ | — | $ | 695 | $ | — | |||
| Cost of revenue total |
$ | — | $ | 695 | $ | — | |||
| Charges for: |
|||||||||
| Severance and related costs |
$ | — | $ | 1,563 | $ | — | |||
| Research and development total |
$ | — | $ | 1,563 | $ | — | |||
| Charges for: |
|||||||||
| Impaired intangible asset |
$ | — | $ | — | $ | 699 | |||
| Severance and related costs |
414 | 2,079 | 954 | ||||||
| Facility closure/lease restructure |
— | 749 | — | ||||||
| Selling, general and administrative total |
$ | 414 | $ | 2,828 | $ | 1,653 | |||
Fiscal 2010 Business Realignment
In the fourth quarter of fiscal 2010, as a result of changes in the selling organization, the Company recorded severance of approximately $0.1 million, which was expensed to SG&A, resulting from headcount reductions of four employees or approximately 1% of the workforce as compared to June 27, 2009. As of July 3, 2010, approximately $0.1 million has been paid in cash and less than $0.1 remains in Accrued expenses and other current liabilities on the Consolidated Balance Sheet. Severance is estimated to be paid by the end of the first quarter of fiscal 2011.
In the third quarter of fiscal 2010, as a result of administrative changes, the Company recorded severance of approximately $0.2 million, which was expensed to SG&A, resulting from a headcount reduction. As of July 3, 2010, approximately $0.1 million has been paid in cash and approximately $0.1 million remains in Accrued expenses and other current liabilities on the Consolidated Balance Sheet. Severance is estimated to be paid by the end of the third quarter of fiscal 2011.
In the second quarter of fiscal 2010, as a result of continued efforts to streamline expenses internationally, the Company recorded severance of approximately $0.1 million, which was expensed to SG&A. This resulted from headcount reduction of three employees or approximately 0.8% of the workforce as compared to June 27, 2009. As of July 3, 2010, approximately $0.1 million has been paid in cash and no liability remains.
In the first quarter of fiscal 2010, as a result of a further effort to streamline expenses internationally, the Company recorded severance of approximately $0.1 million, which was expensed to SG&A. This resulted from headcount reductions of four employees or approximately 1.0% of the workforce as compared to June 27, 2009. As of July 3, 2010, approximately $0.1 million has been paid in cash and no liability remains.
66
Table of Contents
Fiscal 2009 Restructuring Initiatives
In the fourth quarter of fiscal 2009, as a result of the economic downturn and resulting business realignment decisions affecting personnel in Europe, the Company vacated certain space at its Swiss facility. This resulted in a restructuring charge to SG&A expense of approximately $0.7 million, which represented the present value of the estimated future cash payments, net of estimated subrental income and expense, through the remainder of the lease term which will expire in the first quarter of fiscal 2014. As of July 3, 2010, approximately $0.2 million remains in Accrued expenses and other current liabilities and approximately $0.4 million remains in Deferred revenue and other non-current liabilities on the Consolidated Balance Sheet.
Fiscal 2009 Business Realignment and Related Asset Impairment
In the fourth quarter of fiscal 2009, in an effort to further streamline expenses in response to the economic environment, the Company recorded severance of approximately $0.2 million, of which less than $0.1 million was expensed to Cost of revenues, approximately $0.1 million was expensed to SG&A and less than $0.1 million was expensed to Research and development. This resulted from headcount reductions of twelve employees or approximately 2.6% of the workforce as compared to June 28, 2008. As of July 3, 2010, approximately $0.2 million has been paid in cash and no liability remains.
In the third quarter of fiscal 2009, in an effort to further streamline expenses in response to the dramatic deterioration in economic and market conditions, the Company recorded severance of approximately $2.6 million, of which approximately $0.6 million was expensed to Cost of revenues, approximately $1.1 million was expensed to SG&A and approximately $0.9 million was expensed to Research and development. This resulted from headcount reductions of sixty-two employees or approximately 13.6% of the workforce as compared to June 28, 2008. As of July 3, 2010, approximately $2.4 million has been paid in cash, and approximately $0.1 million remains in Accrued expenses and other current liabilities and approximately $0.1 million remains in Deferred revenue and other non-current liabilities on the Consolidated Balance Sheet. Severance is estimated to be paid by the end of the third quarter of fiscal 2012.
In the second quarter of fiscal 2009, in an effort to streamline expenses in anticipation of further deterioration in the economic environment, the Company recorded severance of approximately $1.5 million, of which approximately $0.1 million was expensed to Cost of revenues, approximately $0.8 million was expensed to SG&A and approximately $0.6 million was expensed to Research and development. This resulted from headcount reductions of ten employees or 2.2% of the workforce as compared to June 28, 2008. As of July 3, 2010, approximately $1.5 million has been paid in cash and no liability remains.
Fiscal 2008 Business Realignment and Related Asset Impairment
In the fourth quarter of fiscal 2008, the Catalyst trade name failed the impairment test as a result of a change in the Company’s product strategy, and therefore, the Company recorded an approximate $0.7 million non-cash charge to SG&A expense for the impairment.
In the third quarter of fiscal 2008, as a result of streamlining operational management processes and staffing requirements, the Company recorded severance of approximately $0.3 million, which was expensed to SG&A. This resulted from headcount reductions of three employees or 0.7% of the workforce as compared to June 30, 2007. Severance and other related amounts under this plan were fully paid in fiscal 2009 and no liability remains.
In the first quarter of fiscal 2008, primarily as the result of an effort to improve sales effectiveness and channel management, the Company recorded severance of approximately $0.6 million, which was expensed to SG&A. This resulted from headcount reductions of twelve employees or 2.7% of the workforce as compared to June 30, 2007. Severance and other related amounts under this plan were fully paid in fiscal 2009 and no liability remains.
67
Table of Contents
3. Accounts Receivable, net
As of July 3, 2010 and June 27, 2009, the Company had an agreement with one of its customers, who is also a vendor, that provided the Company with the legal right to offset outstanding accounts receivable balances against outstanding accounts payable balances. At July 3, 2010 and June 27, 2009, the Company did not offset the balances, as the amounts were immaterial.
The allowance for doubtful accounts and sales returns was approximately $0.5 million at July 3, 2010 and approximately $0.7 million at June 27, 2009.
4. Inventories, net
Inventories, net consist of the following (in thousands):
| July 3, 2010 |
June 27, 2009 | |||||
| Raw materials |
$ | 9,305 | $ | 8,351 | ||
| Work in process |
6,416 | 6,590 | ||||
| Finished goods |
14,587 | 20,046 | ||||
| Total |
$ | 30,308 | $ | 34,987 | ||
The value of demonstration units included in finished goods was $10.7 million and $11.3 million at July 3, 2010 and June 27, 2009, respectively. The Company’s demonstration units are held for sale and are sold regularly in the ordinary course of business through its normal sales distribution channels and to its existing customer base. The allowance for excess and obsolete inventory, included above, amounted to approximately $3.3 million and $5.8 million at July 3, 2010 and June 27, 2009, respectively.
In fiscal 2009, the Company recorded a total of approximately $5.8 million of inventory reserves and write-downs as a result of its realignment initiatives and changes in the Company’s product strategy. These charges were expensed to Cost of revenues in the Consolidated Statement of Operations.
In fiscal 2008, the Company recorded an approximate $2.4 million inventory write-down as a result of a change in the Company’s product strategy and an approximate $0.8 million charge related to certain inventory recorded at fair value in the purchase accounting of Catalyst, a portion of which the Company was indemnified. These charges totaled approximately $3.2 million and were recorded to Cost of revenues in the Consolidated Statement of Operations.
5. Other Current Assets
Other current assets consist of the following (in thousands):
| July 3, 2010 |
June 27, 2009 | |||||
| Deferred tax assets, net |
$ | 4,191 | $ | 6,399 | ||
| Prepaid taxes |
375 | 619 | ||||
| Prepaid deposits |
656 | 729 | ||||
| Other receivables |
1,150 | 776 | ||||
| Value-added tax receivables |
490 | 820 | ||||
| Other |
1,909 | 2,221 | ||||
| Total |
$ | 8,771 | $ | 11,564 | ||
Prepaid deposits as of June 27, 2009, included a deposit of approximately $0.4 million for expenses that were incurred within Research and development in fiscal 2010. Fiscal 2010 and 2009 also included approximately $0.3 million for a deposit on a license agreement.
68
Table of Contents
6. Property, Plant and Equipment, net
Property, plant and equipment, net, consist of the following (in thousands):
| July 3, 2010 |
June 27, 2009 |
|||||||
| Land, building and improvements |
$ | 17,375 | $ | 17,332 | ||||
| Furniture, machinery and equipment |
45,516 | 42,186 | ||||||
| Computer software and hardware |
21,447 | 21,097 | ||||||
| 84,338 | 80,615 | |||||||
| Less: Accumulated depreciation |
(63,532 | ) | (58,798 | ) | ||||
| Total |
$ | 20,806 | $ | 21,817 | ||||
Depreciation expense for the fiscal years ended July 3, 2010, June 27, 2009, and June 28, 2008 was approximately $5.2 million, $5.8 million, and $5.7 million, respectively.
Amortization for assets under capital leases is included in depreciation expense above. The net carrying value of assets under capital leases is approximately $0.1 million and $0.3 million at July 3, 2010 and June 28, 2008, respectively.
7. Intangible Assets, net
The following table reflects the gross carrying amount and accumulated amortization of the Company’s amortizable intangible assets as of the dates indicated (in thousands):
| Original Weighted Average Lives |
July 3, 2010 |
June 27, 2009 |
||||||||
| Amortizable intangible assets: |
||||||||||
| Technology, manufacturing and distribution rights |
2.9 years | $ | 8,296 | $ | 8,296 | |||||
| Accumulated amortization |
(8,188 | ) | (8,147 | ) | ||||||
| Net carrying amount |
$ | 108 | $ | 149 | ||||||
| Patents and other intangible assets |
5.9 years | 1,592 | 1,592 | |||||||
| Accumulated amortization |
(1,291 | ) | (1,239 | ) | ||||||
| Net carrying amount |
$ | 301 | $ | 353 | ||||||
| Total Net carrying amount |
3.4 years | 409 | 502 | |||||||
Amortization expense for intangible assets with finite lives was approximately $0.1 million, $0.5 million, and $1.4 million for fiscal 2010, 2009 and 2008, respectively. The cost of an amortizable intangible asset is amortized on a straight-line basis over the estimated economic life of the asset. Management estimates intangible assets amortization expense on a straight-line basis to be approximately $0.1 million per year for fiscal 2011 through 2015.
In the fourth quarter of fiscal 2008, the Catalyst trade name, which had been established as an indefinite-lived intangible asset, failed the annual impairment test due to a change in the Company’s product strategy and, accordingly, the Company took an approximate $0.7 million non-cash charge to SG&A expense for the impairment.
69
Table of Contents
8. Other Non-Current Assets
Other Non-Current Assets consist of the following (in thousands):
| July 3, 2010 |
June 27, 2009 | |||||
| Other Non-Current Assets: |
||||||
| Deferred tax assets, net, as adjusted (Note 12) |
$ | 6,559 | $ | 5,646 | ||
| Deferred financing costs on convertible notes, as adjusted (Note 12) |
402 | 784 | ||||
| Other |
737 | 756 | ||||
| Total |
$ | 7,698 | $ | 7,186 | ||
The Company recorded a goodwill impairment charge of approximately $105.8 million in the quarter ended December 27, 2008.
9. Accrued Expenses and Other Current Liabilities
Accrued expenses and other current liabilities consist of the following (in thousands):
| July 3, 2010 |
June 27, 2009 | |||||
| Compensation and benefits, including severance |
$ | 7,343 | $ | 6,479 | ||
| Income taxes |
— | 135 | ||||
| Warranty |
867 | 905 | ||||
| Deferred revenue, current portion(a) |
1,207 | 1,366 | ||||
| Accrued interest on debt |
380 | 447 | ||||
| Retained liabilities from discontinued operations |
160 | 160 | ||||
| Capital leases |
66 | 253 | ||||
| Professional fees |
355 | 896 | ||||
| Deferred tax liabilities |
241 | 330 | ||||
| Other current liabilities |
1,708 | 2,012 | ||||
| Total |
$ | 12,327 | $ | 12,983 | ||
| (a) | The long term portion of Deferred revenues is approximately $0.8 million and $0.9 million for the periods ended July 3, 2010 and June 27, 2009, respectively, and are classified within Deferred revenues and other non-current liabilities of the Consolidated Balance Sheet. |
10. Warranties and Guarantees
The following table is a reconciliation of the changes in the Company’s aggregate product warranty liability (in thousands):
| July 3, 2010 |
June 27, 2009 |
June 28, 2008 |
||||||||||
| Balance at beginning of year |
$ | 905 | $ | 1,313 | $ | 1,190 | ||||||
| Accruals for warranties issued during the year |
732 | 538 | 931 | |||||||||
| Warranty costs incurred during the year |
(770 | ) | (754 | ) | (808 | ) | ||||||
| Change in accrual estimate |
— | (192 | ) | — | ||||||||
| Balance at end of year |
$ | 867 | $ | 905 | $ | 1,313 | ||||||
In fiscal 2009, management revisited labor and cost estimates utilized in its existing warranty model as part of its quarterly review process, and in light of the Company’s restructuring initiatives, and determined that the actual
70
Table of Contents
labor rates and cost estimates to repair the warranty units were lower than previously estimated. These changes in estimates reduced the accrual required by approximately $0.2 million.
As is customary in the Test and Measurement industry, and as provided for by local law in the U.S. and other jurisdictions, the Company’s standard terms of sale provide remedies to customers, such as defense, settlement or payment of a judgment for intellectual property claims related to the use of the Company’s products. Such indemnification provisions are accounted for in accordance with contingency guidance. To date, there have been no claims under such indemnification provisions.
11. Income Taxes
The income tax (provision) benefit consists of the following (in thousands):
| Years Ended | ||||||||||||
| July 3, 2010 |
June 27, 2009 As Adjusted (Note 12) |
June 28, 2008 As Adjusted (Note 12) |
||||||||||
| Current: |
||||||||||||
| U.S. federal |
$ | 880 | $ | 1,277 | $ | 147 | ||||||
| U.S. state and local |
(303 | ) | (230 | ) | (263 | ) | ||||||
| Foreign |
(163 | ) | (314 | ) | (584 | ) | ||||||
| Subtotal current |
414 | 733 | (700 | ) | ||||||||
| Deferred: |
||||||||||||
| U.S. federal |
(1,416 | ) | 569 | 1,585 | ||||||||
| U.S. state and local |
42 | 15 | 271 | |||||||||
| Foreign |
150 | (152 | ) | (173 | ) | |||||||
| Subtotal deferred |
(1,223 | ) | 432 | 1,683 | ||||||||
| Total |
$ | (810 | ) | $ | 1,165 | $ | 983 | |||||
Income (loss) before taxes for U.S. domestic operations was approximately $1.4 million, $(109.8) million, and $(4.8) million for the years ended July 3, 2010, June 27, 2009 and June 28, 2008, respectively. Income (loss) before taxes for foreign operations was approximately $(0.8) million, $0.2 million, and $3.6 million for the years ended July 3, 2010, June 27, 2009 and June 28, 2008, respectively.
The reconciliations between the income tax (provision) benefit at the U.S. federal statutory rate and the Company’s effective tax rate is as follows (in thousands):
| Years Ended | ||||||||||||
| July 3, 2010 |
June 27, 2009 As Adjusted (Note 12) |
June 28, 2008 As Adjusted (Note 12) |
||||||||||
| (Provision) benefit at U.S. federal statutory rate |
$ | (194 | ) | $ | 38,354 | $ | 405 | |||||
| Impairment of goodwill |
— | (35,372 | ) | — | ||||||||
| Graduated U.S. federal rate reduction |
14 | (1,096 | ) | (12 | ) | |||||||
| State income taxes, net of federal benefit |
(175 | ) | (148 | ) | 84 | |||||||
| (Increase) decrease in valuation allowance |
(46 | ) | (205 | ) | 18 | |||||||
| Non-deductible share-based compensation |
(554 | ) | (816 | ) | (825 | ) | ||||||
| Tax credits |
25 | 499 | 1,200 | |||||||||
| Difference between U.S. and foreign rates |
(13 | ) | 69 | 247 | ||||||||
| Unrecognized tax benefit (provision) |
355 | (393 | ) | (334 | ) | |||||||
| Other, net |
(222 | ) | 273 | 200 | ||||||||
| Income tax (provision) benefit |
$ | (810 | ) | $ | 1,165 | $ | 983 | |||||
71
Table of Contents
Significant components of the Company’s net deferred tax assets as of July 3, 2010 and June 27, 2009 were as follows (in thousands):
| July 3, 2010 |
June 27, 2009 As Adjusted (Note 12) |
|||||||
| Deferred tax assets: |
||||||||
| U.S. federal net operating loss carryforwards |
$ | 719 | $ | 3,132 | ||||
| Acquired U.S. net operating loss carryforwards |
572 | 1,902 | ||||||
| Foreign net operating loss carryforwards |
496 | 295 | ||||||
| Tax credit carryforwards |
3,331 | 3,502 | ||||||
| Inventory reserves |
1,137 | 2,281 | ||||||
| Deferred revenue |
356 | 342 | ||||||
| Share-based compensation |
1,919 | 1,345 | ||||||
| Accrued compensation/benefits |
454 | 729 | ||||||
| Deferred research expenses |
6,494 | 4,441 | ||||||
| Intangible assets |
312 | 404 | ||||||
| Other |
962 | 1,312 | ||||||
| Deferred tax assets before valuation allowance |
16,752 | 19,685 | ||||||
| Valuation allowance |
(1,986 | ) | (1,940 | ) | ||||
| Deferred tax assets after valuation allowance |
14,766 | 17,745 | ||||||
| Deferred tax liabilities: |
||||||||
| Unrepatriated foreign earnings |
(1,622 | ) | (1,622 | ) | ||||
| Depreciation and amortization |
(1,311 | ) | (1,555 | ) | ||||
| Convertible debt interest |
(1,093 | ) | (2,156 | ) | ||||
| Other |
(230 | ) | (695 | ) | ||||
| Deferred tax liabilities |
(4,256 | ) | (6,028 | ) | ||||
| Net deferred tax assets |
$ | 10,510 | $ | 11,717 | ||||
At July 3, 2010 and June 27, 2009, $4.2 million and $6.4 million, respectively, of the Company’s net deferred tax assets were included on the Consolidated Balance Sheets in Other current assets, $6.6 million and $5.6 million, respectively, were included in Other non–current assets, and $0.2 million and $0.3 million, respectively, of deferred tax liabilities were included in Accrued expenses and other current liabilities.
A valuation allowance of approximately $2.0 million and $1.9 million existed as of July 3, 2010 and June 27, 2009, respectively, for certain tax credit carryforwards, capital loss carryforwards and foreign deferred tax assets due to the uncertainty surrounding the utilization of these deferred tax assets. During the years ended July 3, 2010 and June 27, 2009, the valuation allowance increased by less than $0.1 million and approximately $0.2 million, respectively. The increases were mainly due to increases in foreign net operating loss carryforwards and uncertainty surrounding the utilization of such carryforwards. Management believes that it is more likely than not that the Company will realize the benefits of the Company’s net deductible temporary differences, net of the valuation allowance.
The Company is required to recognize a valuation allowance for all or a portion of its deferred tax assets if it believes that it is more likely than not, given the weight of all available evidence, that all or a portion of its deferred tax assets will not be realized. Management assesses the realizability of the deferred tax assets at each interim and annual balance sheet date based on actual and forecasted operating results. The Company assessed both its positive and negative evidence to determine the proper amount of its required valuation allowance. The recognition of a valuation allowance for deferred tax assets is based on the assessment of whether it is more likely than not that the Company will be able to realize its deferred tax assets within statutory carryforward periods.
72
Table of Contents
The factors that the Company considered in assessing the likelihood of realization of the deferred tax assets include: the Company’s past operating results; the nature and existence of cumulative losses in recent years, which were principally due to a non-recurring goodwill impairment charge in fiscal 2009, acquisition and business realignment charges and non-cash amortization of convertible debt; the forecast of future taxable income; the reversal of taxable temporary differences; excess of appreciated asset value over the basis of net assets; the duration of statutory carryforward periods of net operating losses and tax credits; the Company’s positive experience with U.S. net operating loss carryforwards not expiring unused; and available tax planning strategies that could be implemented to realize a portion of the deferred tax assets. As a result of the review of the quantitative and qualitative information, the Company concluded that sufficient positive evidence outweighs the negative evidence from recent losses to determine that it is more likely than not the Company will realize its remaining deferred tax assets not already subject to a valuation allowance. Adjustments to the valuation allowance may be made in the future if it is determined that the realizable amount of net operating losses and other deferred tax assets is greater or less than the amount recorded. Such adjustments may be material to the Company’s financial position, and results of operations.
At July 3, 2010, the Company’s net U.S. domestic deferred tax assets amounted to approximately $10.6 million. Management has considered the realizability of the deferred tax assets and has concluded that a domestic valuation allowance of approximately $1.4 million should be recorded, mainly related to certain tax credit carryforwards that are not anticipated to be realized. Although management determined that a valuation allowance was not required with respect to the remaining net U.S. domestic deferred tax assets, realization of these assets is primarily dependent on achieving the forecast of future taxable income, as well as prudent and feasible tax planning strategies.
The Company based its forecast of future taxable income on actual taxable income achieved in fiscal 2010 following business realignment activities, excluding any future growth in revenues attributable to an economic recovery. Unexpected decreases in revenues below levels achieved in fiscal 2010, or an inability to sustain cost reductions achieved, or unanticipated future business realignment or other charges would adversely affect the forecast of future taxable income and may result in the need for an additional valuation allowance which could be material. At July 3, 2010, the Company requires approximately $38 million in cumulative future taxable income to be generated at various times in the future to realize the net U.S. domestic deferred tax assets. Based upon the Company’s forecast of future taxable income, the U.S. domestic net operating loss carryforwards and federal tax credit carryforwards would be fully utilized before expiration. If required, the Company also has prudent and feasible tax planning strategies that have been and may be used to prevent net operating loss carryforwards and tax credit carryforwards from expiring unused and prolong their lives.
Historically, it has been the practice of the Company to reinvest unremitted earnings of foreign subsidiaries. In a previous fiscal year, however, the Company determined that it would repatriate approximately $7.0 million in future periods from its foreign subsidiaries. The Company believes repatriation of these earnings will result in additional taxes in the amount of $1.6 million and provided for that amount in the Consolidated Balance Sheet. The cumulative amount of all other undistributed earnings of consolidated foreign subsidiaries, for which U.S. federal income tax has not been provided, was approximately $10.6 million and $10.9 million at July 3, 2010 and June 27, 2009, respectively. These earnings, which reflect full provision for non-U.S. income taxes, are anticipated to be reinvested permanently outside the United States. Determining the U.S. income tax liability that might result if these earnings were remitted is not practicable.
73
Table of Contents
At July 3, 2010, the Company had the following tax attribute carryforwards (in millions):
| Tax Attribute |
Begins to Expire | ||||
| U.S. Federal net operating loss carryforwards (self-generated) |
$ | 1.5 | Fiscal 2027 | ||
| U.S. State net operating loss carryforwards (self-generated) |
2.7 | Fiscal 2015 | |||
| U.S. State net operating loss carryforwards (acquired) |
6.4 | Fiscal 2013 | |||
| Foreign net operating loss carryforwards (self-generated) |
1.4 | Fiscal 2014 | |||
| Foreign tax credit carryforwards (self-generated) |
1.2 | Fiscal 2013 | |||
| U.S. State tax credit carryforwards (self-generated) |
3.6 | Fiscal 2017 | |||
| U.S. State tax credit carryforwards (acquired) |
1.2 | Fiscal 2013 | |||
| U.S. general business tax credit carryforwards (self-generated) |
4.9 | Fiscal 2019 | |||
| U.S. general business tax credit carryforwards (acquired) |
0.9 | Fiscal 2018 | |||
The Company operates in multiple taxing jurisdictions, both within and outside the United States. At July 3, 2010 and June 27, 2009, the total amount of unrecognized tax benefits related to federal, state and foreign taxes and accrued interest was approximately $10.4 million and $10.8 million, respectively, of which all would impact the effective tax rate if recognized. As of July 3, 2010, the Company has approximately $10.4 million of unrecognized tax benefits, of which, approximately $1.3 million are reflected as a non-current liability and approximately $9.1 million are reflected as a reduction of gross deferred tax assets.
The Company believes it is reasonably possible that approximately $0.1 million of net unrecognized tax benefits will be recognized during the next twelve months due to the expiration of the statute of limitations and impact the Company’s effective tax rate.
The Company files income tax returns in the U.S., various states and in foreign jurisdictions. For federal and foreign income tax purposes, the fiscal 2007 through 2010 tax years remain open for examination by the tax authorities. For state tax purposes, (principally California and New York) fiscal 2006 through 2010 tax years remain open for examination by the tax authorities.
The aggregate changes in the balance of unrecognized tax benefits for the years ended July 3, 2010 and June 27, 2009 were as follows (in thousands):
| July 3, 2010 |
June 27, 2009 |
|||||||
| Beginning balance |
$ | 10,802 | $ | 10,409 | ||||
| Additions for current year tax positions |
144 | 236 | ||||||
| Additions for prior year tax positions |
— | 393 | ||||||
| Reduction of tax related to expiration of statute of limitations |
(482 | ) | (222 | ) | ||||
| Reduction of interest related to expiration of statute of limitations |
(31 | ) | (33 | ) | ||||
| Additional interest |
14 | 19 | ||||||
| Ending balance |
$ | 10,447 | $ | 10,802 | ||||
In accordance with the Company’s accounting policy, interest expense and penalties related to income taxes are and have been included in the income tax expense line of the Company’s Consolidated Statement of Operations. The Company recognizes interest and, if applicable, penalties which could be assessed related to unrecognized tax benefits in income tax expense. For the years ended July 3, 2010 and June 27, 2009, the Company recognized less than $0.1 million for interest expense related to uncertain tax positions. As of July 3, 2010 and June 27, 2009, the total amount of accrued interest and penalties, before federal and, if applicable, state effect, was also less than $0.1 million. The Company made no accrual for penalties related to income tax positions.
74
Table of Contents
12. Debt and Capital Leases
Credit Agreement
On March 30, 2007, the Company entered into a $40.0 million senior, secured, four-year credit agreement with the lenders listed therein and Manufacturers and Traders Trust Company (“M&T Bank”), as administrative agent for such lenders (the “Prior Credit Agreement”), which replaced an existing credit facility. The terms of the Prior Credit Agreement provided LeCroy with a $40.0 million revolving credit facility (“Revolver”), which includes a $5.0 million swingline loan subfacility and a $5.0 million letter of credit subfacility. The performance by LeCroy of its obligations under the Prior Credit Agreement is secured by all of the domestic assets of LeCroy and its domestic subsidiaries, and is guaranteed by LeCroy’s domestic subsidiaries.
Effective as of April 26, 2007, LeCroy entered into a First Modification and Lender Joinder Agreement (“Joinder Agreement”). This Joinder Agreement increased the Company’s credit limit to $50.0 million and added Capital One Bank (formerly North Fork Bank) to the Prior Credit Agreement. On May 7, 2008, the Company entered into a Second Modification Agreement to modify certain financial and negative covenants of its Prior Credit Agreement and on May 4, 2009 the Company entered into a Third Modification Agreement to further modify certain financial and negative covenants, as well as the effective interest rates, of its Prior Credit Agreement.
The Company had $17.0 million and $17.5 million of outstanding borrowings against the Revolver as of July 3, 2010 and June 27, 2009, respectively. The Company did not have any borrowings against the letter of credit subfacility or the swingline loan subfacility as of July 3, 2010 and June 27, 2009.
Borrowings under the Prior Credit Agreement, bear interest at variable rates, based upon LeCroy’s senior leverage ratio, equal to, at the Company’s election, (1) the higher of (a) the prime rate or (b) the federal funds rate plus 0.5%, or (c) one-month London Interbank Offering Rate (“LIBOR”) as defined in the Prior Credit Agreement, plus an applicable margin of between 1.75% and 2.75%, or (2) LIBOR plus an applicable margin of between 2.75% and 3.75%. The Prior Credit Agreement provides for a LIBOR floor of 1.50% and requires the Company to pay commitment fees on unused revolver borrowings during the term of the Prior Credit Agreement at rates between 0.25% and 0.5% dependent upon its senior leverage ratio.
The Prior Credit Agreement contains, among other things, conditions precedent, covenants, representations and warranties and events of default. Negative covenants include certain restrictions or limitations on, among other things, the incurrence of indebtedness; liens; consolidations and mergers; investments, loans, advances, guarantees and acquisitions; sales of assets, subject to customary exceptions for sales of inventory in the ordinary course and sales of equipment in connection with the replacement thereof in the ordinary course; sale and lease-back transactions; hedging agreements; and restricted payments, including repurchase of a portion of the Convertible notes not to exceed $50.0 million of face value or $26.0 million of cash, dividends and stock repurchases. As of July 3, 2010, the Company had the ability to repurchase up to an additional approximate $17.7 million face value, utilizing up to approximately $5.4 million of cash.
The Company is required to comply with certain financial covenants, measured quarterly, including: a minimum interest coverage ratio; minimum total net worth, which includes deferred tax assets; maximum leverage ratio; minimum fixed charge coverage ratio; and limitations on capital expenditures. As of July 3, 2010, the Company was in compliance with its financial covenants under the Prior Credit Agreement.
The Company incurred approximately $0.2 million of financing costs in connection with entering into the Third Modification Agreement. Total financing costs in connection with the Prior Credit Agreement were approximately $0.8 million, which were deferred and are being amortized, on a straight line basis, over the term of the Prior Credit Agreement. At July 3, 2010, approximately $0.2 million of deferred financing costs were included in Other current assets and less than $0.1 million were included in Other non-current assets.
The Prior Credit Agreement would have expired on July 15, 2011, unless, in the absence of any default, extended by LeCroy to April 1, 2012, contingent on the waiver or extension of the first redemption date of the
75
Table of Contents
Company’s Convertible notes. On July 29, 2010, LeCroy Corporation entered into an Amended and Restated $50.0 million Senior Secured Credit agreement (the “New Credit Agreement”). The New Credit Agreement allows for the repayment of the Convertible notes in fiscal 2012 and extends the expiration date of the agreement to fiscal 2014. It is the Company’s intention to repay the Convertible notes in fiscal 2012 through a combination of cash generated from operations, working capital and new secured bank debt and will also include possible future financing sources such as: (i) the sale or monetization of certain assets; (ii) new unsecured debt and additional amendments to existing debt; and (iii) issuance of equity and/or equity-like securities. (See Note 23 — Subsequent Events for additional information.)
Convertible Debt
On October 12, 2006, the Company sold and issued $72.0 million in convertible senior subordinated notes to qualified institutional buyers pursuant to Rule 144A of the Securities Act of 1933, as amended (the “Notes”). The Notes bear interest at a rate of 4.00% per annum, payable in cash semi-annually in arrears on each April 15 and October 15, beginning April 15, 2007. The Notes are direct, unsecured, senior subordinated obligations of the Company and rank: (i) subordinate in right of payment to all of the Company’s existing and future secured indebtedness; (ii) equal in right of payment with all of the Company’s existing and future senior unsecured indebtedness, and (iii) senior in right of payment to all of the Company’s existing and future subordinated indebtedness, except that the Notes ranked equally with the $3.5 million note issued in connection with the Catalyst acquisition, which was fully repaid in fiscal 2008. In connection with the issuance and sale of the Notes, the Company entered into an indenture dated as of October 12, 2006, with U.S. Bank National Association as trustee. The terms of the Notes are governed by the indenture.
The Notes mature on October 15, 2026 unless earlier redeemed, repurchased or converted. Holders of the Notes will have the right to require the Company to repurchase for cash all or a portion of their Notes on each of October 15, 2011, October 15, 2016 and October 15, 2021, at a repurchase price equal to 100% of the principal amount of the Notes to be repurchased plus accrued and unpaid interest, if any, up to but not including, the repurchase date. The Company may, from time to time, at its option repurchase the Notes in the open market. In addition, the Company may redeem the Notes for cash, either in whole or in part, anytime after October 20, 2011 at a redemption price equal to 100% of the principal amount of the Notes to be redeemed plus accrued and unpaid interest, if any, up to but not including the redemption date. The Notes are convertible into Company common stock by the holders at an initial conversion rate equal to 68.7285 shares per $1,000 principal amount of the Notes, equal to an initial conversion price of approximately $14.55 per share, subject to adjustment as described in the indenture. Upon conversion, the Company will deliver for each $1,000 principal amount of Notes, an amount consisting of cash equal to the lesser of $1,000 and the conversion value, as defined in the indenture and, to the extent that the conversion value exceeds $1,000, at the Company’s election, cash or shares of Company common stock in respect of the remainder. Prior to September 15, 2026, holders may convert their notes into cash and shares of the Company’s common stock, if any, at the applicable conversion rate, at their option, only under limited circumstances described in the indenture. On or after September 15, 2026, holders may convert their notes into cash and shares of the Company’s common stock, if any, at the applicable conversion price, at the Company’s option, at any time prior to the close of business on the business day immediately preceding the maturity date. Upon conversion of each $1,000 principal amount of the notes, the holder will receive an amount in cash equal to the lesser of (i) $1,000 or (ii) the conversion value, as described in the indenture; if the conversion value exceeds $1,000 on the conversion date, the Company will also deliver, at the Company’s election, cash or common stock or combination of each with a value equal to such excess.
The Company evaluated the accounting for the conversion feature at the date of issuance of the Notes and determined that the conversion feature would be equity-classified if it were a stand-alone instrument, and, therefore, it did not need to be accounted for separately from the Notes.
If the Company undergoes a “change in control”, as defined in the indenture, holders of the Notes will have the right, subject to certain conditions, to require the Company to repurchase for cash all or a portion of their Notes at a repurchase price equal to 100% of the principal amount of the Notes to be repurchased plus accrued and unpaid interest, if any.
76
Table of Contents
In connection with the sale of its Notes, the Company also entered into a Registration Rights Agreement. Pursuant to the Registration Rights Agreement, the Company filed a shelf registration statement, which has been declared effective by the Securities and Exchange Commission, covering resales by holders of the Notes and any common stock issuable upon conversion of such Notes, subject to certain conditions specified in the Registration Rights Agreement. The Company agreed to use its commercially reasonable efforts to keep the registration statement effective until the earliest of the following has occurred: (i) all securities covered by the registration statement have been sold pursuant to the registration statement or Rule 144 under the Securities Act; (ii) the holders of the Notes and the shares of the Company’s common stock issuable upon conversion of the Notes that are not affiliates are able to sell all such securities immediately pursuant to Rule 144(k) under the Securities Act; (iii) the date when all of the Notes and shares of common stock issuable upon conversion have ceased to be outstanding; and (iv) October 12, 2008. No amounts are owed, nor have any been recorded for failure to maintain the effectiveness of the registration statement.
As of July 3, 2010 and June 27, 2009, the market value of the Convertible notes was approximately $37.5 million and $27.7 million, respectively. Fair value is determined through information obtained from a third party using the latest available market data.
Accounting for Convertible Debt Instruments
During the first fiscal quarter of 2010, ending on October 3, 2009, LeCroy was required to adopt new accounting guidance which requires issuers of certain types of convertible notes to separately account for the liability and equity components of such convertible notes in a manner that reflects the entity’s nonconvertible debt borrowing rate when interest cost is recognized in subsequent periods. Prior to adoption, the liability of the Convertible notes was carried at its principal value and only the contractual interest expense was recognized in LeCroy’s Consolidated Statements of Operations. Because the new guidance requires retrospective application, LeCroy was required to adjust all periods for which the Convertible notes were outstanding prior to the date of adoption.
Upon adoption and effective as of the issuance date of the Convertible notes, LeCroy recorded approximately $17.9 million of the principal amount to equity, representing a debt discount for the difference between LeCroy’s estimated nonconvertible debt borrowing rate of 10.5% at the time and the 4.0% coupon rate of the Convertible notes. This debt discount is amortized as interest expense over the contractual term of the notes using the effective interest method. In addition, LeCroy allocated approximately $0.7 million of the issuance costs to the equity component of the Convertible notes and approximately $2.3 million of the issuance costs to the debt component of the Convertible notes. The issuance costs were allocated pro rata based on the initial allocation of debt and equity components. The approximate $2.3 million of debt issuance costs allocated to the debt component is amortized as interest expense over the contractual term of the Convertible notes using the effective interest method, while the portion allocated to the equity component was charged to Additional paid-in capital at issuance date. The term of the Convertible notes for amortization purposes is considered to be five years, as that is the first period in which the redemption feature of the Notes can be executed by either the Noteholders or LeCroy and therefore is considered the mandatory redemption date. As of July 3, 2010 and June 27, 2009, approximately $0.4 million and $0.8 million, respectively, of unamortized fees related to the Notes were included in Other non-current assets on the Consolidated Balance Sheet.
The Company also retroactively applied the derecognition guidance. Upon repurchase, the fair value of the liability component immediately prior to extinguishment was measured first and the difference between the fair value of the aggregate consideration paid and the fair value of the liability component was attributed to the reacquisition of the equity component.
77
Table of Contents
Below is a summary of the Company’s repurchases for the fiscal years ended July 3, 2010, June 27, 2009 and June 28, 2008 (in thousands):
| July 3, 2010 |
June 27, 2009 As adjusted |
June
28, 2008 As Adjusted | |||||||
| Face value repurchased |
$ | 8,700 | $ | 19,150 | $ | 4,500 | |||
| Gain on extinguishment of convertible debt, net of issue cost write-off |
761 | 9,627 | 292 | ||||||
The carrying amount of the equity component of the Convertible notes and the principal amount, unamortized discount and net carrying amount of the liability component of the Convertible notes as of July 3, 2010 and June 27, 2009 were as follows (in thousands):
| July 3, 2010 |
June 27, 2009 (As adjusted) |
|||||||
| Equity component of Convertible notes |
$ | 8,493 | $ | 8,849 | ||||
| Principal amount of Convertible notes |
$ | 39,650 | $ | 48,350 | ||||
| Unamortized discount of Convertible notes |
(3,044 | ) | (6,277 | ) | ||||
| Liability component of Convertible notes |
$ | 36,606 | $ | 42,073 | ||||
The effective interest rate, contractual interest expense and amortization of debt discount for the Convertible notes for fiscal years ended 2010, 2009 and 2008 were as follows:
| July 3, 2010 (53 weeks) |
June 27, 2009 (As Adjusted) (52 weeks) |
June 28,
2008 (As Adjusted) (52 weeks) |
||||||||||
| Effective interest rate |
10.5 | % | 10.5 | % | 10.5 | % | ||||||
| (in thousands): |
||||||||||||
| Interest expense — contractual |
$ | 1,772 | $ | 2,310 | $ | 2,867 | ||||||
| Amortization of debt discount |
$ | 2,287 | $ | 2,872 | $ | 3,083 | ||||||
78
Table of Contents
Retrospective Adoption
The retrospective adoption of the new convertible debt accounting guidance resulted in the following adjustments to the Company’s Consolidated Balance Sheet as of June 27, 2009:
| As of June 27, 2009 | ||||||||||||
| (in thousands): |
As Previously Reported |
Adjustments | As Adjusted |
|||||||||
| Current assets |
$ | 78,173 | $ | 78,173 | ||||||||
| Property, plant and equipment, net |
21,817 | 21,817 | ||||||||||
| Intangible assets, net |
502 | 502 | ||||||||||
| Other non-current assets |
9,545 | (2,359 | )(1) | 7,186 | ||||||||
| Total assets |
$ | 110,037 | $ | (2,359 | ) | $ | 107,678 | |||||
| Current liabilities |
$ | 27,152 | $ | $ | 27,152 | |||||||
| Long-term bank debt |
17,500 | 17,500 | ||||||||||
| Convertible notes, net of unamortized discount |
48,350 | (6,277 | )(2) | 42,073 | ||||||||
| Deferred revenue and other non-current liabilities |
3,635 | 3,635 | ||||||||||
| Total liabilities |
96,637 | (6,277 | ) | 90,360 | ||||||||
| Commitments and contingencies |
||||||||||||
| Common stock |
129 | 129 | ||||||||||
| Additional paid-in capital |
117,055 | 8,849 | (3) | 125,904 | ||||||||
| Accumulated other comprehensive income |
1,862 | 1,862 | ||||||||||
| Accumulated deficit |
(102,548 | ) | (4,931 | )(4) | (107,479 | ) | ||||||
| Treasury stock, at cost |
(3,098 | ) | (3,098 | ) | ||||||||
| Total stockholders’ equity |
13,400 | 3,918 | 17,318 | |||||||||
| Total liabilities and stockholders’ equity |
$ | 110,037 | $ | (2,359 | ) | $ | 107,678 | |||||
The retrospective adoption of the new convertible debt accounting guidance resulted in the following adjustments to the Company’s Consolidated Statements of Operations in fiscal 2009 (52 weeks):
| Year ended June 27, 2009 | |||||||||||
| (in thousands): |
As Previously Reported |
Adjustments | As Adjusted |
||||||||
| Total revenues |
$ | 133,967 | $ | 133,967 | |||||||
| Costs and expenses |
247,211 | 247,211 | |||||||||
| Operating loss |
(113,244 | ) | (113,244 | ) | |||||||
| Gain on the extinguishment of convertible debt, net of issue cost write-off |
9,606 | 21 | (5) | 9,627 | |||||||
| Interest income |
90 | 90 | |||||||||
| Interest expense |
(3,554 | ) | 111 | (6) | (3,443 | ) | |||||
| Amortization of debt discount on convertible notes |
— | (2,872 | )(7) | (2,872 | ) | ||||||
| Other, net |
260 | 260 | |||||||||
| Loss before income taxes |
(106,842 | ) | (2,740 | ) | (109,582 | ) | |||||
| Benefit for income taxes |
(192 | ) | (973 | )(8) | (1,165 | ) | |||||
| Net loss |
(106,650 | ) | (1,767 | ) | (108,417 | ) | |||||
| Net loss per share — basic |
$ | (8.89 | ) | (0.14 | ) | $ | (9.03 | ) | |||
| Net loss per share — diluted |
$ | (8.89 | ) | (0.14 | ) | $ | (9.03 | ) | |||
79
Table of Contents
The retrospective adoption of the new convertible debt accounting guidance resulted in the following adjustments to the Company’s Consolidated Statements of Operations in fiscal 2008 (52 weeks):
| Year ended June 28, 2008 | |||||||||||
| (in thousands): |
As Previously Reported |
Adjustments | As Adjusted |
||||||||
| Total revenues |
$ | 160,486 | $ | 160,486 | |||||||
| Costs and expenses |
154,391 | 154,391 | |||||||||
| Operating income |
6,095 | 6,095 | |||||||||
| Gain on the extinguishment of convertible debt, net of issue cost write-off |
338 | (46 | )(5) | 292 | |||||||
| Interest income |
298 | 298 | |||||||||
| Interest expense |
(4,331 | ) | 203 | (6) | (4,128 | ) | |||||
| Amortization of debt discount on convertible notes |
— | (3,083 | )(7) | (3,083 | ) | ||||||
| Other, net |
(632 | ) | (632 | ) | |||||||
| Income (loss) before income taxes |
1,768 | (2,926 | ) | (1,158 | ) | ||||||
| Provision (benefit) for income taxes |
56 | (1,039 | )(8) | (983 | ) | ||||||
| Net income (loss) |
1,712 | (1,887 | ) | (175 | ) | ||||||
| Net income (loss) per share — basic |
$ | 0.15 | (0.16 | ) | $ | (0.01 | ) | ||||
| Net income (loss) per share — diluted |
$ | 0.14 | (0.15 | ) | $ | (0.01 | ) | ||||
| (1) | This amount represents the cumulative adjustments to debt issuance costs associated with the Convertible notes and the cumulative impact on the net deferred tax asset related to the amortization of the debt discount. |
| (2) | This amount represents the remaining unamortized debt discount on the Convertible notes. |
| (3) | This amount represents the equity component of the Convertible notes, net of tax adjustments, due to the amortization of the debt discount. |
| (4) | This amount represents the cumulative net loss impact of the amortization of debt discount, adjustments to debt issuance costs (see explanation (1) above), the adjustment to the gain on the extinguishment of convertible debt, net of issue cost write-off (see explanation (6) below) and the associated tax adjustments since inception of the Convertible notes. |
| (5) | This amount represents the adjustment to the gain on the extinguishments of debt, net of issue cost write-off in accordance with the derecognition guidance. |
| (6) | This amount represents a decrease in interest expense associated with the debt issuance costs, as a portion was written-off to Additional paid-in capital at issue date and a portion is written off at each extinguishment date. |
| (7) | This amount represents the amortization of the debt discount. |
| (8) | This amount represents the tax effect of the amortization of the debt discount, debt issuance costs and gain on extinguishment of debt, net of issue cost write-off. |
LeCroy’s retrospective adoption does not affect the Company’s balance of Cash and cash equivalents and as a result did not change its Net cash flows from operating, investing or financing activities in its Consolidated Statement of Cash Flows for the fiscal years ended 2009 and 2008.
80
Table of Contents
The retrospective adoption resulted in the following adjustments to our Consolidated Statements of Stockholders’ Equity:
| (in thousands) |
Additional Paid-In Capital |
Retained Earnings (Accumulated Deficit) |
||||||
| Balance at June 30, 2007, as reported |
$ | 108,713 | $ | 2,486 | ||||
| Equity component of Convertible notes |
17,929 | |||||||
| Equity component of debt issuance costs |
(748 | ) | ||||||
| Amortization of debt discount |
(2,077 | ) | ||||||
| Amortization of debt issuance costs, net of reversal of previously recorded amortization of debt issuance costs |
97 | |||||||
| Tax adjustments |
(6,099 | ) | 703 | |||||
| Balance at June 30, 2007, as adjusted |
119,795 | 1,209 | ||||||
| Fiscal 2008 equity activity, as reported |
4,980 | 1,616 | ||||||
| Reacquisition of conversion option |
(739 | ) | ||||||
| Amortization of debt discount |
(3,083 | ) | ||||||
| Amortization of debt issuance costs, net of reversal of previously recorded amortization of debt issuance costs |
203 | |||||||
| Gain on extinguishment of convertible debt, net of issue cost write-off, net of reversal of previously recorded gain on extinguishment of convertible debt, net of issue cost write-off |
(46 | ) | ||||||
| Tax adjustments |
262 | 1,039 | ||||||
| Balance at June 28, 2008, as adjusted |
124,298 | 938 | ||||||
| Fiscal 2009 equity activity, as reported |
3,362 | (106,650 | ) | |||||
| Reacquisition of conversion option |
(2,722 | ) | ||||||
| Amortization of debt discount |
(2,872 | ) | ||||||
| Amortization of debt issuance costs, net of reversal of previously recorded amortization of debt issuance costs |
111 | |||||||
| Gain on extinguishment of convertible debt, net of issue cost write-off, net of reversal of previously recorded gain on extinguishment of convertible debt, net of issue cost write-off |
21 | |||||||
| Tax adjustments |
966 | 973 | ||||||
| Balance at June 27, 2009, as adjusted |
$ | 125,904 | $ | (107,479 | ) | |||
Upon the adoption of the new convertible debt accounting guidance and effective as of the issuance date of the Convertible notes, LeCroy recorded, as adjustments to additional paid-in capital, deferred taxes for the differences between the carrying value and tax basis that resulted from allocating approximately $17.9 million of the principal amount of Convertible notes and approximately $0.7 million of the associated issuance costs to equity. In subsequent periods, the Company recorded adjustments to the deferred taxes to reflect the tax effect of the amortization of the debt discount, debt issuance costs and gains on the extinguishments of Convertible notes, net of issue cost write-offs.
Foreign Credit Facilities
The Company maintains certain short-term foreign credit facilities. There was a Japanese facility totaling 50.0 million yen that was cancelled in the third quarter of fiscal 2009. No amounts were outstanding under this facility as of the time of cancellation and as of July 3, 2010. The Company’s Swiss subsidiary has an overdraft facility totaling 1.0 million Swiss francs or approximately $0.9 million as of July 3, 2010. As of July 3, 2010 and June 27, 2009, approximately 0.4 million Swiss francs were held against supplier obligations leaving an available balance of 0.6 million Swiss francs under this credit facility. These obligations to Swiss suppliers, such as rent and utilities, are payable under the credit facility only in the event that the subsidiary is unable to meet its financial obligations to those suppliers.
81
Table of Contents
Capital Lease Agreements
During fiscal 2005, the Company entered into vendor supplied capital lease agreements for technology rights of approximately $1.3 million. These leases bore interest at 4.5% to 4.88% and were fully paid by the first quarter of fiscal 2008.
During fiscal 2008, the Company acquired a software license under a capital lease agreement for approximately $0.7 million. The lease bears interest at 7.75% with a three-year term. At July 3, 2010, the Company’s outstanding balance under this agreement was approximately $0.1 million and was included in Accrued expenses and other current liabilities on the Consolidated Balance Sheet. Future minimum lease payments required during fiscal year 2011 are approximately $0.1 million.
13. Share-Based Compensation
Total share-based compensation expense recorded in the Consolidated Statements of Operations for the years ended July 3, 2010, June 27, 2009, and June 28, 2008 is approximately $4.4 million, $2.8 million, and $4.7 million, respectively.
Approximately less than $0.2 million, $0.1 million and less than $0.1 million of compensation cost was capitalized in inventory for the year ended July 3, 2010, June 27, 2009, and June 28, 2008, respectively.
Company Stock-Based Plans
The Company maintains share-based payment arrangements under the following plans: (i) the Amended and Restated 1993 Stock Incentive Plan (“1993 Plan”), (ii) the Amended and Restated 1995 Employee Stock Purchase Plan (“ESPP”), (iii) the Amended and Restated 1998 Non-Employee Director Stock Plan (“1998 Plan”), (iv) the 2003 Stock Incentive Plan (“2003 Plan”), (v) the 2004 Employment Inducement Stock Plan (“2004 Plan”), (vi) the LeCroy Corporation (CATC) Special 2000 Stock Option Plan, (vii) the LeCroy Corporation (CATC) 2000 Stock Incentive Plan, (viii) the LeCroy Corporation (CATC) 1994 Stock Option Plan (items (vi), (vii) and (viii) collectively the “LeCroy (CATC) Plans”), (ix) the LeCroy Catalyst 2005 Stock Option Plan, (x) the 2008 Stock Incentive Plan (“2008 Plan”), and (xi) the 2007 Stock Appreciation Right Plan (the “SAR Plan”). The Company has a policy of issuing new shares of its common stock to satisfy stock option exercises.
Shares available for grant as options under all Company stock-based plans were 2,114,018 and 1,668,345 at July 3, 2010 and June 27, 2009, respectively. These amounts include 711,452 and 93,230 shares at July 3, 2010 and June 27, 2009, respectively, under the ESPP Plan.
The 1993 Plan expired on January 4, 2003. All options outstanding under the 1993 Plan at the time of its expiration will continue in full force and effect in accordance with their terms. The lives of the options are generally ten years from the date of grant.
In October 1998, the Board of Directors and stockholders terminated the 1995 Non-Employee Director Stock Option Plan (“1995 Plan”) and adopted the 1998 Plan. Pursuant to the 1998 Plan, each non-employee director receives upon initial election to the Board of Directors either a stock option grant of 15,000 shares to vest ratably over 36 months, or a restricted stock award of 10,000 shares of common stock, subject to such vesting and other conditions and restrictions as the Board may determine at its discretion. A total of 500,000 shares of common stock can be issued during the term of the 1998 Plan. The 1998 Plan expires on October 27, 2010.
In fiscal 2009, the Compensation Committee of the Board of Directors revised the Board compensation such that each non-employee director will receive annually, at their election, an immediately vested restricted stock award and/or an immediately vested stock option award (using the Black Scholes valuation technique) equal to $85,000, based on the closing price of the Company’s stock on the Annual Shareholder Meeting date, rounded up or down to the nearest hundred shares. The compensation was effective for equity awards granted at the November 3, 2008 Annual Shareholder Meeting, which resulted in approximately 32,000 immediately vested options and
82
Table of Contents
approximately 57,000 of immediately vested restricted stock being granted to the non-employee directors. Additionally, each non-employee director receives upon initial election to the Board of Directors, either a stock option grant of 22,500 shares with an exercise price set as the date of the election, or 7,500 shares of restricted stock, as selected by the Board to vest over a three year period. As a result of a new board member being elected to the Board, the Company issued 7,500 shares of restricted stock in fiscal 2009. In fiscal 2010, the compensation for equity awards granted at the November 18, 2009 Annual Shareholder Meeting, which resulted in a total of approximately 121,000 immediately vested options and approximately 48,000 of immediately vested restricted stock being granted to the non-employee directors. The immediately vested restricted shares were granted out of the 2008 Plan.
The 2003 Plan provides for the grant of incentive stock options, nonqualified stock options and restricted stock awards to employees (including officers and employee directors) and consultants. Unless approved by stockholders owning a majority of shares present and entitled to vote at a duly convened meeting of stockholders of the Company, the purchase price of any option granted under the 2003 Plan may not be less than 100% of the fair value of the Company’s common stock on the date of grant. The aggregate number of shares of common stock that may be issued or transferred pursuant to options or restricted stock awards under the 2003 Plan is 1,560,167 shares. The 2003 Plan also allows for awards based on performance criteria. Such awards may then qualify as “performance-based compensation” under Section 162(m) of the Internal Revenue Code. The Compensation Committee of the Board of Directors administers the 2003 Plan and has the authority to determine the terms of such options or awards including the number of shares, exercise or purchase prices and times at which the options become and remain exercisable or restricted stock is no longer restricted. In fiscal 2010, 39,500 options have been granted under the 2003 Plan. There have been no performance-based awards granted under the 2003 Plan. The 2003 Plan expires on October 29, 2013.
In connection with the CATC Merger, on October 29, 2004, the Company’s Board of Directors approved the 2004 Plan to promote the interests of the Company and its stockholders by strengthening the Company’s ability to attract and induce persons to become employees of the Company, including certain of CATC’s employees. The adoption of the 2004 Plan did not require stockholder approval. The number of shares of LeCroy common stock that may be issued or transferred pursuant to options or restricted stock awards granted under the 2004 Plan is 750,000 shares. On October 29, 2004, the Company issued the following grants under the 2004 Plan: (i) 70,000 shares of restricted common stock to certain former officers of CATC, and (ii) options to purchase an aggregate of 230,984 shares of common stock to 61 former CATC employees who became non-officer employees of LeCroy (none of whom received an option grant of more than 20,000 shares). The options were issued with vesting periods of four to six years. On September 13, 2005, the Board of Directors resolved that no further grants would be made under the 2004 Plan. The 2004 Plan expires on October 29, 2014.
In connection with the CATC Merger, LeCroy assumed the LeCroy (CATC) Plans. On October 27, 2004, the Board of Directors of CATC approved technical amendments to each of the CATC Stock Plans in anticipation of their assumption by LeCroy pursuant to the CATC Merger including, without limitation, amendments reflecting that any stock option or other award granted thereunder would be exercisable for LeCroy common stock. On September 13, 2005, the Board of Directors resolved that no further grants would be made under the LeCroy (CATC) Plans.
In connection with the Catalyst Merger, LeCroy assumed Catalyst’s 2005 Stock Option Plan. On October 2, 2006, Catalyst stock option holders approved technical amendments to their stock option grants in anticipation of their assumption by LeCroy pursuant to the Catalyst Merger including, without limitation, amendments reflecting that any stock option or other award granted thereunder would be exercisable for LeCroy common stock. Upon completion of the Merger, each outstanding stock option issued by Catalyst was assumed by LeCroy and was converted into an option to purchase that number of shares of LeCroy common stock equal to the number of shares of Catalyst common stock purchasable pursuant to the Catalyst option immediately prior to the effective time of the merger, multiplied by the exchange ratio, rounded down to the nearest whole number of shares of LeCroy common stock. The exercise price per share was equal to the exercise price per share of Catalyst common stock divided by the exchange ratio, rounded up to the nearest whole cent. The Company’s assumption of the Catalyst issued options was treated as a modification of the terms of the original Catalyst grant. The same conversion formula was utilized
83
Table of Contents
to calculate the number of assumed options as was used in the Merger consideration and, as such, the aggregate fair value of Catalyst’s awards immediately prior to the Merger was substantially similar to the aggregate fair value of the LeCroy awards on the date of grant.
The 2008 Plan provides for the grant of incentive stock options, nonqualified stock options and restricted stock awards. The purchase price of any option granted under the 2008 Plan may not be less than 100% of the fair value of the Company’s common stock on the date of grant. The aggregate number of shares of common stock that may be issued or transferred pursuant to options or restricted stock awards under the 2008 Plan is 2,800,000 shares. The 2008 Plan also allows for awards based on performance criteria which awards may then qualify as “performance- based compensation” under Section 162(m) of the Internal Revenue Code. The Compensation Committee of the Board of Directors administers the 2008 Plan and has the authority to determine the terms of such options or awards including the number of shares, exercise or purchase prices and times at which the options become and remain exercisable or restricted stock is no longer restricted. In fiscal 2010, 9,000 options have been granted under the 2008 Plan. There have been no performance-based awards granted under the 2008 Plan. The 2008 Plan expires on September 22, 2015.
Stock Options
The fair value of options granted is estimated on the date of grant using a Black-Scholes option pricing model. Expected volatilities are calculated based on the historical volatility of the Company’s stock. Management monitors share option exercise and employee termination patterns to estimate forfeiture rates. Separate groups of employees that have similar historical exercise behavior are considered separately for valuation purposes. The Company analyzes its historical forfeiture rate, the remaining lives of unvested options and the amount of vested options as a percentage of total options outstanding. If the Company’s actual forfeiture rate is materially different from its estimate, or if the Company reevaluates the forfeiture rate in the future, the stock-based compensation expense could be significantly different from what was recorded in the current periods. The expected holding period of options represents the period of time that options granted are expected to be outstanding. The risk-free interest rate is based on the interest rate of a 5-year U.S. Treasury note in effect on the date of the grant or such other period that most closely equals the expected term of the option.
The table below presents the assumptions used to calculate the fair value of options granted during the fiscal years ended July 3, 2010, June 27, 2009, and June 28, 2008:
| Years Ended | ||||||
| July 3, |
June 27, |
June 28, | ||||
| Expected holding period (years) |
5.0 | 5.0 | 5.0 | |||
| Risk-free interest rate |
2.05% - 2.71% | 1.97% - 3.23% | 2.67% - 4.57% | |||
| Dividend yield |
0.0% | 0.0% | 0.0% | |||
| Expected volatility |
56.0% - 59.0% | 41.1% - 56.6% | 42.8% - 48.6% | |||
| Weighted average fair value of options granted |
$2.07 | $1.53 | $3.69 | |||
84
Table of Contents
Changes in the Company’s stock options for the fiscal year ended July 3, 2010 are as follows:
| Number of Shares |
Weighted Average Exercise Price |
Weighted Average Remaining Contractual Terms (Years) |
Aggregate Intrinsic Value ($000) | ||||||||
| Outstanding at June 27, 2009 |
2,426,394 | $ | 7.45 | ||||||||
| Granted |
169,929 | 4.13 | |||||||||
| Exercised |
(44,216 | ) | 1.71 | ||||||||
| Expired |
(192,525 | ) | 14.15 | ||||||||
| Forfeited |
(84,775 | ) | 3.62 | ||||||||
| Outstanding at July 3, 2010 |
2,274,807 | $ | 6.89 | 4.80 | $ | 2,351 | |||||
| Vested and expected to vest at July 3, 2010 |
2,197,860 | $ | 6.99 | 4.59 | $ | 2,279 | |||||
| Exercisable at July 3, 2010 |
1,287,765 | $ | 9.33 | 4.11 | $ | 1,027 | |||||
The total intrinsic value of stock options exercised during each of the years ended July 3, 2010, June 27, 2009, and June 28, 2008 was approximately $0.1 million, $0.1 million, and $0.3 million, respectively.
As of July 3, 2010, there was approximately $1.4 million, of unrecognized compensation cost (net of estimated forfeitures) related to stock options granted under the plans. That cost is expected to be recognized over a weighted-average period of approximately 2.6 years.
In fiscal 2010 there were approximately 121,000 of immediately vested options granted as part of the annual grant to non-employee directors. The remaining shares issued to employees had vesting periods of four years.
Non-Vested Stock
The fair value of new grants is determined based on the closing price on the date of grant. Related compensation expense is recognized ratably over the associated requisite service period, giving effect to estimated forfeitures. If the Company’s actual forfeiture rate is materially different from its estimate, or if the Company reevaluates the forfeiture rate in the future, the stock-based compensation expense could be significantly different from what was recorded in the current periods.
The following table summarizes transactions related to non-vested stock for the fiscal year ended July 3, 2010:
| Number of Shares |
Weighted Average Grant Date Fair Value | |||||
| Non-vested stock at June 27, 2009 |
251,784 | $ | 10.47 | |||
| Granted |
47,702 | $ | 3.92 | |||
| Vested |
(172,276 | ) | $ | 9.36 | ||
| Forfeited |
(6,619 | ) | $ | 10.00 | ||
| Non-vested stock at July 3, 2010 |
120,591 | $ | 9.44 | |||
Non-vested stock is included in the issued share number presented on the Consolidated Balance Sheets. Non-vested stock is not included in the weighted average share calculation for basic earnings per share. However, the dilutive effect of the non-vested stock is included in the weighted average share calculation for diluted earnings per share.
In fiscal 2010, immediately vested shares were granted to non-employee directors as part of the annual grant.
As of July 3, 2010, there was approximately $0.7 million of unrecognized compensation cost (net of estimated forfeitures) related to non-vested stock granted under the plans. That cost is expected to be recognized over a weighted-average period of approximately 1.3 years.
85
Table of Contents
Employee Stock Purchase Plan
The Company has an Employee Stock Purchase Plan (“ESPP”) with a look-back option that allows employees to purchase shares of common stock at 85% of the market value at the lower of either the date of enrollment or the date of purchase. Payment for the ESPP is a fixed amount, set at the beginning of the period, made through payroll withholding over the enrollment period of six months. The number of shares the participant can acquire is variable based on the fixed amount withheld and the applicable fair value. Since the ESPP includes a purchase price discount of greater than 5% and a look-back option, it is considered to be compensatory. The fair value of the “put” and “call” features of the estimated shares to be purchased are estimated at the beginning of the purchase period using a Black-Scholes option pricing model. Expected volatilities are calculated based on the historical six-month volatility of the Company’s stock. The expected holding period is equal to the six-month enrollment period. The risk-free interest rate is based on the interest rate of a six-month U.S. Treasury note in effect on the first day of the enrollment period. The fair value of the shares is liability classified until the end of the six-month period at which time the amount is then equity classified. As of July 3, 2010 and June 27, 2009, there is less than $0.1 million of liability classified share-based compensation expense for the ESPP included in Accrued expenses and other current liabilities on the Consolidated Balance Sheets.
The ESPP has reserved for issuance an aggregate of 1,860,000 shares of common stock and is set to expire on November 30, 2015. In fiscal 2010, 181,778 shares were issued under the ESPP.
Cash Settled Stock Appreciation Rights
On August 20, 2007, the Board of Directors adopted and approved the 2007 Stock Appreciation Right Plan (the “SAR Plan”). Under the SAR Plan, the Compensation Committee of the Board of Directors may award stock appreciation rights to eligible employees. Each stock appreciation right (“SAR”) awarded represents the right to receive an amount of cash equal to the excess of the fair market value of a share of the Company’s common stock on the date that a participant exercises such right over the fair market value of a share of the Company’ common stock on the date that such SAR was awarded. Awards of SARs will vest in four successive annual installments of 25% of the SARs subject to such award on the anniversary of the date of the grant of such award. The employee will have four years from the date of vesting of an installment in which to exercise such installment. The SAR Plan will terminate on August 20, 2017.
The fair value of SARs granted is estimated on the date of grant and remeasured at each reporting period using a Black-Scholes option pricing model. Expected volatilities are calculated based on the historical volatility of the Company’s stock. Management monitors award exercise and employee termination patterns to estimate forfeiture rates. If the Company’s actual forfeiture rate is materially different from its estimate, or if the Company reevaluates the forfeiture rate in the future, the stock-based compensation expense could be significantly different from what was recorded in the current periods. The expected holding period of SARs represents the period of time that SARs granted are expected to be outstanding. The risk-free interest rate is based on the interest rate of a U.S. Treasury note in effect on the date of the remeasurement for such period closest to the expected term of the SARs.
The Company records compensation expense ratably over the service period and adjusts for changes in the fair value of SARs at each reporting period. At July 3, 2010, there was approximately $3.2 million of unrecognized compensation cost (net of estimated forfeitures) related to SARs, which is expected to be recognized over a weighted average period of approximately 2.4 years.
The table below presents the assumptions used to remeasure the value of the SARs at each reporting period:
| July 3, 2010 |
June 27, 2009 | |||
| Expected holding period (years) |
3.7 | 4.4 | ||
| Risk-free interest rate |
1.01% - 1.60% | 1.40% - 2.53% | ||
| Dividend yield |
0.0% | 0.0% | ||
| Expected volatility |
58.00% - 67.88% | 56.91% - 61.53% | ||
| Weighted average fair value of SARs granted and outstanding |
$1.87 | $1.12 |
86
Table of Contents
The fair value of the SARs is liability classified because the awards are payable in cash. As of July 3, 2010 and June 27, 2009, there was approximately $2.7 million and $0.7 million, respectively, of liability classified share-based compensation expense for the SARs included in Accrued expenses and other current liabilities on the Consolidated Balance Sheet.
Changes in the Company’s SAR Plan for the fiscal year ended July 3, 2010 are as follows:
| Number of SARs |
Weighted Average Exercise Price |
Weighted Average Remaining Contractual Terms (Years) |
Aggregate Intrinsic Value ($000) | |||||||
| Outstanding at June 27, 2009 |
3,329,000 | $ | 6.81 | |||||||
| Granted |
— | — | ||||||||
| Exercised |
— | — | ||||||||
| Expired |
— | — | ||||||||
| Forfeited |
— | — | ||||||||
| Outstanding at July 3, 2010 |
3,329,000 | $ | 6.81 | 4.66 | $ | 778 | ||||
| Vested and expected to vest at July 3, 2010 |
3,224,998 | $ | 6.83 | 4.62 | $ | 740 | ||||
| Exercisable at July 3, 2010 |
985,250 | $ | 6.93 | 3.15 | $ | 195 | ||||
14. Common Stock and Treasury Stock
On May 25, 2006, the Company’s Board of Directors approved the adoption of a share repurchase plan authorizing the Company to purchase up to 2.0 million shares, not to exceed $25.0 million, of its common stock for treasury. The table below reflects share repurchase and retirement activity in fiscal 2010, 2009 and 2008:
| Years Ended | ||||||||
| July 3, 2010 |
June 27, 2009 |
June 28, 2008 | ||||||
| Shares repurchased |
— | 105,692 | 297,523 | |||||
| Amount paid for share repurchases (in thousands) |
— | $ | 685 | $ | 2,413 | |||
| Shares retired |
403,215 | — | — | |||||
Purchases under this buyback program may be made from time to time on the open market and in privately negotiated transactions, including pursuant to the terms of a 10b5-1 plan. A 10b5-1 plan allows a company to purchase shares during a blackout period, provided the company communicates its share purchase instructions to the broker prior to the blackout period, pursuant to a written plan that may not be changed. The timing of these purchases is dependent upon several factors, including market conditions, the market price of the Company’s common stock, the effect of the share dilution on earnings, available cash and any other potential risks the Company may encounter. The share repurchase plan may be discontinued at any time at the discretion of the Company.
The terms of our New Credit Agreement prohibits the Company from repurchasing shares or paying dividends on LeCroy’s common stock without the prior consent of lenders.
87
Table of Contents
15. Net Loss Per Common Share (EPS)
Basic net loss per common share is net loss divided by the weighted average of common shares outstanding during the period. The following is a presentation of the numerators and the denominators of the basic and diluted net loss per common share computations for the years ended July 3, 2010, June 27, 2009 and June 28, 2008 (in thousands):
| Years Ended | |||||||||
| June 27, 2009 |
June 27, 2009 As Adjusted |
June 28, 2008 As Adjusted | |||||||
| Numerator: |
|||||||||
| Net loss |
$ | 257 | $ | 108,417 | $ | 175 | |||
| Denominator: |
|||||||||
| Weighted average shares outstanding: |
|||||||||
| Basic |
12,425 | 12,003 | 11,749 | ||||||
| Employee stock options and non-vested stock |
— | — | — | ||||||
| Diluted(1) |
12,425 | 12,003 | 11,749 | ||||||
| (1) | Diluted net income per common share is calculated using the weighted average of common shares outstanding adjusted to include the effect of shares from the assumed exercise of dilutive stock options, convertible debt, if dilutive, and non-vested stock using the treasury stock method and is not applicable due to the net loss in each period. |
The computations of diluted EPS for the years ended July 3, 2010, June 27, 2009 and June 28, 2008 do not include approximately 1.9 million, 1.9 million and 1.7 million, respectively, of stock options and non-vested stock, as the effect of their inclusion would have been anti-dilutive to EPS. Additionally, the Convertible notes had no impact on diluted EPS because the average share price during the fiscal years was below $14.55 per share, the initial conversion price, and accordingly, the Convertible notes, if converted, would have required only cash at settlement.
16. Stockholder Rights Plan
On November 2, 1998, the Company’s Board of Directors declared a dividend distribution of one right in respect to each share of LeCroy’s common stock outstanding at the record date, November 18, 1998. The rights had been traded together with the common stock and were not exercisable or separately tradable. The rights were exercisable if a person or group acquired 15% or more of the Company’s common stock or announced a tender offer. Right holders, other than the acquiring person or group, were then entitled to purchase an amount of the Company’s common stock at a 50% discount to the share price at that time. The number of shares of common stock that a right holder was entitled to purchase was based on the exercise price. Under certain circumstances, the right entitled the stockholder to buy shares in an acquiring entity at a discount.
The Board of Directors could have redeemed the rights at a price of $0.001 per right up until 10 days following a public announcement that any person or group had acquired 15% or more of LeCroy’s common stock. These rights have expired on November 2, 2008, and no new plan has been implemented as of July 3, 2010. The rights plan had no impact on the financial position or results of operations of the Company.
17. Employee Benefit Plans
Domestic Plan
The Company has a discretionary employee 401(k) savings plan for eligible U.S. employees under which the Company contributes an unconditional match of up to 50% of employee contributions up to a maximum employer contribution of 5% of the employee’s eligible compensation, as defined. Effective in the third quarter of fiscal 2009, as a result of the weakening economic conditions, the Company temporarily suspended its 401(k) contribution
88
Table of Contents
matching program in an effort to reduce costs. The Company will review its decision to reinstate the 401(k) match when economic conditions improve. For fiscal 2010, 2009 and 2008, the Company expensed zero, approximately $0.3 million and $0.5 million, respectively, in matching contributions to this plan.
International Plans
Switzerland
The Company’s subsidiary in Switzerland sponsors a pension plan covering thirty-seven employees and seven former employees as of July 3, 2010. The plan requires employee contributions based upon a percentage of the employee’s earnings, as defined, currently ranging from 4.6% to 8.4%. The Company makes a matching contribution that is also based on a percentage of the employee’s earnings, as defined, currently ranging from 5.4% to 9.6%. For fiscal 2010, 2009 and 2008, the Company has made approximately $0.4 million, $0.5 million and $0.5 million, respectively, in matching contributions to this plan. As of July 3, 2010 expected employer contributions for fiscal 2011 are approximately $0.4 million.
In the fourth quarter of fiscal 2010, the Company applied the provisions under defined benefit pension plan accounting to its Swiss plan, which was previously accounted for as a defined contribution plan. Under Swiss Law, there is a guaranteed minimum benefit requirement which must be valued as a defined benefit obligation for U.S. GAAP purposes. The results did not have a material impact on the Company’s consolidated financial position or results of operations for each of the years presented. As of July 3, 2010 and June 27, 2009, the Company had an accrued pension liability of less than $0.1 million which was recorded in Deferred revenue and other non-current liabilities on the Consolidated Balance Sheets.
Information regarding the Company’s Swiss defined benefit pension plan is as follows (in thousands):
| Years Ended | ||||||||
| July 3, 2010 |
June 27, 2009 |
|||||||
| Change in projected benefit obligation: |
||||||||
| Beginning of year |
$ | 8,705 | $ | 10,398 | ||||
| Service cost |
261 | 371 | ||||||
| Interest cost |
292 | 332 | ||||||
| Participant contributions |
181 | 223 | ||||||
| Actuarial loss (gain) |
608 | (267 | ) | |||||
| Benefits paid |
(594 | ) | (341 | ) | ||||
| Settlement payments |
— | (1,832 | ) | |||||
| Curtailments |
— | (64 | ) | |||||
| Currency exchange rate changes |
481 | (115 | ) | |||||
| End of year |
$ | 9,934 | $ | 8,705 | ||||
| Change in fair value of plan assets: |
||||||||
| Beginning of year |
$ | 8,693 | $ | 10,388 | ||||
| Actual return on plan assets |
720 | (81 | ) | |||||
| Employer contributions |
365 | 451 | ||||||
| Participant contributions |
181 | 223 | ||||||
| Benefits paid |
(594 | ) | (341 | ) | ||||
| Settlement payments |
— | (1,832 | ) | |||||
| Currency exchange rate changes |
480 | (115 | ) | |||||
| End of year |
$ | 9,845 | $ | 8,693 | ||||
| Funded Status |
||||||||
| Projected benefit obligation |
$ | (9,934 | ) | $ | (8,705 | ) | ||
| Plan assets at fair value |
9,845 | 8,693 | ||||||
| Funded status, (under funded) |
$ | (89 | ) | $ | (12 | ) | ||
| Accumulated Benefit Obligation |
$ | 9,273 | $ | 8,231 | ||||
89
Table of Contents
The components of net periodic benefit cost are as follows (in thousands):
| Years Ended | ||||||||||||
| July 3, 2010 |
June 27, 2009 |
June 28, 2008 |
||||||||||
| Service cost |
$ | 261 | $ | 371 | $ | 364 | ||||||
| Interest cost |
292 | 332 | 325 | |||||||||
| Expected return on plan assets |
(252 | ) | (287 | ) | (287 | ) | ||||||
| Curtailment gain |
— | (64 | ) | — | ||||||||
| Amortization of actuarial loss |
— | 71 | — | |||||||||
| Net periodic pension benefits cost |
$ | 301 | $ | 423 | $ | 402 | ||||||
Assumptions
The Swiss plan was valued in accordance with the requirements under U.S. GAAP to measure plan assets and benefit obligations as of the date of the Company’s fiscal year end statement of financial position.
According to the guidance for defined benefit plans, the rate used to discount post-employment benefit obligations should be determined by reference to market yields at the balance sheet date on high quality corporate bonds, or suitable alternative means. In Switzerland, where there is a lack of an active market in such bonds, the market yields at the balance sheet date of government bonds was used, plus a risk premium between 0.5% - 1.5%. The currency and term of the government bonds is consistent with the currency and estimated term of the post-employment benefit obligations.
The expected return on plan assets assumption is based on historical market returns over long periods and expectations of future performance, utilizing the target asset allocations currently in place.
The assumptions used to determine the benefit obligations are as follows (in percentages):
| Years Ended | ||||
| July 3, 2010 |
June 27, 2009 | |||
| Discount rate |
3.00 | 3.25 | ||
| Rate of salary increases |
1.75 | 1.50 | ||
| Expected return on plan assets |
3.00 | 2.75 | ||
The assumptions used to determine the net periodic benefit cost are as follows (in percentages):
| Years Ended | ||||||
| July 3, 2010 |
June 27, 2009 |
June 28, 2008 | ||||
| Discount rate |
3.25 | 3.25 | 3.25 | |||
| Rate of salary increases |
1.50 | 1.50 | 1.50 | |||
| Expected return on plan assets |
2.75 | 2.75 | 2.75 | |||
Plan Assets
The Company has a conservative investment strategy for plan assets. The actual and target allocations reflect a risk/return profile that the Company feels is appropriate relative to the plan’s liability structure and return goals. The primary goal is to slightly exceed the minimum return on pension assets, as set forth by the Swiss Government on an annual basis.
90
Table of Contents
The fair values of the Company’s defined benefit plan assets at July 3, 2010, by asset category, are as follows (in thousands):
| Level 1 | Level 2 | Level 3 | Total | |||||||||
| Asset Category | ||||||||||||
| Mixed investment trusts (1) |
$ | 5,630 | $ | — | $ | — | $ | 5,630 | ||||
| Insurance assets (2) |
— | — | 4,042 | 4,042 | ||||||||
| Cash and cash equivalents |
173 | — | — | 173 | ||||||||
| Total |
$ | 5,803 | $ | $ | 4,042 | $ | 9,845 | |||||
| (1) | These mixed investment trusts are managed by Credit Suisse and are specifically designed to meet Swiss legal requirements governing investment allocations. The mixed investment trusts are valued at fair value based on market prices reported on the active markets for which the securities are traded. The mixed investment trusts include investment allocations among debt, equity, mortgage, real estate and cash. |
| (2) | This amount represents the mathematical reserve for former employees. Upon retirement, if the annuity option is chosen, the pension fund transfers this amount to an insurance company to buy an annuity. The insurance contracts do not yield a return on assets and are stated at present value, which approximates fair value. As of July 3, 2010 and June 27, 2009, this amount was approximately $4.0 million. |
Actual asset allocations at July 3, 2010, by asset category, are as follows:
| Mixed investment trusts |
57.18 | % | |
| Insurance assets |
41.06 | % | |
| Cash and cash equivalents |
1.76 | % | |
| Total |
100.0 | % | |
The Company’s expected future benefit payments at July 3, 2010, are expected to be approximately $0.6 million for fiscal 2011 through 2020.
Japan
As of July 3, 2010 and June 27, 2009, the Company has recorded approximately $0.2 million and $0.1 million, respectively in Deferred revenue and other non-current liabilities related to its Japanese retirement allowance. The retirement allowance is a defined benefit plan and represents the amount due to eligible employees at retirement, based on length of service and position rank. As of July 3, 2010 and June 27, 2009, the plan assets were approximately $0.2 million. The Company recorded approximately $0.1 million of pension expense for the fiscal years ended July 3, 2010, June 27, 2009 and June 28, 2008.
91
Table of Contents
18. Segment Reporting and Geographic Information
The Company operates in a single-reportable segment in the Test and measurement market, in which it develops, manufactures sells and licenses high-performance oscilloscopes, serial data analyzers and communication protocol test solutions. These products are used by design engineers and researchers to measure and analyze complex electronic signals in order to develop high performance systems, to validate electronic designs and to improve time to market. Revenue from the sale of the Company’s products, which are similar in nature, is reflected as Test and measurement products revenue in the Consolidated Statements of Operations.
Revenues are attributed to countries based on customer ship-to addresses. Revenues by geographic area are as follows (in thousands):
| July 3, 2010 (53-weeks) |
June 27, 2009 (52-weeks) |
June 28, 2008 (52-weeks) | |||||||
| Americas |
$ | 46,091 | $ | 39,911 | $ | 52,883 | |||
| Europe/Middle East |
44,083 | 54,193 | 57,982 | ||||||
| Asia/Pacific |
39,162 | 39,863 | 49,621 | ||||||
| Total revenues |
$ | 129,336 | $ | 133,967 | $ | 160,486 | |||
Total assets by geographic area are as follows:
| July 3, 2010 |
June 27, 2009 As adjusted | |||||
| Americas |
$ | 85,088 | $ | 91,597 | ||
| Europe/Middle East |
11,131 | 11,169 | ||||
| Asia/Pacific |
6,435 | 4,912 | ||||
| Total assets |
$ | 102,654 | $ | 107,678 | ||
Total long-lived assets (1) by geographic area are as follows:
| July 3, 2010 |
June 27, 2009 | |||||
| Americas |
$ | 19,892 | $ | 20,795 | ||
| Europe/Middle East |
471 | 644 | ||||
| Asia/Pacific |
443 | 378 | ||||
| Total long-lived assets |
$ | 20,806 | $ | 21,817 | ||
| (1) | Long-lived assets presented in the table above include only Property, plant and equipment, net. |
No customer accounted for more than 10% of the Company’s consolidated revenues in any of the last three fiscal years. Revenues attributable to individual countries based on customer ship-to addresses that account for 10% or more of total revenues in fiscal 2010, 2009 and 2008 include the United States of approximately $45.3 million, $39.4 million and $48.4 million, respectively, and Germany of approximately $16.3 million, $20.4 million, and $21.3 million, respectively.
19. Commitments and Contingencies
The Company’s contractual obligations and commitments include obligations associated with employee severance agreements (See Note 2 — Business Realignment, Restructuring Initiatives and Related Asset Impairments for additional information), supplier agreements, operating leases, capital leases, revolving credit and convertible note obligations (See Note 12 — Debt and Capital Leases for additional information) and employment benefit plans (see Note 17 — Employee Benefit Plans for additional information).
92
Table of Contents
Operating Leases and Supplier Agreements
Operating leases covering plant, certain office facilities and equipment expire at various dates in the future. Future minimum annual lease payments under non-cancelable operating leases having an original term of more than one year are as follows:
| Future Payments (in thousands) | |||
| Fiscal 2011 |
$ | 2,064 | |
| Fiscal 2012 |
1,302 | ||
| Fiscal 2013 |
970 | ||
| Fiscal 2014 |
413 | ||
| Fiscal 2015 |
121 | ||
| Total Future Payments |
$ | 4,870 | |
Aggregate rental expense on non-cancelable operating leases for the fiscal years ended 2010, 2009 and 2008 was approximately $2.4 million, $2.6 million and $2.7 million, respectively.
As of July 3, 2010, the Company is committed to purchase approximately $1.7 million of inventory from suppliers.
Environmental
The Company’s former subsidiary, Digitech Industries, Inc. (“Digitech”), was notified prior to 1999 by the Connecticut Department of Environmental Protection (the “DEP”) that it may be responsible for environmental damage that occurred at its previously leased facilities in Ridgefield, Connecticut (the “Ridgefield Site”). Based upon recommendations made by the DEP, Digitech engaged environmental consultants to assist it in evaluating the costs associated with the DEP’s recommendations for monitoring and remediation of the environmental damage.
In May 1999, LeCroy, Digitech and the former owners of the Ridgefield Site entered into an agreement with the current owners of the Ridgefield Site. The current owners purchased an insurance policy providing for $2.0 million of coverage against certain environmental liabilities related to the Ridgefield Site. That insurance policy names both LeCroy and Digitech as insured parties. The current owners of the Ridgefield Site also agreed to remediate all environmental problems associated with the property and to obtain all applicable approvals and certifications from the DEP. The current owners of the Ridgefield Site also agreed to hold both LeCroy and Digitech harmless in the event of a claim made against them relating to these environmental matters. In return for the above, forty-five days after the DEP has provided written notification to the Company that the site remediation has been accomplished to its satisfaction, the Company agreed to pay the former owners of the Ridgefield Site $0.2 million as compensation for the reduced sale value of the property due to the environmental problems existing on the site. In August 2000, the Company closed the sale of the assets and business of its Vigilant Networks, Inc. subsidiary (“Vigilant”) and a portion of the assets and business of its Digitech subsidiary. The Company has accrued retained liabilities from discontinued operations of $0.2 million after the sale of the Vigilant business and the residual assets of Digitech, which amount is recorded in Accrued expenses and other current liabilities on the July 3, 2010 and June 27, 2009 Consolidated Balance Sheets.
Legal
From time to time, the Company may be involved in lawsuits, claims, investigations and proceedings, including but not limited to, patent, commercial and environmental matters which arise in the ordinary course of business. There are no matters currently pending that the Company expects to have a material adverse affect on its business, results of operations, financial position or cash flows.
20. Related Party Transactions
On July 19, 2005 the Compensation Committee of the Board of Directors approved a $0.3 million retention bonus to Mr. Reslewic. This retention bonus requires Mr. Reslewic to remain an employee for five years. If
93
Table of Contents
Mr. Reslewic terminates his employment earlier than five years, he will be required to repay the bonus in full. The retention bonus is being amortized over five years on a straight line basis as compensation expense. At July 3, 2010, almost zero of the retention bonus remains in Other current assets on the Consolidated Balance Sheet.
In conjunction with the Catalyst acquisition, the Company issued a $3.5 million, 6% promissory note payable on January 2, 2008, to Nader Salehomoum, a former sole shareholder of Catalyst and former employee of the Company. In fiscal 2008, the note was fully repaid.
21. Derivative Instruments and Fair Value
Forward foreign exchange contracts
The Company is exposed to global market exchange rate risks and, as a result, enters into forward exchange contracts to manage financial exposures resulting from changes in foreign currency rates. These foreign currency forward exchange agreements are generally 30-day forward contracts, which are monitored and updated on a monthly basis, and used to reduce exposure to fluctuations in foreign currency exchange rates on assets and liabilities denominated in currencies other than the Company’s functional currencies. The Company does not use derivative instruments for trading or other speculative purposes.
The Company’s forward contracts are not accounted for as hedges. The Company records these agreements on the balance sheet at fair value in Other current assets and Accrued expenses and other current liabilities. The changes in the fair value are recognized in Other, net in the Consolidated Statement of Operations.
The effect of derivative instruments on the Consolidated Statement of Operations for years ended 2010 and 2009 are as follows (in thousands):
| Derivatives |
Location of Gain/(Loss) Recognized in Income on Derivatives |
Amount of Gain/(Loss) Recognized in Income on Derivatives | |||
| 2010 Foreign exchange forward contracts |
Other, net | $ | 755 | ||
| 2009 Foreign exchange forward contracts |
Other, net | $ | 309 | ||
The net gains or losses resulting from changes in the fair value of these derivatives, as presented above, combined with the net gains or losses resulting from transactions denominated in other than their functional currencies were approximately a net loss of $0.5 million, a net gain of $0.3 million and a net loss of $0.6 million for the fiscal years 2010, 2009 and 2008, respectively.
The U.S. dollar equivalent of outstanding forward foreign exchange contracts, all with maturities of less than six months, is summarized below (in millions):
| Contracts |
Notional Amount at July 3, 2010 |
Notional Amount at June 27, 2009 | ||||
| Buy Swiss Francs for US Dollars |
$ | 8.0 | $ | 9.4 | ||
| Buy Japanese Yen for US Dollars |
2.8 | 0.4 | ||||
| Sell Euros for US Dollars |
4.2 | 3.1 | ||||
| Sell Euros for Swiss francs |
3.0 | 3.2 | ||||
| Other foreign currency forwards |
1.5 | 1.4 | ||||
| Total |
$ | 19.5 | $ | 17.5 | ||
Fair Value
The fair value framework requires the categorization of assets and liabilities into three levels based upon the assumptions (inputs) used to price the assets or liabilities. Level 1 provides the most reliable measure of fair value, whereas Level 3 generally requires significant management judgment. The three levels are defined as follows:
| • | Level 1: Unadjusted quoted prices in active markets for identical assets and liabilities. |
94
Table of Contents
| • | Level 2: Observable inputs other than those included in Level 1. For example, quoted prices for similar assets or liabilities in active markets or quoted prices for identical assets or liabilities in inactive markets. |
| • | Level 3: Unobservable inputs reflecting management’s own assumptions about the inputs used in pricing the asset or liability. |
As of July 3, 2010, the fair values of the Company’s financial assets and liabilities are categorized as follows (in thousands):
| Total | Level 1 | Level 2 | Level 3 | |||||||
| Other current assets: |
||||||||||
| Foreign exchange forward contracts |
$ | 38 | — | $ | 38 | — | ||||
| Accrued expenses and other current liabilities: |
||||||||||
| Foreign exchange forward contracts |
$ | 77 | — | $ | 77 | — | ||||
The fair values above were based on observable market transactions of spot currency rates and forward currency prices. The net fair value of the open foreign exchange forward contracts is a net liability of less than $0.1 million at July 3, 2010 as compared to a net asset of approximately $0.1 million at June 27, 2009.
22. Unaudited Quarterly Results of Operations
The Company has quarterly periods ending on the Saturday closest to the end of the calendar quarter. Summarized unaudited quarterly operating results for fiscal years 2010 and 2009 (all quarters represent 13-week periods, except for the quarter ended October 3, 2009 which was a 14-week period) are as follows:
(in thousands, except per share data)
| Quarters Ended | ||||||||||||||||||||||||||||||||
| Fiscal Year 2010 | Fiscal Year 2009 (As Adjusted) | |||||||||||||||||||||||||||||||
| Jul. 3, 2010 |
Apr. 3, 2010 |
Jan. 2, 2010 |
Oct. 3, 2009 |
June 27, 2009 |
Mar. 28, 2009 |
Dec. 27, 2008 |
Sept. 27, 2008 |
|||||||||||||||||||||||||
| Revenues |
||||||||||||||||||||||||||||||||
| Test and measurement products |
$ | 34,292 | $ | 31,150 | $ | 28,384 | $ | 25,807 | $ | 25,353 | $ | 24,725 | $ | 36,948 | $ | 38,430 | ||||||||||||||||
| Service and other |
2,462 | 2,433 | 2,614 | 2,194 | 1,860 | 2,198 | 2,159 | 2,294 | ||||||||||||||||||||||||
| Total revenues |
36,754 | 33,583 | 30,998 | 28,001 | 27,213 | 26,923 | 39,107 | 40,724 | ||||||||||||||||||||||||
| Cost of revenue |
14,821 | 13,502 | 12,820 | 12,334 | 14,449 | 12,621 | 18,838 | 17,690 | ||||||||||||||||||||||||
| Gross profit |
21,933 | 20,081 | 18,178 | 15,667 | 12,764 | 14,302 | 20,269 | 23,034 | ||||||||||||||||||||||||
| Selling, general and administrative expenses |
11,306 | 11,889 | 10,167 | 8,903 | 10,217 | 11,352 | 12,839 | 12,583 | ||||||||||||||||||||||||
| Research and development expenses |
7,802 | 7,232 | 6,839 | 6,119 | 6,054 | 8,185 | 8,809 | 7,803 | ||||||||||||||||||||||||
| Impairment of goodwill |
— | — | — | — | — | — | 105,771 | — | ||||||||||||||||||||||||
| Operating income (loss) |
2,825 | 960 | 1,172 | 645 | (3,507 | ) | (5,235 | ) | (107,150 | ) | 2,648 | |||||||||||||||||||||
| Other (expense) income, net |
(1,504 | ) | (1,062 | ) | (1,333 | ) | (1,150 | ) | (914 | ) | 7,219 | (1,621 | ) | (1,022 | ) | |||||||||||||||||
| Income (loss) before income taxes |
1,321 | (102 | ) | (161 | ) | (505 | ) | (4,421 | ) | 1,984 | (108,771 | ) | 1,626 | |||||||||||||||||||
| Provision (benefit) for income taxes |
1,145 | (432 | ) | 120 | (23 | ) | (616 | ) | 419 | (1,499 | ) | 531 | ||||||||||||||||||||
| Net income (loss) |
$ | 176 | $ | 330 | $ | (281 | ) | $ | (482 | ) | $ | (3,805 | ) | $ | 1,565 | $ | (107,272 | ) | $ | 1,095 | ||||||||||||
| Net income (loss) per common share: |
||||||||||||||||||||||||||||||||
| Basic |
$ | 0.01 | $ | 0.03 | $ | (0.02 | ) | $ | (0.04 | ) | $ | (0.31 | ) | $ | 0.13 | $ | (8.97 | ) | $ | 0.09 | ||||||||||||
| Diluted |
$ | 0.01 | $ | 0.03 | $ | (0.02 | ) | $ | (0.04 | ) | $ | (0.31 | ) | $ | 0.13 | $ | (8.97 | ) | $ | 0.09 | ||||||||||||
| Weighted average number of common shares: |
||||||||||||||||||||||||||||||||
| Basic |
12,584 | 12,476 | 12,387 | 12,265 | 12,131 | 12,037 | 11,962 | 11,881 | ||||||||||||||||||||||||
| Diluted |
12,851 | 12,678 | 12,387 | 12,265 | 12,131 | 12,098 | 11,962 | 12,077 | ||||||||||||||||||||||||
95
Table of Contents
23. Subsequent Events
On July 29, 2010, LeCroy Corporation entered into an Amended and Restated $50.0 million Senior Secured Credit Agreement (the “New Credit Agreement”) with the lenders listed therein and Manufacturers and Traders Trust Company, as administrative agent for such lenders. The New Credit Agreement amends LeCroy’s existing credit facility that was entered into on March 30, 2007 and subsequently amended. The terms of the New Credit Agreement provide LeCroy with a $50.0 million revolving credit facility, which includes a $5.0 million swingline loan subfacility and a $5.0 million letter of credit subfacility. LeCroy has the right to increase the total revolving commitment to $60.0 million within the first twenty-four months of the New Credit Agreement upon meeting certain conditions. The performance by LeCroy of its obligations under the New Credit Agreement is secured by all of the assets of LeCroy and its domestic subsidiaries, and is guaranteed by LeCroy’s domestic subsidiaries.
Subject to complying with applicable covenants, including a covenant which requires the Company to reduce its total debt outstanding to $40.0 million by March 31, 2011, excluding Notes with a repurchase date no earlier than June 30, 2014, the proceeds of the borrowings under the New Credit Agreement have and will be used to refinance existing debt, including the ability to retire the outstanding Notes which has a first put or redemption date in October 2011, fund short-term and long-term permanent working capital, for issuance of Letters of Credit and general corporate purposes.
Borrowings under the Agreement (except swing line loans) will bear interest at variable rates equal to, at LeCroy’s election, (a) a rate based on LIBOR or (b) Base Rate, as defined, plus a margin based on the total leverage ratio. Swing line loans will bear interest at the Base Rate plus the Applicable Margin, as defined. In addition, LeCroy must pay commitment fees during the term of the New Credit Agreement at rates dependent on the Company’s leverage ratio.
The New Credit Agreement contains, among other things, conditions precedent, affirmative and negative covenants, representations and warranties and events of default. Negative covenants include certain restrictions or limitations on, among other things, the incurrence of indebtedness; pledges, liens and encumbrances; mergers and acquisitions; loans, advances and investments; sales of assets and sale leaseback arrangements; and restricted payments, including distributions, dividends, stock repurchases and the repayment of the Convertible notes. The New Credit Agreement prohibits repayment of the Convertible notes until (i) the total leverage ratio is less than 3.00 to 1.00, (ii) after giving effect to the repurchase the total leverage ratio is less than 3.00 to 1.00 and (iii) LeCroy is in compliance with all of the terms and conditions in the New Credit Agreement prior to and after giving effect to the repurchase.
The Company is required to comply with certain financial covenants, measured quarterly, including, as defined: a total leverage ratio, a senior leverage ratio, a minimum consolidated EBITDA, a minimum fixed charge ratio, a maximum capital expenditure, a maximum debt outstanding and a minimum liquidity. The maximum debt outstanding covenant will be eliminated upon the repayment of Notes, in full, or upon extension of the first repurchase date, which is no earlier than one hundred and eighty days after January 1, 2014 and replaced by a minimum liquidity covenant.
The New Credit Agreement will mature on January 1, 2014. However, if a default or event of default exists or is continuing the maturity date will become July 15, 2011. At the time of expiration all outstanding amounts under the New Credit Agreement will be due and payable. Under certain conditions, the lending commitments under the New Credit Agreement may be terminated by the lenders and amounts outstanding under the New Credit Agreement may be accelerated.
The Company incurred approximately $0.7 million of financing costs in connection with the New Credit Agreement which will be deferred and amortized, on a straight line basis, over the term of the New Credit Agreement, along with the remaining unamortized fees associated with the Prior Credit Agreement of approximately $0.2 million.
96
Table of Contents
LeCROY CORPORATION
VALUATION AND QUALIFYING ACCOUNTS
(In thousands)
| Description |
Balance at Beginning of Period |
Charged to (Recovery of) Costs and Expenses |
Net Deductions/ Other |
Balance at End of Period | ||||||
| Year ended June 28, 2008: |
||||||||||
| Net accounts receivable reserves(a) |
882 | (134 | ) | (6 | ) | 742 | ||||
| Allowance for excess and obsolete inventory |
2,661 | 2,418 | (542 | ) | 4,537 | |||||
| Valuation allowance on deferred tax assets(b) |
1,655 | (18 | ) | 98 | 1,735 | |||||
| Year ended June 27, 2009: |
||||||||||
| Net accounts receivable reserves(a) |
742 | 3 | (53 | ) | 692 | |||||
| Allowance for excess and obsolete inventory |
4,537 | 5,751 | (4,464 | ) | 5,824 | |||||
| Valuation allowance on deferred tax assets |
1,735 | 205 | — | 1,940 | ||||||
| Year ended July 3, 2010: |
||||||||||
| Net accounts receivable reserves(a) |
692 | — | (193 | ) | 499 | |||||
| Allowance for excess and obsolete inventory |
5,824 | 206 | (2,719 | ) | 3,311 | |||||
| Valuation allowance on deferred tax assets |
1,940 | 46 | — | 1,986 |
| (a) | The change in balances includes uncollectible accounts receivable written-off and change in sales return estimates. |
| (b) | The change in balances (Deductions/Other) includes an increase in the deferred tax valuation allowance due to the adoption of new accounting guidance as of July 1, 2007. |
97
Table of Contents
| ITEM 9. | CHANGES IN AND DISAGREEMENTS WITH ACCOUNTANTS ON ACCOUNTING AND FINANCIAL DISCLOSURE |
None.
| ITEM 9A. | CONTROLS AND PROCEDURES |
Evaluation of Disclosure Controls and Procedures
The Company, under the supervision and with the participation of its management, including the Chief Executive Officer and Chief Financial Officer, evaluated the effectiveness of the design and operation of the Company’s “disclosure controls and procedures” (as defined in Rule 13a-15(b) under the Securities Exchange Act of 1934, as amended, or the “Exchange Act”) as of the end of the period covered by this report. Based on that evaluation, the Chief Executive Officer and the Chief Financial Officer concluded that, as of July 3, 2010, the Company’s disclosure controls and procedures are effective to ensure the information required to be disclosed by us in reports we file or submit under the Exchange Act is (1) recorded, processed, summarized and reported within the time periods specified in the SEC’s rules and forms, and (2) information is accumulated and communicated to our management, including our Chief Executive Officer and Chief Financial Officer, as appropriate, to allow timely decisions regarding required disclosure.
Changes in Internal Control Over Financial Reporting
There have not been any changes in the Company’s internal control over financial reporting (as defined in Rules 13a-15(f) and 15d-15(f) under the Exchange Act) during the quarter ended July 3, 2010 that have materially affected, or are reasonably likely to materially affect, the Company’s internal control over financial reporting.
Section 404 of the Sarbanes-Oxley Act of 2002 requires that management document and test the Company’s internal controls over financial reporting and include in this Annual Report on Form 10-K a report on management’s assessment of the effectiveness of the Company’s internal controls over financial reporting. See “Management’s Report on Internal Control over Financial Reporting.”
Management’s Report on Internal Control over Financial Reporting
Our management is responsible for establishing and maintaining adequate internal control over financial reporting, as defined in Rules 13a-15(f) and 15d-15(f) of the Exchange Act. The Company’s internal control over financial reporting is designed to provide reasonable assurance regarding the reliability of financial reporting and the preparation of consolidated financial statements for external purposes in accordance with generally accepted accounting principles. Under the supervision and with the participation of our management, including our Chief Executive Officer and Chief Financial Officer, we conducted an evaluation of the effectiveness of our internal control over financial reporting based upon the guidelines established in Internal Control-Integrated Framework issued by the Committee of Sponsoring Organizations of the Treadway Commission (COSO). Based on the results of this evaluation, our management has concluded that our internal control over financial reporting was effective as of July 3, 2010.
98
Table of Contents
| ITEM 9B. | OTHER INFORMATION |
None
99
Table of Contents
PART III
| ITEM 10. | DIRECTORS, EXECUTIVE OFFICERS AND CORPORATE GOVERNANCE |
Information with respect to our directors will be contained in the section captioned “Proposal No. 1 — Election of a Class of Directors”, “Structure and Role of the Board of Directors”, “Compensation of Non-Named Executive Officer Directors” and “Corporate Governance” of the Definitive Proxy Statement relating to our 2010 Annual Meeting of Stockholders (“2010 Proxy Statement”), which is scheduled to be held October 22, 2010. Information regarding our Audit, Compensation, and Nominating/Governance Committees may be found under the caption “Structure and Role of the Board of Directors” in our 2010 Proxy Statement. Information with respect to Item 405 disclosure of delinquent Form 3, 4 or 5 filers will be contained in the 2010 Proxy Statement in the section captioned “Section 16 (A) Beneficial Ownership Reporting Compliance”. Those portions of the 2010 Proxy Statement are incorporated herein by reference. The discussion of our executive officers is also included in the 2010 Proxy Statement.
The Company has adopted a code of ethics entitled “Revised Principles of Business Conduct Policy,” which applies to its officers, directors and employees. A copy is publicly available on our website at: www.lecroy.com/aboutlecroy/investorrelations/governance. This information is also available by writing to the Company address on the cover of this Annual Report on Form 10-K.
| ITEM 11. | EXECUTIVE COMPENSATION |
A description of the compensation of our executive officers an directors will be contained in the section captioned “Executive Officer Compensation”, “Compensation of Non-Named Executive Officer Directors”, “Compensation Committee Report”, and “Compensation Committee Interlocks and Insider Participation” of the 2010 Proxy Statement. The aforementioned sections of the 2010 Proxy Statement is incorporated herein by reference.
| ITEM 12. | SECURITY OWNERSHIP OF CERTAIN BENEFICIAL OWNERS AND MANAGEMENT AND RELATED STOCKHOLDER MATTERS |
A description of the security ownership of certain beneficial owners and management will be contained in the section captioned “Security Ownership of Certain Beneficial Owners and Management”, “Executive Officer Compensation” and “Compensation Committee Report” of the 2010 Proxy Statement. That portion of the 2010 Proxy Statement is incorporated herein by reference.
| ITEM 13. | CERTAIN RELATIONSHIPS, RELATED TRANSACTIONS AND DIRECTOR INDEPENDENCE |
Certain relationships and related transactions with management will be contained in the section captioned “Certain Relationships and Related Transactions” and “Director Independence” in the 2010 Proxy Statement. That portion of the 2010 Proxy Statement is incorporated herein by reference.
| ITEM 14. | PRINCIPAL ACCOUNTING FEES AND SERVICES |
A description of the principal accountant fees and services, as well as related pre-approval policies, will be contained in the section captioned “Independent Registered Public Accounting Firm Fees” in the 2010 Proxy Statement. That portion of the 2010 Proxy Statement is incorporated herein by reference.
100
Table of Contents
PART IV
| ITEM 15. | EXHIBITS AND FINANCIAL STATEMENT SCHEDULE |
The following documents are filed as part of this report:
| (a) (1) | Financial Statements — See Index to Consolidated Financial Statements at Part II, Item 8, of this report. |
| (a) (2) | Financial Statement Schedule — See Index to Consolidated Financial Statements at Part II, Item 8, of this report (Schedule II). |
Schedules not listed above have been omitted because the information required to be set forth therein is not applicable, not required or is included elsewhere in the financial statements or notes thereto.
| (a) (3) | Exhibits |
The following exhibits are incorporated by reference or are filed with this report, as indicated below:
| Exhibit |
Description |
Filed Herewith | ||
| 2.1 | Agreement and Plan of Merger, dated as of September 1, 2004, among the Registrant, Cobalt Acquisition Corporation and Computer Access Technology Corporation, filed as Exhibit 2.1 to Form 8-K dated September 2, 2004, incorporated herein by reference. | |||
| 2.2 | Agreement and Plan of Merger dated as of September 29, 2006, among the Registrant, 2006 Franklin Congress Corporation, Catalyst Enterprises, Inc., and Nader Salehomoum, filed as Exhibit 2.1 to Form 8-K filed on October 3, 2006, incorporated herein by reference. | |||
| 3.1 | Certificate of Incorporation of the Registrant as of July 24, 1995, filed as Exhibit 3.1 to Form S-1 Registration Statement No. 33-95620, incorporated herein by reference. | |||
| 3.2 | Amendment to the Certificate of Designation of the Series A Convertible Redeemable Preferred Stock as of April 9, 2001, filed as Exhibit 10.37 to Form 10-Q for the quarterly period ended March 31, 2001, incorporated herein by reference. | |||
| 3.3 | By-Laws of the Registrant, as amended, dated August 16, 2000, filed as Exhibit 3.3 to Form 10-Q for the quarterly period ended September 30, 2000, incorporated herein by reference. | |||
| 3.4 | Second Amendment to the By-Laws of Registrant, adopted on December 10, 2007, filed as Exhibit 3.01 to Form 8-K filed on December 11, 2007. | |||
| 4.1 | Purchase Agreement dated October 5, 2006, between LeCroy Corporation and Cowen and Company, LLC, filed as Exhibit 4.1 to Form 8-K filed on October 12, 2006, incorporated herein by reference. | |||
| 4.2 | Registration Rights Agreement dated October 12, 2006, between LeCroy Corporation and Cowen and Company, LLC, filed as Exhibit 4.2 to Form 8-K filed on October 12, 2006, incorporated herein by reference. | |||
| 4.3 | Indenture dated October 12, 2006, between LeCroy Corporation, as issuer, and U.S. Bank National Association, as trustee, filed as Exhibit 4.3 to Form 8-K filed on October 12, 2006, incorporated herein by reference. | |||
| 10.1 | Credit Agreement, dated as of October 29, 2004, among the Registrant, the lenders party thereto and The Bank of New York, as Administrative Agent, filed as Exhibit 10.14 to Form 8-K filed on November 2, 2004, incorporated herein by reference. | |||
| 10.2 | LeCroy Corporation Amended and Restated 1993 Stock Incentive Plan filed as Exhibit 10.1 to Form S-1 Registration Statement No. 33-95620, incorporated herein by reference.* | |||
| 10.3 | Amendment to LeCroy Corporation Amended and Restated 1993 Stock Incentive Plan, filed as Exhibit 10.33 to Form 10-Q for the quarterly period ended September 30, 2000, incorporated herein by reference.* | |||
101
Table of Contents
| Exhibit |
Description |
Filed Herewith | ||
| 10.4 | LeCroy Corporation 1995 Non-Employee Director Stock Option Plan filed as Exhibit 10.2 to Form S-1 Registration Statement No. 33-95620, incorporated herein by reference.* | |||
| 10.5 | LeCroy Corporation 1995 Employee Stock Purchase Plan, filed as Exhibit 10.3 to Form S-1 Registration Statement No. 33-95620, incorporated herein by reference.* | |||
| 10.6 | LeCroy Corporation 1998 Non-Employee Director Stock Option Plan, incorporated by reference to Appendix A to the Company’s Definitive Proxy Statement filed on September 18, 1998.* | |||
| 10.7 | Amendment to the LeCroy Corporation 1998 Non-Employee Director Stock Option Plan, dated August 16, 2000, filed as Exhibit 10.34 to Form 10-Q for the quarterly period ended September 30, 2000, incorporated herein by reference.* | |||
| 10.8 | Amendment to the LeCroy Corporation 1998 Non-Employee Director Stock Option Plan, dated October 25, 2000, filed as Exhibit 10.35 to Form 10-Q for the quarterly period ended September 30, 2000, incorporated herein by reference.* | |||
| 10.9 | LeCroy Corporation’s 2003 Stock Incentive Plan, incorporated by reference to Appendix A to the Company’s Definitive Proxy Statement filed on September 26, 2003.* | |||
| 10.10 | Form of Restricted Stock Purchase Agreement, filed as Exhibit 10.41 to Form 10-K for the fiscal year ended June 30, 2002, incorporated herein by reference.* | |||
| 10.11 | LeCroy Corporation Amended and Restated 1995 Employee Stock Purchase Plan, incorporated by reference to Appendix B to the Registrant’s Definitive Proxy Statement filed on September 26, 2003.* | |||
| 10.12 | LeCroy Corporation’s 2004 Employment Inducement Stock Plan, filed as Exhibit 10.5 to Form 8-K filed on November 2, 2004, incorporated herein by reference.* | |||
| 10.13 | Computer Access Technology Corporation Special 2000 Stock Option Plan, filed as Exhibit 10.7 to Form 8-K filed on November 2, 2004, incorporated herein by reference.* | |||
| 10.14 | Amendments to Computer Access Technology Corporation 2000 Special Stock Option Plan, filed as Exhibit 10.11 to Form 8-K filed on November 2, 2004, incorporated herein by reference.* | |||
| 10.15 | Amendment to LeCroy Corporation (CATC) Special 2000 Stock Option Plan, filed as Exhibit 10.2 to Form 8-K filed on November 19, 2004, incorporated herein by reference.* | |||
| 10.16 | Computer Access Technology Corporation 2000 Stock Incentive Plan, filed as Exhibit 10.8 to Form 8-K filed on November 2, 2004, incorporated herein by reference.* | |||
| 10.17 | Amendments to Computer Access Technology Corporation 2000 Stock Incentive Plan, filed as Exhibit 10.12 to Form 8-K filed on November 2, 2004, incorporated herein by reference.* | |||
| 10.18 | Amendment to LeCroy Corporation (CATC) 2000 Stock Incentive Plan, filed as Exhibit 10.3 to Form 8-K filed on November 19, 2004, incorporated herein by reference.* | |||
| 10.19 | Computer Access Technology Corporation 1994 Stock Option Plan, filed as Exhibit 10.9 to Form 8-K filed on November 2, 2004, incorporated herein by reference.* | |||
| 10.20 | Amendments to Computer Access Technology Corporation 1994 Stock Option Plan, filed as Exhibit 10.13 to Form 8-K filed on November 2, 2004, incorporated herein by reference.* | |||
| 10.21 | Amendment to LeCroy Corporation (CATC) 1994 Stock Option Plan, filed as Exhibit 10.4 to Form 8-K filed on November 19, 2004, incorporated herein by reference.* | |||
| 10.22 | Employee Agreement Regarding Inventions, Confidentiality and Non-Competition, dated as of March 28, 1995, between the Registrant and Walter O. LeCroy, Jr., filed as Exhibit 10.13 to Form S-1 Registration Statement No. 33-95620, incorporated herein by reference.* | |||
102
Table of Contents
| Exhibit |
Description |
Filed Herewith | ||
| 10.23 | Form of Indemnification Agreement, between the Registrant and each of its executive officers and directors filed as Exhibit 10.29 to Form S-1 Registration Statement No. 33-95620, incorporated herein by reference.* | |||
| 10.24 | Employment Agreement, dated January 1, 2002, between the Registrant and Thomas H. Reslewic, filed as Exhibit 10.40 to Form 10-Q for the quarterly period ended March 31, 2003, incorporated herein by reference.* | |||
| 10.25 | Amendment No. 1 to Employment Agreement, dated December 16, 2002, between the Registrant and Thomas H. Reslewic, filed as Exhibit 10.43 to Form 10-Q for the quarterly period ended March 31, 2003, incorporated herein by reference.* | |||
| 10.26 | Separation Agreement, dated August 19, 2004, between the Registrant and Thomas H. Reslewic, filed as Exhibit 10.49 to Form 10-K for the fiscal year ended June 30, 2004, incorporated herein by reference.* | |||
| 10.27 | Form of Separation Agreement between the Registrant and certain of its executive officers, filed as Exhibit 10.51 to Form 10-K for the fiscal year ended June 30, 2004, incorporated herein by reference.* | |||
| 10.28 | Employment Agreement, dated September 1, 2004 and effective October 29, 2004, between the Registrant and Carmine Napolitano, filed as Exhibit 10.1 to Form 8-K filed on November 2, 2004, incorporated herein by reference.* | |||
| 10.29 | Amendment No. 1 to Employment Agreement, dated September 30, 2004 and effective October 29, 2004, between the Registrant and Carmine Napolitano, filed as Exhibit 10.2 to Form 8-K filed on November 2, 2004, incorporated herein by reference.* | |||
| 10.30 | Services Agreement, dated August 31, 2004, between Computer Access Technology Corporation and Dan Wilnai, filed as Exhibit 10.3 to Form 8-K filed on November 2, 2004, incorporated herein by reference.* | |||
| 10.31 | Employment Agreement, dated August 31, 2004, between Computer Access Technology Corporation and Peretz Tzarnotsky, filed as Exhibit 10.4 to Form 8-K filed on November 2, 2004, incorporated herein by reference.* | |||
| 10.32 | Amendment No. 2 to Credit Agreement, dated as of May 9, 2006, among the Registrant, the lenders party thereto and The Bank of New York, as Administrative Agent, filed as Exhibit 10.40 to Form 10-Q filed on May 10, 2006, incorporated herein by reference. | |||
| 10.33 | Amendment No. 3 to Credit Agreement, dated as of September 26, 2006, among the Registrant, the lenders party thereto and The Bank of New York, as Administrative Agent, filed as Exhibit 10.36 to Form 10-Q filed on November 9, 2006, incorporated herein by reference. | |||
| 10.34 | Amendment No. 4 to Credit Agreement, dated as of September 28, 2006, among the Registrant, the lenders party thereto and The Bank of New York, as Administrative Agent, filed as Exhibit 10.37 to Form 10-Q filed on November 9, 2006, incorporated herein by reference. | |||
| 10.35 | Amendment No. 5 to Credit Agreement, dated as of December 29, 2006, among the Registrant, the lenders party thereto and The Bank of New York, as Administrative Agent, filed as Exhibit 10.1 to Form 8-K filed on December 29, 2006, incorporated herein by reference. | |||
| 10.36 | Catalyst Enterprises, Inc. 2005 Stock Option Plan, filed as Exhibit 10.1 to Form 8-K filed on December 22, 2006, incorporated herein by reference.* | |||
| 10.37 | Amendments to Catalyst Enterprises, Inc. 2005 Stock Option Plan filed as Exhibit 10.2 to Form 8-K filed on December 22, 2006, incorporated herein by reference.* | |||
103
Table of Contents
| Exhibit |
Description |
Filed Herewith | ||
| 10.38 | Credit Agreement, dated as of March 30, 2007, among the Registrant, the Lenders listed therein and Manufacturers and Traders Trust Company, as Administrative Agent, filed as Exhibit 10.1 to Form 8-K filed on April 4, 2007, incorporated herein by reference. | |||
| 10.39 | First Modification and Lender Joinder Agreement, dated as of April 26, 2007, among Registrant, the Lenders listed therein and Manufacturers and Traders Trust Company, as Administrative Agent, filed as Exhibit 10.1 to Form 8-K filed on May 2, 2007, incorporated herein by reference. | |||
| 10.40 | Assignment and Acceptance, dated as of April 26, 2007, between Manufacturers and Traders Trust Company and North Fork Bank, filed as Exhibit 10.2 to Form 8-K filed on May 2, 2007, incorporated herein by reference. | |||
| 10.41 | Stock Appreciation Right Plan, filed as Exhibit 10.1 to Form 8-K filed on August 24, 2007, incorporated herein by reference.* | |||
| 10.42 | Stock Appreciation Right Grant Agreement, filed as Exhibit 10.2 to Form 8-K filed on August 24, 2007, incorporated herein by reference.* | |||
| 10.43 | Second Modification Agreement, dated as of May 7, 2008, among Registrant, the Lenders listed therein and Manufacturers and Traders Trust Company, as Administrative Agent, filed as Exhibit 10.45 to Form 10-Q filed on May 8, 2008, incorporated herein by reference. | |||
| 10.44 | LeCroy Corporation Amended and Restated 2007 Stock Appreciation Right Plan, filed as Exhibit 10.1 to Form 8-K filed on August 24, 2007, incorporated herein by reference.* | |||
| 10.45 | LeCroy Corporation 2008 Stock Incentive Plan, filed as Exhibit 10.47 to Form 10-Q filed on November 5, 2008, incorporated herein by reference.* | |||
| 10.46 | Third Modification Agreement, dated May 4, 2009, among Registrant, the Lenders listed therein and Manufacturers and Traders Trust Company, as Administrative Agent, filed as Exhibit 10.45 to Form 10-Q filed on May 7, 2009, incorporated herein by reference. | |||
| 10.47 | Amended and Restated Credit Agreement, dated as of July 29, 2010, among the Registrant, the Lenders listed therein and Manufacturers and Traders Trust Company, as Administrative Agent, filed as Exhibit 10.1 to Form 8-K filed on July 30, 2010, incorporated herein by reference. | |||
| 14.1 | Revised Code of Ethics-Principles of Business Conduct dated December 14, 2005, filed as Exhibit 14.1 to Form 10-K for the fiscal year ended July 1, 2006, incorporated herein by reference. | |||
| 18.1 | Preferability Letter of KPMG LLP, Independent Registered Public Accounting Firm, filed as Exhibit 18.1 to Form 10-K for the fiscal year ended June 28, 2008, incorporated herein by reference. | |||
| 18.2 | Preferability Letter of KPMG LLP, Independent Registered Public Accounting Firm, filed as Exhibit 18.2 to Form 10-Q for the fiscal quarter ended September 27, 2008, incorporated herein by reference. | |||
| 21.1 | Subsidiaries of LeCroy Corporation. | X | ||
| 23.1 | Consent of Independent Registered Public Accounting Firm. | X | ||
| 31.1 | Certification by the Chief Executive Officer pursuant to Section 302 of the Sarbanes — Oxley Act of 2002. | X | ||
| 31.2 | Certification by the Chief Financial Officer pursuant to Section 302 of the Sarbanes — Oxley Act of 2002. | X | ||
| 32.1 | Certification by the Chief Executive Officer pursuant to 18 U.S.C. Section 1350. | X | ||
| 32.2 | Certification by the Chief Financial Officer pursuant to 18 U.S.C. Section 1350. | X |
| * | Indicates management contract or compensatory plan, contract or arrangement. |
104
Table of Contents
Pursuant to the requirements of Section 13 or 15(d) of the Securities Exchange Act of 1934, the registrant has duly caused this report to be signed on its behalf by the undersigned, thereunto duly authorized.
| LeCroy CORPORATION | ||||||||
| Date: September 7, 2010 | By | /s/ SEAN B. O’CONNOR | ||||||
| Sean B. O’Connor | ||||||||
| Vice President and Chief Financial Officer, | ||||||||
| Secretary and Treasurer (Principal Accounting Officer) | ||||||||
Pursuant to the requirements of the Securities Exchange Act of 1934, this report has been signed below by the following persons on behalf of the registrant and in the capacities and on the dates indicated.
| Signature |
Title |
Date | ||
| /s/ ALLYN C. WOODWARD, JR. Allyn C. Woodward, Jr. |
Chairman of the Board of Directors | September 7, 2010 | ||
| /s/ THOMAS H. RESLEWIC Thomas H. Reslewic |
President, Chief Executive Officer and Director (Principal Executive Officer) | September 7, 2010 | ||
| /s/ SEAN B. O’CONNOR Sean B. O’Connor |
Vice President and Chief Financial Officer, Secretary and Treasurer (Principal Accounting Officer) | September 7, 2010 | ||
| /s/ ROBERT E. ANDERSON Robert E. Anderson |
Director | September 7, 2010 | ||
| /s/ ROBERT W. CHLEBEK Robert W. Chlebek |
Director | September 7, 2010 | ||
| /s/ WALTER O. LECROY, JR. Walter O. LeCroy, Jr. |
Director | September 7, 2010 | ||
|
/s/ NORMAN R. ROBERTSON Norman R. Robertson |
Director | September 7, 2010 | ||
| /s/ WILLIAM G. SCHEERER William G. Scheerer |
Director | September 7, 2010 | ||
105