Attached files
| file | filename |
|---|---|
| 8-K - 8-K - Cloud Peak Energy Resources LLC | a10-16372_28k.htm |
Exhibit 99.1
|
|
Investor Presentation September 2010 |
|
|
1 Cloud Peak Energy Inc. Financial Data Cloud Peak Energy Inc. is the sole managing member and majority owner of Cloud Peak Energy Resources LLC. Unless expressly stated otherwise in this presentation, all financial data included herein is consolidated financial data of Cloud Peak Energy Inc. Cautionary Note Regarding Forward-Looking Statements This presentation contains “forward-looking statements” within the meaning of the safe harbor provisions of Section 27A of the Securities Act of 1933 and Section 21E of the Securities Exchange Act of 1934. Forward-looking statements are not statements of historical facts, and often contain words such as “may,” “will,” “expect,” “believe,” “anticipate,” “plan,” “estimate,” “seek,” “could,” “should,” “intend,” “potential,” or words of similar meaning. Forward-looking statements are based on management’s current expectations or beliefs, as well as assumptions and estimates regarding our company, industry, economic conditions, government regulations and other factors. These statements are subject to significant risks, uncertainties and assumptions that are difficult to predict and could cause actual results to differ materially from those expressed or implied in the forward-looking statements. For a description of some of the risks and uncertainties that may adversely affect our future results, refer to the risk factors described from time to time in the reports and registration statements we file with the Securities and Exchange Commission, including those in Item 1A "Risk Factors" of our most recent Form 10-K and any updates thereto in our Forms 10-Q. There may be other risks and uncertainties that are not currently known to us or that we currently believe are not material. We make forward-looking statements based on currently available information, and we assume no obligation to, and expressly disclaim any obligation to, update or revise publicly any forward-looking statements made in our presentation, whether as a result of new information, future events or otherwise, except as required by law. Non-GAAP Financial Measures This presentation includes the non-GAAP financial measure of EBITDA. EBITDA, a performance measure used by management, is defined as income (loss) from continuing operations plus: (1) interest expense (net of interest income), (2) income tax provision, (3) depreciation and depletion, (4) amortization, and (5) accretion. EBITDA is not defined under generally accepted accounting principles in the U.S., or GAAP, and does not purport to be an alternative to net income or other GAAP financial measures as a measure of operating performance. Because not all companies use identical calculations, our presentation of EBITDA may not be comparable to other similarly titled measures of other companies. Our presentation of EBITDA may be different than EBITDA as defined in our debt financing agreements. We believe that EBITDA is useful to investors and other external users of our consolidated financial statements as an additional tool to evaluate and compare our operating performance, because EBITDA is widely used by investors to measure a company’s operating performance without regard to items such as interest expense, taxes, depreciation and depletion, amortization and accretion, which can vary substantially from company to company depending upon accounting methods and book value of assets, capital structure and the method by which assets were acquired. However, using EBITDA as a performance measure has material limitations as compared to net income, or other financial measures as defined under GAAP, as it excludes certain recurring items which may be meaningful to investors. EBITDA is also used as a performance measure in our compensation program for our executives. A quantitative reconciliation of EBITDA to income from continuing operations is found in the tables accompanying this presentation. |
|
|
2 Overview Background Cloud Peak Energy Inc. – IPO November 2009 Rio Tinto Energy America formed through acquisitions 1993 – 1998 2008 Rio Tinto decided to divest to reduce Alcan purchase debt 2008 Colowyo mine retained by Rio Tinto 2009 Jacobs Ranch Mine sold to Arch Coal Who we are today Traded on NYSE – ticker symbol “CLD” Headquartered in Gillette, WY Producers of low-sulfur, high-quality, subbituminous coal Only pure-play, Powder River Basin (PRB) coal company Operating 3 surface mines, third-largest U.S. coal producer |
|
|
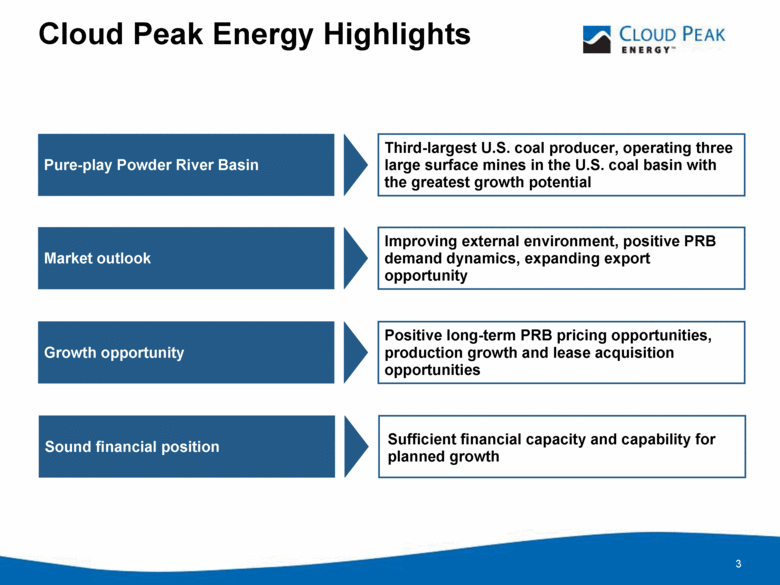
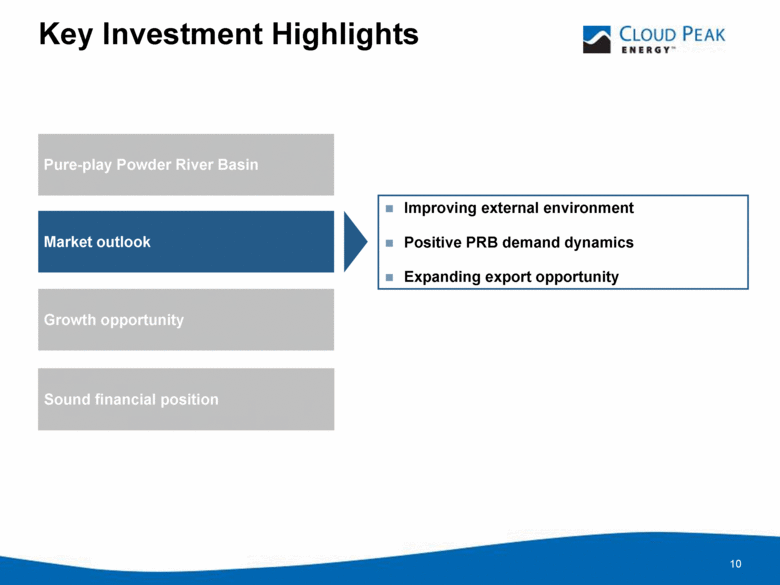
3 Cloud Peak Energy Highlights Market outlook Improving external environment, positive PRB demand dynamics, expanding export opportunity Growth opportunity Positive long-term PRB pricing opportunities, production growth and lease acquisition opportunities Pure-play Powder River Basin Third-largest U.S. coal producer, operating three large surface mines in the U.S. coal basin with the greatest growth potential Sound financial position Sufficient financial capacity and capability for planned growth |
|
|
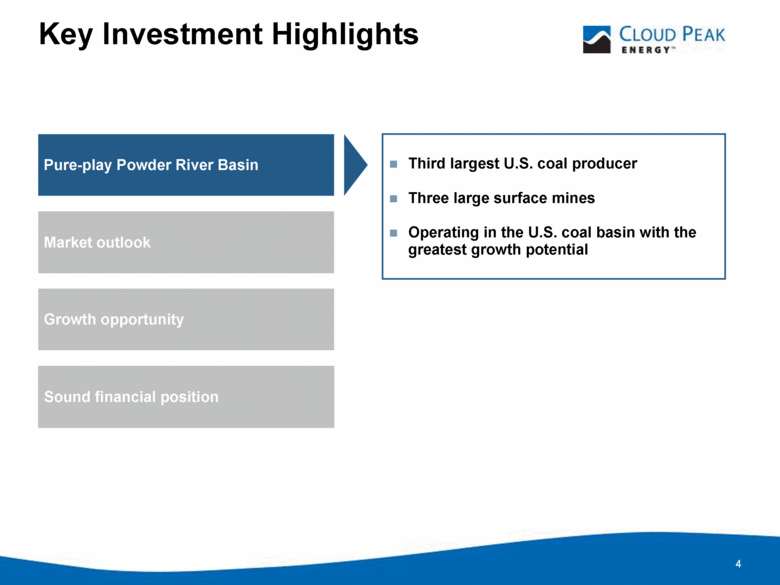
Market outlook Growth opportunity Pure-play Powder River Basin Third largest U.S. coal producer Three large surface mines Operating in the U.S. coal basin with the greatest growth potential Key Investment Highlights Sound financial position 4 |
|
|
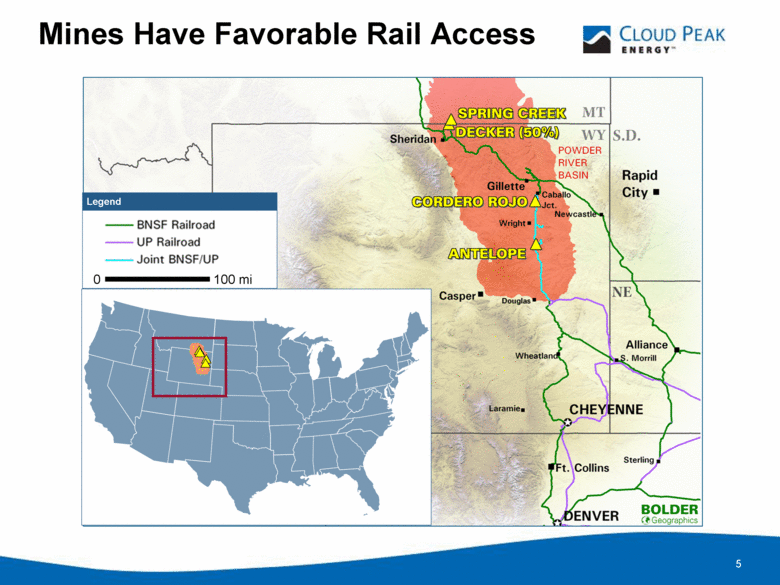
Mines Have Favorable Rail Access 0 100 mi Legend 5 |
|
|
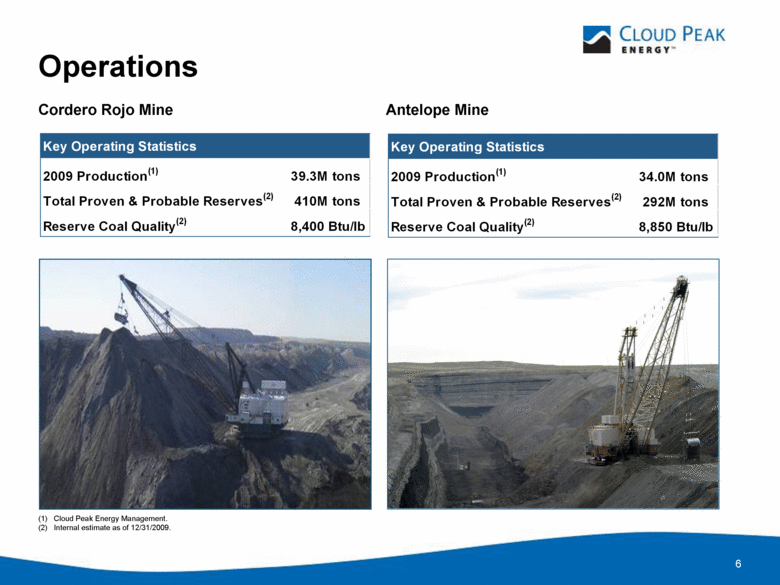
Operations 292M tons (1) Cloud Peak Energy Management. (2) Internal estimate as of 12/31/2009. Antelope Mine Cordero Rojo Mine 410M tons Key Operating Statistics 2009 Production(1) 39.3M tons Total Proven & Probable Reserves(2) Reserve Coal Quality(2) 8,400 Btu/lb Key Operating Statistics 2009 Production(1) 34.0M tons Total Proven & Probable Reserves(2) Reserve Coal Quality(2) 8,850 Btu/lb 6 |
|
|
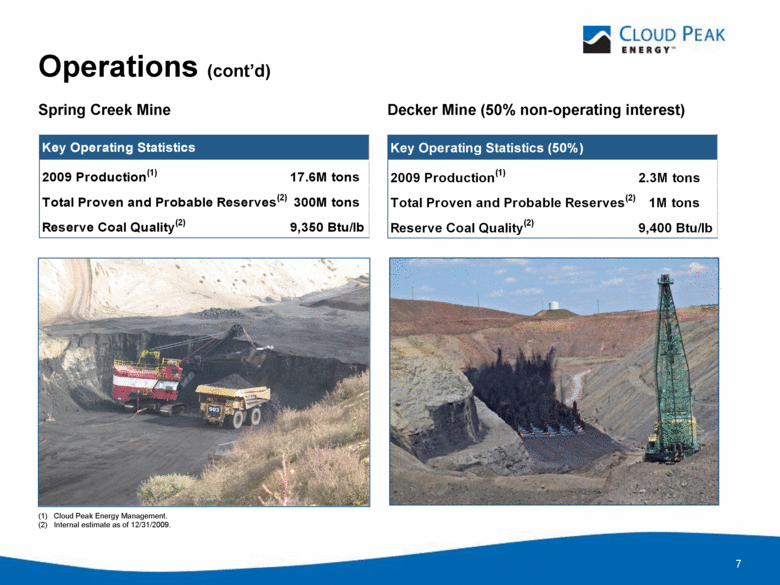
Operations (cont’d) Spring Creek Mine Decker Mine (50% non-operating interest) (1) Cloud Peak Energy Management. (2) Internal estimate as of 12/31/2009. Key Operating Statistics 2009 Production(1) 17.6M tons Total Proven and Probable Reserves(2) 300M tons Reserve Coal Quality(2) 9,350 Btu/lb Key Operating Statistics (50%) 2009 Production(1) 2.3M tons Total Proven and Probable Reserves(2) 1M tons Reserve Coal Quality(2) 9,400 Btu/lb 7 |
|
|
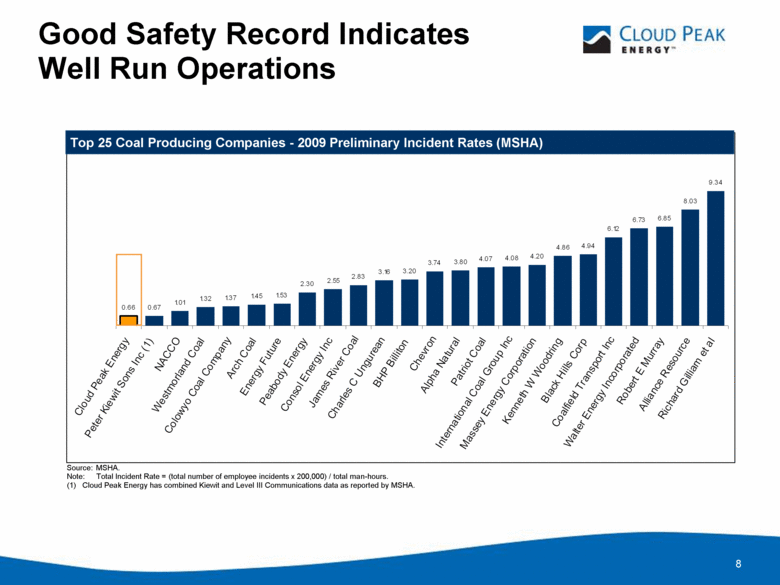
8 Top 25 Coal Producing Companies - 2009 Preliminary Incident Rates (MSHA) Source: MSHA. Note: Total Incident Rate = (total number of employee incidents x 200,000) / total man-hours. (1) Cloud Peak Energy has combined Kiewit and Level III Communications data as reported by MSHA. Good Safety Record Indicates Well Run Operations 0.66 0.67 1.01 1.32 1.37 1.45 1.53 2.30 2.55 2.83 3.16 3.20 3.74 3.80 4.07 4.08 4.20 4.86 4.94 6.12 6.73 6.85 8.03 9.34 Cloud Peak Energy Peter Kiewit Sons Inc (1) NACCO Westmorland Coal Colowyo Coal Company Arch Coal Energy Future Peabody Energy Consol Energy Inc James River Coal Charles C Ungurean BHP Billiton Chevron Alpha Natural Patriot Coal International Coal Group Inc Massey Energy Corporation Kenneth W Woodring Black Hills Corp Coalfield Transport Inc Walter Energy Incorporated Robert E Murray Alliance Resource Richard Gilliam et al |
|
|
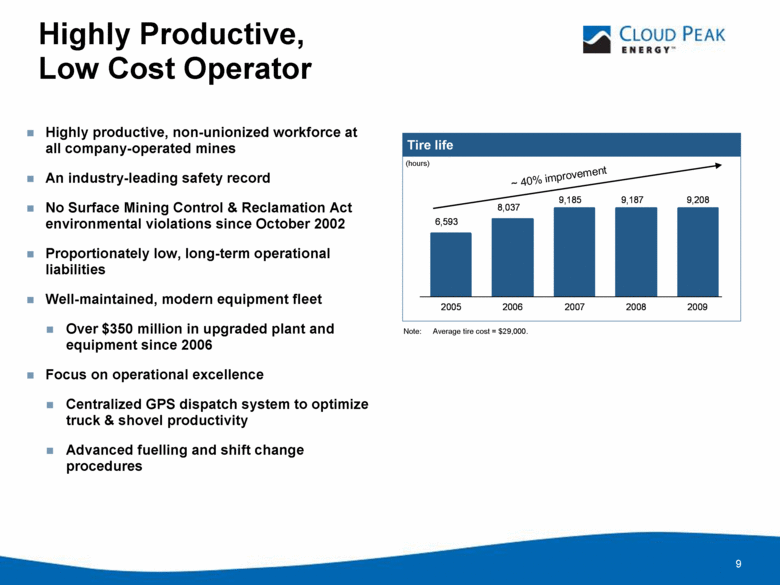
Highly Productive, Low Cost Operator Highly productive, non-unionized workforce at all company-operated mines An industry-leading safety record No Surface Mining Control & Reclamation Act environmental violations since October 2002 Proportionately low, long-term operational liabilities Well-maintained, modern equipment fleet Over $350 million in upgraded plant and equipment since 2006 Focus on operational excellence Centralized GPS dispatch system to optimize truck & shovel productivity Advanced fuelling and shift change procedures Tire life (hours) ~ 40% improvement Note: Average tire cost = $29,000. 6,593 8,037 9,185 9,187 9,208 2005 2006 2007 2008 2009 9 |
|
|
Growth opportunity Market outlook Improving external environment Positive PRB demand dynamics Expanding export opportunity Key Investment Highlights Pure-play Powder River Basin Sound financial position 10 |
|
|
11 External Environment Improving Electricity demand recovering EEI estimated U.S. electric generation increased by 4.3% through August 2010 compared to the same period in 2009 EIA is forecasting total 2010 generation will increase by 4.0% compared to 2009 Coal production EIA estimates total U.S. coal production down approximately 1.3% year-to-date through August compared to same period in 2009 Appalachian coal production down 1.8% PRB rail shipments up 2% Sources: EEI – Edison Electric Institute EIA – Energy Information Administration |
|
|
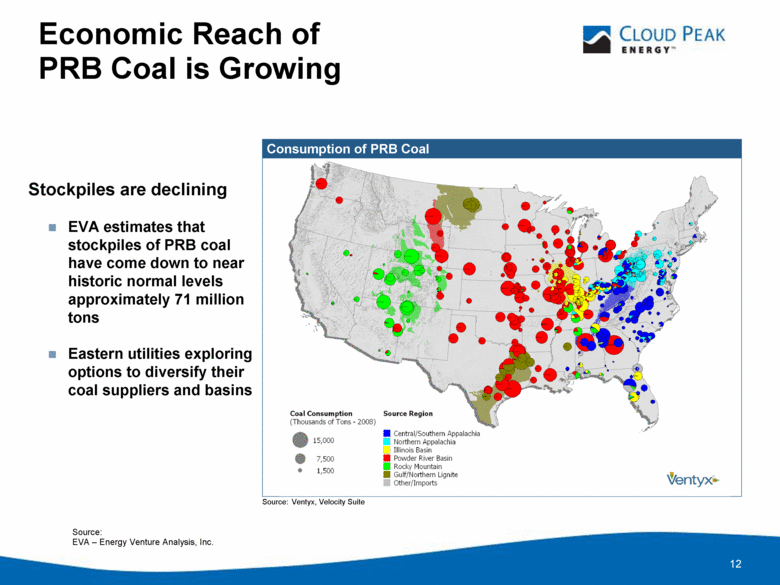
Economic Reach of PRB Coal is Growing Source: Ventyx, Velocity Suite Consumption of PRB Coal 12 Stockpiles are declining EVA estimates that stockpiles of PRB coal have come down to near historic normal levels approximately 71 million tons Eastern utilities exploring options to diversify their coal suppliers and basins Source: EVA – Energy Venture Analysis, Inc. |
|
|
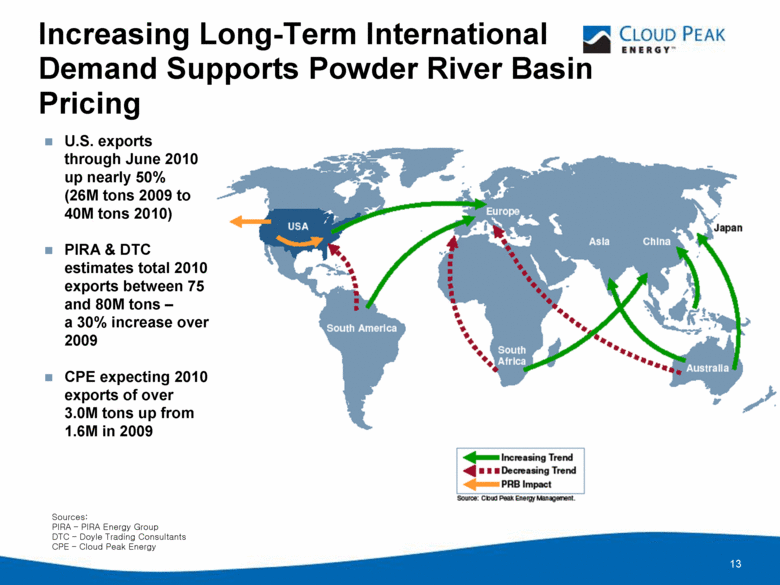
13 Increasing Long-Term International Demand Supports Powder River Basin Pricing U.S. exports through June 2010 up nearly 50% (26M tons 2009 to 40M tons 2010) PIRA & DTC estimates total 2010 exports between 75 and 80M tons – a 30% increase over 2009 CPE expecting 2010 exports of over 3.0M tons up from 1.6M in 2009 Sources: PIRA – PIRA Energy Group DTC – Doyle Trading Consultants CPE – Cloud Peak Energy |
|
|
Growth opportunities Positive long-term PRB pricing opportunities Production growth opportunities Lease acquisition opportunities Market outlook Key Investment Highlights Pure-play Powder River Basin Sound financial position 14 |
|
|
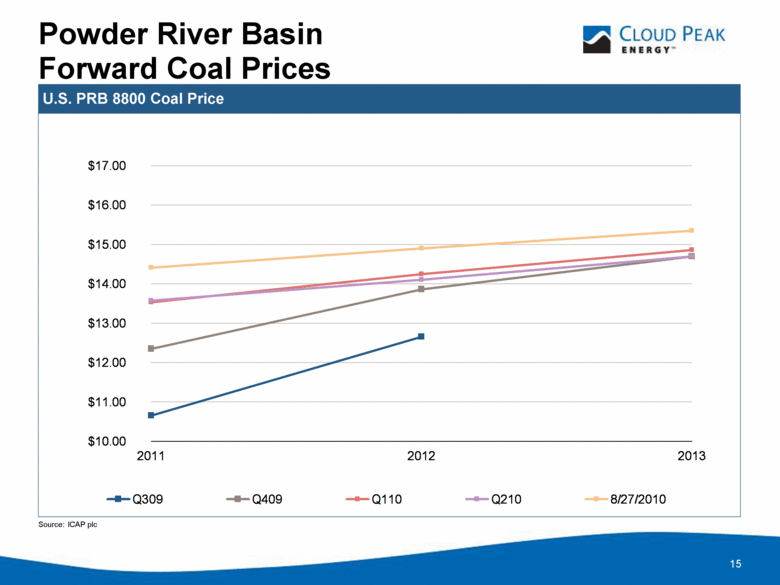
Powder River Basin Forward Coal Prices U.S. PRB 8800 Coal Price Source: ICAP plc 15 $10.00 $11.00 $12.00 $13.00 $14.00 $15.00 $16.00 $17.00 2011 2012 2013 Q309 Q409 Q110 Q210 8/27/2010 |
|
|
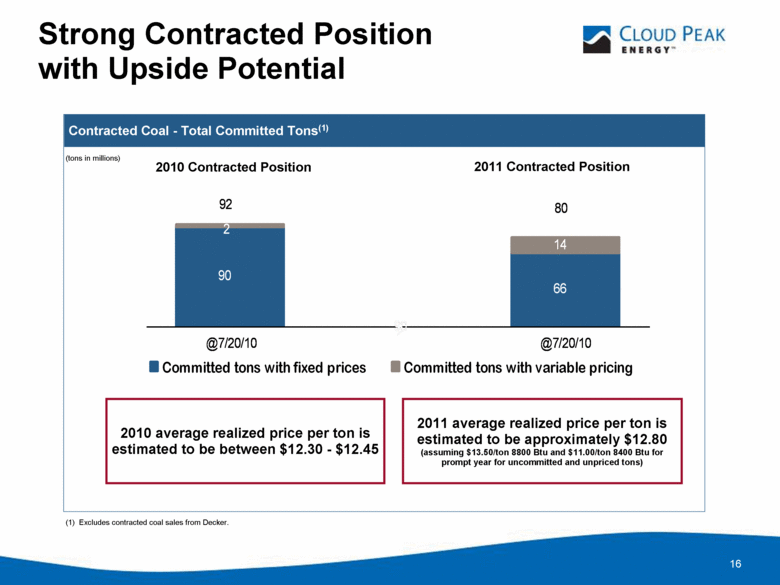
Strong Contracted Position with Upside Potential Contracted Coal - Total Committed Tons(1) 2010 Contracted Position 2011 Contracted Position (1) Excludes contracted coal sales from Decker. (tons in millions) 16 2010 average realized price per ton is estimated to be between $12.30 - $12.45 2011 average realized price per ton is estimated to be approximately $12.80 (assuming $13.50/ton 8800 Btu and $11.00/ton 8400 Btu for prompt year for uncommitted and unpriced tons) 66 14 90 90 2 2 80 92 @7/20/10 @7/20/10 Committed tons with fixed prices Committed tons with variable pricing |
|
|
17 Future U.S. Coal Demand Met by Powder River Basin Low-cost coal supply Surface mining More supportive local environment for coal mining Low sulfur content Ample rail capacity |
|
|
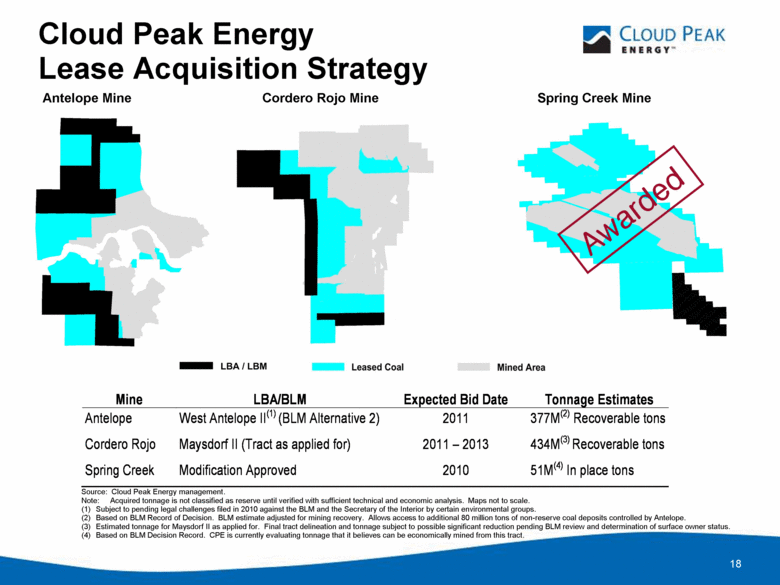
18 Cloud Peak Energy Lease Acquisition Strategy Source: Cloud Peak Energy management. Note: Acquired tonnage is not classified as reserve until verified with sufficient technical and economic analysis. Maps not to scale. (1) Subject to pending legal challenges filed in 2010 against the BLM and the Secretary of the Interior by certain environmental groups. (2) Based on BLM Record of Decision. BLM estimate adjusted for mining recovery. Allows access to additional 80 million tons of non-reserve coal deposits controlled by Antelope. (3) Estimated tonnage for Maysdorf II as applied for. Final tract delineation and tonnage subject to possible significant reduction pending BLM review and determination of surface owner status. (4) Based on BLM Decision Record. CPE is currently evaluating tonnage that it believes can be economically mined from this tract. Antelope Mine Cordero Rojo Mine Spring Creek Mine Awarded Mine LBA /BLM Expected Bid Date Tonnage Estimates Antelope West Antelope II (1) (BLM Alternative 2) 2011 377M(2) Recoverable tons Cordero Rojo Maysdorf II (Tract as applied for) 2011 – 2013 434M(3) Recoverable tons Spring Creek Modification Approved 2010 51M(4) In place tons |
|
|
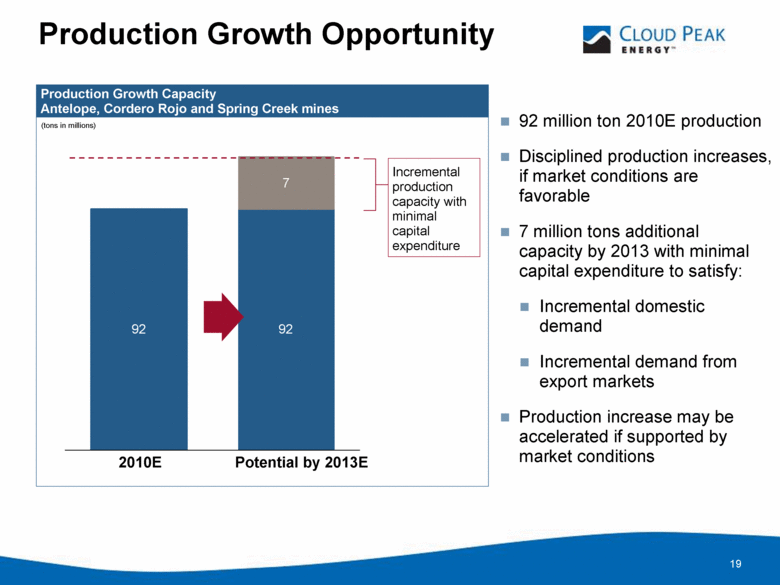
19 Production Growth Opportunity 92 million ton 2010E production Disciplined production increases, if market conditions are favorable 7 million tons additional capacity by 2013 with minimal capital expenditure to satisfy: Incremental domestic demand Incremental demand from export markets Production increase may be accelerated if supported by market conditions Incremental production capacity with minimal capital expenditure 2010E Production Growth Capacity Antelope, Cordero Rojo and Spring Creek mines (tons in millions) Potential by 2013E 92 92 7 |
|
|
Growth opportunity Market Outlook Key Investment Highlights Sound financial position Pure-play Powder River Basin Sufficient financial capacity Capability for planned growth 20 |
|
|
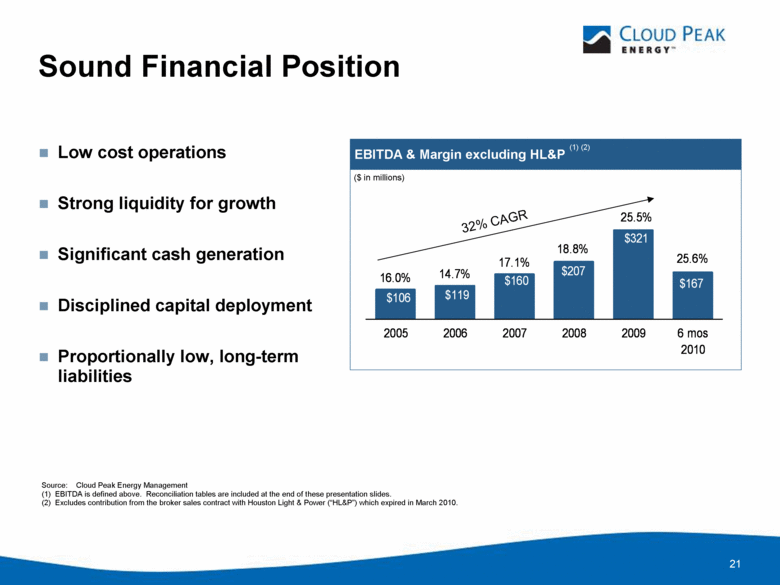
21 Sound Financial Position Source: Cloud Peak Energy Management (1) EBITDA is defined above. Reconciliation tables are included at the end of these presentation slides. (2) Excludes contribution from the broker sales contract with Houston Light & Power (“HL&P”) which expired in March 2010. EBITDA & Margin excluding HL&P (1) (2) ($ in millions) 32% CAGR (1) Low cost operations Strong liquidity for growth Significant cash generation Disciplined capital deployment Proportionally low, long-term liabilities $167 $106 $119 $160 $207 $321 25.6% 16.0% 14.7% 17.1% 25.5% 18.8% 2005 2006 2007 2008 2009 6 mos 2010 |
|
|
22 First Half 2010 Highlights Operations ran well without any significant issues PRB prices rising strongly to over $15/ton 8800 Btu (OTC prices) – up 25% YTD Increased exports to Asian utilities Cost guidance improved Continued excellent safety record All Injury Frequency Rate (AIFR) of 0.62 first six months 2010, 0.66 last year Continued commitment to environmental stewardship Received reclamation award from Wyoming Department of Environmental Quality |
|
|
23 Cloud Peak Energy Highlights Market outlook Improving external environment, positive PRB demand dynamics, expanding export opportunity Growth opportunity Positive long-term PRB pricing opportunities, production growth and lease acquisition opportunities Pure-play Powder River Basin Third-largest U.S. coal producer operating three large surface mines in the U.S. coal basin with the greatest growth potential Sound financial position Sufficient financial capacity and capability for planned growth |
|
|
Appendices (Cloud Peak Energy Inc.) 24 |
|
|
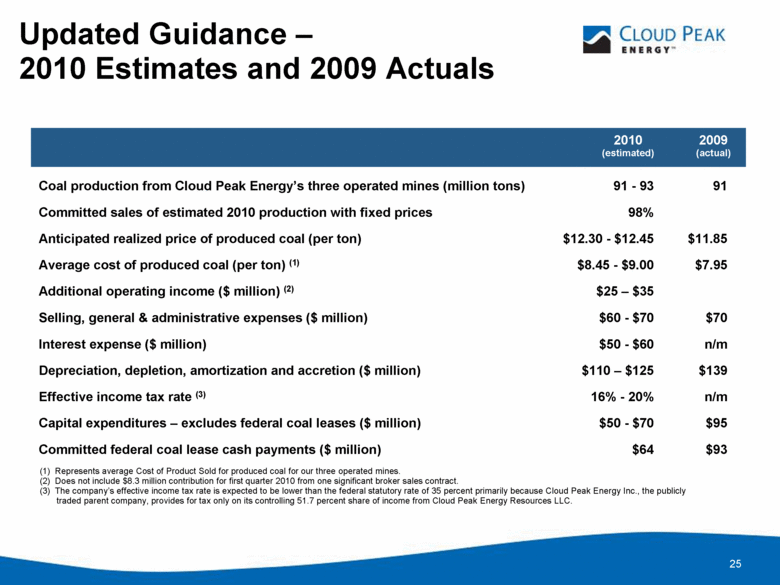
25 Updated Guidance – 2010 Estimates and 2009 Actuals 2009 (actual) 2010 (estimated) (1) Represents average Cost of Product Sold for produced coal for our three operated mines. (2) Does not include $8.3 million contribution for first quarter 2010 from one significant broker sales contract. (3) The company’s effective income tax rate is expected to be lower than the federal statutory rate of 35 percent primarily because Cloud Peak Energy Inc., the publicly traded parent company, provides for tax only on its controlling 51.7 percent share of income from Cloud Peak Energy Resources LLC. $11.85 $12.30 - $12.45 Anticipated realized price of produced coal (per ton) n/m 16% - 20% Effective income tax rate (3) n/m $50 - $60 Interest expense ($ million) $70 $60 - $70 Selling, general & administrative expenses ($ million) $95 $50 - $70 Capital expenditures – excludes federal coal leases ($ million) $93 $64 Committed federal coal lease cash payments ($ million) $139 $110 – $125 Depreciation, depletion, amortization and accretion ($ million) $25 – $35 Additional operating income ($ million) (2) $7.95 $8.45 - $9.00 Average cost of produced coal (per ton) (1) 98% Committed sales of estimated 2010 production with fixed prices 91 91 - 93 Coal production from Cloud Peak Energy’s three operated mines (million tons) |
|
|
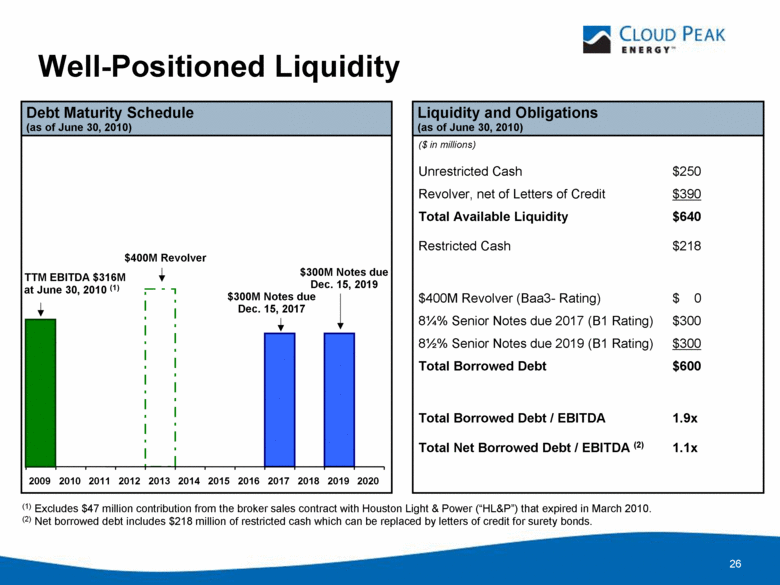
2009 2010 2011 2012 2013 2014 2015 2016 2017 2018 2019 2020 Well-Positioned Liquidity ($ in millions) Unrestricted Cash $250 Revolver, net of Letters of Credit $390 Total Available Liquidity $640 Restricted Cash $218 $400M Revolver (Baa3- Rating) $ 0 8¼% Senior Notes due 2017 (B1 Rating) $300 8½% Senior Notes due 2019 (B1 Rating) $300 Total Borrowed Debt $600 Total Borrowed Debt / EBITDA 1.9x Total Net Borrowed Debt / EBITDA (2) 1.1x (1) Excludes $47 million contribution from the broker sales contract with Houston Light & Power (“HL&P”) that expired in March 2010. (2) Net borrowed debt includes $218 million of restricted cash which can be replaced by letters of credit for surety bonds. Liquidity and Obligations (as of June 30, 2010) 26 $400M Revolver $300M Notes due Dec. 15, 2017 $300M Notes due Dec. 15, 2019 Debt Maturity Schedule (as of June 30, 2010) TTM EBITDA $316M at June 30, 2010 (1) |
|
|
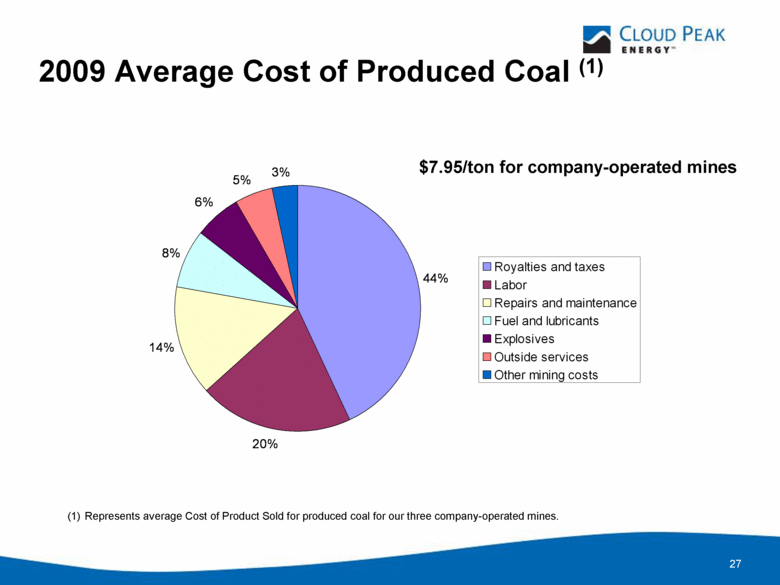
2009 Average Cost of Produced Coal (1) (1) Represents average Cost of Product Sold for produced coal for our three company-operated mines. $7.95/ton for company-operated mines 44% 20% 14% 8% 6% 5% 3% Royalties and taxes Labor Repairs and maintenance Fuel and lubricants Explosives Outside services Other mining costs 27 |
|
|
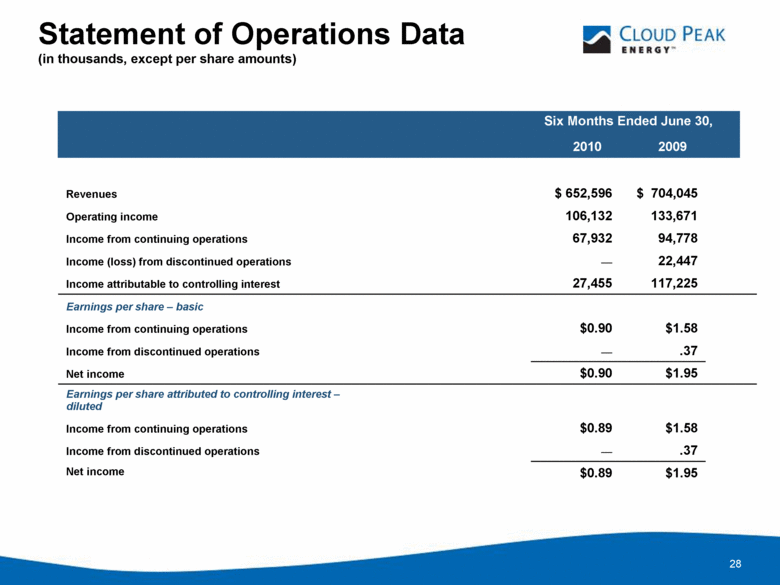
28 Statement of Operations Data (in thousands, except per share amounts) $1.95 $0.89 Net income .37 — Income from discontinued operations $1.58 $0.89 Income from continuing operations Earnings per share attributed to controlling interest – diluted $1.95 $0.90 Net income .37 — Income from discontinued operations $1.58 $0.90 Income from continuing operations Earnings per share – basic 117,225 27,455 Income attributable to controlling interest 22,447 — Income (loss) from discontinued operations 94,778 67,932 Income from continuing operations 133,671 106,132 Operating income $ 704,045 $ 652,596 Revenues 2009 2010 Six Months Ended June 30, |
|
|
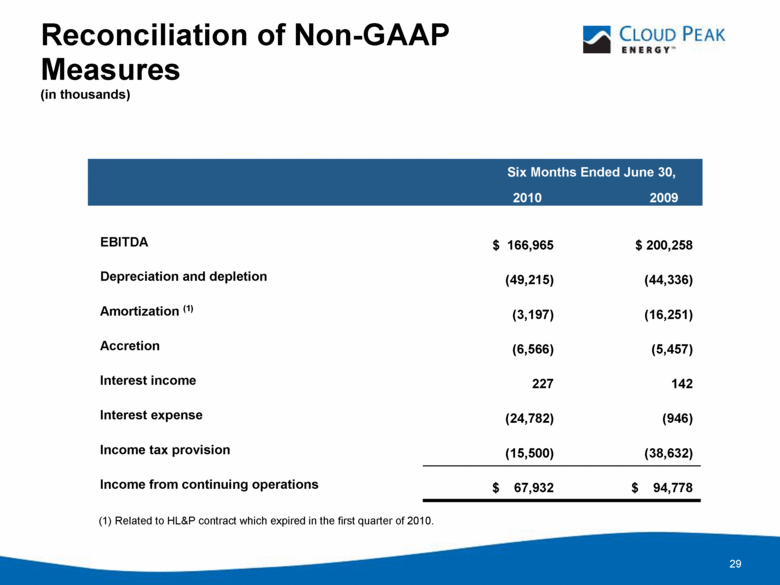
29 Reconciliation of Non-GAAP Measures (in thousands) $ 94,778 $ 67,932 Income from continuing operations (38,632) (15,500) Income tax provision (946) (24,782) Interest expense 142 227 Interest income (5,457) (6,566) Accretion (16,251) (3,197) Amortization (1) (44,336) (49,215) Depreciation and depletion $ 200,258 $ 166,965 EBITDA 2009 2010 Six Months Ended June 30, (1) Related to HL&P contract which expired in the first quarter of 2010. |
|
|
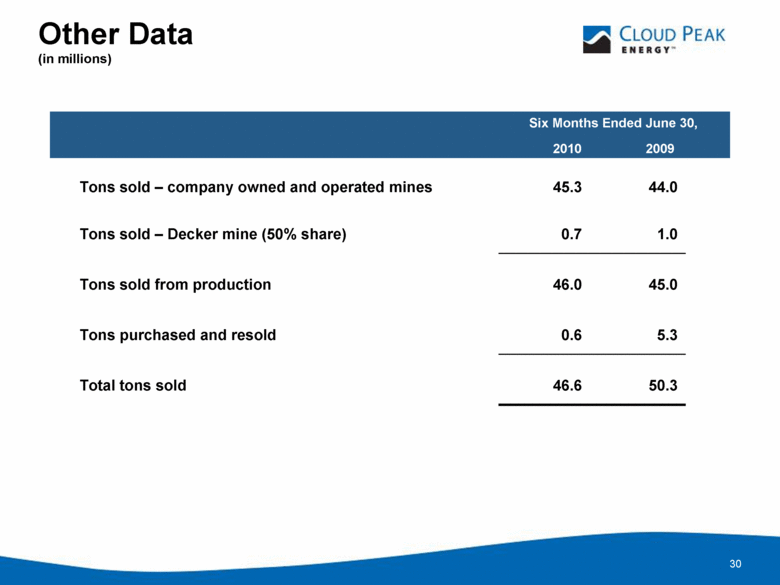
30 Other Data (in millions) 50.3 46.6 Total tons sold 5.3 0.6 Tons purchased and resold 45.0 46.0 Tons sold from production 1.0 0.7 Tons sold – Decker mine (50% share) 44.0 45.3 Tons sold – company owned and operated mines 2009 2010 Six Months Ended June 30, |
|
|
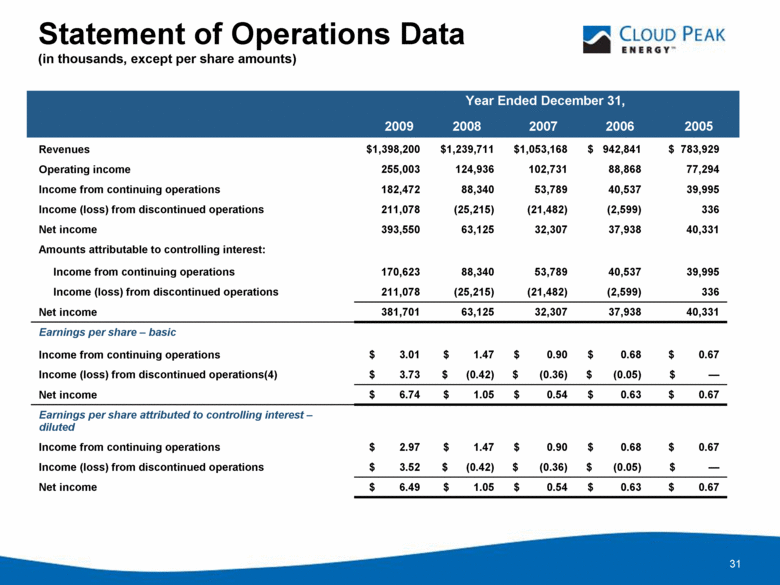
31 Statement of Operations Data (in thousands, except per share amounts) $ 0.67 $ 0.63 $ 0.54 $ 1.05 $ 6.49 Net income $ — $ (0.05) $ (0.36) $ (0.42) $ 3.52 Income (loss) from discontinued operations $ 0.67 $ 0.68 $ 0.90 $ 1.47 $ 2.97 Income from continuing operations Earnings per share attributed to controlling interest – diluted $ 0.67 $ 0.63 $ 0.54 $ 1.05 $ 6.74 Net income $ — $ (0.05) $ (0.36) $ (0.42) $ 3.73 Income (loss) from discontinued operations(4) $ 0.67 $ 0.68 $ 0.90 $ 1.47 $ 3.01 Income from continuing operations Earnings per share – basic 40,331 37,938 32,307 63,125 381,701 Net income 336 (2,599) (21,482) (25,215) 211,078 Income (loss) from discontinued operations 39,995 40,537 53,789 88,340 170,623 Income from continuing operations Amounts attributable to controlling interest: 40,331 37,938 32,307 63,125 393,550 Net income 336 (2,599) (21,482) (25,215) 211,078 Income (loss) from discontinued operations 39,995 40,537 53,789 88,340 182,472 Income from continuing operations 77,294 88,868 102,731 124,936 255,003 Operating income $ 783,929 $ 942,841 $1,053,168 $1,239,711 $1,398,200 Revenues 2005 2006 2007 2008 2009 Year Ended December 31, |
|
|
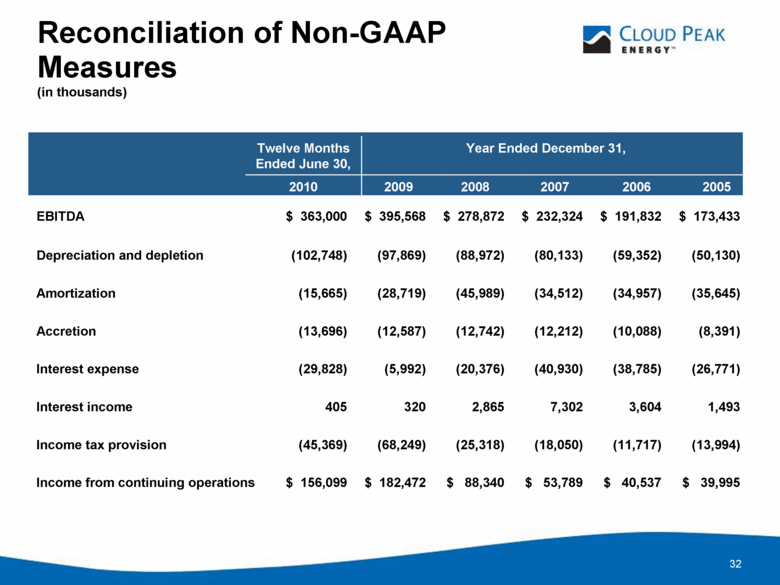
32 Reconciliation of Non-GAAP Measures (in thousands) $ 39,995 $ 40,537 $ 53,789 $ 88,340 $ 182,472 $ 156,099 Income from continuing operations (13,994) (11,717) (18,050) (25,318) (68,249) (45,369) Income tax provision 1,493 3,604 7,302 2,865 320 405 Interest income (26,771) (38,785) (40,930) (20,376) (5,992) (29,828) Interest expense (8,391) (10,088) (12,212) (12,742) (12,587) (13,696) Accretion (35,645) (34,957) (34,512) (45,989) (28,719) (15,665) Amortization (50,130) (59,352) (80,133) (88,972) (97,869) (102,748) Depreciation and depletion $ 173,433 $ 191,832 $ 232,324 $ 278,872 $ 395,568 $ 363,000 EBITDA 2005 2006 2007 2008 2009 2010 Year Ended December 31, Twelve Months Ended June 30, |
|
|
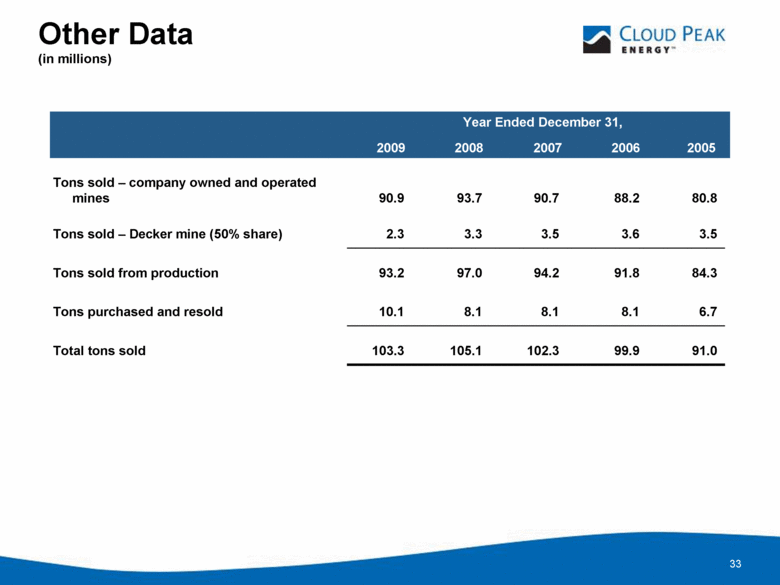
33 Other Data (in millions) 91.0 99.9 102.3 105.1 103.3 Total tons sold 6.7 8.1 8.1 8.1 10.1 Tons purchased and resold 84.3 91.8 94.2 97.0 93.2 Tons sold from production 3.5 3.6 3.5 3.3 2.3 Tons sold – Decker mine (50% share) 80.8 88.2 90.7 93.7 90.9 Tons sold – company owned and operated mines 2005 2006 2007 2008 2009 Year Ended December 31, |
|
|
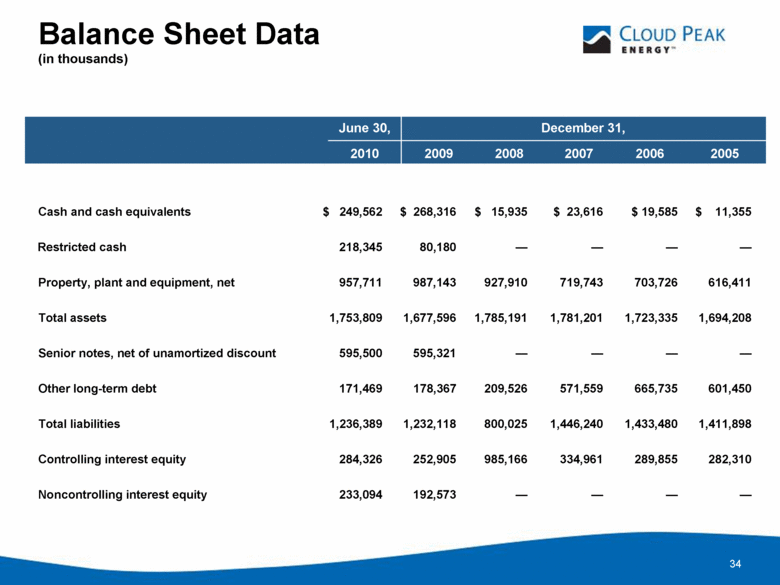
34 Balance Sheet Data (in thousands) 233,094 284,326 1,236,389 171,469 595,500 1,753,809 957,711 218,345 $ 249,562 — — — — 80,180 Restricted cash — — — — 192,573 Noncontrolling interest equity 282,310 289,855 334,961 985,166 252,905 Controlling interest equity 1,411,898 1,433,480 1,446,240 800,025 1,232,118 Total liabilities 601,450 665,735 571,559 209,526 178,367 Other long-term debt — — — — 595,321 Senior notes, net of unamortized discount 1,694,208 1,723,335 1,781,201 1,785,191 1,677,596 Total assets 616,411 703,726 719,743 927,910 987,143 Property, plant and equipment, net $ 11,355 $ 19,585 $ 23,616 $ 15,935 $ 268,316 Cash and cash equivalents 2010 June 30, 2005 2006 2007 2008 2009 December 31, |