Attached files
| file | filename |
|---|---|
| 8-K - FORM 8-K - BRYN MAWR BANK CORP | d8k.htm |
 Bryn Mawr
Bank Corporation
NASDAQ: BMTC
Second Quarter 2010 Update
Exhibit 99.1 |
 1
Safe Harbor
This presentation contains statements which, to the extent that they are not
recitations of historical fact may constitute forward-looking statements within
the meaning of the United States Private Securities Litigation Reform Act of
1995.
Please see the section titled Safe Harbor at the end of the presentation for
more information regarding these types of statements.
|
 2
Bryn Mawr
Bank Corporation
Profile
Founded in 1889 –
120 year history
A unique business model with a traditional commercial bank ($1.2
billion)
and a trust company ($3.1 billion) under one roof at June 30, 2010
Upon the acquisition of First Keystone Financial Inc. on July 1,
2010,
commercial bank assets increased to $1.8 billion
Wholly owned subsidiary –
The Bryn Mawr
Trust Company
Located on Philadelphia’s affluent “Main Line”
Celebrated 25 years on the NASDAQ in August 2010 |
 3
(*)
Includes 7 limited service retirement
community branches
Bryn Mawr
Bank Corp. (16)
First Keystone Financial, Inc. (8)
Expanding Southeast PA Footprint
($ in millions)
BMTC
FKFS
Pro Forma *
Assets
$1,281
$483
$1,768
Loans
899
292
1,172
Deposits
953
319
1,274
Branches (*)
16
8
24
Pro Forma Financials
* Estimated |
 4
Investment Considerations
A great brand & franchise
Solid financial fundamentals
Excellent credit quality
Outstanding target market demographics
New business initiatives driving growth
Well-capitalized
$3.1 billion wealth management business that provides a significant
source of non-interest income |
 5
Experienced Management Team
Chairman, President and CEO –
Ted Peters
Lending –
Joseph Keefer
Wealth
Management
–
Frank
Leto
Retail
Banking
–
Alison
Gers
Finance
–
Duncan
Smith,
CPA
Risk
Management
–
Geoffrey
Halberstadt |
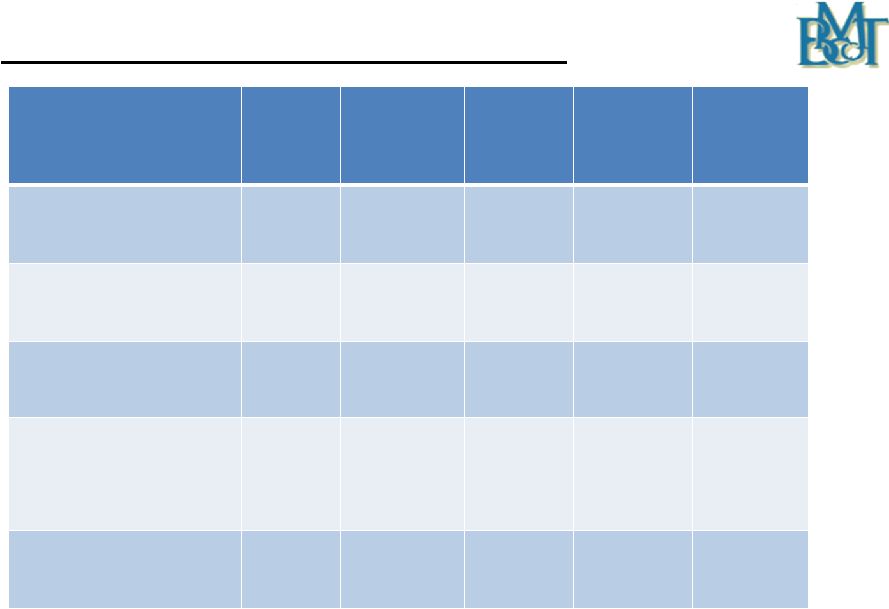
 6
Financial Highlights
2
nd
Qtr
2010
1
st
Qtr
2010
4
th
Qtr
2009
3
rd
Qtr
2009
2
nd
Qtr
2009
Portfolio Loans & Leases
($ in millions)
$899
$893
$886
$886
$878
Total Wealth Assets
($ in billions)
$3.10
$3.11
$2.87
$2.71
$2.26
Total Deposits
($ in millions)
$953
$914
$938
$899
$894
Tangible Book Value Per
Share
$11.15
$10.56
$10.40
$10.44
$10.15
Tangible Common Equity
Ratio
9.30%
7.82%
7.51%
7.74%
7.43%
Dividends Declared
$0.14
$0.14
$0.14
$0.14
$0.14 |
 7
Financial Highlights -
continued
2
nd
Qtr
2010
1
st
Qtr
2010
4
th
Qtr
2009
3
rd
Qtr
2009
2
nd
Qtr
2009
Net Income
($ in millions)
$2.41
$2.22
$2.64
$2.62
$2.45
Basic Earnings Per
Common Share
$0.25
$0.25
$0.30
$0.30
$0.28
Diluted Earnings Per
Common Share
$0.25
$0.25
$0.30
$0.30
$0.28
Non-performing Loans as
a % of Portfolio Loans
and Leases
1.11%
0.77%
0.78%
0.78%
0.41%
Allowance for Loan and
Lease Losses
1.09%
1.09%
1.18%
1.16%
1.18% |
 8
2010 Strategies
Introduce Bryn Mawr
Trust services to First Keystone customers
Focus on the net interest margin
Continued emphasis on strong credit quality
Raise capital as needed
Monitor expenses
Use banking industry turmoil to attract new clients
Opportunistic expansion
Expand our Wealth Management offerings |
 Growth Initiatives |
 10
Acquisition of First Keystone Financial, Inc. (legal closing completed on
July 1, 2010)
Announced on November 2, 2009
Approximately $500 million in assets
Expands footprint in Delaware and Chester (southeastern PA)
counties with 8 branches
New opportunities for BMTC Wealth Management, Business
Banking, Retail Banking and Mortgage Banking
System conversion was completed on August 23, 2010 and response
has been favorable
8K-A with pro forma financials due by September 14, 2010
Growth Initiatives |
 11
Growth Initiatives -
continued
Bryn Mawr
Asset Management
“Lift out”
strategy
Four investment advisers hired
Approximately $200 million in new assets as of June 30, 2010
Additional opportunities being evaluated
Institutional Trust and Escrow Services |
 12
BMTC of Delaware
The Delaware Advantage
Generation Skipping Trusts
Directed Trusts
$485 million in assets at June 30, 2010
Branch Office Expansion and Modernization
West Chester Regional Banking Center Branch
Wayne and Paoli branch modernizations completed
Havertown branch modernization scheduled for 2010
Growth Initiatives -
continued |
 13
Growth Initiatives -
continued
Small Ticket National Leasing Business
“Lift out”
strategy
Leases outstanding: $40 million at June 30, 2010
Planned lease portfolio reduction of $27 million over the last 12 months.
Goal is to slowly grow the portfolio while maintaining credit quality
Average yield of 10.5%
Quarterly lease charge-offs have continuously decreased since December
31, 2008
Changes made in underwriting standards and collection process have
improved results
Delinquency rate has fallen 72 basis points over the past 12 months
|
 14
First
Keystone
Financial,
Inc.
–
Transaction
Summary
Acquirer:
Bryn Mawr
Bank Corporation (NASDAQ: BMTC)
Seller:
First Keystone Financial, Inc. (NASDAQ: FKFS)
Consideration:
Each share of FKFS common stock was exchanged for
0.6973 BMTC shares and $2.06 in cash
Transaction Value:
Board Representation:
Donald Guthrie (Chairman of the FKFS Board of Directors)
joined the BMTC Bank and Holding Company Boards as a
Director
0.6973 BMTC shares
Approximately $32 million (at closing)
Transaction completed on July 1, 2010.
Aggregate
Consideration:
1.63 million shares of BMBC common stock
$4.8 million in cash |
 15
First
Keystone
Financial
Inc.
-
Transaction
Highlights
Expands
branch
footprint
into
the
attractive
demographic
markets
of
Delaware
and
Chester
County, Pennsylvania
Important component of strategic plan
Enhances long-term franchise value
Complementary business mix
Both banks have a “community focus”
Significant potential synergies identified in wealth management services and
residential mortgage originations
Transaction elements
Extensive due diligence performed
Conservative credit mark estimated
Achievable cost savings identified
Material earnings per share accretion after expensing merger related costs
Attractive internal rate of return
Pro
Forma
capital
ratios
remain
significantly
above
“well
capitalized”
levels |
 Financial Review
Bryn Mawr
Bank Corporation Only
As of June 30, 2010 |
 17
Second Quarter 2010 Results
Net Income of $2.4 million
Included are merger and due diligence related costs associated with
the pending merger with First Keystone Financial Inc. of $637
thousand
Diluted earnings per share of $0.25
Wealth Management Assets were $3.1 billion -
up 8.0% from the fourth
quarter of 2009
Revenue from Wealth Management services was $3.9 million -
up 8.4%
from the fourth quarter of 2009 |
 18
Second Quarter 2010 Results -
continued
Tax-equivalent net interest margin at 3.80%, a slight decrease from the first
quarter due to lower rates on interest earning assets
Deposit levels of $953.5 million at June 30, 2010 as new core transaction
account openings remain strong
Total loans and leases of $899.3 million at June 30, 2010, an increase of
1.5% from the fourth quarter of 2009
Loan quality strong with non-performing loans and leases of 111 basis
points at June 30, 2010
Investment portfolio was $254.9 million at June 30, 2010 with no
OTTI
charges recorded in the first six months of 2010 or for the years ended
December 31, 2009, 2008 and 2007 |
 19
Year to Date Results –
June 30, 2010
Net income of $4.6 million
Included are merger and due diligence related costs associated with
the pending merger with First Keystone Financial Inc. of $985
thousand
Diluted earnings per share of $0.50
Revenue from Wealth Management services was $7.7 million
Tax-equivalent net interest margin at 3.93%
Return on shareholders equity: 8.33%
Return on average assets: 0.76% |
 20
Diluted Earnings Per Share
* Excludes $0.10 per share gain on sale of real estate
** Figure includes merger related costs
$1.31
$1.46
$1.48
$1.08
$1.18
$0.50
$0.00
$0.45
$0.90
$1.35
$1.80
2005
2006
2007*
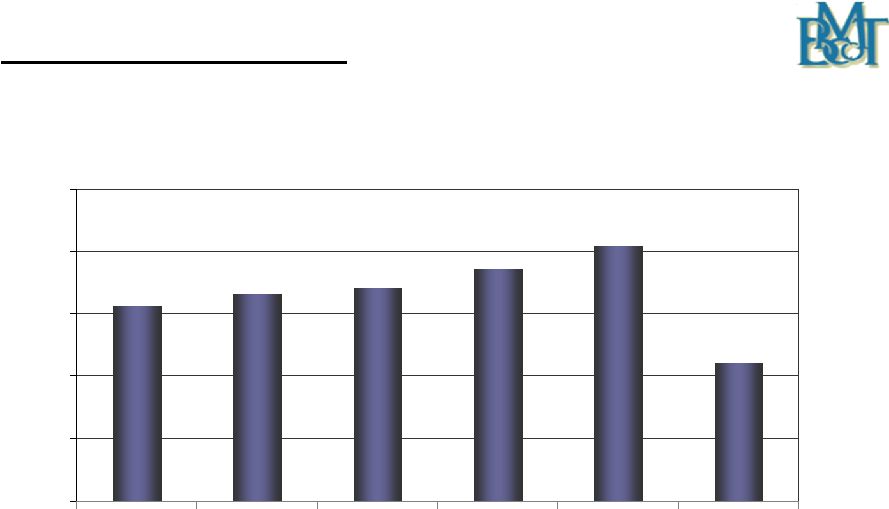
2008
2009**
2010 YTD** |
 21
Portfolio Loan & Lease Growth
Total Portfolio Loans & Leases Outstanding
CAGR : 10.5% (2005-2009)
($ in millions)
* Estimated
$595
$681
$803
$900
$886
$899
$1,172
$200
$400
$600
$800
$1,000
$1,200
2005
2006
2007
2008
2009
6/30/10
Pro Forma * |
 22
Asset Quality
Asset Quality
2
nd
Qtr
2010
4
th
Qtr
2009
2
nd
Qtr
2009
Non-accrual loans and leases
$9,072
$6,246
$2,913
90+
days
past
due
loans
–
still
accruing
$892
$668
$746
Non-performing loans and leases
$9,964
$6,914
$3,659
Other non-performing assets
$1,970
$1,025
$1,897
Non-performing assets
$11,934
$7,939
$5,556
Non-performing loans and leases / portfolio loans
1.11%
0.78%
0.41%
Non-performing assets / assets
0.94%
0.64%
0.47%
($ in thousands) |
 23
Asset Quality
2
nd
Qtr
2010
4
th
Qtr
2009
2
nd
Qtr
2009
Allowance for loan and lease losses
$9,841
$10,424
$10,389
Net loan and lease charge-offs (annualized) /
average loans
0.40%
0.53%
0.64%
Delinquency rate –
loans and leases > 30 days
1.37%
1.10%
0.81%
Delinquent
loans
and
leases
-
30-89
days
$2,481
$2,678
$3,360
Delinquency rate –
loans and leases 30-89 days
0.28%
0.30%
0.38%
TDR’s
excluded from non-performing loans
$2,000
$1,622
$1,562
Allowance for loan and leases losses / loans and
leases
1.09%
1.18%
1.18%
Allowance for loan and lease loss / non-performing
loans and leases
98.8%
150.8%
283.9%
Asset Quality -
continued
($ in thousands) |
 24
0.07%
0.12%
0.25%
0.78%
0.78%
1.11%
0.0%
0.2%
0.4%
0.6%
0.8%
1.0%
1.2%
1.4%
2005
2006
2007
2008
2009
6/30/2010 *
Asset Quality -
continued
Non-performing loans and leases as a % of portfolio loans and
leases
* A single commercial relationship in 2010 accounted for 0.64% of the 1.11%.
|
 25
Loan Composition at June 30, 2010
$279
$235
$193
$108
$44
$40
Commercial Mortgages
Commercial & Industrial
Home Equity Lines & Loans & Consumer Loans
Residential Mortgages
Construction
Leases
($ in millions) |
 26
$31.3
$33.3
$34.2
$37.1
$40.8
$22.2
$0
$10
$20
$30
$40
$50
2005
2006
2007
2008
2009
2010 YTD
Net Interest Income
CAGR: 6.9% (2005-2009)
Note: Not on a tax-equivalent basis
($ in millions) |
 27
3.59%
3.72%
3.85%
4.06%
3.80%
3.2%
3.4%
3.6%
3.8%
4.0%
4.2%
Jun-09
Sep-09
Dec-09
Mar-10
Jun-10
Net Interest Margin
On a tax-equivalent basis |
 28
Deposit Growth
Average Annual Deposits
($ in millions)
* Estimated
$626
$709
$798
$888
$943
$1,274
$200
$400
$600
$800
$1,000
$1,200
$1,400
2006
2007
2008
2009
2nd Qtr 2010
7/1/2010* |
 29
Average Deposits & Borrowed Funds Mix
Second Quarter 2010
$193
$505
$143
$102
$143
$23
Non-Interest Bearing DDA
Savings, NOW & Money Market
Time Deposits
Wholesale Deposits, IND & IDC
Borrowed Funds
Subordinated Debt
($ in millions) |
 30
Investment Portfolio as of June 30, 2010
SECURITY DESCRIPTION (AFS)
Amortized
Cost
Fair
Value
Unrealized
Gain / Loss
U.S. Treasury Obligations
$5,013
$5,148
$135
U. S. Government Agency
167,455
168,440
985
State, County & Municipal
25,978
26,316
338
FNMA/FHLMC Mortgage Backed Securities
11,665
12,098
433
GNMA Mortgage Backed Securities
2,490
2,513
23
Foreign Debt Securities
1,250
1,250
-
Bond –
Mutual Funds
38,584
39,123
539
Total Investment Portfolio
$252,435
$254,888
$2,453
Note: Other assets at June 30, 2010 include approximately $8 million of FHLB of
Pittsburgh common stock at cost which is not paying a dividend and cannot be
redeemed. First Keystone Financial has approximately $7 million of FHLB of Pittsburgh stock at July 1, 2010.
($ in thousands)
The combined investment portfolio is estimated to be approximately $356 million on
July 1, 2010 after the acquisition. |
 31
Capital Considerations
Bryn Mawr
Bank Corporation elected not to take TARP Capital
Registered Direct Offering closed on May 18, 2010 raising $24.7 million
after deducting fees and expenses
Maintains a “well capitalized”
capital position
Selectively add capital as needed to maintain capital levels and
fund asset
growth and acquisitions
Additional earn out payments for Lau Associates at the end of 2010 and
2011
Active Dividend Reinvestment and Direct Stock Purchase Plan
(DRIP/DSPP) |
 32
Capital Position -
Bryn Mawr
Bank Corporation
6/30/2010
12/31/2009
6/30/2009
Tier I
11.50%
9.41%
9.27%
Total (Tier II)
14.50%
12.53%
12.43%
Tier I Leverage
9.98%
8.35%
8.22%
Tangible Common
Equity
9.30%
7.51%
7.43%
Excludes First Keystone Financial, Inc. transaction |
 33
Capital Position -
Bryn Mawr
Trust Company (“Bank”)
6/30/2010
12/31/2009
6/30/2009
Tier I
10.72%
9.06%
8.71%
Total (Tier II)
13.73%
12.20%
11.89%
Tier I Leverage
9.29%
8.03%
7.72%
Excludes First Keystone Financial, Inc. transaction |
 34
$2.04
$2.18
$2.28
$2.15
$2.87
$3.10
$1.0
$2.0
$3.0
$4.0
2005
2006
2007
2008
2009
6/30/2010
Wealth Management Assets Under Management,
Administration, Supervision and Brokerage
(1)
($ in billions)
(1) Excludes Community Bank’s assets 2005 -
2007 |
 35
$11.5
$12.4
$13.5
$13.8
$14.2
$7.7
$2.0
$5.0
$8.0
$11.0
$14.0
$17.0
2005
2006
2007
2008
2009
2010 YTD
Wealth Management Fees
CAGR: 5.4% (2005 –
2009)
($ in millions) |
 36
Summary
Outstanding franchise in a stable market
Focus on Wealth Services, Business Banking and Private Banking
Investing in growth opportunities today for earnings growth
tomorrow
Announced acquisition will expand footprint
Sound business strategy, strong asset quality, well capitalized
and solid risk management procedures serve as a foundation for
expansion |
 37
This presentation contains statements which, to the extent that they are not
recitations of historical fact may constitute forward-looking statements within
the meaning of the United States Private Securities Litigation Reform Act of
1995. Such forward-looking statements may include financial and other
projections as well
as
statements
regarding
Bryn
Mawr
Bank
Corporation’s
(the
“Corporation”)
that may include future plans, objectives, performance, revenues, growth,
profits, operating expenses or the Corporation’s underlying assumptions. The
words “may”, “would”, “should”,
“could”, “will”, “likely”, “possibly”, “expect,”
“anticipate,”
“intend”, “estimate”, “target”,
“potentially”, “probably”, “outlook”,
“predict”,
“contemplate”,
“continue”,
“plan”,
“forecast”,
“project”
and
“believe”
or
other similar words and phrases may identify forward-looking statements.
Persons reading or present at this presentation are cautioned that such
statements are only predictions, and that the Corporation’s actual future
results or performance may be materially different.
Safe Harbor |
 38
Safe Harbor (continued)
Such forward-looking statements involve known and unknown risks and
uncertainties. A number of factors, many of which are beyond the
Corporation’s control, could cause our actual results, events or
developments, or industry results, to be materially different from any future
results, events or developments expressed, implied or anticipated by such
forward-looking statements, and so our business and financial condition
and results of operations could be materially and adversely affected. Such
factors include, among others, our need for capital, our ability
to control
operating costs and expenses, and to manage loan and lease delinquency
rates; the credit risks of lending activities and overall quality of the
composition of our loan, lease and securities portfolio; the impact of
economic conditions, consumer and business spending habits, and real
estate market conditions on our business and in our market area;
changes
in the levels of general interest rates, deposit interest rates,
or net interest
margin and funding sources; changes in banking regulations and policies
and the possibility that any banking agency approvals we might require for
certain activities will not be obtained in a timely manner or at
all or will be |
 39
Safe Harbor (continued)
conditioned in a manner that would impair our ability to implement our
business plans; changes in accounting policies and practices; the inability of
key third-party providers to perform their obligations to us; our
ability to attract and retain key personnel; competition in our marketplace;
war or terrorist activities; whether or not we will be able to successfully
integrate First Keystone Bank with The Bryn Mawr
Trust Company; material
differences in the actual financial results, cost savings and revenue
enhancements associated with our acquisition via the merger of First
Keystone Financial, Inc. and First Keystone Bank; and other factors as
described in our securities filings. All forward-looking statements and
information made herein are based on Management’s current beliefs and
assumptions as of the date hereof and speak only as of the date they are
made. The Corporation does not undertake to update forward-looking
statements. |
 40
Safe Harbor (continued)
For a complete discussion of the assumptions, risks and uncertainties
related to our business, you are encouraged to review our filings with the
Securities and Exchange Commission, including our most recent annual
report on Form 10-K, as well as any changes in risk factors that we may
identify in our quarterly or other reports filed with the SEC.
This presentation is not an offer to sell securities nor is it soliciting an offer
to buy securities in any state or jurisdiction where the offer or sale would
be unlawful. |
 Thank You
Joseph Keefer, EVP
610-581-4869
jkeefer@bmtc.com
Duncan Smith, CFO
610-526 –2466
jdsmith@bmtc.com
Ted Peters, Chairman
610-581-4800
tpeters@bmtc.com
Frank Leto, EVP
610-581-4730
fleto@bmtc.com
Aaron
Strenkoski,
VP
–
Finance,
Investor
Relations
–
610-581-4822
–
astrenkoski@bmtc.com |