Attached files
| file | filename |
|---|---|
| 8-K - FORM 8-K - ASPEN INSURANCE HOLDINGS LTD | u09662e8vk.htm |
Exhibit 99.1

| Aspen Insurance Holdings Limited Keefe, Bruyette & Woods 2010 Insurance Conference Richard Houghton Chief Financial Officer Brian Boornazian CEO, Aspen Reinsurance September 7, 2010 |

| Safe Harbor Disclosure This slide presentation is for information purposes only. It should be read in conjunction with our financial supplement posted on our website on the Investor Relations page and with other documents filed by Aspen Insurance Holdings Limited (the "Company" or "Aspen") with the U.S. Securities and Exchange Commission. Non-GAAP Financial Measures In presenting Aspen's results, management has included and discussed certain "non-GAAP financial measures", as such term is defined in Regulation G. Management believes that these non-GAAP measures, which may be defined differently by other companies, better explain Aspen's results of operations in a manner that allows for a more complete understanding of the underlying trends in Aspen's business. However, these measures should not be viewed as a substitute for those determined in accordance with GAAP. The reconciliation of such non-GAAP financial measures to their respective most directly comparable GAAP financial measures in accordance with Regulation G is included herein or in the financial supplement, as applicable, which can be obtained from the Investor Relations section of Aspen's website at www.aspen.bm. Application of the Safe Harbor of the Private Securities Litigation Reform Act of 1995 This presentation contains written or oral "forward-looking statements" within the meaning of the U.S. federal laws. These statements are made pursuant to the safe harbor provisions of the Private Securities Litigation Reform Act of 1995. Forward-looking statements include all statements that do not relate solely to historical or current facts, and can be identified by the use of words such as "expect," "intend," "plan," "do not believe," "aim," "project," "anticipate," "seek," "will," "estimate," "may," "continue," "guidance," and similar expressions of a future or forward-looking nature. All forward-looking statements address matters that involve risks and uncertainties. Accordingly, there are or will be important factors that could cause actual results to differ materially from those indicated in these statements. Aspen believes these factors include, but are not limited to: changes in insurance and reinsurance market conditions that could adversely impact execution of the business plan; the continuing and uncertain impact of the current lower growth economic environment in many of the countries in which we operate; the risk of a material decline in the value or liquidity of all or parts of our investment portfolio; changes in our ability to exercise capital management or strategic initiatives or to arrange banking facilities as a result of prevailing market changes or changes in our financial position; our ability to execute our business plan to enter new markets, introduce new products and develop new distribution channels, including their integration into our existing operations; increased counterparty risk due to the impairment of financial institutions; changes in the total industry losses, or our share of total industry losses, resulting from past events such as Hurricanes Ike and Gustav and, with respect to such events, our reliance on loss reports received from cedants and loss adjustors, our reliance on industry loss estimates and those generated by modelling techniques, changes in rulings on flood damage or other exclusions as a result of prevailing lawsuits and case law, any changes in our reinsurers' credit quality and the amount and timing of reinsurance recoverables; the impact of acts of terrorism and related legislation and acts of war; the possibility of greater frequency or severity of claims and loss activity, including as a result of natural or man-made (including economic and political risks) catastrophic events, than our underwriting, reserving, reinsurance purchasing or investment practices have anticipated; evolving interpretive issues with respect to coverage after major loss events; the level of inflation in repair costs due to limited availability of labor and materials after catastrophes; the effectiveness of our loss limitation methods; changes in the availability, and any new intervening legislative or governmental action, cost or quality of reinsurance or retrocessional coverage; the reliability of, and changes in assumptions to, natural and man-made catastrophe pricing, accumulation and estimated loss models; loss of key personnel; a decline in our operating subsidiaries' ratings with Standard & Poor's ("S&P"), A.M. Best or Moody's Investors Service ("Moody's"); changes in general economic conditions, including inflation, foreign currency exchange rates, interest rates and other factors that could affect our investment portfolio; the number and type of insurance and reinsurance contracts that we wrote at the January 1st and other renewal periods and the premium rates available at the time of such renewals within our targeted business lines; increased competition on the basis of pricing, capacity, coverage terms or other factors and the related demand and supply dynamics as contracts come up for renewal; decreased demand for our insurance or reinsurance products and cyclical changes in the insurance and reinsurance sectors; changes in government regulations or tax laws in jurisdictions where we conduct business; and Aspen or its Bermudian subsidiary becoming subject to income taxes in the United States or the United Kingdom; and the effect on insurance markets, business practices and relationships of ongoing litigation, investigations and regulatory activity by insurance regulators and prosecutors. For a more detailed description of these uncertainties and other factors, please see the "Risk Factors" section in Aspen's Annual Reports on Form 10-K as filed with the U.S. Securities and Exchange Commission on February 26, 2010. Aspen undertakes no obligation to publicly update or revise any forward-looking statements, whether as a result of new information, future events or otherwise. Readers are cautioned not to place undue reliance on these forward-looking statements, which speak only as of the dates on which they are made. In addition, any estimates relating to loss events involve the exercise of considerable judgment and reflect a combination of ground-up evaluations, information available to date from brokers and cedants, market intelligence, initial tentative loss reports and other sources. Due to the complexity of factors contributing to the losses and the preliminary nature of the information used to prepare these estimates, there can be no assurance that Aspen's ultimate losses will remain with the stated amount. |

| Summary Who we are What we do The Aspen approach How it all adds up Our investment proposition Appendix |
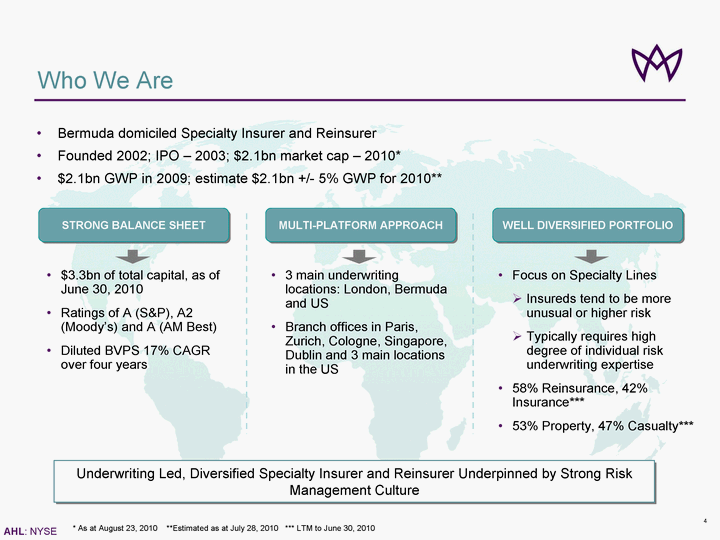
| Who We Are STRONG BALANCE SHEET WELL DIVERSIFIED PORTF OLIO MULTI-PLATFORM APPROACH $3.3bn of total capital, as of June 30, 2010 Ratings of A (S&P), A2 (Moody's) and A (AM Best) Diluted BVPS 17% CAGR over four years Focus on Specialty Lines ? Insureds tend to be more unusual or higher risk ? Typically requires high degree of individual risk underwriting expertise 58% Reinsurance, 42% Insurance*** 53% Property, 47% Casualty*** 3 main underwriting locations: London, Bermuda and US Branch offices in Paris, Zurich, Cologne, Singapore, Dublin and 3 main locations in the US Underwriting Led, Diversified Specialty Insurer and Reinsurer Underpinned by Strong Risk Management Culture Bermuda domiciled Specialty Insurer and Reinsurer Founded 2002; IPO - 2003; $2.1bn market cap - 2010* $2.1bn GWP in 2009; estimate $2.1bn +/- 5% GWP for 2010** * As at August 23, 2010 **Estimated as at July 28, 2010 *** LTM to June 30, 2010 |

| What We Do Insurance vs. Reinsurance* Property vs. Casualty* GWP by "Core" Platform Global Footprint 176 employees 4 offices, 3 countries 660+ employees 17 offices, 8 countries Balanced Business Lines, Diversified Production Sources and Increased Global Presence * By GWP **Last Twelve Months 42% 19% 2003 LTM** June 2010 42% 58% 47% 53% 64% 18% 18% 42% 58% Insurance Reinsurance Bermuda US UK 47% 53% Property Casualty |
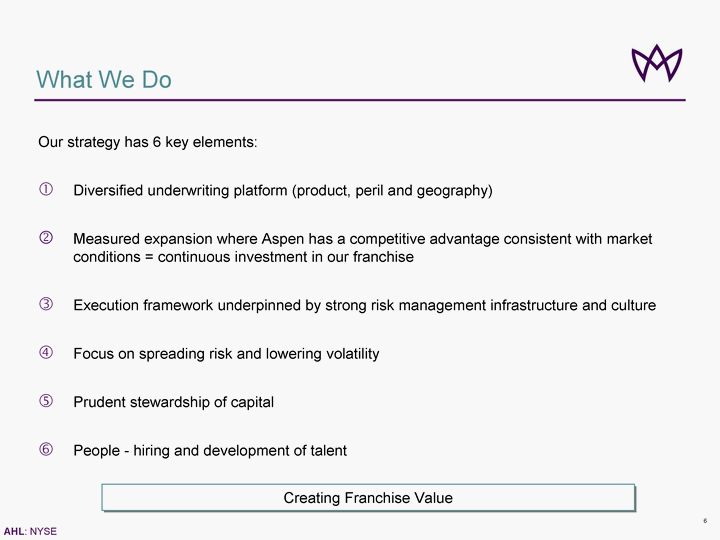
| What We Do Our strategy has 6 key elements: Diversified underwriting platform (product, peril and geography) Measured expansion where Aspen has a competitive advantage consistent with market conditions = continuous investment in our franchise Execution framework underpinned by strong risk management infrastructure and culture Focus on spreading risk and lowering volatility Prudent stewardship of capital People - hiring and development of talent Creating Franchise Value |

| Risk appetite statement core component of our Risk Management framework What We Do Setting our Risk Return Profile Integrated Risk Management Underpinning Everything We Do Risk preferences Return objective Volatility constraint Capital constraint Risks inside and outside of core mission and strategy Sets the levels of return on capital we seek to achieve, subject to risk constraints Limit on earnings volatility Minimum level of risk adjusted capital |
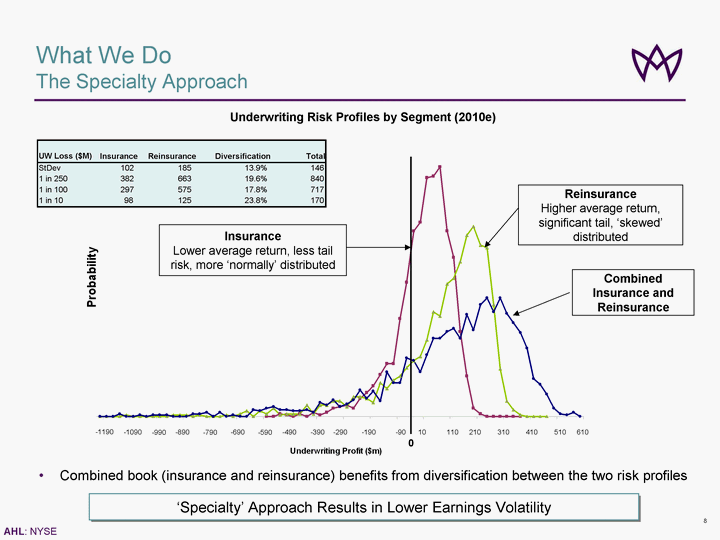
| What We Do The Specialty Approach Insurance Lower average return, less tail risk, more 'normally' distributed Reinsurance Higher average return, significant tail, 'skewed' distributed Combined Insurance and Reinsurance Underwriting Risk Profiles by Segment (2010e) -1190 -1090 -990 -890 -790 -690 -590 -490 -390 -290 -190 -90 10 110 210 310 410 510 610 0 'Specialty' Approach Results in Lower Earnings Volatility Combined book (insurance and reinsurance) benefits from diversification between the two risk profiles UW Loss ($M) Insurance Reinsurance Diversification Total StDev 102 185 13.9% 146 1 in 250 382 663 19.6% 840 1 in 100 297 575 17.8% 717 1 in 10 98 125 23.8% 170 |

| Median 13% ROE Mean 11.5% ROE Probability of under-performing mean by 5% or more = 24% 1-in-100 -27% ROE 1-in-250 -36% ROE Probability of negative income 11% Return Profile Consistent with Risk Appetite Disclaimer: The above graph is based on the 2010 plan without adjustment for H2 2010 actual performance. The risk profile is the result of numerous assumptions within our Economic Capital Model. Results may vary significantly from those shown. What We Do Risk Profile - As At January 1, 2010 |
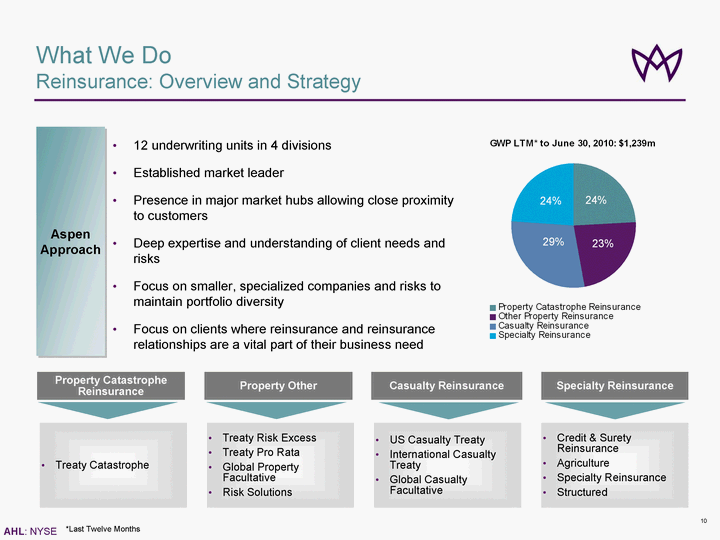
| What We Do Reinsurance: Overview and Strategy Aspen Approach Property Catastrophe Reinsurance Property Other Casualty Reinsurance Specialty Reinsurance Credit & Surety Reinsurance Agriculture Specialty Reinsurance Structured US Casualty Treaty International Casualty Treaty Global Casualty Facultative Treaty Risk Excess Treaty Pro Rata Global Property Facultative Risk Solutions Treaty Catastrophe *Last Twelve Months 12 underwriting units in 4 divisions Established market leader Presence in major market hubs allowing close proximity to customers Deep expertise and understanding of client needs and risks Focus on smaller, specialized companies and risks to maintain portfolio diversity Focus on clients where reinsurance and reinsurance relationships are a vital part of their business need |

| Marine, Energy and Transportation Financial and Professional Lines Property Insurance Casualty Insurance MEC Liability Energy Property Marine Hull Specie Aviation Financial Institutions Professional Liability (including Management and Technology Liability) Financial & Political Risks UK Commercial Property & Construction US Property (E&S) What We Do Insurance: Overview and Strategy 13 underwriting units in 4 divisions Specialist 'E&S' type approach to underwriting within Insurance operations Bias towards complex risks Diverse portfolio of disparate insurance risks Divisional focus compliments in-house underwriting expertise Aspen Approach UK Commercial Liability Excess Casualty US Casualty (E&S) *Last Twelve Months * |

| The Aspen Approach Managing Growth Regular Evaluation of Opportunities Consistent with Market Conditions in Accordance with Strict Criteria Hiring of individual underwriters Establishment of new underwriting units 'Bolt on' acquisitions Transformational M&A Growth Continuum ? ? ? ? Strategic fit Financially attractive Manageable execution risk Consistent with our risk management appetite Key Evaluation Criteria ? ? ? ? |

| '06 '07 '08 '09 '10 The Aspen Approach Investing in our Franchise '03 '04 '05 Specialty RI (Aviation & Marine) US Casualty Re US E&S lines Aviation Insurance Marine Insurance Energy Insurance International Property Facultative Reinsurance Non-US Professional Liability Insurance Non-US Excess Casualty Transportation related Liability Insurance Financial & Political Risk Insurance Financial Institutions Insurance Non-US Management Technology and Liability Insurance Specie Insurance International Casualty Faculative Reinsurance Credit & Surety Reinsurance Non-US Agriculture Reinsurance US Professional Liability Insurance US Directors & Officers Insurance US Excess Casualty Insurance Bermuda London US Paris Zurich Dublin Lloyd's Singapore Miami Cologne Incremental Expansion into Adjacent Business Lines Consistent with Diversification Strategy and Market Conditions Products Platforms US based reinsurance lines - Property (including Fac) - Casualty (including Fac) |
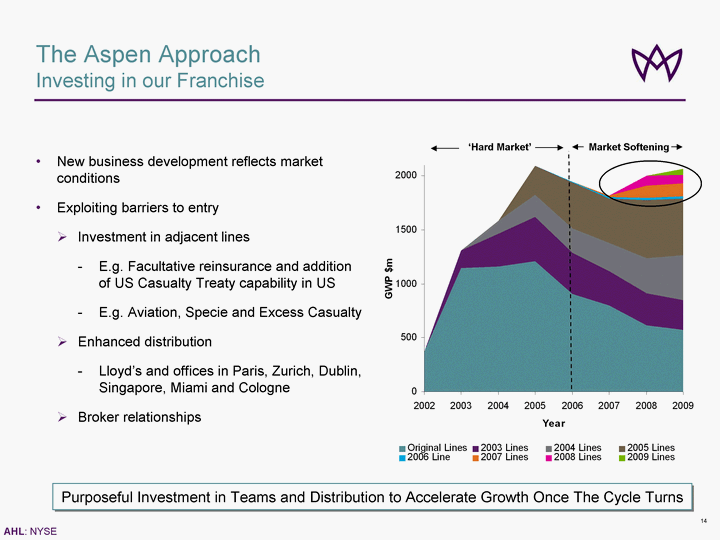
| The Aspen Approach Investing in our Franchise Investing in our Franchise Investing in our Franchise 'Hard Market' Market Softening Purposeful Investment in Teams and Distribution to Accelerate Growth Once The Cycle Turns New business development reflects market conditions Exploiting barriers to entry ? Investment in adjacent lines - E.g. Facultative reinsurance and addition of US Casualty Treaty capability in US - E.g. Aviation, Specie and Excess Casualty ? Enhanced distribution - Lloyd's and offices in Paris, Zurich, Dublin, Singapore, Miami and Cologne ? Broker relationships |

| The Aspen Approach "Testing Conventional Wisdom" Political and Financial Risk Insurance Credit & Surety Reinsurance Inception 2008 GWP $33m; combined ratio 81.1% (2009) GWP $39m; combined ratio 83.0% (2008) Building reputation as a market leader while sustaining core principle of underwriting profitability Quantitative credit analysis Fundamental analysis Structural analysis Policy documentation Inception 2009 2009: GWP $49m; combined ratio 89.6% Well positioned to benefit from rating improvements in 2010 in response to global financial crisis Focus is primarily European and ex-US; US Surety business excluded Aviation Insurance Inception 2005 GWP $113m; combined ratio 92% (2009) 2009 third consecutive loss-making year for industry; industry sector loss ratio estimated at >110% including Air France loss Aspen 2009 result likely to be comfortably in the top quartile for the industry Very Strong Performance in Selected Lines Despite Challenging Market Conditions Reflecting Specialist Approach |

| The Aspen Approach 2010 and Beyond Insurance Build out US Insurance platform ? Addition of Admitted Market capability Round out 'London Market' portfolio ? Addition of selected lines ? Development of UK regional platform ? Establishment of foothold in Swiss insurance market Build out of non-US operations ? Establishment of Miami office targeting Latin America ? Continued selective build out for Continental Europe and Asian operations 'Watching brief' on Middle East Reinsurance Business Key Elements Measured Growth in Exposures We Know and Understand Subject to Market Conditions |

| The Aspen Approach Key Focus Areas - 2010 / 2011 Macro economic environment Pricing adequacy Cycle management Investment returns Capital deployment |

| The Aspen Approach Shareholder Value Creation: Pulling the Financial Levers Efficient Management of Financial Levers Crucial to Value Creation 26.1% 5.9% 23.0% 17.0% 14.9% Shareholder Value Creation 2007 - 2009 5% 0% 10% 15% 20% 25% 30% Value Creation (%) 5.7% 9.6% 9.1% 3.9% 8.0% 1.9% 10.2% 1.7% 0.8% 1.9% 2.1% 2.0% 8.1% 3.1% 3.2% 3.6% 1.2% 2010 2009 2008 2007 Year Investment Income & Realised Gains/Losses Unrealised Investment Returns Capital Management Currency Other Dividends Underwriting & Operating Contribution |

| The Aspen Approach Business Performance and Market Outlook Q2 2010* * As at June 30, 2010. Key located on final page of presentation. * As at June 30, 2010. Key located on final page of presentation. |
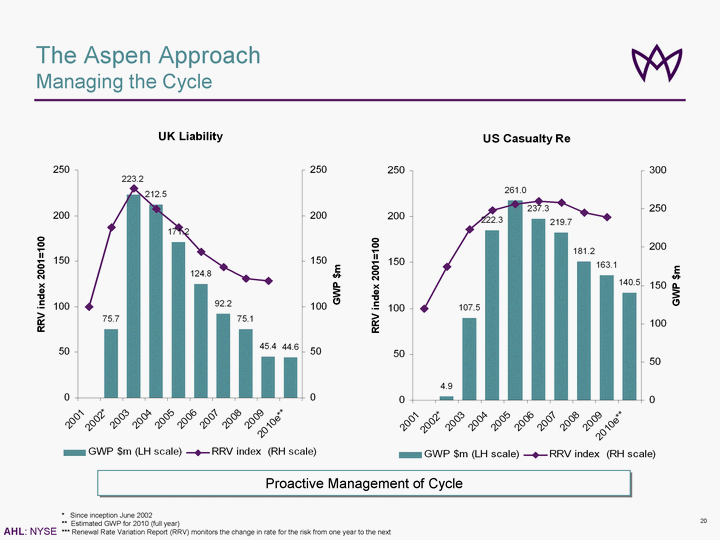
| The Aspen Approach Managing the Cycle * Since inception June 2002 ** Estimated GWP for 2010 (full year) *** Renewal Rate Variation Report (RRV) monitors the change in rate for the risk from one year to the next Proactive Management of Cycle |

| The Aspen Approach Investment Philosophy and Current Appetite Likes High quality credit Active management of 'problem' issues Simplicity Input from multiple money managers Freedom to optimise investments over the yield curve Quality of investment decisions shown in total returns Dislikes High volatility Concentrated 'big bets' Constriction on flexibility Exclusive focus on income statement Impairment charges Current approach Maintain fixed income credit quality at AA - or better Maintain duration between 3.0 and 3.5 years driven by yield curve 'sweet spot' Incrementally add to A rated or better corporate bonds at 4%+ Add to Agency MBS at 4% and better Put cash to work in rising rate environment 'Hygienic' actions on limited lower quality portion of portfolio Focus on Long Term Holdings of Liquid High Quality Credit Instruments ? X |

| The Aspen Approach Prudent Investment Management Growth and stability in Aspen's book yield since 2003 Proactive Management of Investment Portfolio to Build Long Term Value Through all Market Cycles; $293m in Unrealized Investment Gains at Q2 2010 2010 Consistent investment approach to deliver stable investment income focused on Credit quality & liquidity Interest rate tactics Yield curve management Sector rotation opportunities |

| The Aspen Approach Delivering Strong Investment Returns 3 Year Total Return vs. Peers* Fixed Income Portfolio Credit Ratings Significant Outperformance vs. Peers; Aspen Rated #2 out of 15 * Total investment return at June 30, 2010 ** Includes cash and short term securities in managed fixed income portfolios *** Below Investment Grade Peers include ACE, ACGL, AWH, AXS, ENH, MRH, MXGL, PRE, PTP, RE, RNR, TRH, VR, XL |

| The Aspen Approach Pro-active Management of Capital * Includes preference dividends and $200m share repurchase entered into in Q1 2010 ** End of Q2 2010 Continued Commitment to Capital Management; Returned $1bn* from 2003 to Date** Shareholder Equity Development 2003 - Q2 2010 Premium income Declines Adequate Return on Capital Inadequate Return on Capital Capital Scarcity Excess Capital Capital Declines HARD MARKET SOFT MARKET Premium income Rises Capital Growth |

| '06 '07 '08 '09 '10 The Aspen Approach History '03 '04 '05 Issued $200m of preference shares Issued $230m of PIERS Repurchased $67m of preference shares IPO Entered into $200m accelerated share repurchase Debt & Hybrids Capital Common Equity Issued $250m of 6% 10- year Senior Notes Entered into 2 * $50m accelerated share repurchases Completed $100m private placement with Candover Active, Prudent Capital Management Key to Financial Performance Issued $600m of ordinary shares Issued $25m as condition of preference share repurchase Leverage 0.0% 3.0% 14.4% 19.6% 25.7% 22.2% 22.4% 19.9% 19.0% 17.7% 17.2% 18.1% 17.2% |

| How It All Adds Up Growth in Book Value Per Share Source: Company data, SNL * Peers include ACE, AWH, ACGL, AXS, ENH, RE, MXGL, PRE, PTP, TRH, XL, RNR, MRH, VR (*) Note: See Aspen's quarterly financial supplement for a reconciliation of diluted book value per share to basic book value per share in the Investor Relations section of Aspen's website at www.aspen.bm Aspen vs. Peers* Top Quartile Performance vs. Peers * |

| How It All Adds Up Growth in Book Value Per Share and ROE (*) Note: See Aspen's quarterly financial supplement for a reconciliation of diluted book value per share to basic book value per share and reconciliation of average equity to closing shareholders' equity in the Investor Relations section of Aspen's website at www.aspen.bm equity to closing shareholders' equity in the Investor Relations section of Aspen's website at www.aspen.bm equity to closing shareholders' equity in the Investor Relations section of Aspen's website at www.aspen.bm Diluted Book Value per Share up 21% since June 30, 2009 |

| A B C ASPEN D E F G H I J K L M 0.0 2.0 4.0 6.0 8.0 10.0 12.0 14.0 0% 5% 10% 15% 20% 25% CAGR % BVPS** 2006-2009 Standard Deviation How It All Adds Up Delivering Growth with Low Volatility Source: Company data, SNL * Peers include ACE, AWH, ACGL, AXS, ENH, RE, MXGL, PRE, PTP, TRH, RNR, MRH, VR (*) Note: See Aspen's quarterly financial supplement for a reconciliation of diluted book value per share to basic book value per share and reconciliation of average equity to closing shareholders' equity in the Investor Relations section of Aspen's website at www.aspen.bm Aspen vs. Peers* Strong Growth in Diluted BVPS and Low Volatility vs. Peers, by Managing all of our Levers |

| Our Investment Proposition The Embedded Value in Our Franchise 'Right' business model Niche focused Expert based Appropriately diversified (Insurance/Reinsurance, Property/Casualty, Geography) 'Right' Tools Significant investment in integrated risk management, actuarial and other quantitative techniques to enhance our business 'Right' People Motivation Experience Appetite to succeed Alignment with shareholders (i.e., the right compensation structures) 'Right' size and speed of response Sufficient scale to withstand 'shock' losses and compete effectively in all phases of the cycle Ability to respond rapidly to changes in market conditions Aspen Well Positioned for Future Success Underwriting Excellence Operational Effectiveness Talent Management Agility |

| Appendix |

| Return Objective 'The Aspen Group aims to generate 10 year average ROEs which exceed the 3 year risk free rate by an average of at least 8% with a target of 10.5% Motivated By Shareholder Return and Valuation Aspirations, But Subject to Constraints to Limit Downside Risk Key Features Spread over the risk free rate rather than an absolute value of ROE Time weighted averaging over 10 years rather than the more usual 'over the cycle' ? Reported ROE with an average of 8.5% over the risk free rate since inception* Aim not to fall below 8% Believe that if we perform at higher target level of 10.5%, then more likely to achieve our valuation objective * 7 years excluding part year 2002 Appendix |

| Volatility Constraint 'Limiting the chance of an ROE which is 5 percentage points worse than plan to a probability less than 25% (i.e. 1 in 4 years)' Excessive Earnings Volatility Detrimental to Long Term Shareholder Value Growth Constraint seeks to limit volatility of earnings near to the mean Fluctuations of up to 5 points likely to occur reasonably often Volatility calibrated at level exhibited by top quartile performers in our peer group Applied prospectively based on the volatility measured by our Economic Capital Model Key Features Appendix |

| Aspen's Modelled Worldwide Natural Catastrophe Exposures - Major Peril Zones Source: Aspen analysis using RMS v9.0 occurrence exceedance probability as at July 1, 2010 and Shareholders' Equity of $3,303.9 million 1 in 100 Year Tolerance: 17.5% of Total Shareholders' Equity 1 in 250 Year Tolerance: 25% of Total Shareholders' Equity Appendix |

| 2010 Guidance 2010 Guidance 2010 Guidance Appendix |

| Financial Highlights: Q2 2010 (US$ in millions, except per share data) (*) Note: See Aspen's quarterly financial supplement for a reconciliation of operating income to net income, average equity to closing shareholders' equity and diluted book value per share to basic book value per share in the Investor Relations section of Aspen's website at www.aspen.bm Appendix |
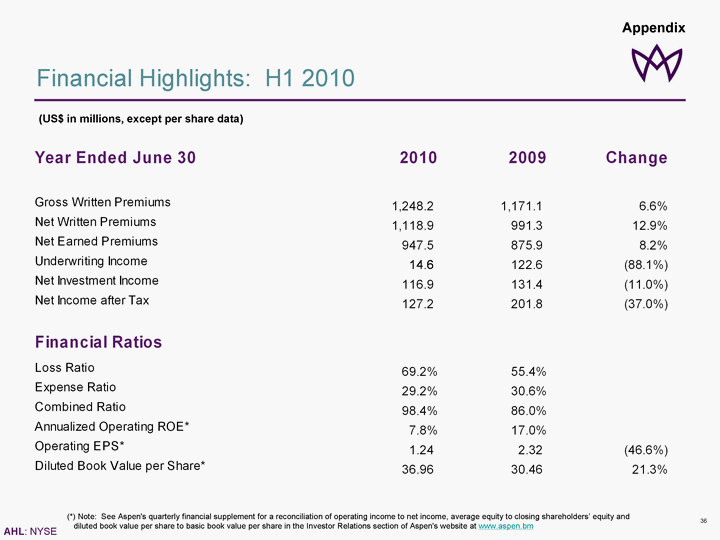
| Financial Highlights: H1 2010 (US$ in millions, except per share data) (*) Note: See Aspen's quarterly financial supplement for a reconciliation of operating income to net income, average equity to closing shareholders' equity and diluted book value per share to basic book value per share in the Investor Relations section of Aspen's website at www.aspen.bm Appendix |
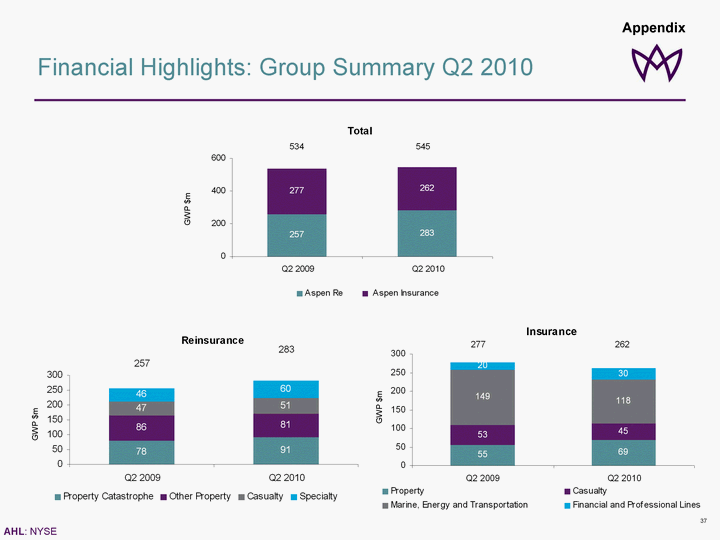
| Financial Highlights: Group Summary Q2 2010 Appendix GWP $m GWP $m GWP $m |
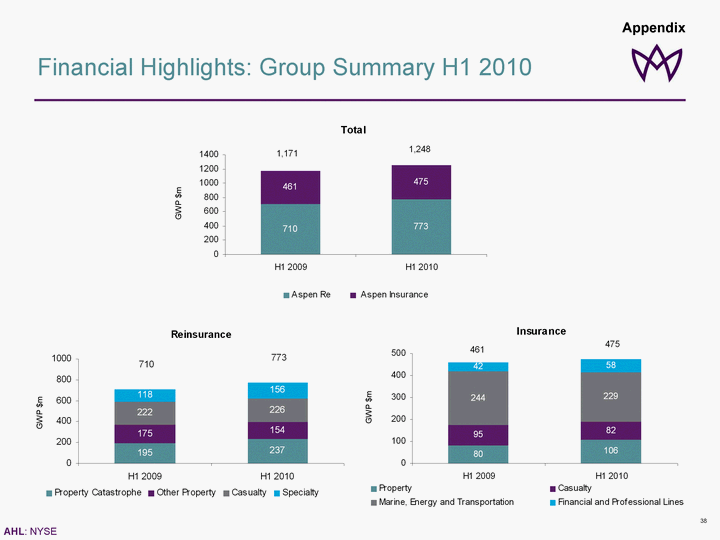
| Financial Highlights: Group Summary H1 2010 Appendix GWP $m GWP $m GWP $m |
| Financial Highlights: Group Summary Q2 2010 Q2 2009 Q2 2010 Appendix H1 2009 H1 2010 H1 2010 $m $m $m $m |

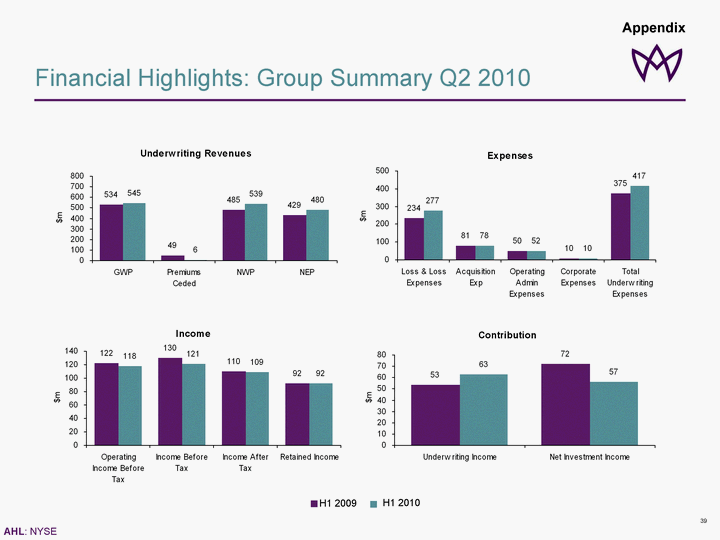
| Financial Highlights: Group Summary H1 2010 H1 2009 H1 2010 Appendix Underwriting Revenues 1171 180 991 876 1248 129 1119 948 0 200 400 600 800 1000 1200 1400 GWP Premiums Ceded NWP NEP $m Expenses 486 159 89 19 753 656 162 95 20 933 0 200 400 600 800 1000 Loss & Loss Expenses Acquisition Exp Operating Admin Expenses Corporate Expenses Total Underwriting Expenses $m Income 244 238 202 165 124 141 127 92 0 100 200 300 Operating Income Before Tax Income Before Tax Income After Tax Retained Income $m Contribution 123 131 15 117 0 20 40 60 80 100 120 140 Underwriting Income Net Investment Income $m |

| Key Performance Metrics: Q2 2010 and H1 2010 * * Appendix |

| Results by Business Segment: Q2 2010 (*) Underwriting income is calculated as underwriting revenues, less underwriting expenses. Appendix Underwriting Income * GWP $m $m n Q2 2009 n Q2 2010 |
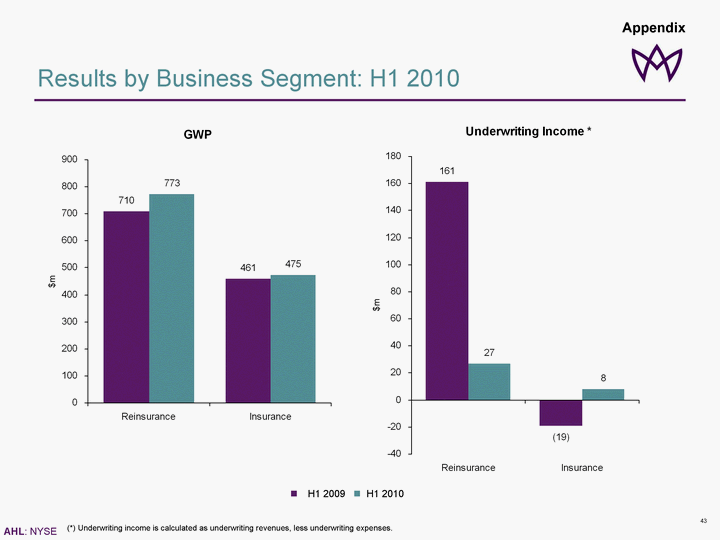
| Results by Business Segment: H1 2010 (*) Underwriting income is calculated as underwriting revenues, less underwriting expenses. Appendix $m $m n H1 2009 n H1 2010 |

| Key Performance Metrics: Q2 2010 * Appendix |

| Key Performance Metrics: H1 2010 * Appendix |

| Total Investment Return - Q2 2010 Total Investment Return - Q2 2010 Total Investment Return - Q2 2010 Annualized Investment Return for the Quarter of 8.7% Appendix |

| Total Investment Return - H1 2010 Total Investment Return - H1 2010 Annualized Investment Return for the Year to Date of 7.2% Appendix |

| Fixed Income Portfolio by Asset Type (US$ in millions) (US$ in millions) Appendix |

| Managing Risk * Data pre-tax as at March 31, 2010. Net is net of reinstatement premium and reinsurance Significant Reduction in Peak Zone Nat Cat Exposure Post 2005 US UK / Europe Latin America |

| Natural Catastrophe Exposure vs. Peers: Hurricanes Gustav / Ike Gustav / Ike Loss in Line with our Business Model Source: Dowling & Partners, Aspen Analysis Peers include ACE, ACGL, AWH, AXS, ENH, MRH, MXGL, PRE, PTP, RE, RNR, TRH, XL, VR |

| Natural Catastrophe Exposure vs. Peers: Chile Earthquake Chile Loss in Line with Our Business Model Source: Dowling & Partners, Aspen Analysis Peers include ACE, ACGL, AWH, AXS, ENH, MRH, MXGL, PRE, PTP, RE, RNR, TRH, XL, VR |

| Business Performance and Market Outlook: Key Key Performance Absolute Pricing Relative Price Movement Terms and Conditions Volume change Outlook Key 1 2 3 4 5 6 Excellent Excellent Significantly Up Excellent Significantly Up Excellent Good Good Up Good Up Good Satisfactory Satisfactory Flat Satisfactory Flat Satisfactory Of Concern Of Concern Down Of Concern Down Of Concern Unsatisfactory Unsatisfactory Significantly Down Unsatisfactory Significantly Down Unsatisfactory Appendix |