Attached files
| file | filename |
|---|---|
| 8-K - FORM 8-K - ALTERRA CAPITAL HOLDINGS Ltd | d8k.htm |
| EX-10.1 - AMENDMENT NO. 5 TO CREDIT AGREEMENT WITH THE BANK OF NOVA SCOTIA - ALTERRA CAPITAL HOLDINGS Ltd | dex101.htm |
 Investor Presentation
Second Quarter 2010
Exhibit 99.1 |
 2
Cautionary Note Regarding Forward-Looking Statements
This presentation may include forward-looking statements that reflect Alterra’s current views
with respect to future events and financial performance. Statements that include the words
“expect,” “intend,” “plan,” “believe,” “project,” “anticipate,”
“will,” “may” and similar statements of a future or forward-looking nature
identify forward-looking statements. All forward- looking statements address matters
that involve risks and uncertainties. Accordingly, there are or will be important factors that
could cause actual results to differ materially from those indicated in such statements and you should not place
undue reliance on any such statements.
Alterra believes that these factors include, but are not limited to, the following: (1) the adequacy
of loss reserves and the need to adjust such reserves as claims develop over time; (2) the
failure of any of the loss limitation methods employed; (3) the effects of emerging claims and
coverage issues; (4) changes in general economic conditions, including changes in capital and
credit markets; (5) the effect of competition and cyclical trends, including with respect to demand and pricing
in the insurance and reinsurance markets; (6) any lowering or loss of financial ratings; (7) the
occurrence of natural or man-made catastrophic events with a frequency or severity
exceeding expectations; (8) the loss of business provided to Alterra by its major brokers; (9)
the effect on Alterra’s investment portfolio of changing financial market conditions
including inflation, interest rates, liquidity and other factors; (10) tax and regulatory changes and
conditions; (11) the integration of Harbor Point Limited or new business ventures Alterra may
enter into; and (12) retention of key personnel, as well as management’s response to any
of the aforementioned factors. The foregoing review of important factors should not be construed as exhaustive and should be read in
conjunction with the other cautionary statements that are included herein and elsewhere,
including the Risk Factors included in Alterra’s most recent report on Form 10-K and
Form 10-Qs filed subsequent to, and other documents on file with the Securities and
Exchange Commission. Any forward-looking statements made in this presentation are qualified by these cautionary
statements, and there can be no assurance that the actual results or developments anticipated by
Alterra will be realized or, even if substantially realized, that they will have the expected
consequences to, or effects on, Alterra or its business or operations. Alterra undertakes no
obligation to update publicly or revise any forward-looking statement, whether as a result
of new information, future developments or otherwise. |
 Max Capital
Group Ltd. and Harbor Point Limited have merged to form
Alterra Capital Holdings Limited |
 Alterra means
“high ground” We have chosen Alterra as our new brand name
as we believe the company will be a provider of
superior security for our clients
A market leader at the pinnacle of our industry |
 5
P&C Sector Offers Tremendous Value Opportunity
P&C stocks are trading at 25 year low price to book multiples
The fundamental environment remains challenging BUT we are
getting closer to the inflection point as. . .
Profitable growth opportunities are tough to find
Continued historic low interest rates are pressuring investment returns
Cash flow levels deteriorate
Major industry loss events generate high catastrophe losses
Reserve redundancies at many companies are diminishing
Players beginning to self-assess lines or strategy
Excess capital positions are managed through aggressive share
repurchase
Attractive time to build positions as low sector valuation levels
provide downside protection
Alterra
valuation
even
more
compelling
at
0.74x
times
book
value
at
June
30,
2010
____________________
Based on stock price as of 8/27/2010. |
 6
Platform Positioned to Grow Shareholder Value
Alterra
–
A Winning Combination
Formed by the merger of Max Capital and Harbor Point in May 2010
Enhances position with clients and brokers
Combines “best in class" reinsurance group with a global specialty
platform
Provides diversified and stable earnings over time
Established platforms in all major insurance markets
Delivers flexibility to optimize portfolio composition
Larger capital base with approximately $3 billion in equity
Enhances financial flexibility
Strong and deep management and underwriting teams
Committed to growth in book value |
 7
Global Diversified Platform
Global underwriter of specialty insurance and
reinsurance
Multiple
operating
platforms
-
Bermuda,
Dublin,
United
States, Lloyd's, Latin America
Diversified business profile across specialty classes
of business
Opportunistic and disciplined underwriting strategy
Strong culture of risk management
Analytical and quantitative underwriting orientation
5 year average combined ratio, with cats, of 86.2%
Strong, liquid balance sheet with conservative
reserving track record
Shareholders equity ~ $3 billion at 6/30/10
Low operating and financial leverage provides
enhanced flexibility
Focus
on
capital
management
–
returned
$367
million
or
~12%
of
proforma
12/31/09
shareholders'
equity(1) in 2010 through dividends and share
repurchases
Rated “A”
(Excellent) by AM Best
____________________
(1) Shareholders' equity of Max Capital and Harbor Point on a
combined pro forma basis.
Short- Tail
50%
Long-Tail
50%
2009 Pro Forma
Insurance
39%
Reinsurance
61% |
 8
Second Quarter Results
Second quarter 2010 net operating
diluted EPS of $0.64 per share
P&C gross premiums written grew
12% to $398.2 million driven by the
inclusion of Harbor Point and the
continued build-out of our Lloyd’s and
U.S. Specialty businesses
Net investment income up 27.6% to
$53.3 million reflects additional cash
and invested assets from the merger
and the shift from cash to fixed income
picking up additional yield
Combined ratio of 83.3% with solid
underwriting profits across the
organization
Catastrophe losses from Q2 events of
$20.3 million represent < 0.6% of
shareholders’
equity
Diluted book value per share of $24.55
at 6/30/10
P&C GPW
(12% increase)
Operating
Diluted EPS
(1)
Operating ROE
14.6%
10.1%
Combined ratio
90.8%
83.3%
Profitable Growth in Gross Premiums Written…
…With Solid Operating EPS
$0.64
$0.83
Q2 '09
Q2 '10
$398.2
$355.5
Q2 '09
Q2 '10
(1)
Excludes $0.61 per share of negative goodwill gain net of merger and acquisition expenses.
|
 9
2004
Insurance
Property
2003
Insurance
Excess Liability
Professional Liability
2005
Reinsurance
Property / Property Cat
Harbor Point formed
2006
Insurance
Aviation
2008
Lloyd's Insurance
Financial Institutions
Prof. Indemnity
Lloyd's Reinsurance
Accident / Health
Property
2007
U.S. E&S Insurance
Property
Inland Marine
U.S. Casualty
Reinsurance
Multi Peril Crop
Experienced &
highly quantitative
underwriting teams
Lead underwriters average over 20 years in the
business
High percentage of employees hold
professional designations
2009
Lloyd's
Casualty (non U.S.)
A&H Insurance
U.S. Specialty
Professional Liability
Latin America
Reinsurance
2002
Traditional Re
Workers' Comp
Medical Malpractice
GL / PL
Aviation
Identifying & Recruiting "Franchise Players" Has Been
Instrumental In Our Success
2010
Alterra
formed
by the merger of Max
Capital and Harbor Point |
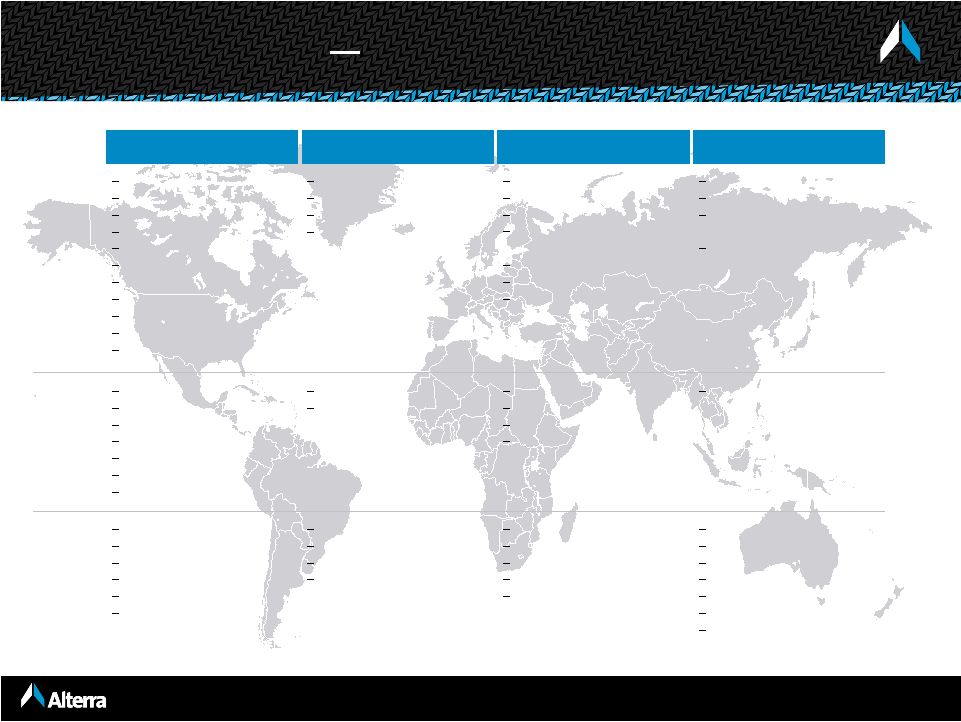 10
Reinsurance
Insurance
Lloyd’s
U.S. Specialty Insurance
Major
Classes
Agriculture
Aviation
General casualty
Life and annuity
Marine and energy
Medical malpractice
Professional liability
Property
Surety, credit & political risk
Whole account
Workers’ comp
Aviation
Excess liability
Professional liability
Property
Aviation
Accident and Health
Financial institutions
International casualty
treaty
Personal accident treaty
Professional liability
Property treaty
General liability
Marine
Miscellaneous
professional liability
Property
Operating
Regions
Australia
Canada
European Union
Japan
Latin America
New Zealand
United States
European Union
United States
Denmark
Japan
Latin America
United Kingdom
United States
Offices
Bermuda
Bogotá
Buenos Aires
Dublin
London
New Jersey
Bermuda
Dublin
Hamburg
Zurich
Copenhagen
Leeds
London
Rio de Janeiro
Tokyo
Atlanta
Dallas
New York
Philadelphia
Richmond
San Francisco
Sebastopol
Local Knowledge Global Reach |
 11
9%
4%
9%
4%
7%
5%
19%
28%
6%
9%
Insurance
(22% of pro forma 2009 GPW)
Reinsurance
(55% of pro forma 2009 GPW)
Professional
Liability
Property
Excess
Liability
Aviation
General Casualty
Property
Aviation
Workers Comp.
Professional Liability
Other
Med. Mal.
Marine & Energy
Agriculture
2009 GPW: $427.7 million
2009 pro forma GPW: $1,060.4 million
H1 2010 GPW: $198.7 million
H1 2010 GPW: $657.8 million
= pro forma
16%
27%
42%
15%
Auto
$198.7
$427.8
$389.4
$382.9
$396.6
$0.0
$200.0
$400.0
$600.0
$800.0
$1,000.0
$1,200.0
2006
2007
2008
2009
H1 '10
$423.6
$345.2
$419.5
$489.0
$274.4
$0.0
$200.0
$400.0
$600.0
$800.0
$1,000.0
$1,200.0
2006
2007
2008
2009
H1 '10
$1,060.4
$657.8
____________________
Note:
Pro forma gross premium written (“GPW”) represents the combined GPW of Max Capital
and Harbor Point net of intercompany eliminations of GPW. Alterra Has a Strong
Market Position in Specialty Classes … |
 12
U.S. Specialty
(15% of pro forma 2009 GPW)
Alterra
at Lloyd’s
(7% of pro forma 2009 GPW)
…With an Attractive Position in the U.S. Market and Lloyd’s
Professional
Liability
Property
Marine
General
Casualty
Property
Aviation
Fin. Institutions
Prof. Liability
Accident
& Health
47%
1%
21%
31%
47%
15%
18%
2%
18%
H1 2010: $174.4 million
H1 2010: $120.9 million
2009: $285.5 million
2009: $129.0 million
Launched in 2007
Nationwide niche E&S underwriter
91% non-admitted
2009 combined ratio = 99.5%
Acquired in November 2008
Direct and reinsurance
3 syndicates under management
2009 combined ratio = 86.3% |
 13
29%
2%
3%
5%
15%
4%
21%
3%
6%
5%
5%
1%
Long-Tail
Short-Tail
North America
Europe
Other
Other Short-Tail
Agriculture
Marine & Energy
Property
Aviation
Auto
Professional
Liability
Medical Malpractice
General Casualty
Workers’
Comp /
Clash
Life + A&H
Whole Account
Reinsurance
Insurance
(1)
6%
16%
78%
Mixed
39%
61%
2009 pro forma GPW = $1,946 million
H1 2010 pro forma GPW = $1,153 million
____________________
Note: 2009 and 2010 pro forma data after intercompany eliminations of gross premiums
written. (1) Includes Reinsurance segment (54.5%), Life &
Annuity reinsurance (2.2%) and reinsurance written through Lloyd’s platform (4.2%).
Diversified Balanced Business Mix
Global Platform
Line of Business |
 14
____________________
Source: Company filings.
Diversified reinsurers include RE, AXS, ACGL, TRH, PRE, AWH, ENH, AHL, PTP, AGII, ALTE and ORH
for historical years . Property focused reinsurers include RNR, VR, MRH, FSR and IPCR for historical years.
Diversified Reinsurers
Property Focused Reinsurers
Median
201%
55%
61%
89%
66%
94%
Median
116%
84%
82%
95%
84%
92%
Alterra
106%
86%
88%
92%
88%
92%
Diversified Platforms Generate More Consistent Margins
Alterra
has performed well within its diversified peer group with less volatility than property
focused reinsurers |
 15
Peer PML’s
as a Percent of Common Equity
12.3%
12.0%
14.8%
8.9%
24.6%
23.1%
20.6%
21.8%
11.2%
15.0%
17.7%
18.0%
18.1%
19.3%
19.6%
32.2%
30.0%
29.6%
29.1%
0%
10%
20%
30%
40%
VR
FSR
ENH
AXS
ACGL
RE
AHL
PTP
TRH
AWH
1-in-100 Year (if disclosed)
1-in-250 Year
____________________
Note:
RNR,
MRH
and
PRE
do
not
disclose
their
PMLs
for
either
1-in-100
year
events
or
1-in-250
year
events.
(1)
1-in-100 PML and 1-in-250 for U.S. hurricane is $886 mm and $1,159 mm,
respectively. Maximum zonal aggregate is $2.0 billion for U.S. hurricane and California earthquake.
(2)
Self-imposed limit of 25% of total capital.
(3)
1-in-100 PML for U.S. hurricane is $1,091 mm based on an industry loss modeled at $121
billion. 1-in-250 for U.S. hurricane is $1,456 mm based on an industry loss modeled at $195 billion.
(4)
Tri-county Florida is the largest zonal exposure. Northeast wind was $733 mm.
Self-imposed limit of 25% of common equity. (5)
Self-imposed limit of 16% of total capital.
(6)
1-in-100 PML for U.S. wind is $309 mm. 1-in-250 for U.S. quake is $287
mm, and 1-in-250 for U.S. wind of $390 mm. Historically, 1-in-100 was approximately 12% of total capital.
6/30/10
Com. Equity:
$3,602.9
$1,196.3
$2,650.6
$4,995.3
$4,073.0
$6,035.6
$2,950.3
$2,927.0
$2,105.4
$4,049.6
$3,468.5
(1)
(2)
(2), (3)
(4)
(5)
(6) |
 16
1.2%
1.3%
1.3%
2.4%
2.1%
2.1%
2.5%
3.2%
3.3%
4.4%
4.1%
4.1%
4.1%
5.4%
6.1%
0.1%
0.2%
0.3%
0.4%
0.3%
0.6%
0.6%
0.6%
0.8%
0.9%
1.0%
0.2%
1.5%
1.3%
1.5%
1.6%
2.4%
2.4%
2.5%
3.1%
3.8%
3.8%
4.4%
5.0%
5.0%
5.1%
5.5%
7.6%
0.0%
1.0%
2.0%
3.0%
4.0%
5.0%
6.0%
7.0%
8.0%
Initial Estimate
Revised Estimate
2
Losses
$305.7
$95.1
$105.0
$306.0
$60.0
$317.0
$122.7
$112.2
$125.0
$124.0
$77.7
$63.0
$26.0
$58.0
$43.0
____________________
Source: Company filings and press releases; losses are generally
disclosed net of tax and net of reinstatement premiums.
(1)
Q2 net losses reflect only losses from the Chilean earthquake.
Initial losses include the Chilean earthquake and Windstorm Xynthia.
(2)
Q2 net losses reflect Q1 estimates plus reported development, if
any.
(3)
Initial loss estimate reflects 50% to 90% of Reuters consensus net
operating earnings prior to the earthquake, based on disclosure that net income would remain positive for the quarter.
(4)
Initial estimates based on Chile and Xynthia, ultimate losses include the
Chilean, Haitian, and Baja earthquakes, Xynthiaand the Australian hailstorms. Based on international catastrophe losses being two-thirds of
total catastrophe losses as disclosed in the earnings conference
call.
(5)
Initial estimate is as of the first quarter conference call. Both
initial and revised estimates reflect only the Chilean earthquake.
(6)
Pro forma; includes losses from Harbor Point and Max Capital prior to the
merger. Expressed as a percentage of combined 12/31/09 equity prior to the special dividend.
(1)
(2)
(1)
(2)
(3)
(1)(4)
(1)
(2)
(2)(5)
(6)
Chilean Earthquake / Windstorm Xynthia
Ultimate Net Losses as a % of 12/31/09 Common Equity ($ in millions)
Less exposed to swings in the cat market |
 17
3
(1)
(3)
(2)
Losses
$256
$140
$276
$140
$135
$165
$287
$384
$171
$125
$148
$155
$113
$257
$50
(4)
____________________
Source: Company filings, as of 12/31/08. Losses are generally disclosed net of reinstatement
premiums. (1)
Results reflect Ike only.
(2)
Equity includes preferred, which subsequently converted to common.
(3)
Equity includes preferred, which subsequently converted to common.
(3)
TRH does not disclose specific losses but did lose "$169.7 million principally relating to
Hurricane Ike." $170
$305
Revised Estimate
Initial Estimate
(2)
Ike
/
Gustav
Ultimate
Net
Losses
as
a
%
of
6/30/08
Common
Equity
($
in
millions)
3.4%
3.8%
3.0%
4.2%
5.2%
6.0%
6.4%
7.2%
5.2%
7.8%
3.7%
5.3%
6.7%
8.3%
10.1%
6.6%
8.0%
4.4%
4.3%
0.0%
0.6%
2.2%
3.0%
4.3%
0.3%
2.6%
0.7%
0.3%
0.8%
0.8%
1.8%
0.8%
0.0%
2.0%
4.0%
6.0%
8.0%
10.0%
12.0%
14.0%
12.4%
11.0%
10.1%
8.9%
8.9%
8.4%
8.1%
8.1%
7.8%
7.2%
7.0%
6.3%
6.0%
5.0%
4.8%
4.6%
3.4%
VR
FSR
RNR
MRH
IPCR
PTP
ACGL
AXS
PRE
HP
AHL
ENH
ORH
TRH
AWH
RE
MXGL
Less exposed to swings in the cat market (cont’d) |
 18
Florida wind
1 in 100 year event -
$370 million net loss
Industry loss -
$104 billion
California earthquake
1 in 250 year event -
$398 million net loss
Industry loss -
$41 billion
Europe wind
1 in 100 year event -
$239 million net loss
Industry loss -
$17 billion
PML’s
In-force as of July 1, 2010 |
 19
Highlights
Insurance
Focus on the higher risk classes that are less price sensitive
Growth will be limited to select profitable opportunities
Benefit from strong client relationships with high renewal retentions in the mid 80’s
Reinsurance
Diverse portfolio with high ratings positions us well
Pull back where pricing softens
Latin America
Emerging market with significant natural organic growth
Seasoned team with strong market relationships and profitable track record
Lloyd’s/London
Continue to recruit new teams to build out the diversity of the platform
Recent additions in international casualty reinsurance and marine and personal accident
US Specialty
Market conditions getting more competitive
Strong distribution relationships help to generate a flow of business
Selectively underwrite new business
Declining volume in more commodity classes
Strategy to Navigate the Soft Cycle |
 20
$149.6
$293.7
$282.6
$289.0
$313.7
$321.0
$245.9
$163.2
$108.0
$247.1
$184.1
$173.5
$243.2
$265.2
$154.0
$126.4
$56.6
$88.4
$59.8
$12.3
$41.9
$43.7
$7.0
$10.0
$9.4
$40.7
$225.4
$248.7
$419.7
$0.0
$100.0
$200.0
$300.0
$400.0
$500.0
$600.0
$700.0
$800.0
$900.0
$543.0
$709.3
$648.6
$811.6
$597.6
$469.0
$682.9
$356.1
2003
2004
2005
2006
2007
2008
2009
H1 '10
Lloyd's
--
--
--
--
--
NM
15.0%
U.S. Specialty
--
--
--
--
274.7%
46.5%
9.0%
Reinsurance
(6.1%)
(30.7%)
11.6%
27.1%
27.4%
2.6%
(13.4%)
Insurance
--
--
141.7%
13.4%
13.5%
25.7%
(15.2%)
Total
(5.0%)
(12.8%)
39.6%
38.1%
52.7%
38.2%
(2.7%)
____________________
(1)
Excludes non-traditional, which is composed of structured contracts that Max stopped
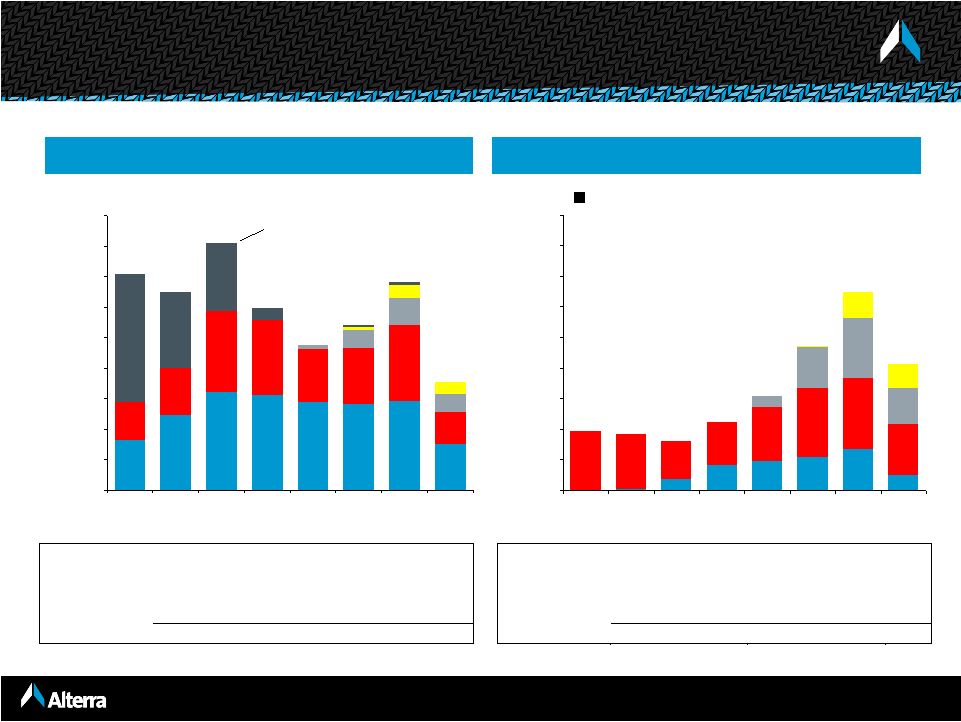
writing in 2003. Short tail lines contributed to 83% of total growth
over the 3 years to 2009
Strong Cycle Management Discipline
Long Tail (GPW)
Short Tail (GPW)
($ in millions)
Non-Traditional
Year over year growth:
Year over year growth:
Lloyd's
--
--
--
--
--
NM
101.1%
U.S. Specialty
--
--
--
--
386.2%
47.8%
35.4%
Reinsurance
(1)
21.8%
72.2%
(8.3%)
(28.7%)
6.1%
34.2%
(20.6%)
Insurance
50.7%
30.5%
(2.3%)
(7.9%)
(2.2%)
3.9%
(8.6%)
Total
38.1%
46.6%
(5.0%)
(14.7%)
12.4%
26.1%
(2.5%)
$49.1
$134.1
$106.7
$94.0
$82.9
$34.3
$2.2
$166.4
$231.9
$226.0
$177.4
$139.6
$125.1
$180.5
$192.3
$117.8
$197.1
$134.5
$35.9
$79.1
$85.3
$1.9
$0.0
$100.0
$200.0
$300.0
$400.0
$500.0
$600.0
$700.0
$800.0
$900.0
$192.3
$182.7
$159.4
$222.5
$307.3
$469.1
$648.4
$412.4
2003
2004
2005
2006
2007
2008
2009
H1 '10 |
 21
Conservative Reserve Position with High % of IBNR
50%
44%
36%
34%
28%
24%
24%
56%
64%
66%
72%
76%
76%
76%
50%
$278
$189
$1,471
$1,240
$279
$232
$1,987
$1,275
$0
$500
$1,000
$1,500
$2,000
$2,500
Q2 2010
Q4 2009
Q2 2010
Q4 2009
Q2 2010
Q4 2009
Q2 2010
Q4 2009
Case
IBNR
24%
Insurance
Reinsurance
Alterra at Lloyd's
U.S. Specialty
($ in millions)
____________________
Note: Includes the results of Harbor Point from May 12, 2010, the closing date of
the merger. |
 22
43%
39%
27%
31%
29%
57%
61%
73%
69%
71%
$3,773
$3,178
$2,938
$2,334
$2,335
$0
$500
$1,000
$1,500
$2,000
$2,500
$3,000
$3,500
$4,000
2006
2007
2008
2009
Q2 2010
Case Reserves
IBNR
Favorable Reserve
Development
$5.9
$45.1
$90.8
$77.2
$41.2
Development as a % of
Net Reserves
0.3%
1.9%
3.0%
2.4%
1.1%
Consistently Favorable
Reserve Development
Net Loss Reserves
($ in millions)
____________________
Note: Reserve development and net reserves prior to May 12, 2010 are for Max Capital
only. |
 23
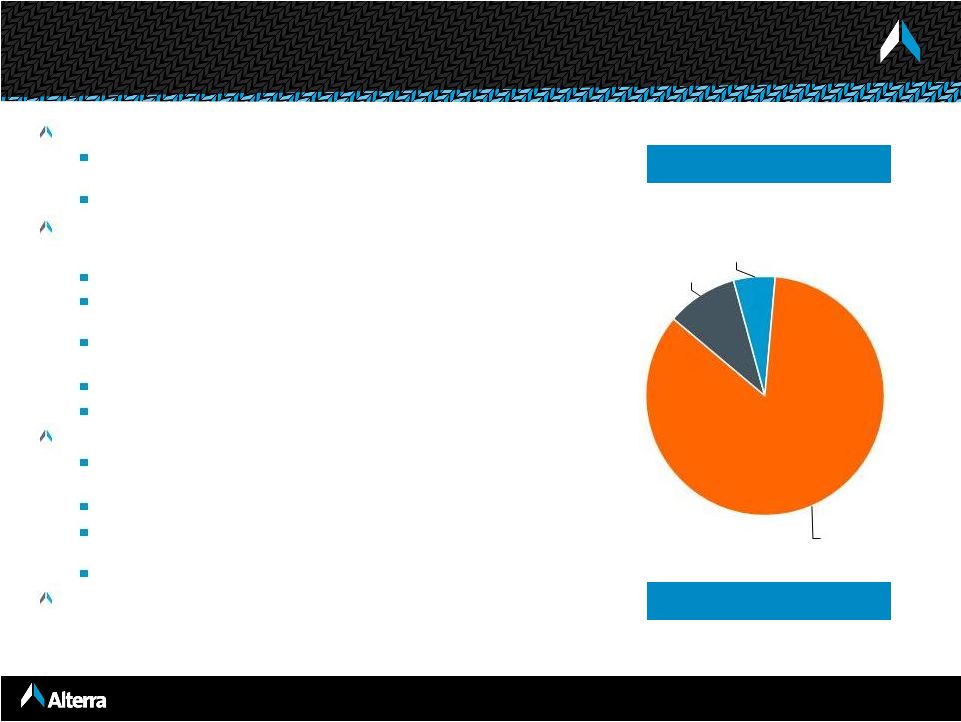
High Quality Conservative Investment Portfolio
Alterra
maintains a high quality, liquid portfolio
94.4% of portfolio in fixed income/cash, which consists of highly
rated securities
Assets are generally matched to liabilities
Cycle
management
extends
to
investments
–
current
posture
is defensive
Cash balance reduced to $741.7 million or 9.6% of portfolio
Current average fixed income duration of approximately
3.98 years including the impact of cash (4.41 without cash)
60.3% of the cash and fixed maturities portfolio is held in cash,
government / agency-backed securities, or AAA securities
70.8% of fixed income portfolio rated AA or better
Hedge fund investments are marked-to-market
Minimal exposure to selected asset classes
CMBS
of
$357.4
million
(4.6%
of
portfolio)
–
average
rating
of
AA+/Aa1
ABS of $98.3 million (1.3% of portfolio)
RMBS
of
$1,115.6
million
(14.4%
of
portfolio)
–
91.2%
agency-
backed
No CDO’s, CLO’s, SIV’s
or other highly structured securities
Fixed income portfolio has had meaningfully lower OTTI
losses than peers
Carrying Value $7.7 billion
June 30, 2010
Fixed Income
84%
Cash
10%
Hedge Funds
6% |
 24
0.25x
0.50x
0.75x
1.00x
1.25x
1.50x
1.75x
2.00x
8/27/00
10/6/01
11/16/02
12/27/03
2/5/05
3/17/06
4/27/07
6/6/08
7/17/09
8/27/10
Valuations Have Trended to a Historical Low
Price to Trailing Book Value (10 Years)
Average: 1.24x
Peers: 0.79x
Current valuations
are at a 36%
discount to the
long term average
Alterra: 0.74x
Alterra trades at a
40% discount to
the long term peer
average |
 25
We believe we can generate an average ROE of 13% to 15% across the cycle
____________________
Note:
Primary price / book multiple as of 8/27/10.
Alterra
Offers a Compelling Story
Well established operating platforms provide full access to business
Diversified portfolio of business across casualty and property lines
Specialty orientation with a balance of insurance vs. reinsurance
Opportunistic approach –
nimble and responsive to market trends
Defensive, high quality investment portfolio
Invested asset leverage will drive more consistent returns
Balance sheet strength with low leverage / financial flexibility
Attractive
entry
point
–
current
price
/
book
value
of
0.74x |
 26
Alterra
means "high ground" —
a place of security
Alterra
Capital Holdings Limited
Bermuda
Ireland
United States
Lloyd’s
Latin America |
 27
Appendices |
 28
June 30,
December 31,
2010
2009
Cash & Fixed Maturities
7,296
$
4,944
$
Other Investments
437
315
Premium Receivables
780
567
Losses Recoverable
962
1,001
Other Assets
500
513
Total Assets
9,975
$
7,341
$
Property & Casualty Losses
3,773
$
3,178
$
Life & Annuity Benefits
1,209
1,373
Deposit
Liabilities 148
153
Funds Withheld
120
140
Unearned Premium
1,090
628
Bank Loan
200
-
Senior Notes
90
90
Other Liabilities
418
213
Total Liabilites
7,048
$
5,775
$
Shareholders' Equity
2,927
1,565
9,975
$
7,340
$
Strong
Balance Sheet
($ in millions)
(1)
Results for the six months ended June 30, 2010 includes results from Harbor Point
following the close of the merger on May 12, 2010. |
 29
Half Year Results Comparison
($ in millions)
Six months ended
(1)
Pro forma six months ended
(2)
June 30,
June 30,
June 30,
June 30,
2010
2009
2010
2009
Gross Premiums Written
770
$
831
$
1,153
$
1,227
$
Net Premiums Earned
488
419
706
684
Net Investment Income
102
82
126
119
Net Realized and Unrealized Gains (Losses) on Investments
(8)
40
-
43
Other Than Temporary Impairment Charges
(1)
(2)
(1)
(2)
Other Income
-
2
1
3
Total Revenues
581
541
832
847
Total Losses, Expenses & Taxes
441
453
702
664
Net Income
140
$
88
$
130
$
183
$
Net Operating Income
99
$
95
$
Property & Casualty Underwriting
Loss Ratio
58.6%
65.4%
Expense Ratio
27.6%
24.9%
Combined Ratio
86.2%
90.3%
(1) Results for the six months
ended June 30, 2010 include results from Harbor Point following the close of the merger on May 12, 2010.
(2)
Pro forma information is provided for informational purposes only, to present a summary of the
combined results of operations assuming the amalgamation with Harbor Point had occurred on
January 1, 2009. The pro forma information assumes the elimination of intercompany transactions and the amortization of certain
acquisition accounting fair value adjustments. The pro forma information does not necessarily
represent results that would have occurred if the amalgamation had taken place on January 1,
2009, nor is it necessarily indicative of the future results. |
 30
Six months ended June 30, 2010
($ in millions)
Differences in table due to rounding. Includes results from Harbor Point following the close of
the merger on May 12, 2010. (1)
Property and Casualty only.
Diversified Operating
Platform
Life &
Property & Casualty
Annuity
Corporate
Consolidated
Alterra
at
Insurance
Reinsurance
U.S. Specialty
Lloyd's
Total
Reinsurance
Gross premiums written
$198.7
$274.4
$174.4
$120.9
$768.5
$1.7
$0.0
$770.1
Reinsurance premiums ceded
(84.8)
(58.7)
(56.1)
(33.2)
(232.8)
(0.1)
0.0
(232.9)
Net premiums written
$113.9
$215.7
$118.3
$87.7
$535.7
$1.5
$0.0
$537.2
Earned premiums
196.9
270.5
149.9
77.7
695.1
1.7
0.0
696.7
Earned premiums ceded
(90.9)
(35.0)
(68.6)
(14.6)
(209.1)
(0.1)
0.0
(209.2)
Net premiums earned
$106.0
$235.5
$81.4
$63.2
$486.0
$1.5
$0.0
$487.5
Net investment income
$12.4
$24.6
$2.7
$5.1
$44.8
$25.5
$31.4
$101.7
Net realized and unrealized gains (losses) on investments
0.2
0.2
0.0
(1.5)
(1.0)
4.1
(11.4)
(8.4)
Net impairment losses recognized in earnings
0.0
0.0
0.0
0.0
0.0
0.0
(0.7)
(0.7)
Other income
0.0
0.2
0.1
0.4
0.6
0.0
0.1
0.6
Total revenues
$118.6
$260.4
$84.1
$67.1
$530.3
$31.1
$19.4
$580.7
Net losses and loss expenses
$73.2
$132.5
$50.4
$28.7
$284.8
$0.0
$0.0
$284.8
Claims and policy benefits
0.0
0.0
0.0
0.0
0.0
31.6
0.0
31.6
Acquisition costs
0.5
47.6
12.8
11.8
72.8
0.3
0.0
73.0
Interest expense
0.5
5.1
0.0
0.0
5.5
4.0
3.3
12.9
Net foreign exchange losses
0.0
0.5
0.0
(3.9)
(3.4)
0.0
0.3
(3.1)
Merger and acquisition expenses
0.0
0.0
0.0
0.0
0.0
0.0
(49.8)
(49.8)
General and administrative expenses
12.4
23.8
16.5
8.5
61.2
1.3
24.7
87.2
Total losses and expenses
86.6
209.5
79.7
45.1
420.9
37.2
(21.5)
436.5
Income before taxes
$32.0
$51.0
$4.4
$22.0
$109.4
($6.1)
$40.9
$144.2
Loss ratio
69.1%
56.3%
62.0%
45.4%
58.6%
Acquisition cost ratio
0.5%
20.2%
15.7%
18.7%
15.0%
General and administrative expense ratio
11.6%
10.1%
20.2%
13.5%
12.6%
Combined ratio
(1)
81.2%
86.6%
97.9%
77.6%
86.2% |
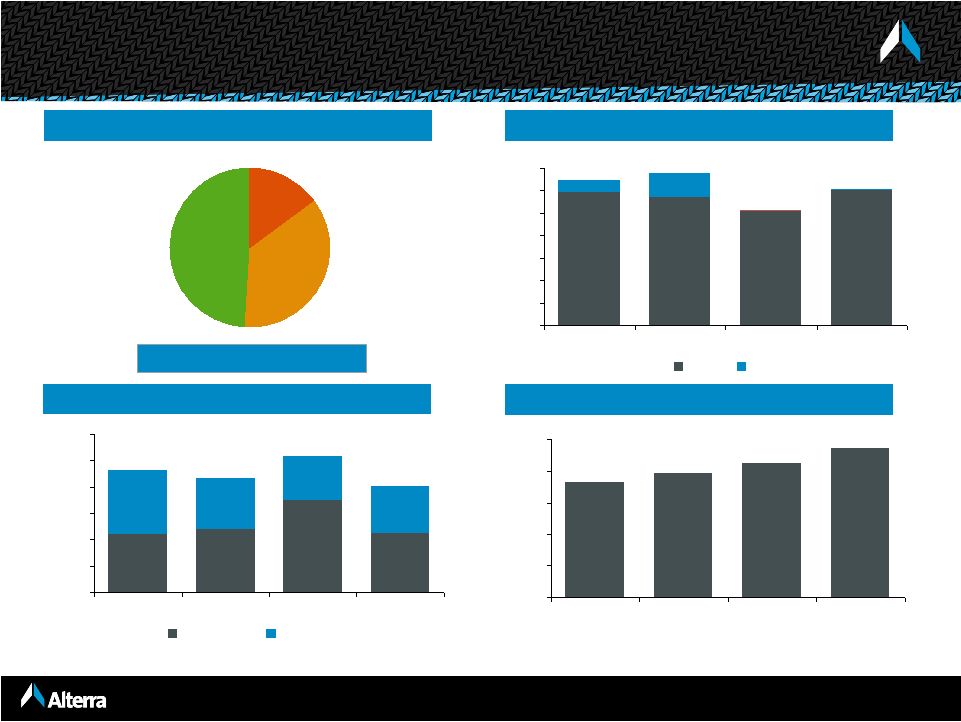 31
Shareholders’
Equity ($ in millions)
Premiums Written ($ in millions)
Combined Ratio
2009 Gross Premiums Written
Casualty
Property
Specialty
NPW
GPW
Loss & LAE Ratio
Expense Ratio
Total = $608 Million
49%
36%
15%
$642.6
$672.5
$511.7
$607.5
$601.9
$506.8
$567.9
$590.4
$0
$100
$200
$300
$400
$500
$600
$700
2006
2007
2008
2009
49.1%
38.7%
33.3%
36.3%
44.3%
69.9%
47.3%
43.7%
0.0%
20.0%
40.0%
60.0%
80.0%
100.0%
120.0%
2006
2007
2008
2009
86.0%
92.8%
103.2%
80.6%
$1,889.7
$1,691.5
$1,579.0
$1,461.9
$0
$400
$800
$1,200
$1,600
$2,000
2006
2007
2008
2009
Historic Harbor Point –
Financial Highlights |
 32
Property
Casualty
Specialty
Total
2009 GPW: $296 million
2009 GPW: $221 million
2009 GPW: $91 million
2009 GPW: $608 million
Per Risk
Catastrophe
Excess of Loss
Crop
Quota Share
Marine/Energy
Credit
Multi-line
Aviation
Property
Casualty
Specialty
Quota
Share
5%
20%
75%
14%
86%
26%
16%
4%
31%
23%
49%
36%
15%
$220.9
$225.3
$313.4
$220.4
$0
$100
$200
$300
$400
2006
2007
2008
2009
$295.9
$246.6
$282.3
$296.3
$0
$100
$200
$300
$400
2006
2007
2008
2009
$90.8
$39.8
$76.8
$126.0
$0
$100
$200
$300
$400
2006
2007
2008
2009
$607.5
$511.7
$672.5
$642.6
$0
$100
$200
$300
$400
$500
$600
$700
$800
2006
2007
2008
2009
Historic Harbor Point –
Financial Highlights (Cont’d) |
 33
Premiums Written ($ in millions)
2009 Gross Premiums Written
Shareholders’
Equity ($ in millions)
Combined Ratio
Loss & LAE Ratio
Expense Ratio
U.S. Specialty
Max at Lloyd’s
Life & Annuity
Reinsurance
Insurance
Reinsurance
Total = $1,375 million
36%
31%
3%
9%
21%
$865.2
$1,078.3
$1,254.3
$1,375.0
$634.7
$796.6
$840.2
$894.5
$0
$300
$600
$900
$1,200
$1,500
2006
2007
2008
2009
18.7%
24.2%
23.0%
25.7%
62.4%
68.9%
64.0%
67.7%
0.0%
20.0%
40.0%
60.0%
80.0%
100.0%
120.0%
2006
2007
2008
2009
88.2%
86.4%
91.9%
88.1%
NPW
GPW
$1,564.6
$1,280.3
$1,583.9
$1,390.1
$0
$400
$800
$1,200
$1,600
$2,000
2006
2007
2008
2009
Historic Max –
Financial Highlights |
 34
14.7%
(10.0%)
20.7%
17.3%
1.0%
15.8%
(20.0%)
(10.0%)
0.0%
10.0%
20.0%
30.0%
2004
2005
2006
2007
2008
2009
88%
92%
88%
86%
106%
94%
0%
20%
40%
60%
80%
100%
120%
2004
2005
2006
2007
2008
2009
$3.62
($2.54)
$4.81
$3.52
$0.19
$2.70
($4.00)
($2.00)
$0.00
$2.00
$4.00
$6.00
2004
2005
2006
2007
2008
2009
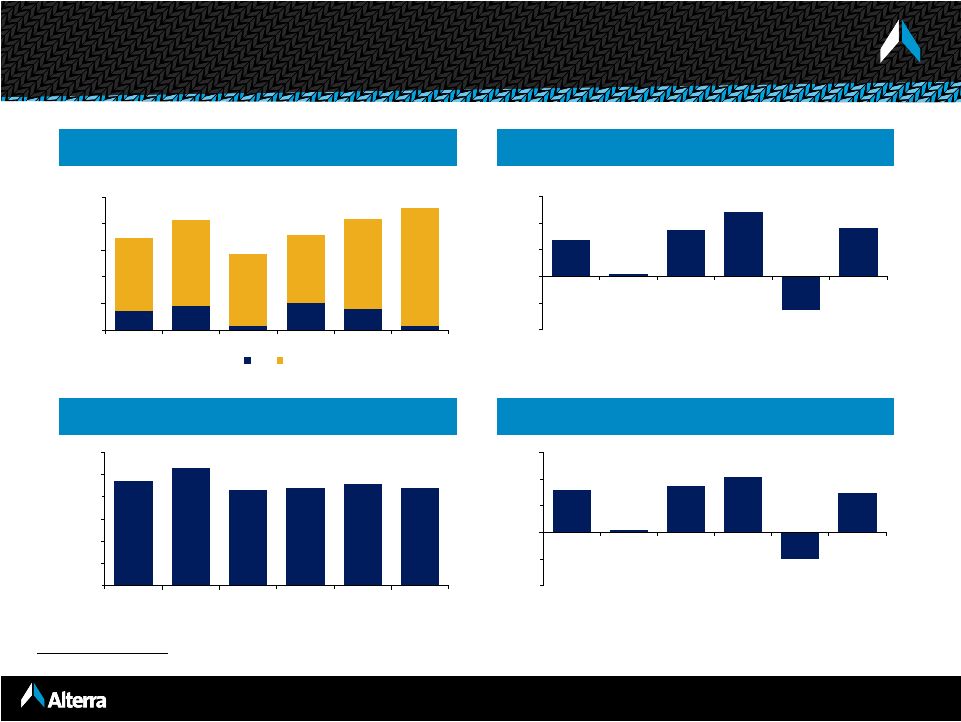
Gross Premiums Written ($ in millions)
P&C Combined Ratio
Operating Diluted EPS(1)
Operating ROE
(1)
Excludes merger and acquisition related revenue and expenses.
$44
$242
$302
$45
$275
$212
$0
$300
$600
$900
$1,200
$1,500
Life
P&C
$1,044
$1,246
$865
$1,078
$1,254
$1,375
2004
2005
2006
2007
2008
2009
Historic Max Results |
 35
$1,565
$1,280
$1,584
$1,390
$1,186
$903
$28.01
$22.94
$27.54
$23.06
$20.16
$19.70
$0
$300
$600
$900
$1,200
$1,500
$1,800
$0.00
$5.00
$10.00
$15.00
$20.00
$25.00
$30.00
Shareholders' Equity
Book Value per Share
2004
2005
2006
2007
2008
2009
$0.38
$0.36
$0.32
$0.24
$0.18
$0.12
$0.00
$0.10
$0.20
$0.30
$0.40
2004
2005
2006
2007
2008
2009
Investment
Leverage
Shareholders' Equity
Book Value per Share
Invested Assets ($ in millions)
Shareholders Equity and BVPS ($ in millions)
Operating Cash Flow ($ in millions)
Dividends
$5,259
$3,515
$4,228
$4,536
$5,123
$5,357
3.4x
3.9x
3.6x
3.3x
3.2x
4.2x
$0
$1,000
$2,000
$3,000
$4,000
$5,000
$6,000
0.0x
1.0x
2.0x
3.0x
4.0x
5.0x
Invested Assets
Leverage
2004
2005
2006
2007
2008
2009
$193
$482
$228
$405
$442
$799
$0
$200
$400
$600
$800
$1,000
2004
2005
2006
2007
2008
2009
Historic Max Results (cont’d) |