Attached files
| file | filename |
|---|---|
| 8-K - COPANO ENERGY FORM 8-K - Copano Energy, L.L.C. | form8-k.htm |
September 2010 Investor
Presentation
Presentation
NASDAQ: CPNO

Disclaimer
This presentation includes “forward-looking statements,” as defined in the federal securities laws.
Statements that address activities, or events that Copano believes will or may occur in the future are
forward-looking statements. These statements include, but are not limited to, statements about future
producer activity and Copano’s total distributable cash flow and distribution coverage. These statements
are based on management’s experience and perception of historical trends, current conditions, expected
future developments and other factors management believes are reasonable.
Important factors that could cause actual results to differ materially from those in the forward-looking
statements include the following risks and uncertainties, many of which are beyond Copano’s control:
The volatility of prices and market demand for natural gas and natural gas liquids; Copano’s ability to
continue to obtain new sources of natural gas supply and retain its key customers; the impact on
volumes and resulting cash flow of technological, economic and other uncertainties inherent in
estimating future production and producers’ ability to drill and successfully complete and attach new
natural gas supplies and the availability of downstream transportation systems and other facilities for
natural gas and NGLs; higher construction costs or project delays due to inflation, limited availability of
required resources, or the effects of environmental, legal or other uncertainties; general economic
conditions; the effects of government regulations and policies; and other financial, operational and legal
risks and uncertainties detailed from time to time in Copano’s quarterly and annual reports filed with the
Securities and Exchange Commission.
Copano undertakes no obligation to update any forward-looking statements, whether as a result of new
information or future events.
information or future events.
2

Introduction to Copano
Independent midstream company founded in 1992
■ Best in class service to customers
■ Entrepreneurial approach
■ Focus on long-term accretive growth
Provides midstream services in multiple producing areas through
three operating segments
three operating segments
■ South and north Texas
● Conventional, Eagle Ford Shale and Barnett Shale Combo play
■ Central and Eastern Oklahoma
● Conventional, Hunton De-Watering play and Woodford Shale
■ Rocky Mountains
● Powder River Basin
3
Key Metrics
Service throughput volumes approximate 1.8 Bcf/d of natural gas(1)
Over 6,700 miles of active pipelines
8 natural gas processing plants with over 1.1 Bcf/d of combined
processing capacity
processing capacity
One NGL fractionation facility with total capacity of 22,000 Bbls/d
Equity market cap: $1.8 billion(2)
Enterprise value: $2.8 billion(3)
4
(1) Based on 2Q 2010 results. Includes unconsolidated affiliates.
(2) As of August 24, 2010.
(3) As of August 24, 2010. Includes $300 million of convertible preferred equity issued July 2010.
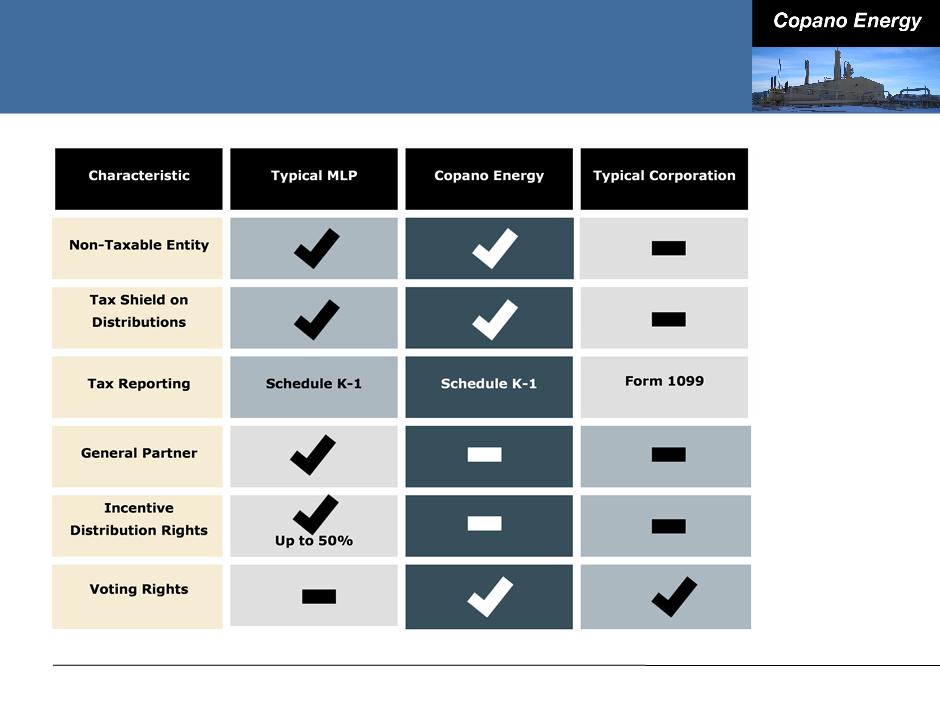
Copano’s LLC Structure
5
Growth Strategy
Goal: to become a diversified midstream company with scale and
stability of cash flows, above-average returns on invested capital
and “investment-grade quality distributions”
stability of cash flows, above-average returns on invested capital
and “investment-grade quality distributions”
Key tenets of growth strategy:
■ Execute on organic growth opportunities around existing assets
■ Explore opportunities beyond traditional gathering and processing
● Be more proactive in seeking assets and opportunities
■ Reduce sensitivity of cash flows to commodity price fluctuations
● Hedging program
● Contracts - increase fee-for-service component
6

Agenda
7
|
2010 Outlook
|
Commodity Prices and
Margin Sensitivities |
|
Financing and
Commodity Risk Management |
Conclusions
|
2010 Outlook
Texas
■ Significant drilling and development activity in the Barnett Shale Combo play
■ Ramp up of Eagle Ford Shale directed drilling
Oklahoma
■ Moderate drilling activity behind the Hunton De-Watering play
■ Strong drilling activity in the Woodford Shale play
Rocky Mountains
■ Minimal new drilling; flat volumes
Commodity prices
■ Lower forward price curves for NGLs and oil compared to early 2010
Total Distributable Cash Flow (Total DCF)
■ Second half 2010 - improvement compared to first half
■ Beyond 2010 - until volumes from new projects come online in second half of
2011, Total DCF estimated to be lower than comparable 2010 periods due to
current forward prices and lower average strike prices on hedges
2011, Total DCF estimated to be lower than comparable 2010 periods due to
current forward prices and lower average strike prices on hedges
8
Texas Outlook
Saint Jo gathering system
■ 15 rigs running in the area with
as many as 2 more anticipated
later this year
as many as 2 more anticipated
later this year
● Leasing activity continues
■ Crude oil play with associated
gas requiring a full slate of
midstream services
gas requiring a full slate of
midstream services
■ Based on producer drilling
schedule, expect steady
increase in plant inlet volumes
in 2010
schedule, expect steady
increase in plant inlet volumes
in 2010
● 2Q 2010 average volumes of
approximately 40,000
MMbtu/d vs. 24,000 MMbtu/d
in 1Q 2010
approximately 40,000
MMbtu/d vs. 24,000 MMbtu/d
in 1Q 2010
9
Texas Outlook
Eagle Ford Shale play
■ Copano’s current asset base strategically positioned
● Houston Central complex located within 50 miles of the rich gas core of the
play
play
■ 22,000 BPD fractionator placed in service April 2010
■ 9 Eagle Ford Shale wells connected to date and expect to connect 8 - 10
additional wells over the next three months
additional wells over the next three months
■ Expect Eagle Ford Shale volume increases in 3Q 2010
■ Currently pursuing multiple gathering and related downstream opportunities
10
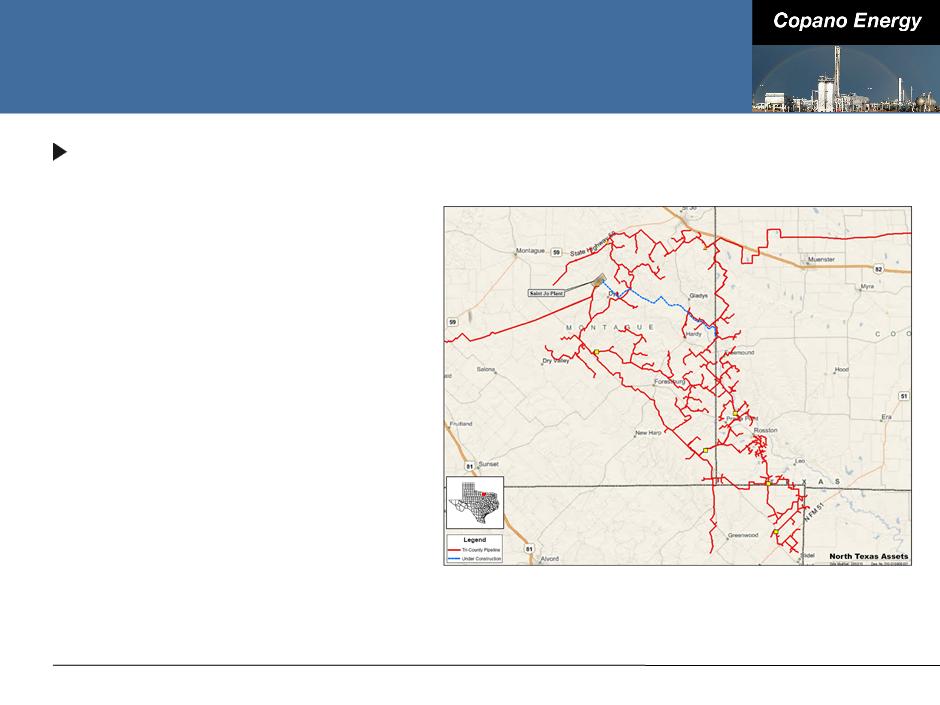
Texas Recent Developments
Saint Jo plant
■ Earlier this year, executed key producer
contract with highly rated producer
contract with highly rated producer
● Long-term gathering, treating and
processing agreement
processing agreement
● Fee-for-service contract
■ Additional 50 MMcf/d of compression
expected to be in service early 4Q
2010, bringing total plant capacity to
100 MMcf/d
expected to be in service early 4Q
2010, bringing total plant capacity to
100 MMcf/d
● Plant fully committed
● Additional expansion under
consideration
consideration
■ $30 - $35 million in fee-based cash flow
expected by year-end 2010 (on an
annualized basis)
expected by year-end 2010 (on an
annualized basis)
11
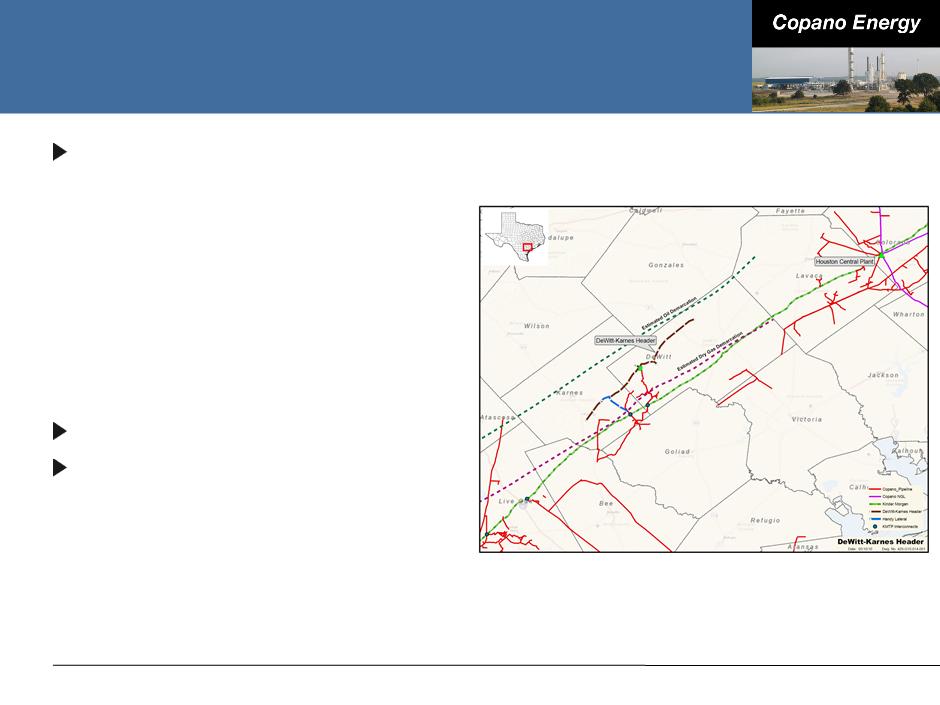
DeWitt-Karnes Header
Nearing completion of
previously announced DeWitt-
Karnes header
previously announced DeWitt-
Karnes header
■ 38 miles of 24” pipe
■ Initially 185 MMcf/d of capacity with
ability to expand to 275 MMcf/d
ability to expand to 275 MMcf/d
■ Active producers in the vicinity
include: Pioneer, ConocoPhillips,
Petrohawk, GeoSouthern and
Enduring Resources
include: Pioneer, ConocoPhillips,
Petrohawk, GeoSouthern and
Enduring Resources
11 rigs running in the area
Average IP rates of wells
connected are approximately
7.6 MMcfe/d
connected are approximately
7.6 MMcfe/d
■ Approximately 3.5 MMcf/d of gas
■ Approximately 500 - 1,000 BPD of
condensate
condensate
12
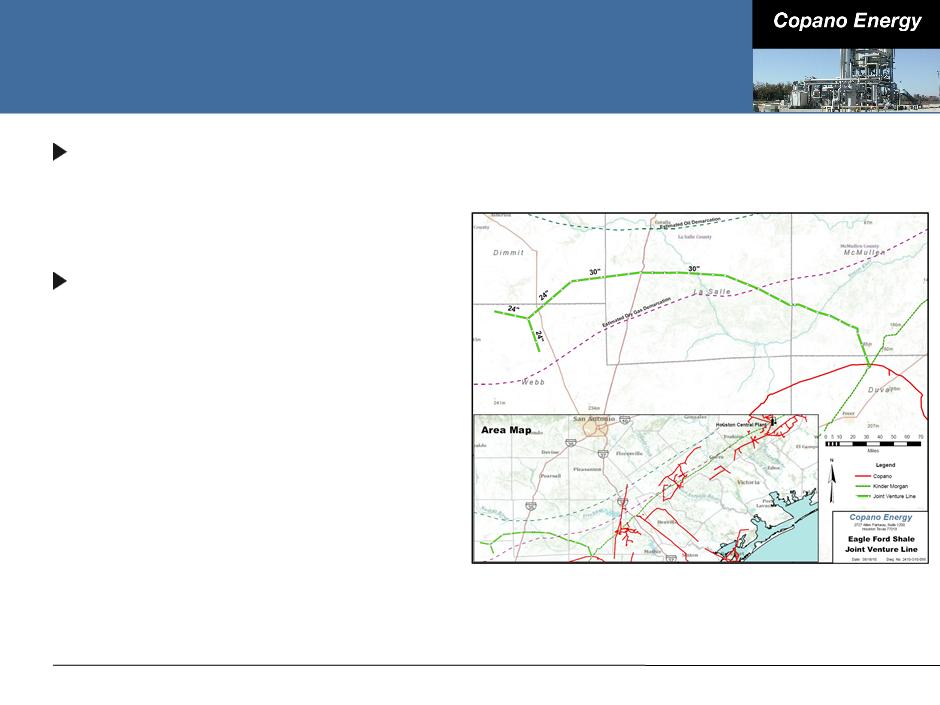
Eagle Ford Gathering Joint Venture
Executed joint venture
agreements with Kinder
Morgan in May 2010
agreements with Kinder
Morgan in May 2010
Gas services agreement
between Copano/Kinder
Morgan joint venture and SM
Energy signed in July 2010
between Copano/Kinder
Morgan joint venture and SM
Energy signed in July 2010
■ Kicked off pipeline construction -
expected to be completed
summer 2011
expected to be completed
summer 2011
■ Approximately 85 miles of 30”
and 24” pipe
and 24” pipe
■ Anticipated capex (net to
Copano) - approximately $68.5
million
Copano) - approximately $68.5
million
13

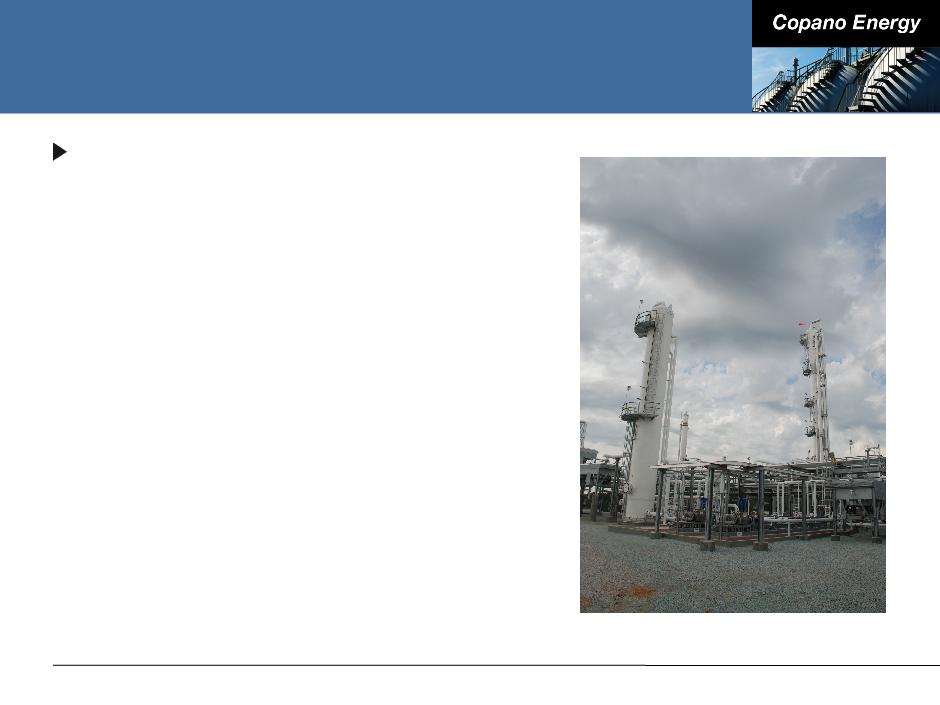
Texas Fractionation Facility
Responding to NGL transportation and fractionation constraints
along the Texas Gulf Coast, Copano started its fractionator at
Houston Central complex and began to deliver purity products to
market in April 2010
along the Texas Gulf Coast, Copano started its fractionator at
Houston Central complex and began to deliver purity products to
market in April 2010
■ Total capacity of 22,000 Bbls/d
■ Approximate cost of $17 million
■ Estimated fee-based cash flow between $8 and $10 million on an
annualized basis at current throughput volumes
annualized basis at current throughput volumes
Incremental processing and fractionation capacity is expected to
be required to meet producer demands in the Eagle Ford Shale
be required to meet producer demands in the Eagle Ford Shale
14
Oklahoma Outlook
Rich gas (primarily Hunton De-Watering play)
■ Drilling activity increased so far in 3Q 2010
■ 2 rigs currently running in the Hunton and 15 rigs in other rich gas areas
■ Attractive processing upgrade and low geologic risk
■ 3Q 2010 volumes expected to be slightly up vs. 2Q 2010
Lean gas (primarily Woodford Shale)
■ Drilling remains active
■ 5 rigs currently running
■ 3Q 2010 volumes expected to be higher than 2Q 2010
15
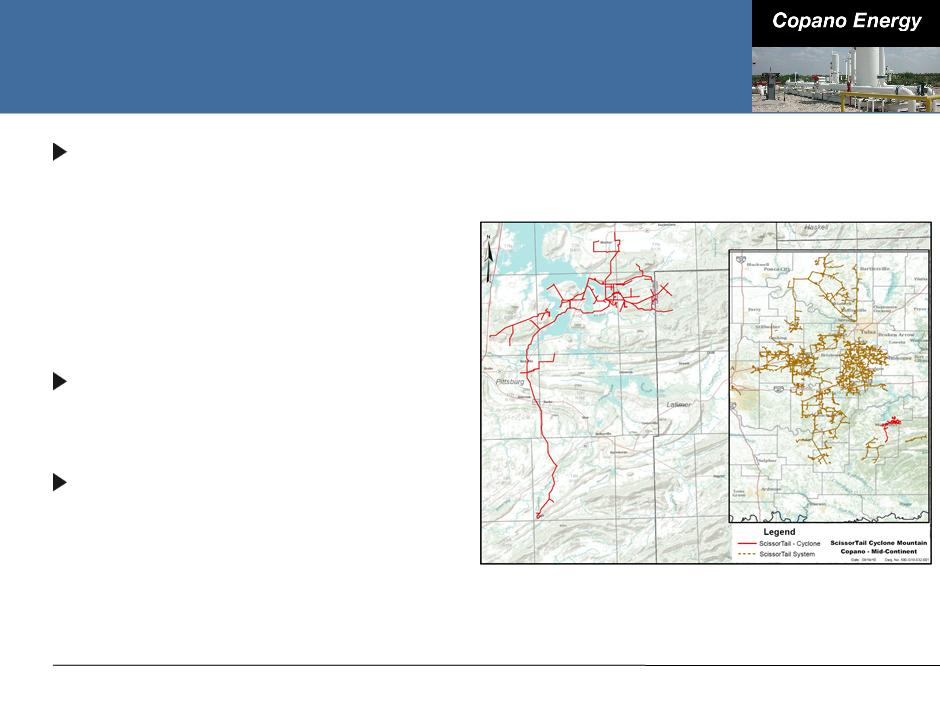
Woodford Shale Activity
Significant drilling activity in the
Woodford Shale around
Copano’s Cyclone Mountain
system
Woodford Shale around
Copano’s Cyclone Mountain
system
■ 2Q 2010 average volumes of
approximately 58,000 MMbtu/d vs.
53,000 MMbtu/d in 1Q 2010
approximately 58,000 MMbtu/d vs.
53,000 MMbtu/d in 1Q 2010
Primarily lean gas that requires
compression and CO2 treating
compression and CO2 treating
Current system capacity
approximately 80 MMcf/d with
plans to expand to 120 MMcf/d
by year-end 2010
approximately 80 MMcf/d with
plans to expand to 120 MMcf/d
by year-end 2010
■ Gathering and treating expansion
project of $10 million to be placed
in service 4Q 2010
project of $10 million to be placed
in service 4Q 2010
16

Rocky Mountains Outlook
Drilling and dewatering will be driven by commodity prices and
producer economics
producer economics
3Q 2010 volumes for Bighorn expected to be slightly lower to flat vs.
2Q 2010
2Q 2010
3Q 2010 volumes for Fort Union expected to be slightly higher vs. 2Q
2010
2010
2010 Adjusted EBITDA expected to be essentially flat vs. 2009
17

Commodity Prices and Margin Sensitivities
18
|
2010 Outlook
|
Commodity Prices and
Margin Sensitivities |
|
Financing and
Commodity Risk Management |
Conclusions
|
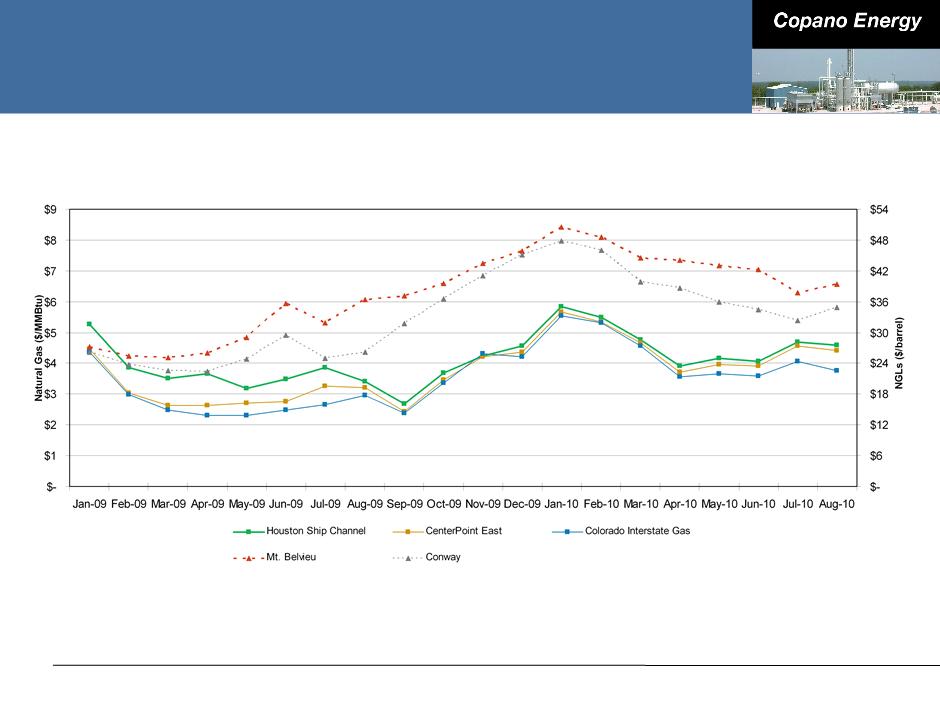
Historical Commodity Prices
19
(1) Aug-10 NGL prices are month-to-date through Aug 20, 2010.
(2) NGL prices for Jan-09 through Jun-10 are calculated based on the weighted-average product mix for the period indicated. NGL prices for Jul-10 through
Aug-10 are calculated based on the second quarter 2010 product mix.
Aug-10 are calculated based on the second quarter 2010 product mix.
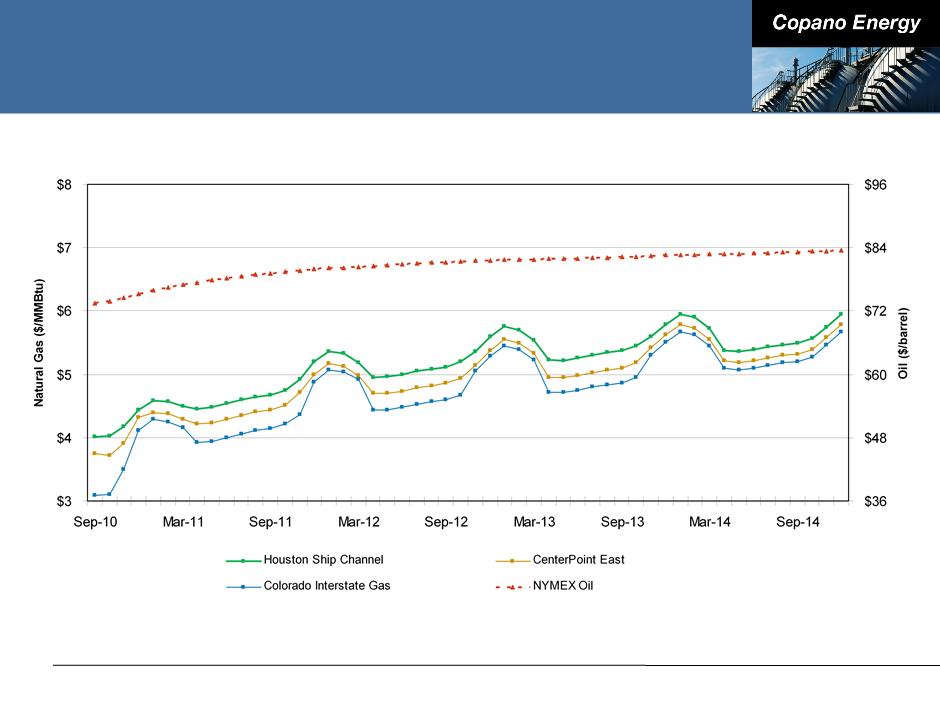
Forward Commodity Prices
20
Note: Forward prices as of August 20, 2010
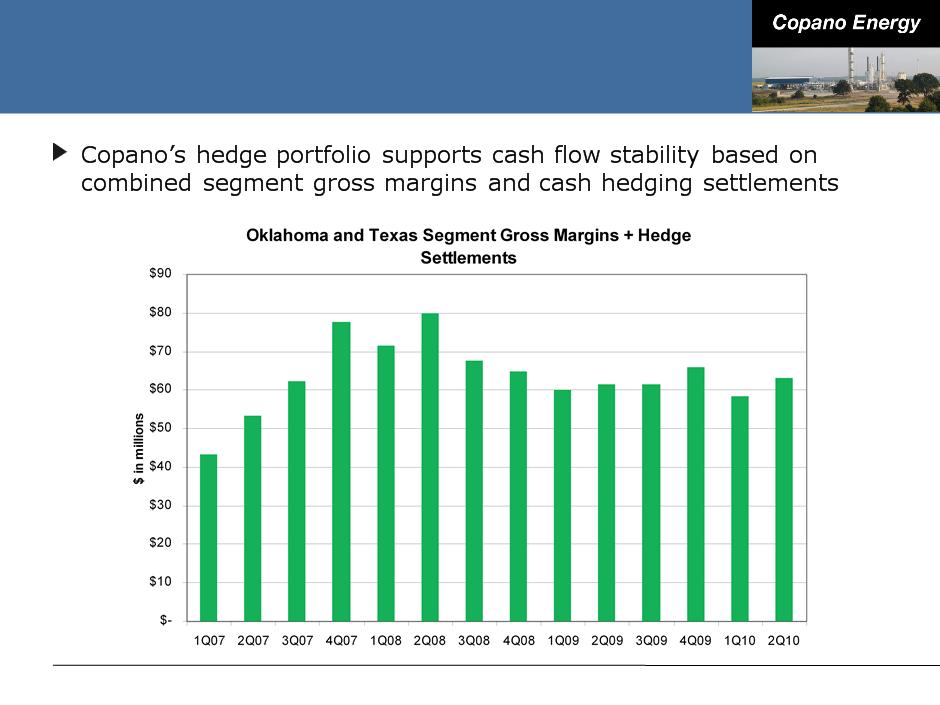
Combined Commodity-Sensitive Segment
Margins and Hedging Settlements
Margins and Hedging Settlements
21

Financing and Commodity Risk Management
22
|
2010 Outlook
|
Commodity Prices and
Margin Sensitivities |
|
Financing and
Commodity Risk Management |
Conclusions
|

2010 Expansion Capex
2010 capital expansion budget increased from $130 million(1) in
January to $172 million(1) today
January to $172 million(1) today
Major areas of focus include:
■ Eagle Ford Shale and Houston Central complex in south Texas
● DeWitt-Karnes pipeline
● Copano/Kinder Morgan joint venture
■ Saint Jo processing plant and pipelines in north Texas
■ Cyclone Mountain system in Oklahoma - Compression and amine treating
expansion
expansion
Expect capital to be invested at a multiple of approximately 5x
Pursuing another $300 million(1) in projects that Copano believes
will develop over the next two years
will develop over the next two years
23
(1) Includes Copano’s net share for unconsolidated affiliates.
Recent Preferred Equity Offering
In July 2010 Copano issued $300 million of convertible preferred
equity to affiliate of TPG Capital
equity to affiliate of TPG Capital
■ Priced at $29.05 per unit - 10% premium to the 30-day volume weighted
average price as of July 19, 2010
average price as of July 19, 2010
■ Distributions paid in-kind for the first three years ($0.72625 per unit)
■ Convertible to common units on a one for one basis beginning July 2013
unless conversion would cause pro forma distribution coverage to fall below
100%
unless conversion would cause pro forma distribution coverage to fall below
100%
■ Copano can force conversion beginning July 2013 if market price for common
units is at least $37.77 per unit
units is at least $37.77 per unit
■ No mandatory redemption
Alignment with a strategic capital partner that has a long-term
investment prospective
investment prospective
Flexible capital to fund Eagle Ford Shale expansion strategy and
other growth initiatives in Texas and Oklahoma
other growth initiatives in Texas and Oklahoma
24
Hedging Strategy
Option-based, product-specific
2010 price exposed volumes are well hedged
■ Between 70% and 80% of propane, butane, natural gasoline and condensate
price exposure is hedged
price exposure is hedged
■ Approximately 40% of ethane price exposure is hedged
■ Expect $32 - $34 million of non-cash amortization expense in 2010 related to
option component of hedge portfolio
option component of hedge portfolio
2011 hedged at or near policy limits, except for ethane
■ During April and August, added puts for WTI, iso-butane and normal butane
for calendar years 2011 and 2012 (total cost of approximately $6.8 million)
for calendar years 2011 and 2012 (total cost of approximately $6.8 million)
Will continue adding to 2012 hedging positions and begin focusing
on 2013 later this year
on 2013 later this year
25

Conclusions
26
|
2010 Outlook
|
Commodity Prices and
Margin Sensitivities |
|
Financing and
Commodity Risk Management |
Conclusions
|
Conclusions
Growth projects recently completed are expected to contribute to
Total DCF as volumes come online
Total DCF as volumes come online
■ Volumes at Saint Jo plant increasing
■ Start-up of fractionator at Houston Central complex
■ Burbank plant in service
■ Portions of DeWitt-Karnes header in service
Significant future growth opportunities
■ Expansion of Saint Jo plant to 100 MMcf/d expected early 4Q 2010
■ Completion of DeWitt Karnes header expected late 3Q 2010
■ Completion of Eagle Ford Gathering joint venture in western Eagle Ford Shale
expected summer 2011
expected summer 2011
■ Anticipating future infrastructure needs, including processing plant
expansions, fractionation expansion and additional gas and liquids pipelines
expansions, fractionation expansion and additional gas and liquids pipelines
Ample liquidity and access to capital to support growth initiatives
27

Appendix
28
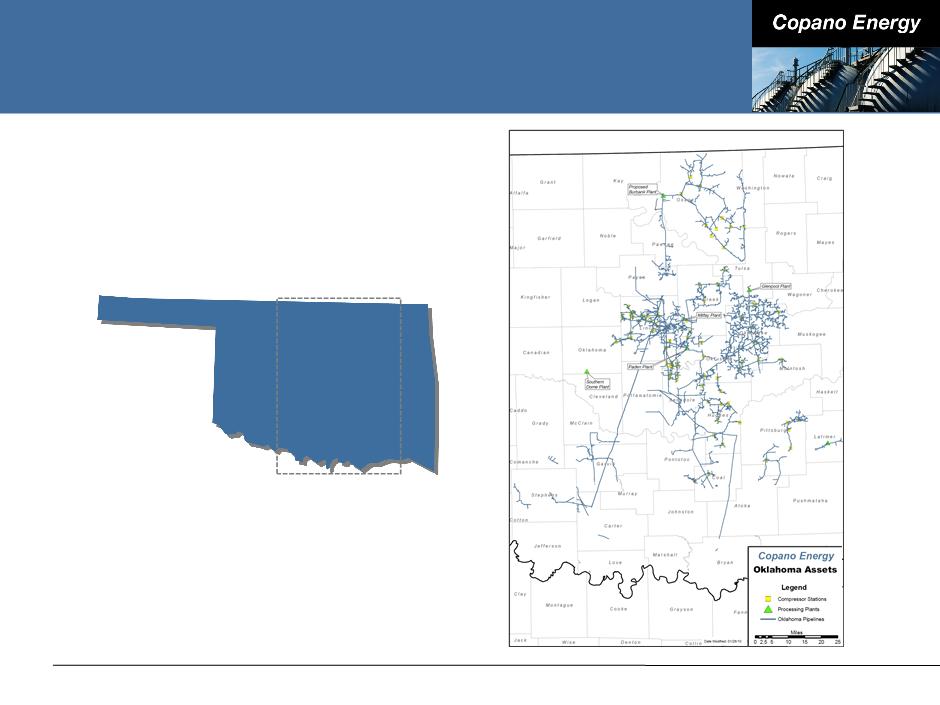
Oklahoma Assets
29
OKLAHOMA
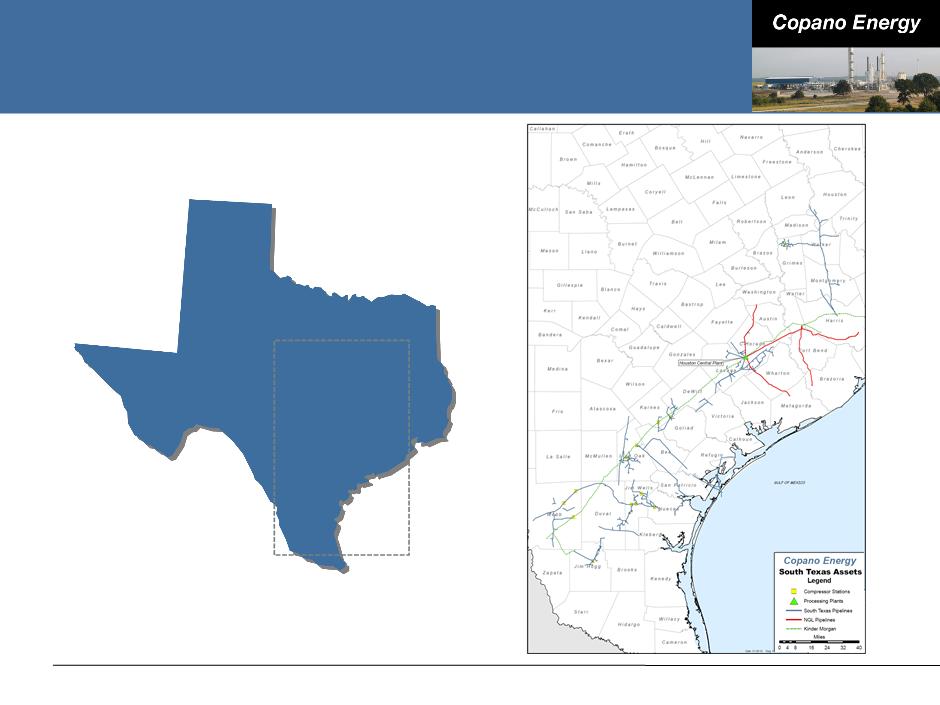
South Texas Assets
30
TEXAS
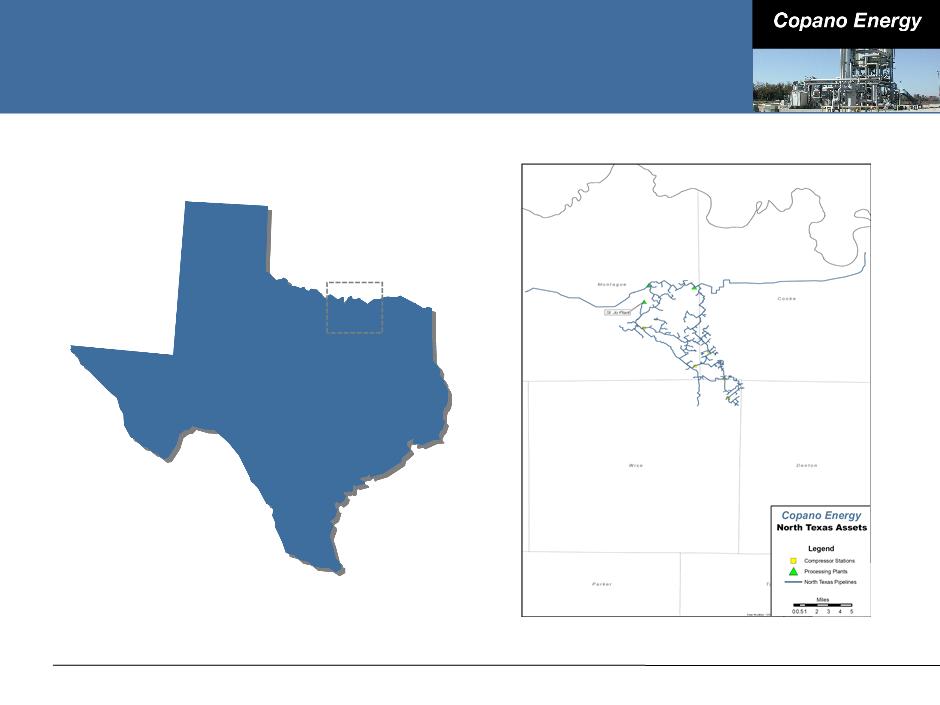
North Texas Assets
31
TEXAS

Rocky Mountains Assets
32
WYOMING
Processing Modes
33
|
Full Recovery
|
|
|
|
Texas and Oklahoma - If the value of
recovered NGLs exceeds the fuel and gas shrinkage costs of recovering NGLs |
|
Ethane Rejection
|
|
|
|
Texas and Oklahoma - If the value of ethane
is less than the fuel and shrinkage costs to recover ethane (in Oklahoma, ethane rejection at Paden plant is limited by nitrogen rejection facilities) |
|
Conditioning Mode
|
|
|
|
Texas - If the value of recovered NGLs is less
than the fuel and gas shrinkage cost of recovering NGLs (available at Houston Central plant and at Saint Jo plant) |
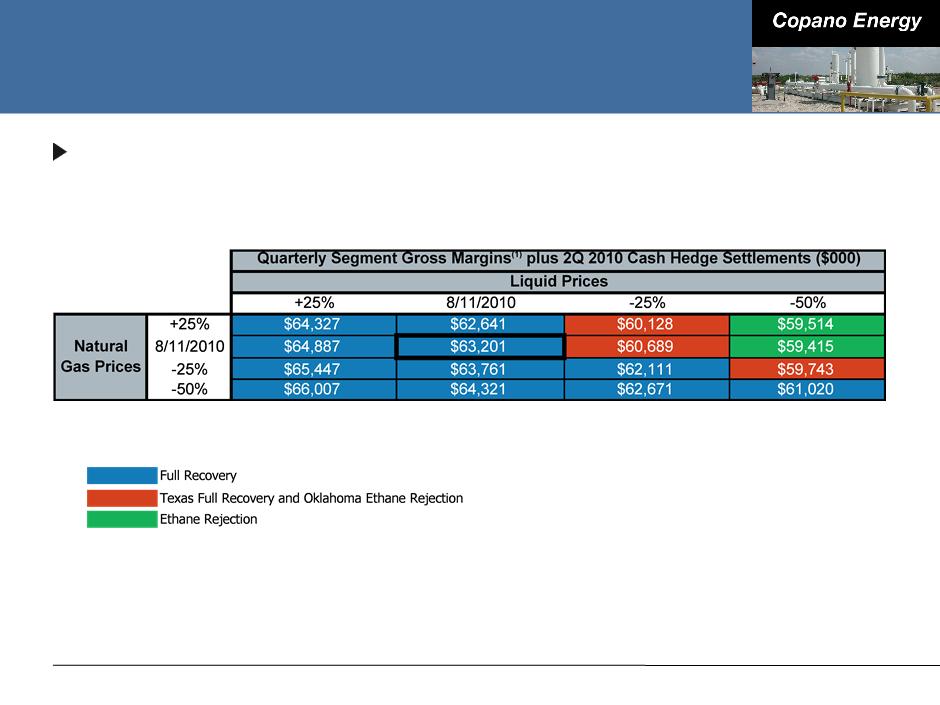
Commodity-Related Margin Sensitivities
Matrix reflects 2Q 2010 wellhead and plant inlet volumes, adjusted
using Copano’s 2010 planning model
using Copano’s 2010 planning model
34
Note: Please see this Appendix for definitions of processing modes and additional details.
(1) Consists of Texas and Oklahoma Segment gross margins.
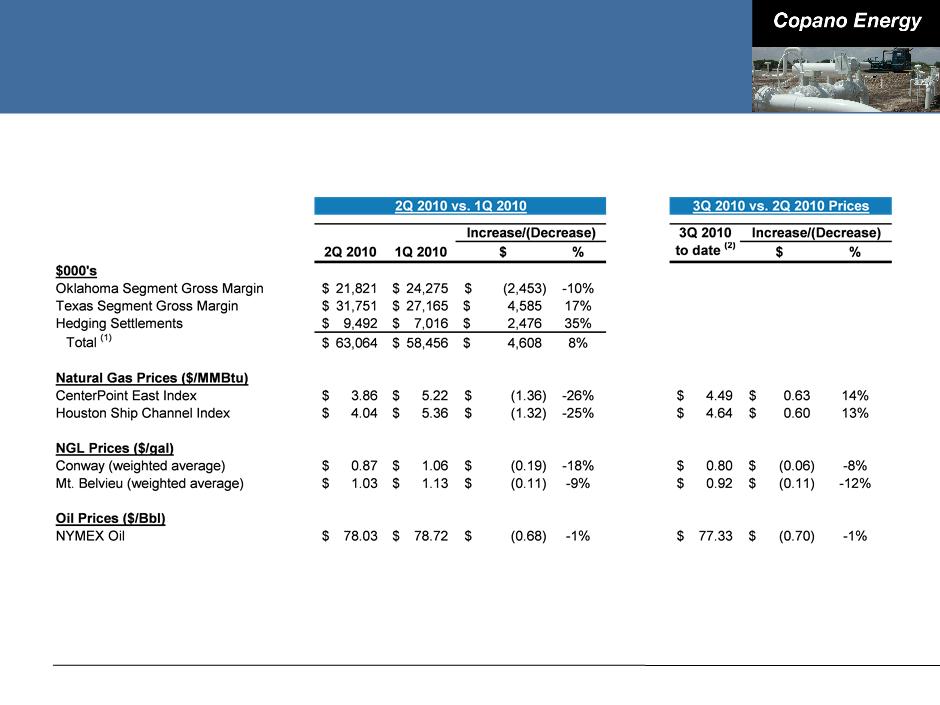
Combined Commodity-Sensitive Segment
Margins and Hedging Settlements
Margins and Hedging Settlements
35
Note: Weighted average NGL prices are based on Copano product mix for period indicated.
(1) Does not include non-cash expenses included in Corporate and Other for purposes of calculating Total Segment Gross Margin. See Appendix for reconciliation
of Total Segment Gross Margin.
of Total Segment Gross Margin.
(2) Reflects the average of July and August (as of August 23, 2010) prices.
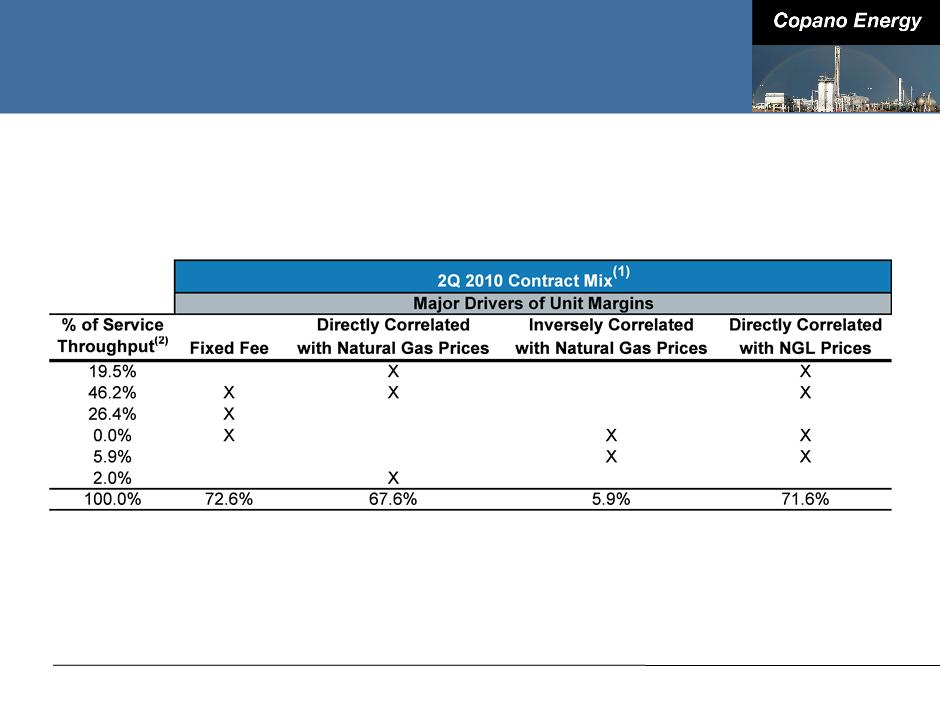
Oklahoma Contract Mix
36
(1) Source: Copano Energy internal financial planning models for consolidated subsidiaries.
(2) Excludes 12,689 MMBtu/d service throughput for Southern Dome, a majority-owned affiliate.
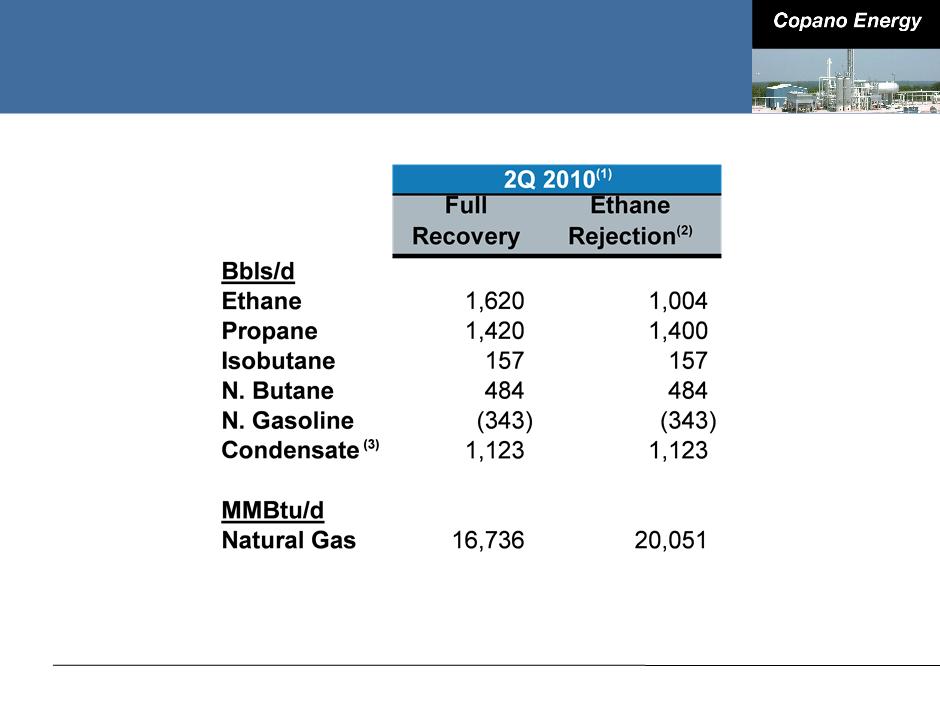
Oklahoma Net Commodity Exposure
37
Note: See explanation of processing modes in this Appendix. Values reflect rounding.
(1) Source: Copano Energy internal financial planning models for consolidated subsidiaries.
(2) Ethane rejection at Paden plant is limited by nitrogen rejection facilities.
(3) Reflects impact of producer delivery point allocations, offset by field condensate collection and stabilization.
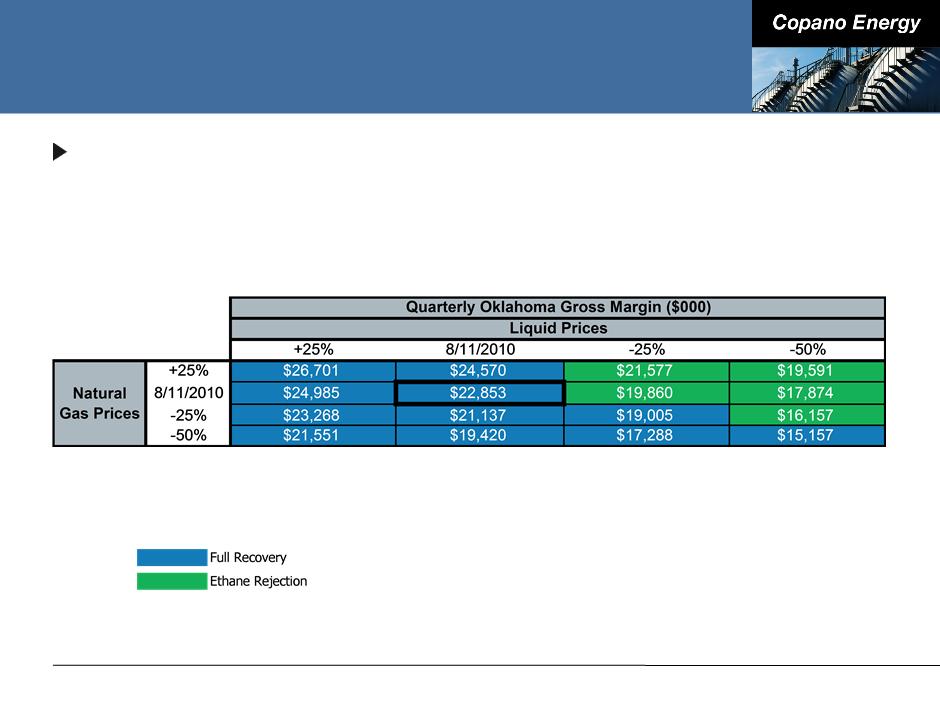
Oklahoma Commodity Price Sensitivities
Oklahoma segment gross margins excluding hedge settlements
■ Matrix reflects 2Q 2010 volumes, adjusted using Copano’s 2010 planning
model
model
38
Note: Please see this Appendix for definitions of processing modes and additional details.
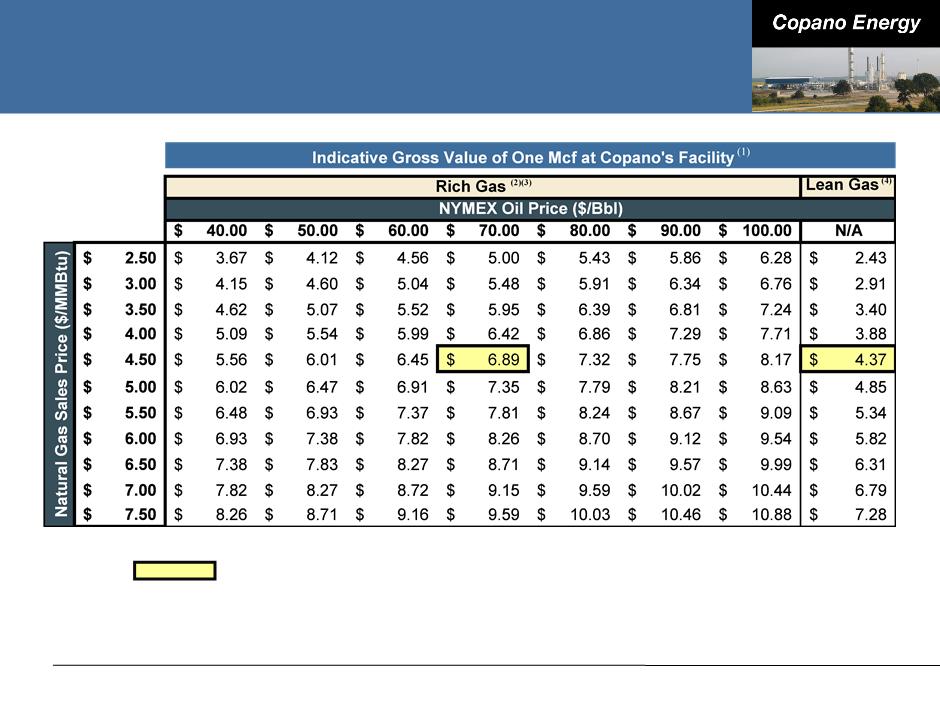
Oklahoma Rich Gas vs. Lean Gas
39
Prices as of 8/19/10
(1) Full value prior to deduction of Copano’s margin. Excludes value of condensate and crude oil recovered by the producer at the wellhead.
(2) Implied NGL prices are based on a six-year historical regression analysis.
(3) Assumes 9 GPM gas with a Btu factor of 1.375 processed at Copano’s cryogenic plant, and field fuel of 6.25%.
(4) Assumes unprocessed gas with a Btu factor of 1.0 and field fuel of 6%.
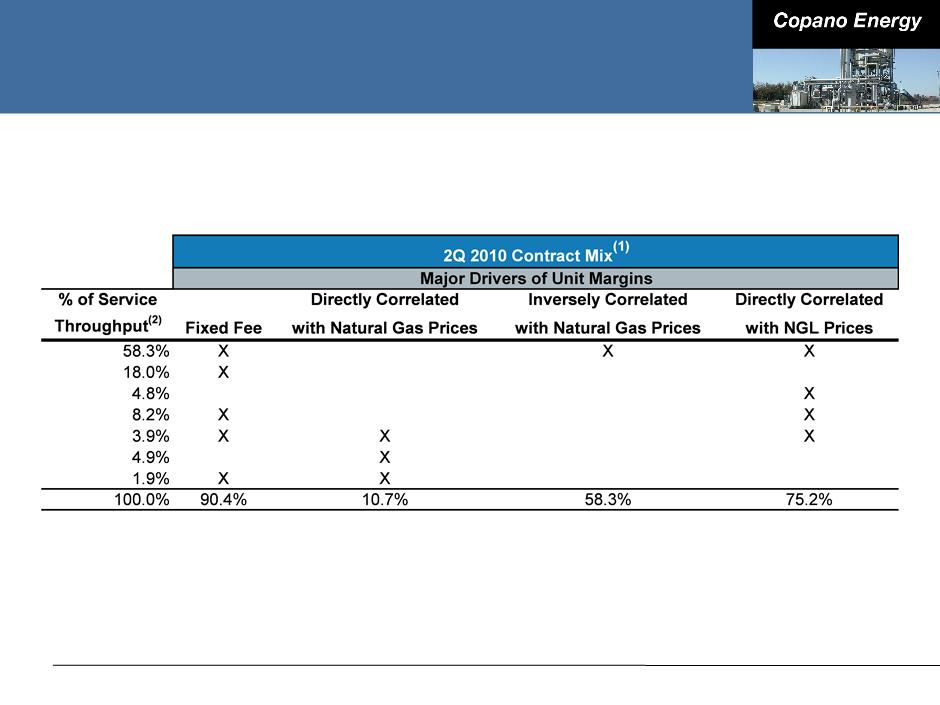
Texas Contract Mix
40
(1) Source: Copano Energy internal financial planning models for consolidated subsidiaries.
(2) Excludes 54,747 MMBtu/d service throughput for Webb Duval, a majority-owned affiliate.
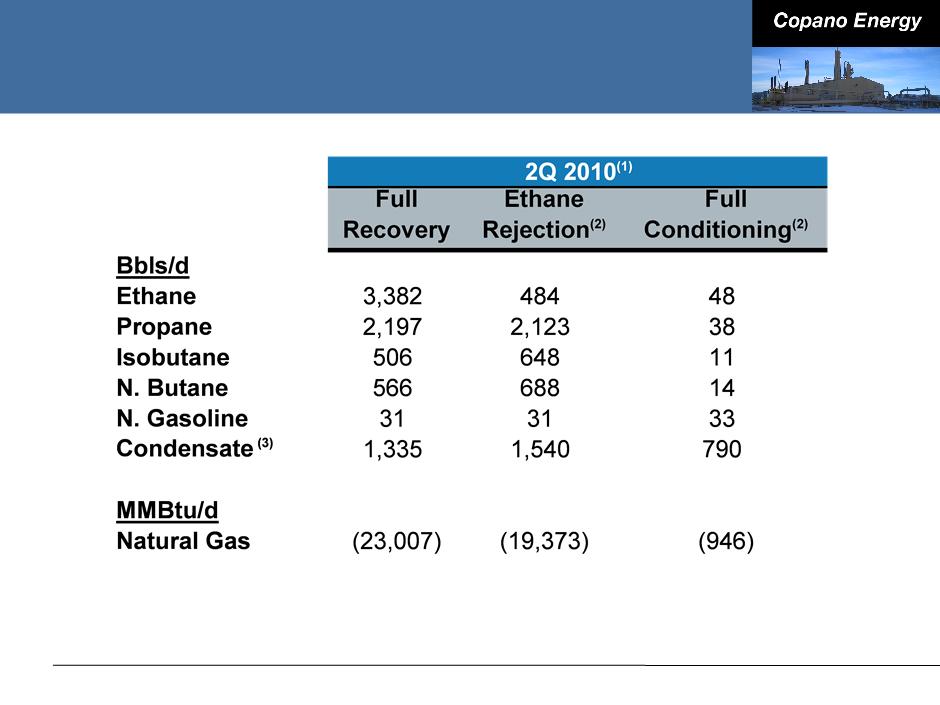
Texas Net Commodity Exposure
41
Note: See explanation of processing modes in this Appendix.
(1) Source: Copano Energy internal financial planning models for consolidated subsidiaries. Based on 2Q 2010 daily wellhead/plant inlet volumes.
(2) Fractionation at Houston Central processing plant permits significant reductions in ethane recoveries in ethane rejection mode and full ethane rejection in
conditioning mode. To optimize profitability, plant operations can also be adjusted to partial recovery mode.
conditioning mode. To optimize profitability, plant operations can also be adjusted to partial recovery mode.
(3) At the Houston Central processing plant, pentanes+ may be sold as condensate.
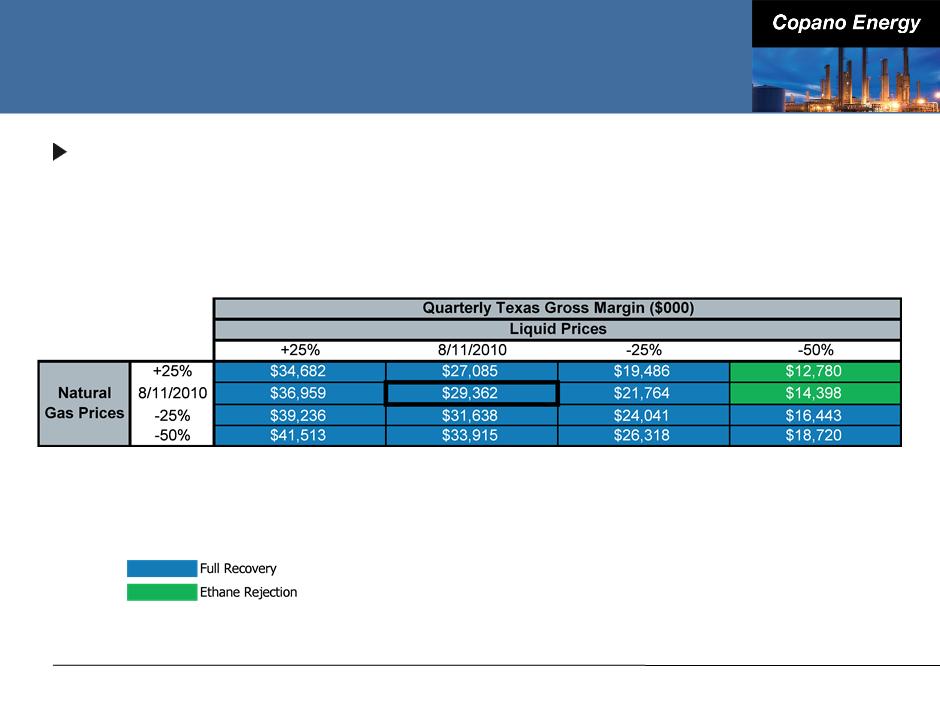
Texas Commodity Price Sensitivities
Texas segment gross margins excluding hedge settlements
■ Matrix reflects 2Q 2010 volumes and operating conditions, adjusted using
Copano’s 2010 planning model
Copano’s 2010 planning model
42
Note: Please see this Appendix for definitions of processing modes and additional details.
Rocky Mountains Sensitivities
2Q 2010 Adjusted EBITDA volume sensitivity (positive or negative
impact)
impact)
■ Bighorn: 10,000 MMBtu/d = $245,000(1)
■ Fort Union: 10,000 MMBtu/d = $70,000(1)
43
Note: See this Appendix for reconciliation of Adjusted EBITDA. Values reflect rounding.
(1) Impact on Adjusted EBITDA based on Copano’s interest in the unconsolidated affiliate.
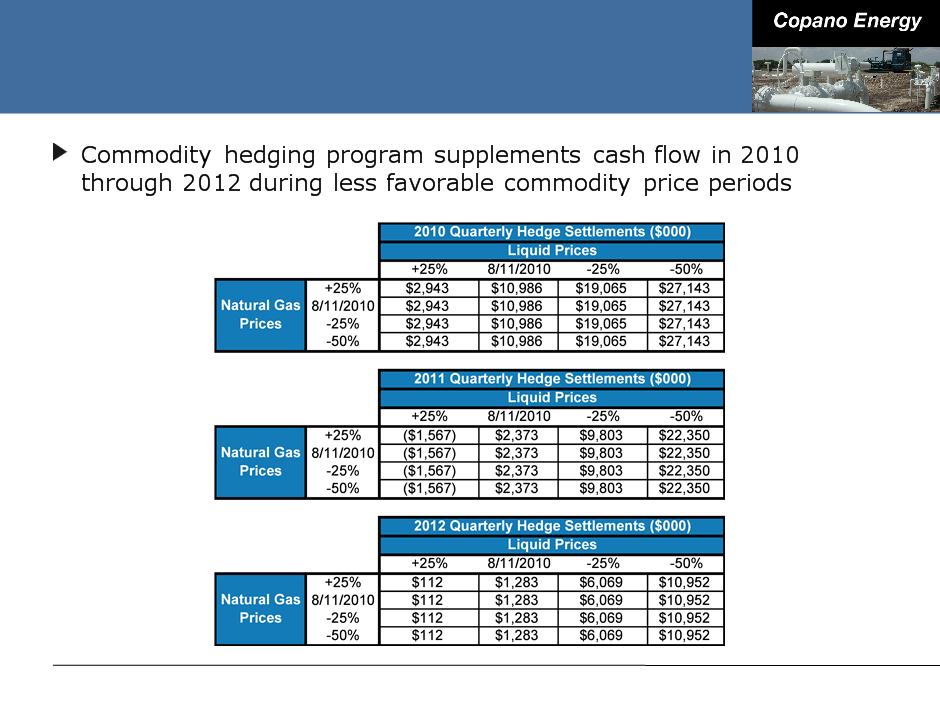
Hedging Impact of Commodity Price
Sensitivities
Sensitivities
44

Reconciliation of Non-GAAP Financial
Measures
Measures
Segment Gross Margin and Total Segment Gross Margin
We define segment gross margin, with respect to a Copano operating segment, as segment revenue less cost of sales. Cost of sales includes the
following: cost of natural gas and NGLs purchased from third parties, cost of natural gas and NGLs purchased from affiliates, cost of crude oil purchased
from third parties, costs paid to third parties to transport volumes and costs paid to affiliates to transport volumes. Total segment gross margin is the
sum of the operating segment gross margins and the results of Copano’s risk management activities that are included in Corporate and other. We view
total segment gross margin as an important performance measure of the core profitability of our operations. Segment gross margin allows Copano’s
senior management to compare volume and price performance of the segments and to more easily identify operational or other issues within a segment.
The GAAP measure most directly comparable to total segment gross margin is operating income.
45
Reconciliation of Non-GAAP Financial
Measures
Measures
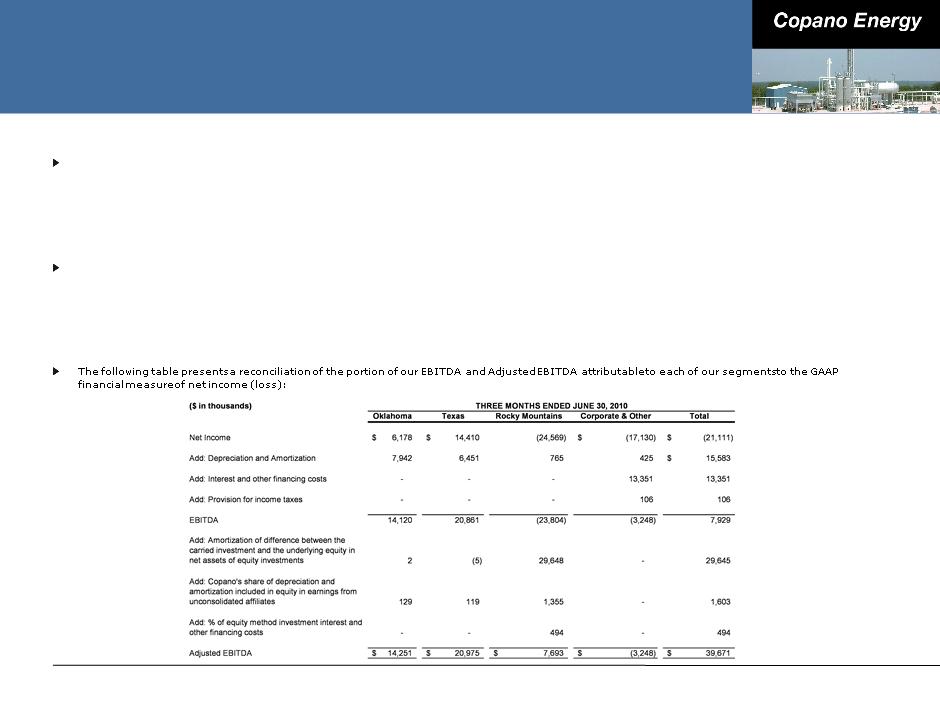
Adjusted EBITDA
We define EBITDA as net income (loss) plus interest expense, provision for income taxes and depreciation and amortization expense. Because a portion
of our net income (loss) is attributable to equity in earnings (loss) from our equity investees (which include Bighorn, Fort Union, Webb Duval and
Southern Dome), our management also calculates Adjusted EBITDA to reflect the depreciation and amortization expense embedded in equity in earnings
(loss) from unconsolidated affiliates. Specifically, our management determines Adjusted EBITDA by adding to EBITDA (i) the amortization expense
attributable to the difference between our carried investment in each unconsolidated affiliate and the underlying equity in its net assets, (ii) the portion
of each unconsolidated affiliate’s depreciation and amortization expense, which is proportional to our ownership interest in that unconsolidated affiliate
and (iii) the portion of each unconsolidated affiliate’s interest and other financing costs, which is proportional to our ownership interest in that
unconsolidated affiliate.
External users of our financial statements such as investors, commercial banks and research analysts use EBITDA or Adjusted EBITDA, and our
management uses Adjusted EBITDA, as a supplemental financial measure to assess:
management uses Adjusted EBITDA, as a supplemental financial measure to assess:
■ The financial performance of our assets without regard to financing methods, capital structure or historical cost basis;
■ The ability of our assets to generate cash sufficient to pay interest costs and support our indebtedness;
■ Our operating performance and return on capital as compared to those of other companies in the midstream energy sector, without regard to financing or capital
structure; and
structure; and
■ The viability of acquisitions and capital expenditure projects and the overall rates of return on alternative investment opportunities.
46

Definitions of Non-GAAP Financial Measures
Total Distributable Cash Flow
We define total distributable cash flow as net income plus: (i) depreciation, amortization and impairment expense
(including amortization expense relating to the option component of our risk management portfolio); (ii) cash
distributions received from investments in unconsolidated affiliates and equity losses from such unconsolidated affiliates;
(iii) provision for deferred income taxes; (iv) the subtraction of maintenance capital expenditures; (v) the subtraction of
equity in earnings from unconsolidated affiliates and (vi) the addition of losses or subtraction of gains relating to other
miscellaneous non-cash amounts affecting net income for the period, such as equity-based compensation, mark-to-
market changes in derivative instruments, and our line fill contributions to third-party pipelines and gas imbalances.
Maintenance capital expenditures are capital expenditures employed to replace partially or fully depreciated assets to
maintain the existing operating capacity of our assets and to extend their useful lives, or other capital expenditures that
are incurred in maintaining existing system volumes and related cash flows.
Total distributable cash flow is a significant performance metric used by senior management to compare basic cash flows
generated by us (prior to the establishment of any retained cash reserves by our Board of Directors) to the cash
distributions we expect to pay our unitholders, and it also correlates with the metrics of our existing debt covenants.
Using total distributable cash flow, management can quickly compute the coverage ratio of estimated cash flows to
planned cash distributions. Total distributable cash flow is also an important non-GAAP financial measure for our
unitholders because it serves as an indicator of our success in providing a cash return on investment — specifically,
whether or not we are generating cash flow at a level that can sustain or support an increase in our quarterly distribution
rates. Total distributable cash flow is also used by industry analysts with respect to publicly traded partnerships and
limited liability companies because the market value of such entities’ equity securities is significantly influenced by the
amount of cash they can distribute to unitholders.
47