Attached files
| file | filename |
|---|---|
| 8-K - 8-K - Rockwood Holdings, Inc. | a10-16468_18k.htm |
Exhibit 99.1
|
|
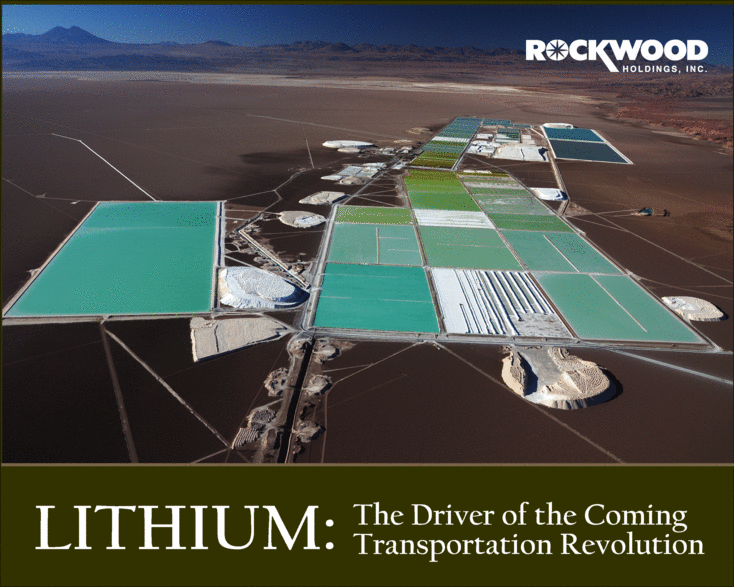
The Driver of the Coming Transportation Revolution LITHIUM: |
|
|
Forward Looking Statements This presentation may contain certain "forward-looking statements" within the meaning of the Private Securities Litigation Reform Act of 1995 concerning the business, operations and financial condition of Rockwood Holdings, Inc. and its subsidiaries (“Rockwood”). Although Rockwood believes the expectations reflected in such forward-looking statements are based upon reasonable assumptions, there can be no assurance that its expectations will be realized. "Forward-looking statements" consist of all non-historical information, including the statements referring to the prospects and future performance of Rockwood. Actual results could differ materially from those projected in Rockwood’s forward-looking statements due to numerous known and unknown risks and uncertainties, including, among other things, the "Risk Factors" described in Rockwood’s 2009 Form 10-K with the Securities and Exchange Commission. Rockwood does not undertake any obligation to publicly update any forward-looking statement to reflect events or circumstances after the date on which any such statement is made or to reflect the occurrence of unanticipated events. |

|
|
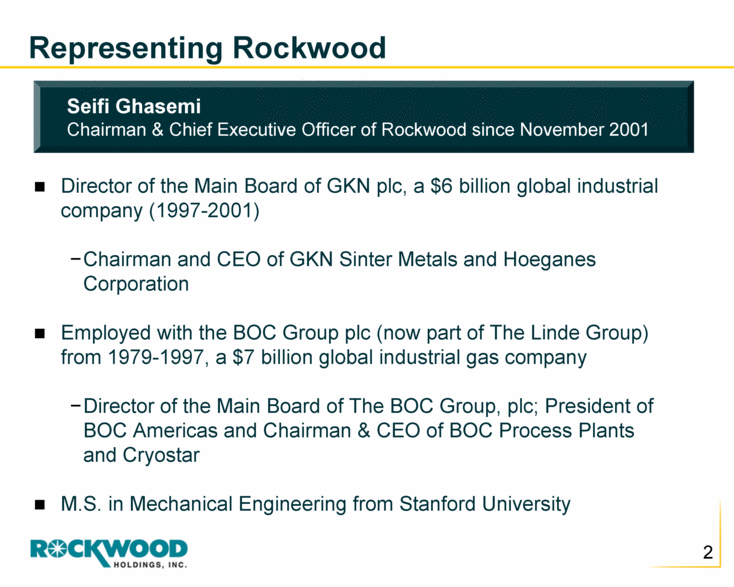
Representing Rockwood Director of the Main Board of GKN plc, a $6 billion global industrial company (1997-2001) Chairman and CEO of GKN Sinter Metals and Hoeganes Corporation Employed with the BOC Group plc (now part of The Linde Group) from 1979-1997, a $7 billion global industrial gas company Director of the Main Board of The BOC Group, plc; President of BOC Americas and Chairman & CEO of BOC Process Plants and Cryostar M.S. in Mechanical Engineering from Stanford University Seifi Ghasemi Chairman & Chief Executive Officer of Rockwood since November 2001 |
|
|
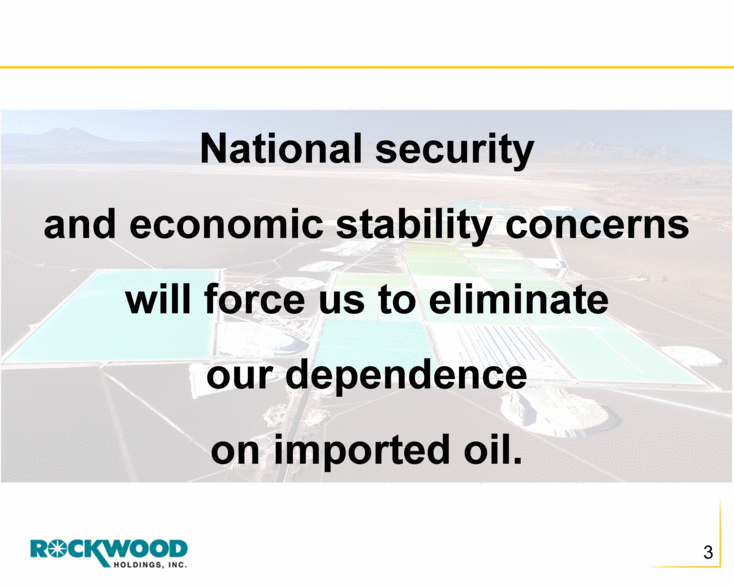
National security and economic stability concerns will force us to eliminate our dependence on imported oil. |
|
|
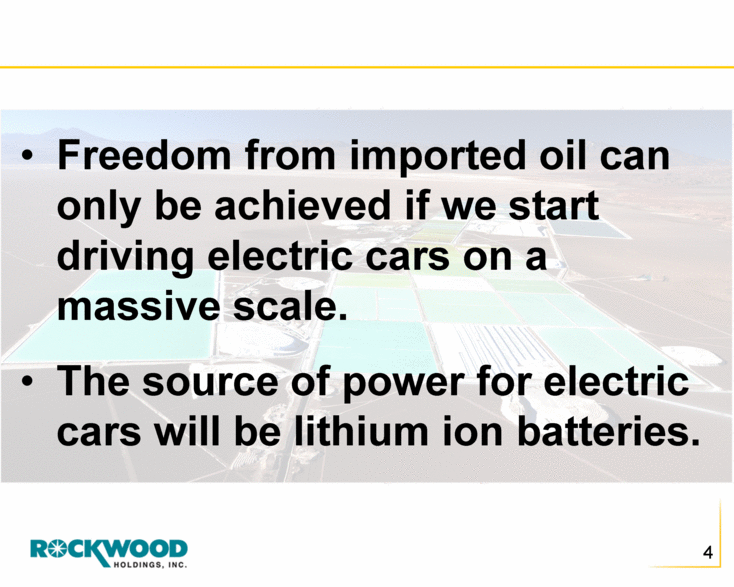
Freedom from imported oil can only be achieved if we start driving electric cars on a massive scale. The source of power for electric cars will be lithium ion batteries. |
|
|
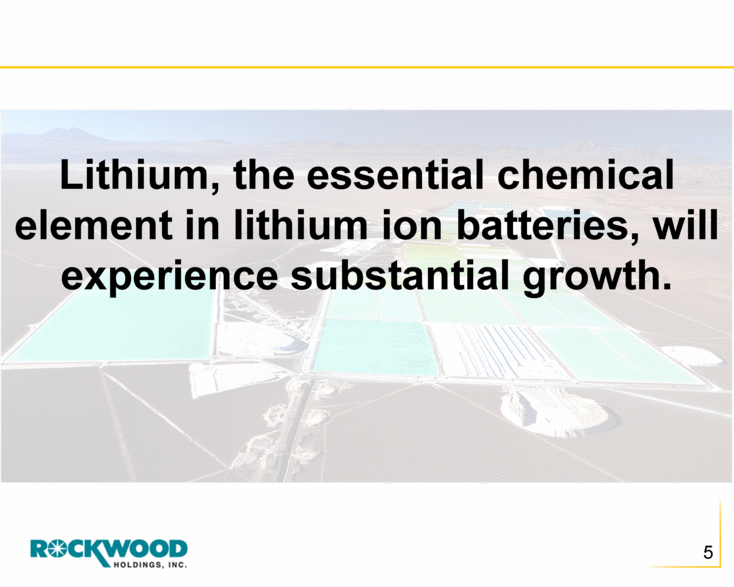
Lithium, the essential chemical element in lithium ion batteries, will experience substantial growth. |
|
|
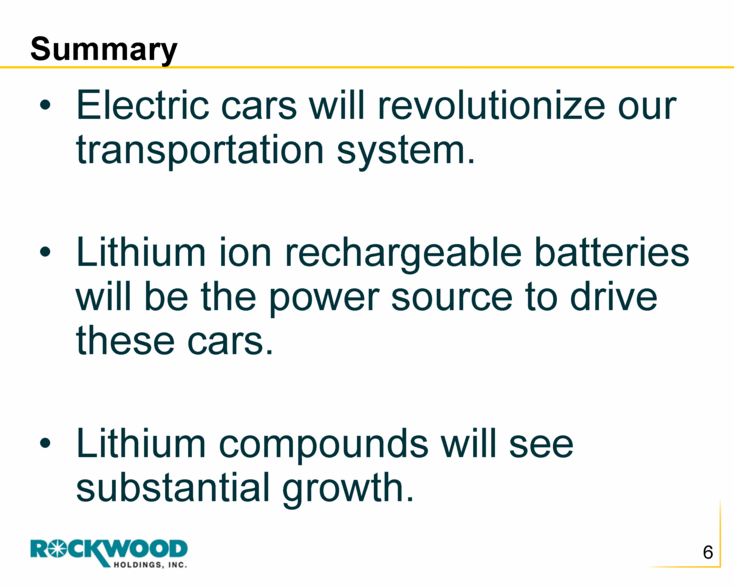
Electric cars will revolutionize our transportation system. Lithium ion rechargeable batteries will be the power source to drive these cars. Lithium compounds will see substantial growth. Summary |
|
|
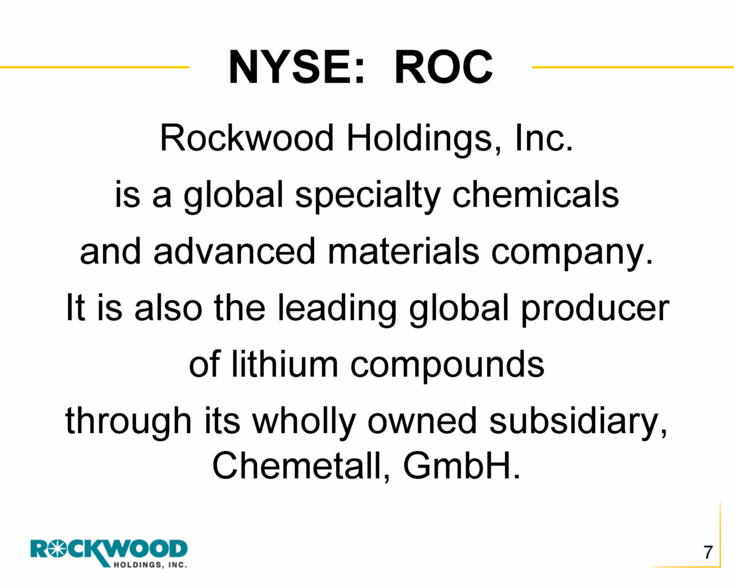
Rockwood Holdings, Inc. is a global specialty chemicals and advanced materials company. It is also the leading global producer of lithium compounds through its wholly owned subsidiary, Chemetall, GmbH. NYSE: ROC |
|
|
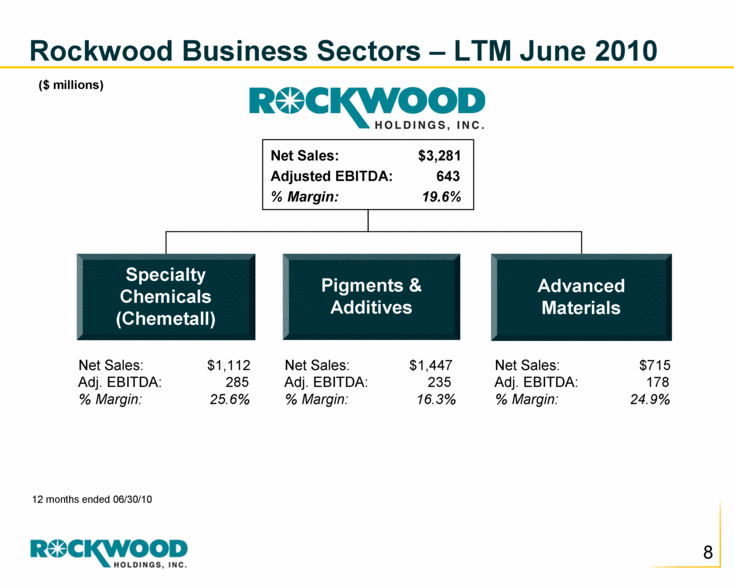
Rockwood Business Sectors – LTM June 2010 Advanced Materials Pigments & Additives Specialty Chemicals (Chemetall) Net Sales: $1,112 Adj. EBITDA: 285 % Margin: 25.6% Net Sales: $1,447 Adj. EBITDA: 235 % Margin: 16.3% Net Sales: $715 Adj. EBITDA: 178 % Margin: 24.9% Net Sales: $3,281 Adjusted EBITDA: 643 % Margin: 19.6% 12 months ended 06/30/10 ($ millions) |
|
|
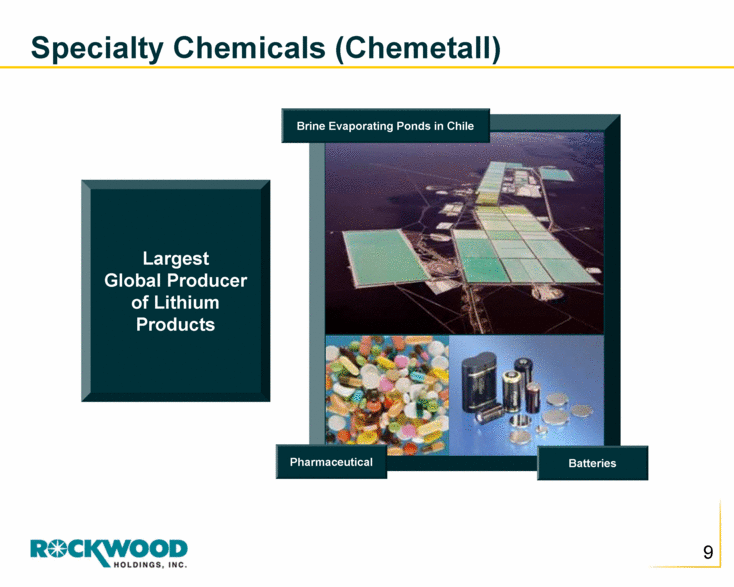
Largest Global Producer of Lithium Products Pharmaceutical Batteries Specialty Chemicals (Chemetall) Brine Evaporating Ponds in Chile |
|
|
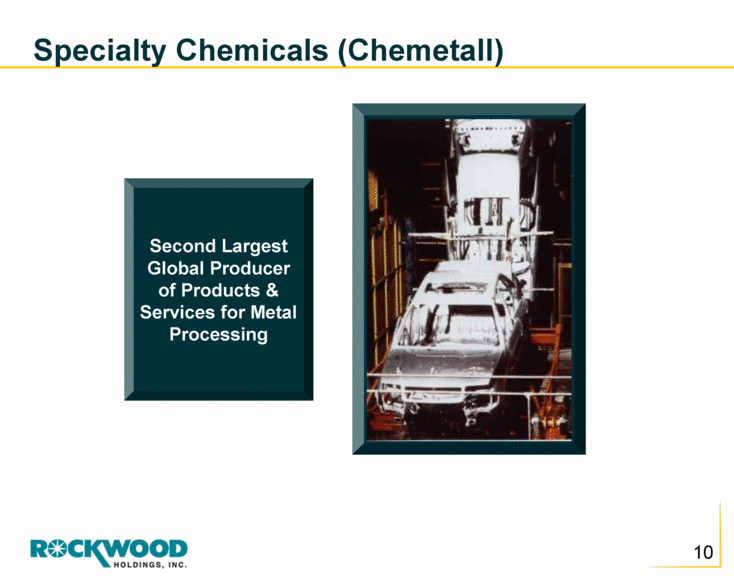
Second Largest Global Producer of Products & Services for Metal Processing Specialty Chemicals (Chemetall) |
|
|
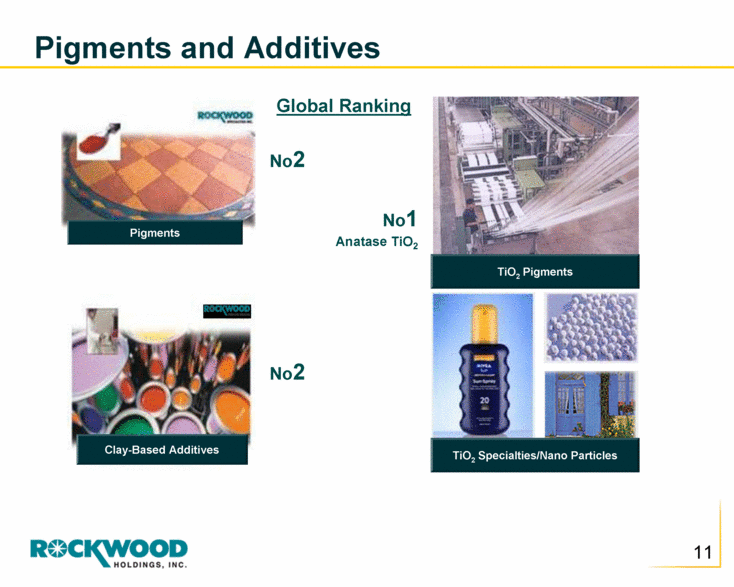
Pigments and Additives TiO2 Specialties/Nano Particles TiO2 Pigments Pigments Clay-Based Additives Global Ranking No2 No1 Anatase TiO2 No2 |
|
|
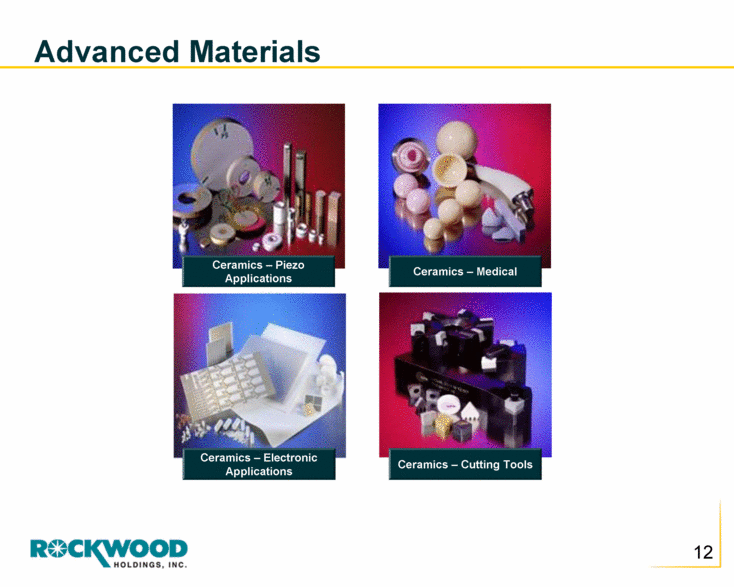
Ceramics – Piezo Applications Ceramics – Electronic Applications Ceramics – Cutting Tools Ceramics – Medical Advanced Materials |
|
|
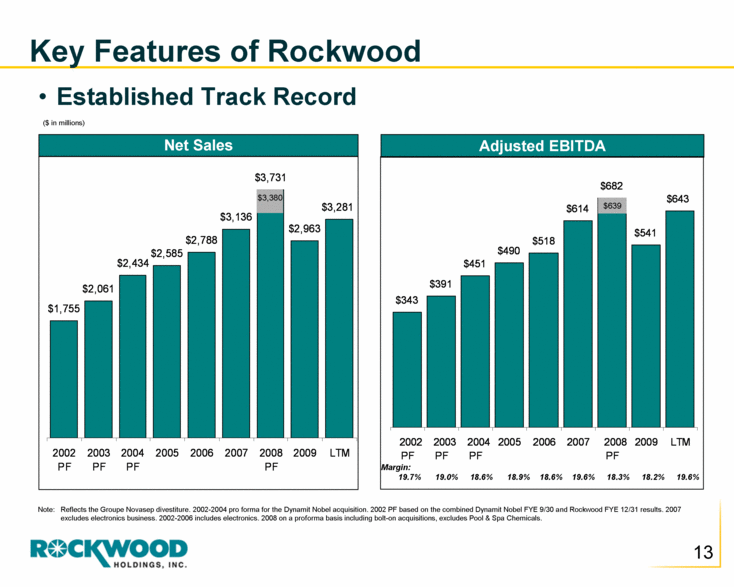
Key Features of Rockwood Established Track Record Note: Reflects the Groupe Novasep divestiture. 2002-2004 pro forma for the Dynamit Nobel acquisition. 2002 PF based on the combined Dynamit Nobel FYE 9/30 and Rockwood FYE 12/31 results. 2007 excludes electronics business. 2002-2006 includes electronics. 2008 on a proforma basis including bolt-on acquisitions, excludes Pool & Spa Chemicals. ($ in millions) Net Sales Adjusted EBITDA Margin: 19.7% 19.0% 18.6% 18.9% 18.6% 19.6% 18.3% 18.2% 19.6% $3,380 $639 $1,755 $2,061 $2,434 $2,585 $2,788 $3,136 $3,731 $2,963 $3,281 2002 PF 2003 PF 2004 PF 2005 2006 2007 2008 PF 2009 LTM $343 $391 $451 $490 $518 $614 $682 $541 $643 2002 PF 2003 PF 2004 PF 2005 2006 2007 2008 PF 2009 LTM |
|
|
Lithium |
|
|
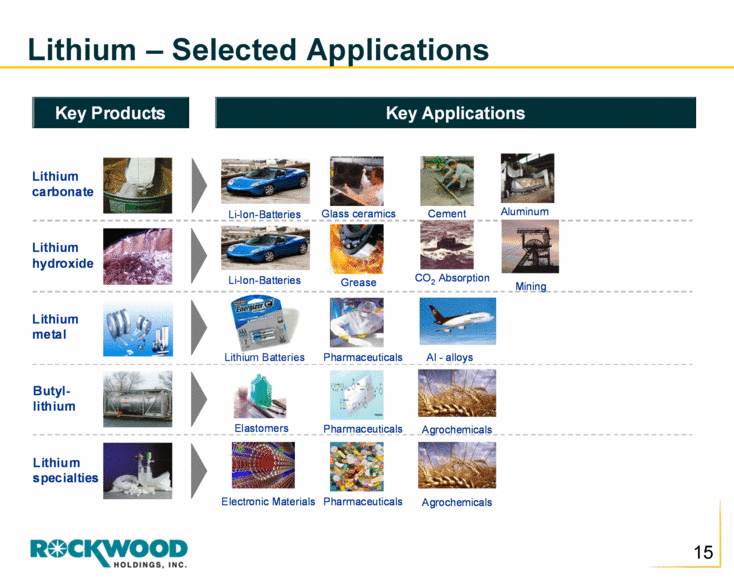
Lithium – Selected Applications Lithium carbonate Butyl - lithium Lithium metal Lithium hydroxide Lithium specialties Pharmaceuticals Pharmaceuticals Pharmaceuticals Glass ceramics Grease CO2 Absorption Elastomers Aluminum Lithium Batteries Electronic Materials Cement Al - alloys Mining Agrochemicals Agrochemicals Li - Ion - Batteries Li - Ion - Batteries Key Products Key Applications |
|
|
Significant growth of lithium ion batteries for cell phones, laptop computers and other mobile communication devices, Penetration of lithium ion batteries for mobile power tools (drills, etc.), Pharmaceutical applications, and Alloys in aerospace structures. Lithium Growth + 10% CAGR in Last 10 Years |
|
|
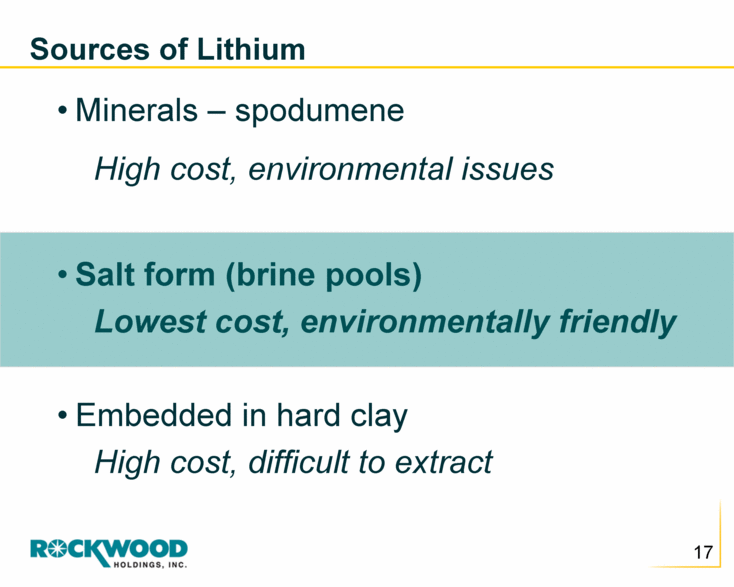
Minerals – spodumene High cost, environmental issues Salt form (brine pools) Lowest cost, environmentally friendly Embedded in hard clay High cost, difficult to extract Sources of Lithium |
|
|
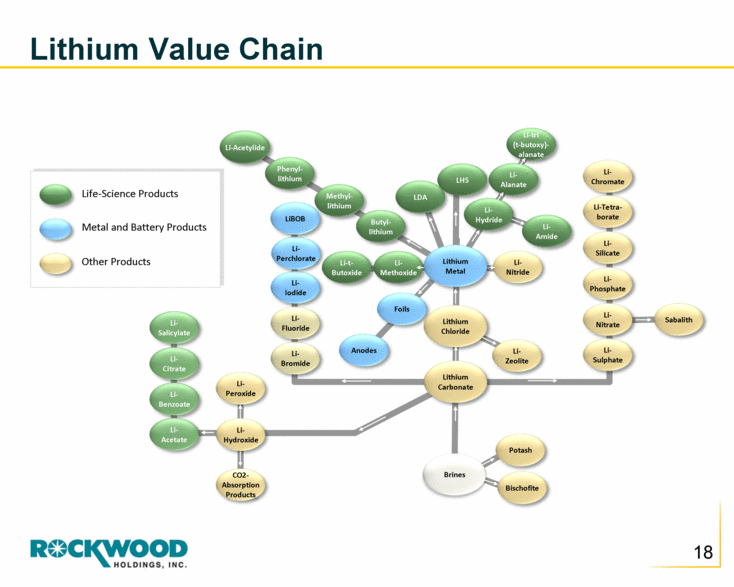
Li-Acetylide Methyl- lithium Phenyl- lithium LDA LHS Li-t- Butoxide Li- Methoxide Li- Hydride Li-tri (t-butoxy)- alanate Li- Amide Li- Salicylate Li- Citrate Li- Benzoate Li- Acetate Li- Zeolite Potash Bischofite Li- Sulphate Li- Nitrate Li- Phosphate Li- Silicate Li-Tetra- borate Li- Chromate Sabalith Li- Nitride Li- Bromide Li- Fluoride Li- Peroxide Li- Hydroxide CO2- Absorption Products Li- Iodide Li- Perchlorate LiBOB Anodes Foils Lithium Carbonate Lithium Chloride Brines Butyl- lithium Li- Alanate Lithium Metal Life-Science Products Metal and Battery Products Other Products Lithium Value Chain |
|
|
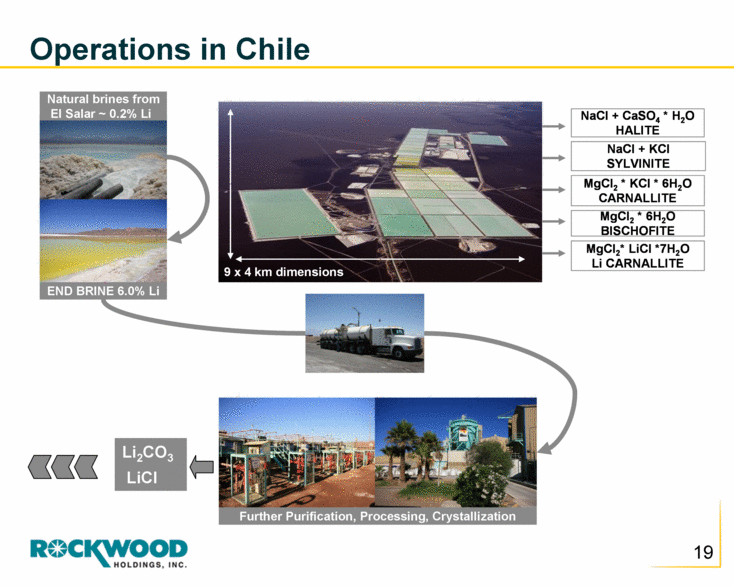
Operations in Chile NaCl + CaSO 4 * H 2 O HALITE NaCl + KCl SYLVINITE MgCl 2 * KCl * 6H 2 O CARNALLITE MgCl 2 * 6H 2 O BISCHOFITE MgCl 2 * LiCl *7H 2 O Li CARNALLITE Natural brines from El Salar ~ 0.2% Li END BRINE 6.0% Li Further Purification, Processing, Crystallization Li 2 CO 3 LiCl 9 x 4 km dimensions |
|
|
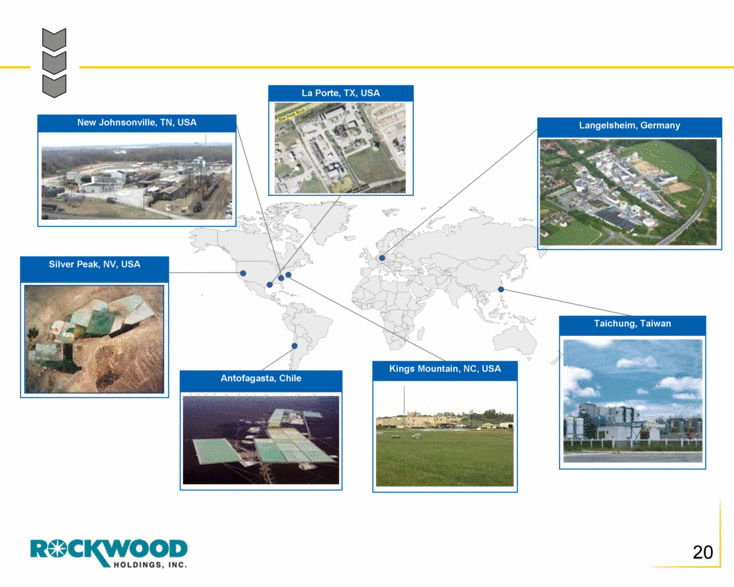
New Johnsonville, TN, USA Silver Peak, NV, USA Taichung, Taiwan Antofagasta, Chile Kings Mountain, NC, USA Langelsheim, Germany La Porte, TX, USA |
|
|
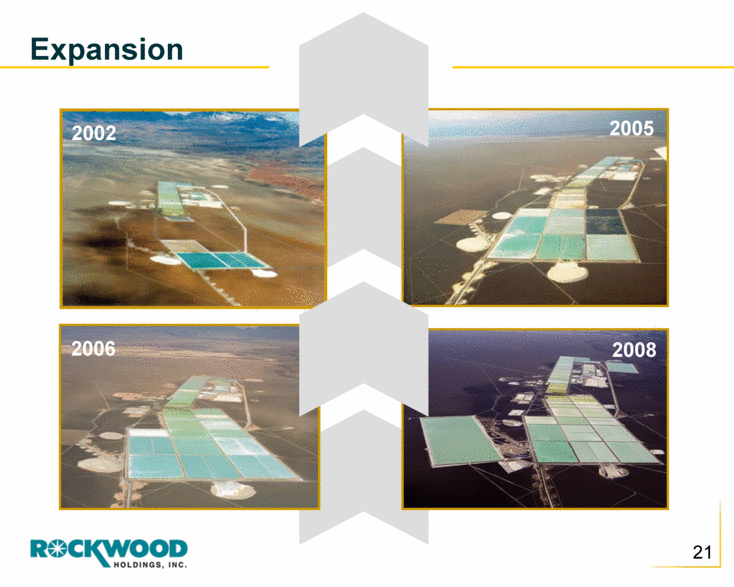
2002 2005 2006 2008 Expansion |
|
|
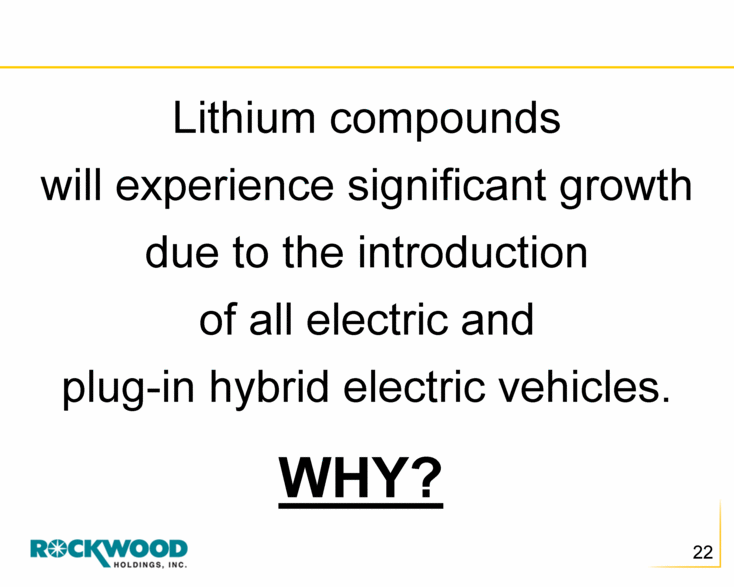
Lithium compounds will experience significant growth due to the introduction of all electric and plug-in hybrid electric vehicles. WHY? |
|
|
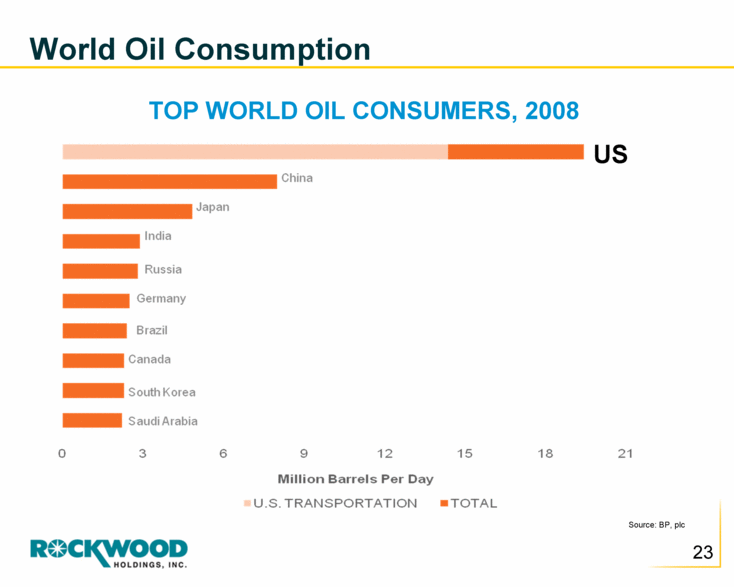
TOP WORLD OIL CONSUMERS, 2008 World Oil Consumption Source: BP, plc US |
|
|
The United States of America depends heavily on imported oil from hostile regions of the world. 50% of our oil use is imported. |
|
|
These hostile states, insurgents and terrorists will use oil as a strategic weapon against the United States. |
|
|
This dangerous dependence on imported oil has created significant issues of: National Security Economic Stability |
|
|
Dependence on imported oil, mostly from hostile regions, has constrained the totality of US foreign policy. To ensure free flow of oil, the US military has to maintain a presence in these hostile regions, at a huge cost in treasure and blood. Total cost of US military presence in these regions is estimated to be $5.0 trillion since the 1970’s. Issues of National Security |
|
|
The cost of imported oil is more than $400 billion a year which is enriching the sovereign funds of mostly hostile regimes. This is more than half of the total US trade deficit. Issue of Economic Security |
|
|
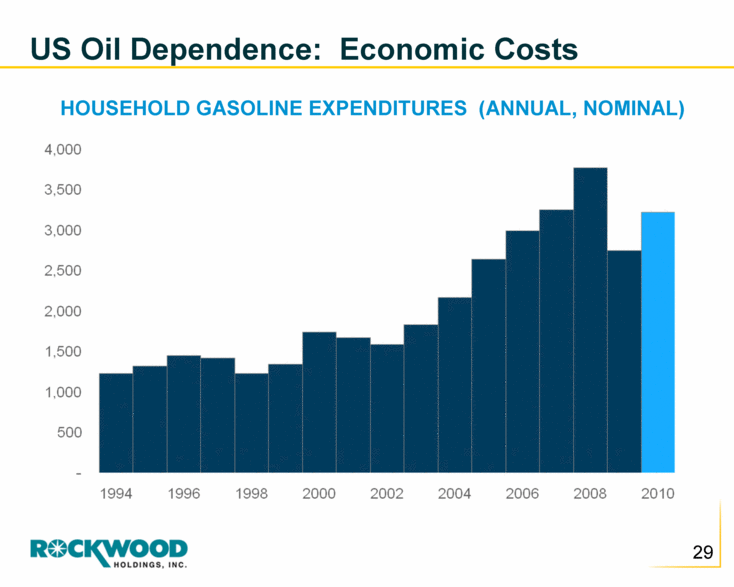
HOUSEHOLD GASOLINE EXPENDITURES (ANNUAL, NOMINAL) US Oil Dependence: Economic Costs |
|
|
70% of oil consumed in the US is to fuel our transportation system (the internal combustion engine). Renewable sources of energy, such as solar, wind or nuclear will not free us from imported oil. Oil Dependence |
|
|
As long as our cars are powered by the internal combustion engine, we will be dependent on imported oil. The Problem: Oil Dependence |
|
|
The only practical and proven solution is to replace the internal combustion engine with an electric motor driven by a rechargeable battery. The Solution: Electric Cars |
|
|
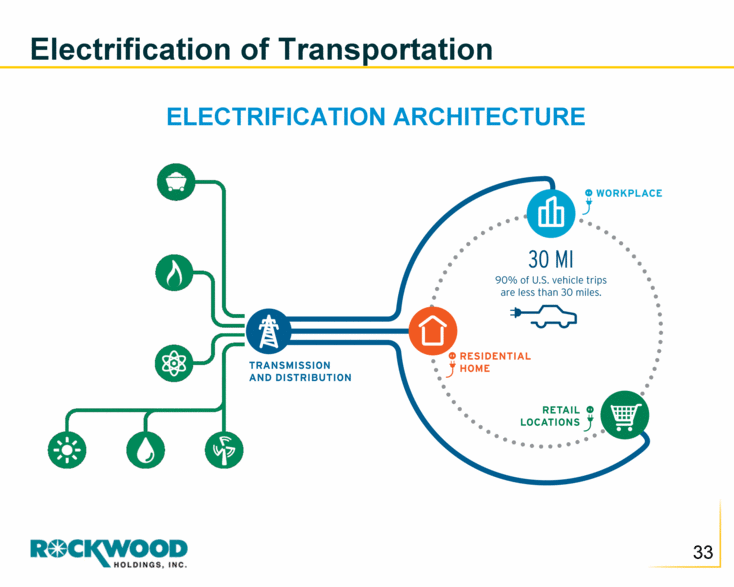
Electrification of Transportation ELECTRIFICATION ARCHITECTURE |
|
|
1. Electricity is diverse and domestic. Benefits of Electric Cars |
|
|
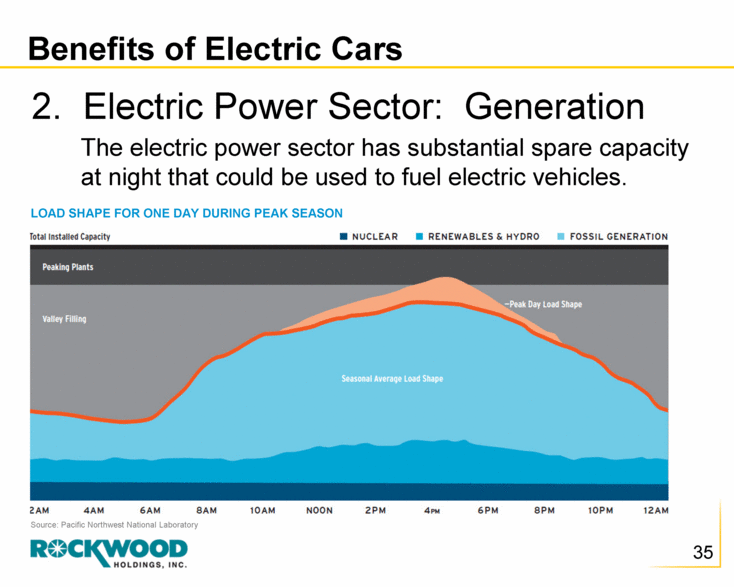
2. Electric Power Sector: Generation Benefits of Electric Cars Source: Pacific Northwest National Laboratory LOAD SHAPE FOR ONE DAY DURING PEAK SEASON The electric power sector has substantial spare capacity at night that could be used to fuel electric vehicles. |
|
|
3. The network of infrastructure already exists. Benefits of Electric Cars |
|
|
4. Electric miles are cheaper than gasoline miles: 2.5¢ vs 10¢ per mile. Benefits of Electric Cars |
|
|
5. Electric miles are cleaner than gasoline. Benefits of Electric Cars |
|
|
Key Enabling Technology – Li-ion Batteries: |
|
|
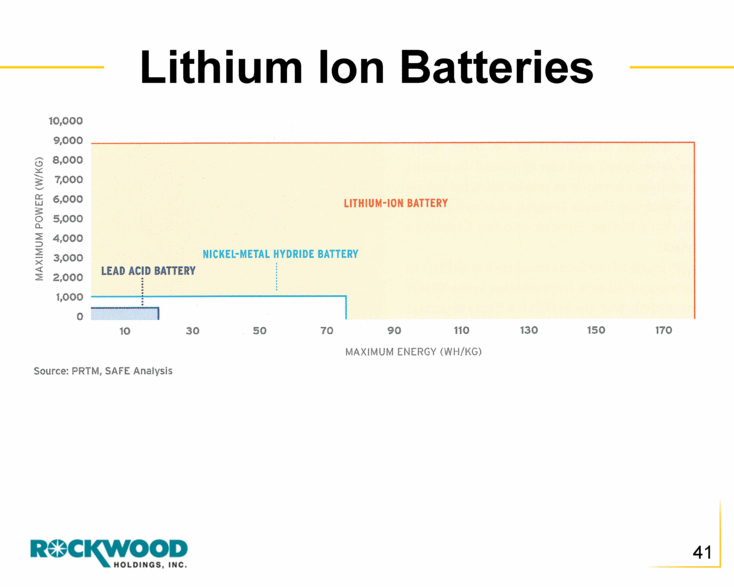
Lithium ion batteries for mobile phones, laptops, portable electronics and power tools are fully developed and commercialized. This is Proven Technology |
|
|
Lithium Ion Batteries |
|
|
What is the Potential for Growth? |
|
|
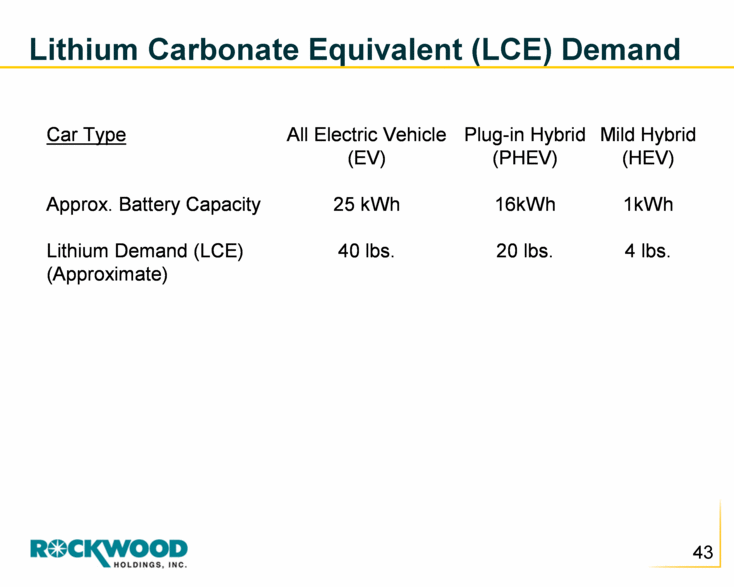
Lithium Carbonate Equivalent (LCE) Demand Car Type All Electric Vehicle Plug-in Hybrid Mild Hybrid (EV) (PHEV) (HEV) Approx. Battery Capacity 25 kWh 16kWh 1kWh Lithium Demand (LCE) 40 lbs. 20 lbs. 4 lbs. (Approximate) |
|
|
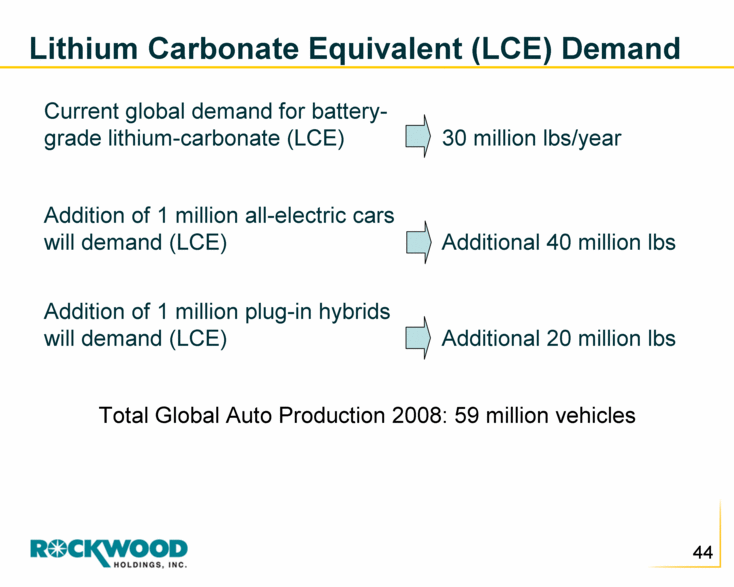
Lithium Carbonate Equivalent (LCE) Demand Additional 20 million lbs Addition of 1 million plug-in hybrids will demand (LCE) Additional 40 million lbs Addition of 1 million all-electric cars will demand (LCE) 30 million lbs/year Current global demand for battery-grade lithium-carbonate (LCE) Total Global Auto Production 2008: 59 million vehicles |
|
|
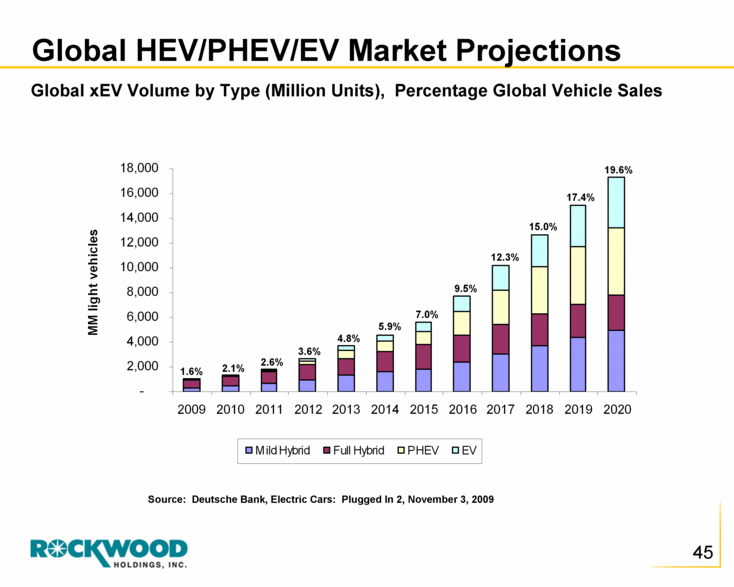
Global HEV/PHEV/EV Market Projections 1.6% 2.1% 2.6% 3.6% 4.8% 5.9% 7.0% 9.5% 12.3% 15.0% 17.4% 19.6% Global xEV Volume by Type (Million Units), Percentage Global Vehicle Sales Source: Deutsche Bank, Electric Cars: Plugged In 2, November 3, 2009 - 2,000 4,000 6,000 8,000 10,000 12,000 14,000 16,000 18,000 2009 2010 2011 2012 2013 2014 2015 2016 2017 2018 2019 2020 MM light vehicles Mild Hybrid Full Hybrid PHEV EV |
|
|
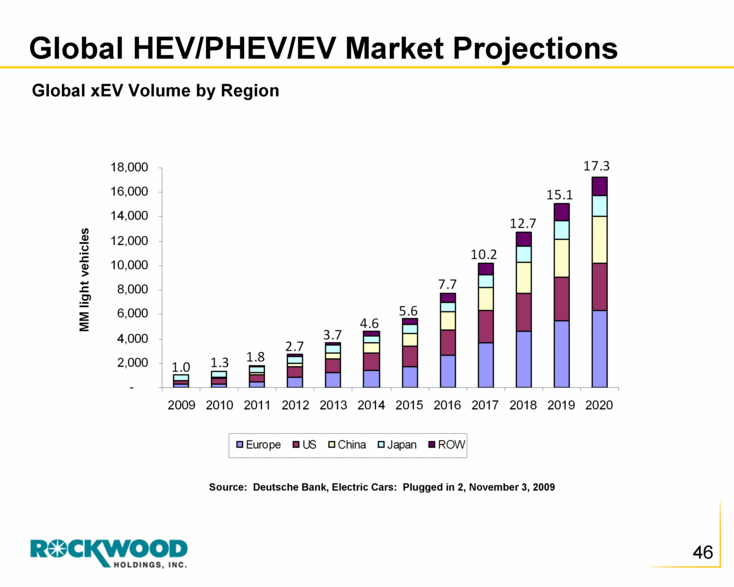
Global HEV/PHEV/EV Market Projections Global xEV Volume by Region Source: Deutsche Bank, Electric Cars: Plugged in 2, November 3, 2009 - 2,000 4,000 6,000 8,000 10,000 12,000 14,000 16,000 18,000 2009 2010 2011 2012 2013 2014 2015 2016 2017 2018 2019 2020 MM light vehicles Europe US China Japan ROW 1.0 1.8 1.3 2.7 3.7 4.6 5.6 7.7 10.2 12.7 15.1 17.3 |
|
|
Depending on your assumptions of the penetration of all electric and hybrid electric cars in the coming years, the growth in demand for lithium can be substantially higher than the historical growth rate of 10% per year. Lithium Demand |
|
|
electrificationcoalition.org |
|
|
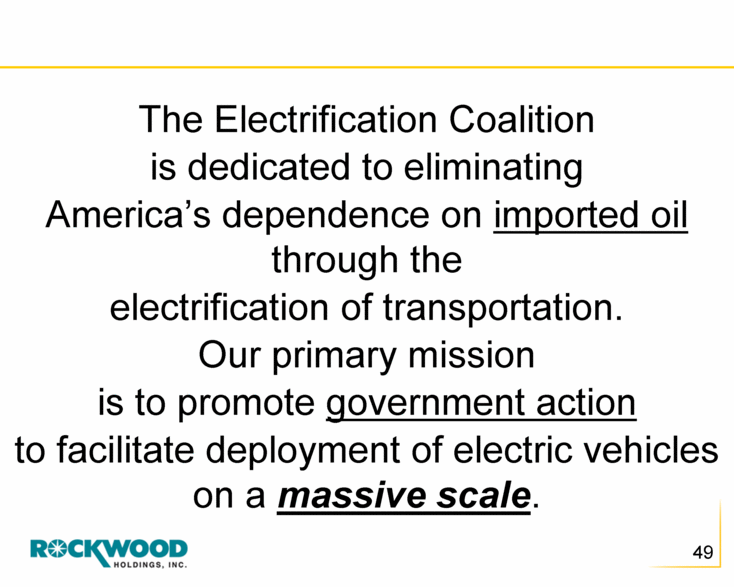
The Electrification Coalition is dedicated to eliminating America’s dependence on imported oil through the electrification of transportation. Our primary mission is to promote government action to facilitate deployment of electric vehicles on a massive scale. |
|
|
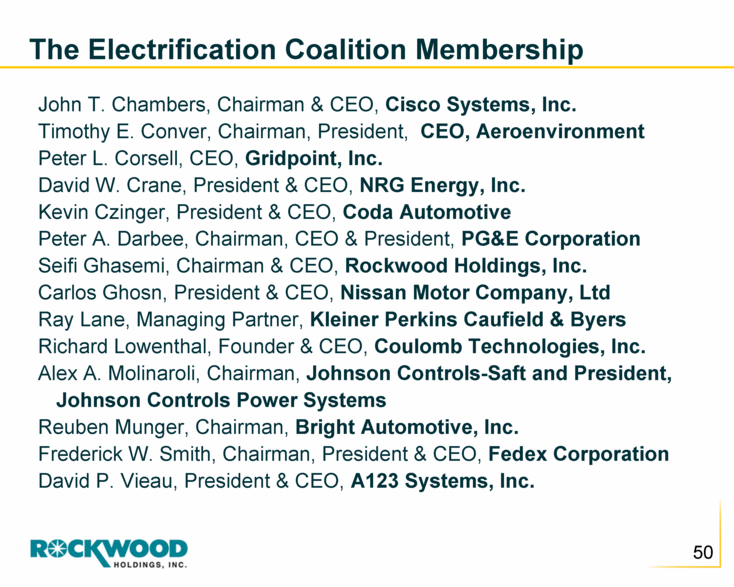
The Electrification Coalition Membership John T. Chambers, Chairman & CEO, Cisco Systems, Inc. Timothy E. Conver, Chairman, President, CEO, Aeroenvironment Peter L. Corsell, CEO, Gridpoint, Inc. David W. Crane, President & CEO, NRG Energy, Inc. Kevin Czinger, President & CEO, Coda Automotive Peter A. Darbee, Chairman, CEO & President, PG&E Corporation Seifi Ghasemi, Chairman & CEO, Rockwood Holdings, Inc. Carlos Ghosn, President & CEO, Nissan Motor Company, Ltd Ray Lane, Managing Partner, Kleiner Perkins Caufield & Byers Richard Lowenthal, Founder & CEO, Coulomb Technologies, Inc. Alex A. Molinaroli, Chairman, Johnson Controls-Saft and President, Johnson Controls Power Systems Reuben Munger, Chairman, Bright Automotive, Inc. Frederick W. Smith, Chairman, President & CEO, Fedex Corporation David P. Vieau, President & CEO, A123 Systems, Inc. |
|
|
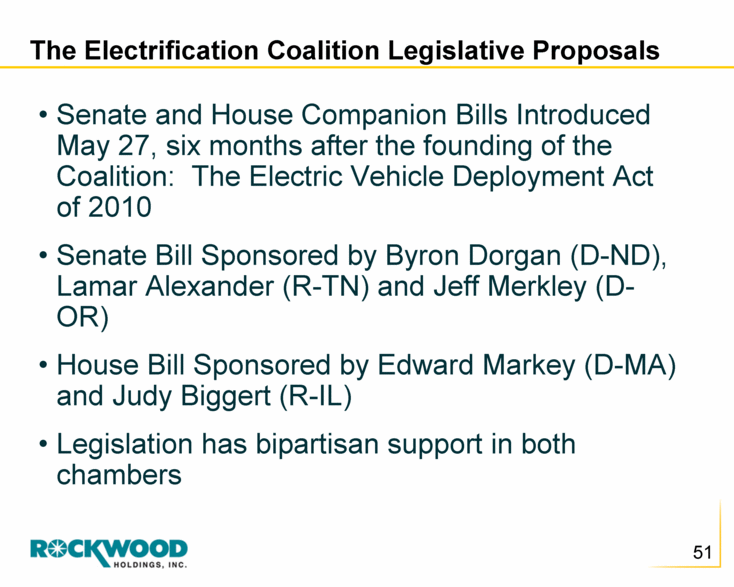
The Electrification Coalition Legislative Proposals Senate and House Companion Bills Introduced May 27, six months after the founding of the Coalition: The Electric Vehicle Deployment Act of 2010 Senate Bill Sponsored by Byron Dorgan (D-ND), Lamar Alexander (R-TN) and Jeff Merkley (D-OR) House Bill Sponsored by Edward Markey (D-MA) and Judy Biggert (R-IL) Legislation has bipartisan support in both chambers |
|
|
Electric cars will revolutionize our transportation system. Lithium ion rechargeable batteries will be the power source to drive these cars. Lithium compounds will see substantial growth. Summary |

|
|
The Driver of the Coming Transportation Revolution LITHIUM: |