Attached files
| file | filename |
|---|---|
| EX-99.1 - EXHIBIT99-1 - DYCOM INDUSTRIES INC | exhibit99-1.htm |
| EX-99.3 - EXHIBIT99-3 - DYCOM INDUSTRIES INC | exhibit99-3.htm |
| 8-K - FORM8-K - DYCOM INDUSTRIES INC | form8-k.htm |
Exhibit
99-2

4th Quarter
Presentation
August
25, 2010

1
Participants
|
Steven E.
Nielsen
President & Chief Executive Officer H. Andrew
DeFerrari
Chief Financial Officer Richard B.
Vilsoet
General Counsel |

2
Forward-Looking
Statements and Non-
GAAP Information
GAAP Information
Forward-Looking
Statements and Non-
GAAP Information
GAAP Information
Fiscal
2010 fourth quarter and annual results are preliminary and unaudited.
This
presentation contains forward-looking statements within the meaning of the Private
Securities Litigation Reform Act of 1995, including statements with respect to the
Company’s fiscal 2011 first quarter results. The words “believe,” “expect,” “anticipate,”
“estimate,” “intend,” “forecast,” “may,” “should”, “could”, “project,” “outlook” and similar
expressions, including statements regarding backlog, identify forward-looking statements.
These forward-looking statements are based on management’s current expectations,
estimates and projections and speak only as of the date of this presentation. Forward-
looking statements are subject to known and unknown risks and uncertainties that may
cause actual results in the future to differ materially from the results projected or implied in
any forward-looking statements contained in this presentation. The factors that could affect
future results and could cause these results to differ materially from those expressed in the
forward-looking statements include, but are not limited to, those described under Item 1A,
“Risk Factors” of the Company’s Annual Report on Form 10-K for the year ended July 25,
2009, and other risks outlined in the Company’s periodic filings with the Securities and
Exchange Commission (“SEC”). Except as required by law, the Company may not update
forward-looking statements even though its situation may change in the future.
This
presentation includes certain “Non-GAAP” financial measures as defined by
SEC
rules. As required by the SEC we have provided a reconciliation of those measures to the
most directly comparable GAAP measures on the Regulation G slides included at slides 10
through12 of this presentation.
rules. As required by the SEC we have provided a reconciliation of those measures to the
most directly comparable GAAP measures on the Regulation G slides included at slides 10
through12 of this presentation.

3
Q4-2010
Overview
n Contract revenue of
$281.5 million in Q4-10 increased
12.9% sequentially from Q3-10, excluding the incremental
week required by our 52/53 week fiscal calendar (see slide
10 for a reconciliation)
12.9% sequentially from Q3-10, excluding the incremental
week required by our 52/53 week fiscal calendar (see slide
10 for a reconciliation)
n Revenue trends
continue to improve
n Q4-10 results of
$0.12 per
share
n Strong liquidity at
July 31, 2010
n New five-year $225
million revolving Credit Agreement
entered into during the quarter
entered into during the quarter
Note: See
“Regulation G Disclosure” slide 10 for a reconciliation of GAAP to Non-GAAP
financial measures.

4
Revenue
Summary
n Top 5 customers
represented 62.1% of
revenue in Q4-10 and 63.7% of
revenue in Q4-09
revenue in Q4-10 and 63.7% of
revenue in Q4-09
n Contract revenue
declined in Top 5
customers by 5.5% and increased at all
other customers 1.2%, after excluding
the incremental week in Q4-10
customers by 5.5% and increased at all
other customers 1.2%, after excluding
the incremental week in Q4-10
n Organic revenue
trends which
improved in total
improved in total
n Excluding Verizon,
all other customers
combined grew 5.8% in Q4-10, after
excluding the incremental week in Q4-10
combined grew 5.8% in Q4-10, after
excluding the incremental week in Q4-10
*
For comparison purposes, CenturyLink includes combined revenues from CenturyTel,
Inc. and Embarq Corporation for each period presented.
Note: See
“Regulation G Disclosure” slides 10 and 11 for a reconciliation of GAAP to
Non-GAAP financial measures.
** Organic
revenue change excludes revenue from storm restoration work in Q3-09, Q2-09 and
Q1-09 and excludes the impact of an additional week in Q4-10 to adjust for our
52/53
week fiscal calendar.
week fiscal calendar.

5
Backlog
and Employees
Current
Awards and Extensions
|
Customers
|
Area
|
Description
|
Approximate
Term
(in years) |
|
nAT&T
|
North
Carolina, Tennessee
|
Construction
and maintenance services
|
3
|
|
nComcast
|
Washington,
Oregon, California,
.Georgia, New Jersey, .Pennsylvania, Delaware |
Installation
services
|
3
|
|
nAT&T
|
Georgia
|
Utility line
locating
|
3
|
|
nComcast
|
Connecticut
|
Network
Upgrade
|
1
|
|
nVarious
|
Kentucky,
South Carolina
|
Rural fiber
deployment
|
1
|

6
Summary
Results
|
Fully Diluted
EPS
|
|
|
Q4-09
|
Q4-10
|
|
$0.17
|
$0.12
|
(a)
Q4-10 includes an incremental week as the result of our 52/53 week fiscal
year.
(a)

7
Selected
Financial Information
n Year-over-year
organic revenue decline
of 3.1%, after excluding the additional
week in Q4-10 required by our 52/53
week fiscal calendar (a)
of 3.1%, after excluding the additional
week in Q4-10 required by our 52/53
week fiscal calendar (a)
n Cost of earned
revenues as a
percentage of revenue impacted by
higher costs for labor and materials and
increased prices of gasoline
percentage of revenue impacted by
higher costs for labor and materials and
increased prices of gasoline
n G&A unchanged as
a percentage of
contract revenues
contract revenues
n Depreciation,
amortization, and interest
expense up slightly as a percentage of
contract revenues
expense up slightly as a percentage of
contract revenues
n Other income, net
increased from more
assets being sold with favorable prices
received
assets being sold with favorable prices
received
n Effective tax rate
at 42.5% for the
quarter and 45.5% for the full year
quarter and 45.5% for the full year
(a) See “Regulation G
Disclosure” slide 10 for a reconciliation of GAAP to Non-GAAP financial
measures.
(b) Amounts may not foot
due to rounding.

8
Cash
Flow and Liquidity
n Cash flows impacted
by increased
operations during the quarter
operations during the quarter
n Combined days sales
outstanding on
trade receivables and net unbilled
revenues were 61 days in Q4-10 and
62 days in Q4-09 (a)
trade receivables and net unbilled
revenues were 61 days in Q4-10 and
62 days in Q4-09 (a)
n Capital
expenditures, net of disposals
at $15.0 million
at $15.0 million
n Debt less cash was
approximately $32
million at the end of Q4-10
million at the end of Q4-10
n New five-year $225
million revolving
Credit Agreement
Credit Agreement
n In compliance with
debt covenants as
of July 31, 2010
of July 31, 2010
(a)
Days sales outstanding is calculated as the summation of current accounts
receivable, plus costs and
estimated earnings in excess of billings, less billings in excess of costs and estimated earnings, divided by
average revenue per day during the respective quarter.
estimated earnings in excess of billings, less billings in excess of costs and estimated earnings, divided by
average revenue per day during the respective quarter.

9
Summary
n Economic environment
slow
n Solid customer
relationships
n Market share growing
as customers consolidate vendors
n At the forefront of
evolving industry opportunities including those generated by rural
broadband stimulus funding
broadband stimulus funding
n Encouraged by
deployment of new technologies to consumers and businesses by
cable operators
cable operators
n Responding to an
increasing number of industry participants for wireless backhaul
services
services
n Looking ahead to the
first quarter of fiscal 2011 we expect:
} Revenues that are
down slightly year-over-year
} Margins which
improve sequentially
10
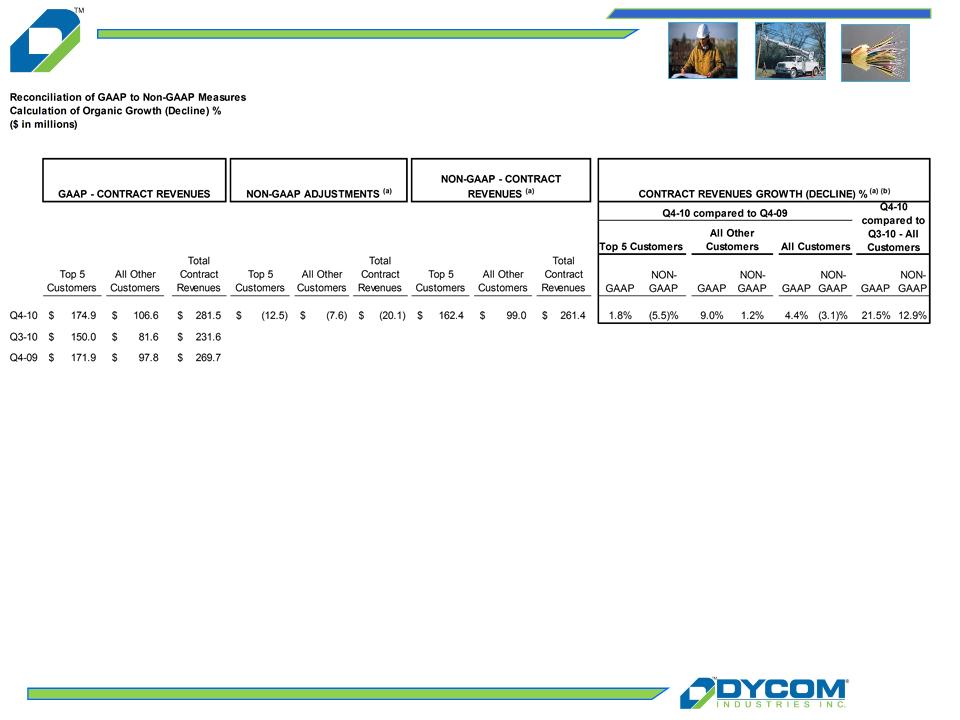
Appendix:
Regulation G Disclosure
Amounts
may not foot due to rounding.
(a) Non-GAAP
adjustments in Q4-10 result from the Company’s 52/53 week fiscal year. The
Q4-10 Non-GAAP adjustments reflect the
impact of the additional week in Q4-10 and are calculated by dividing contract revenues by 14 weeks. The result, representing one week
of contract revenues, is subtracted from the GAAP-contract revenues to calculate 13 weeks of revenue for Q4-10 on a Non-GAAP basis
for comparison purposes.
impact of the additional week in Q4-10 and are calculated by dividing contract revenues by 14 weeks. The result, representing one week
of contract revenues, is subtracted from the GAAP-contract revenues to calculate 13 weeks of revenue for Q4-10 on a Non-GAAP basis
for comparison purposes.
(b) The
Non-GAAP growth (decline) percentage is calculated as follows: (i) Non-GAAP
contract revenues for Q4-10 less (ii) revenues in
the comparative prior year period or prior quarter period; divided by (ii) revenues in the comparative prior year period or prior quarter
period.
the comparative prior year period or prior quarter period; divided by (ii) revenues in the comparative prior year period or prior quarter
period.

11
Amounts
may not foot due to rounding.
(a) Non-GAAP
adjustments in Q4-10 result from the Company’s 52/53 week fiscal year. The
Q4-10 Non-GAAP adjustments reflect the
impact of the additional week in Q4-10 and are calculated by dividing contract revenues by 14 weeks. The result, representing one week
of contract revenues, is subtracted from the GAAP-contract revenues to calculate 13 weeks of revenue for Q4-10 on a Non-GAAP basis
for comparison purposes. The Non-GAAP adjustments in Q3-09, Q2-09, and Q1-09 also reflect storm restoration revenues recognized
during those periods.
(b) Year-over-year
growth (decline) percentage is calculated as follows: (i) revenues in the
quarterly period less (ii) revenues in the
comparative prior year quarter period; divided by (ii) revenues in the comparative prior year quarter period.
comparative prior year quarter period; divided by (ii) revenues in the comparative prior year quarter period.

12
Appendix:
Regulation G Disclosure

4th Quarter
Presentation
August
25, 2010