Attached files
| file | filename |
|---|---|
| 8-K - FORM 8-K - GEORESOURCES INC | d8k.htm |
 GeoResources, Inc
Corporate Profile
August 2010
Exhibit 99.1 |
 2
Forward-Looking Statements
Information herein contains forward-looking statements that involve significant
risks and uncertainties, including our need to replace production and
acquire or develop additional oil and gas reserves, intense competition in
the oil and gas industry,
our
dependence
on
our
management,
volatile
oil
and
gas
prices
and
costs, with hedging activities and uncertainties of our oil and gas estimates of
proved reserves and reserve potential, all of which may be
substantial. In addition,
all
statements
or
estimates
made
by
the
Company,
other
than
statements of historical fact, related to matters that may or will occur in the
future are forward-looking statements.
Readers are encouraged to read our December 31, 2009 Annual Report on
Form 10-K and Form 10-K/A and any and all of our other documents filed with
the SEC regarding information about GeoResources
for meaningful cautionary
language in respect of the forward-looking statements herein. Interested
persons are able to obtain free copies of filings containing information
about GeoResources, without charge, at the SEC’s
Internet site (http://www.sec.gov).
There is no duty to update the statements herein. |
 3
Additional Disclosures |
 4
Key Investment Highlights
Value Creation
Attractive Value Proposition
Trading at a significant discount to NAV
Experienced Management and Technical Staff with Large Ownership
Stake
Board and management own or control approximately 36% of the Company
Successful track record of creating value and liquidity for shareholders
Strong Asset Base
Strategically located
Geographically diverse
Balanced oil vs. gas
High level of operating control
Strong Financial Position
Significant cash flow
Moderate leverage |
 5
Key Investment Highlights
Value Creation
Oil Weighted Asset Base
Reserves 56% Oil
Production 54% Oil
Significant Bakken Exposure
24,000 net operated acres
13,000 net non-op acres
37,000 TOTAL ACRES
Other Significant Growth Opportunities
Low risk development drilling
Higher impact exploration upside
Continually Expanding Acreage |
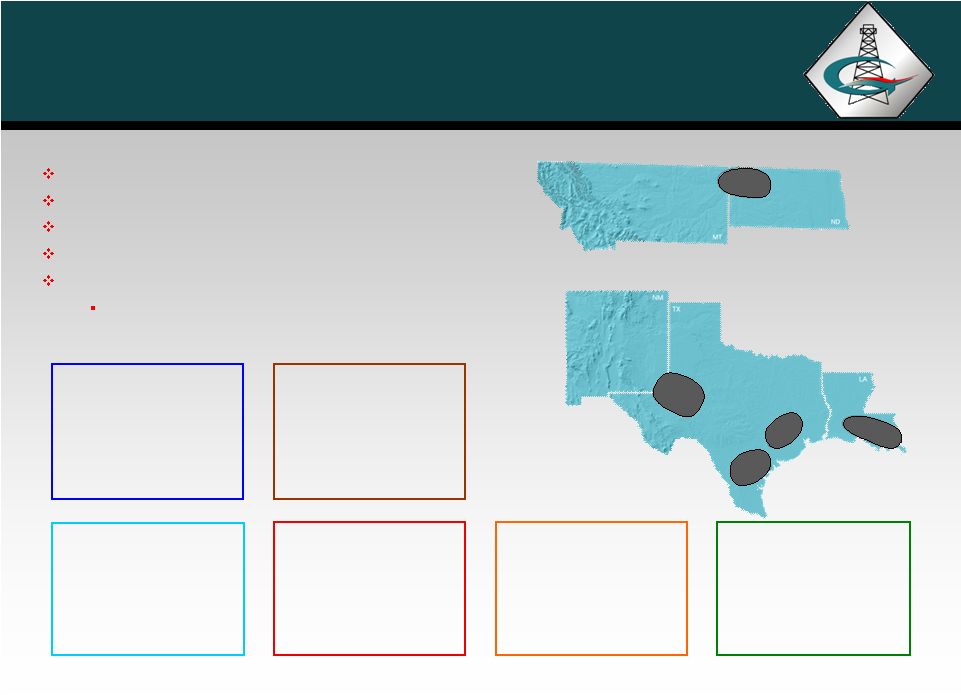
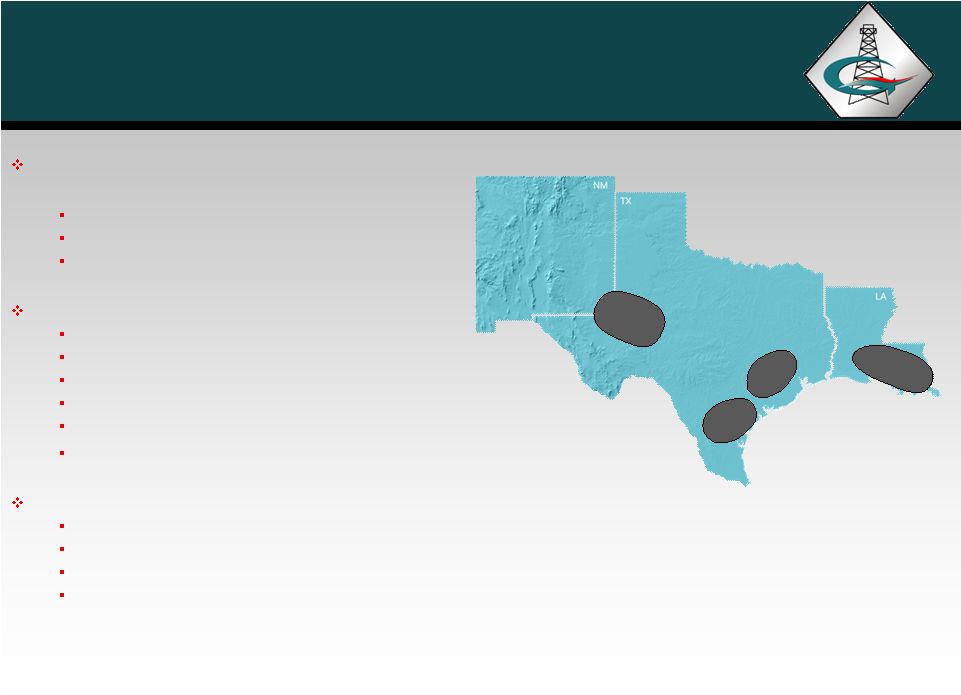
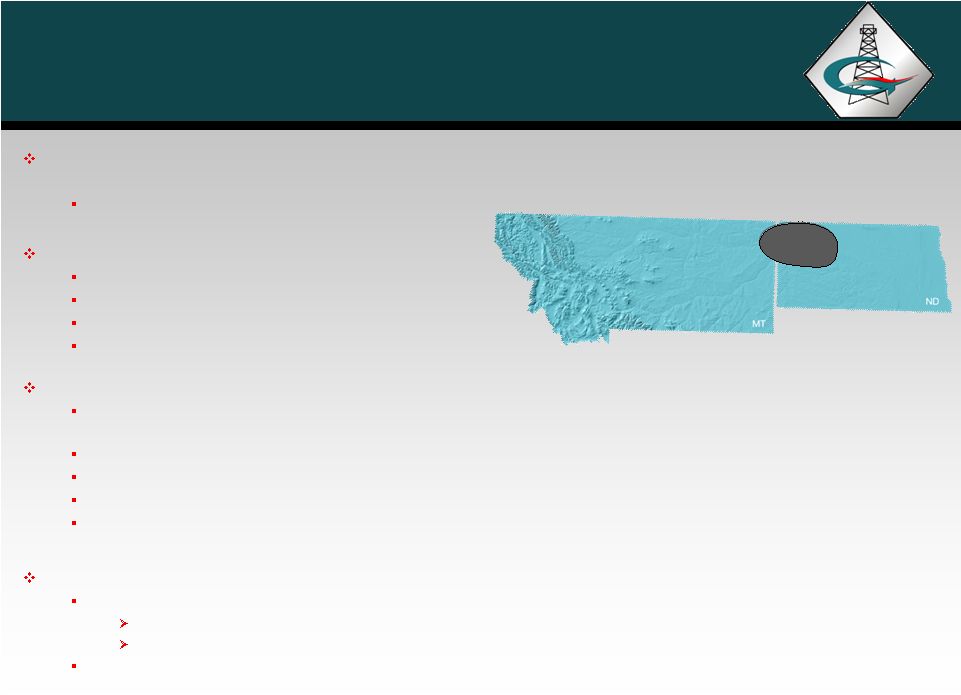
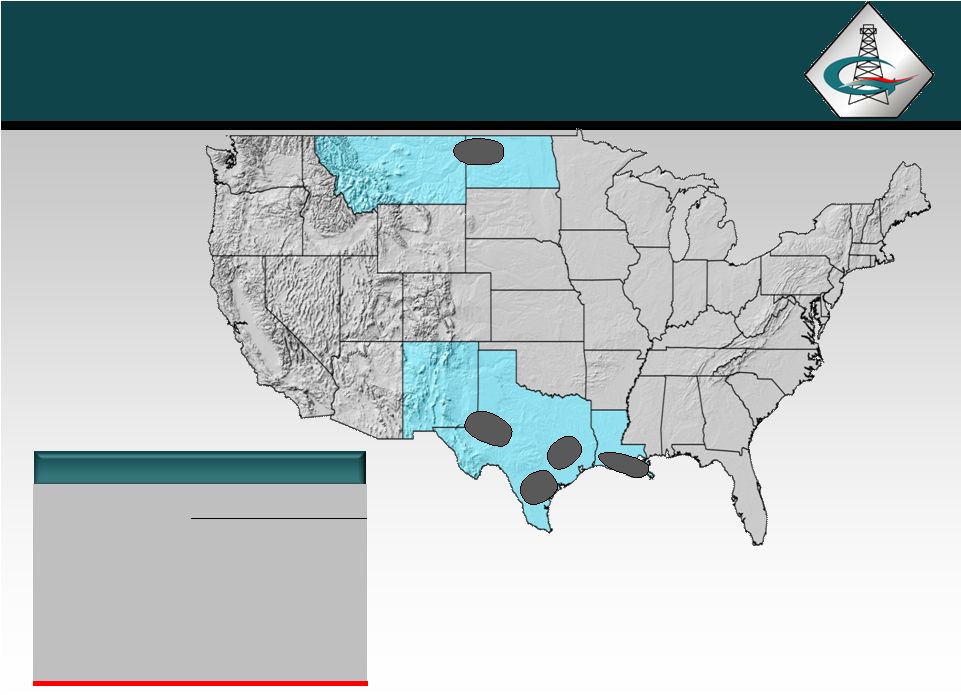 6
Company Overview
(1)
Represents the Company’s average production rate YTD June 30,
2010. (2)
Acreage information estimated as of June 30, 2010.
(3)
Map depicts focus areas and excludes minor value properties.
.
6
Company Highlights
Direct
Direct +
Ownership
Partnership
Proved Reserves (MMBOE)
24.0
25.6
Oil
56%
53%
Proved Developed
73%
74%
PV 10% (millions)
$384
$401
Production (BOEpd)
(1)
5,158
5,643
Oil
54%
50%
Operated
80%
80%
Gross Acreage
(2)
526,374
526,374
Net Acreage
(2)
239,770
246,168 |
 7
Value-Driven Growth Strategy
Asset
Rationalization
Selectively divest assets to upgrade portfolio.
Focus on maximizing IRR for investors.
Cost Control
Operate as efficiently as possible by focusing on minimizing development,
production, and G&A expenses.
Pursue promoted partner positions to reduce costs and generate operating
fees.
Generate new exploration prospects.
Solicit partners on a promoted basis to reduce risk and enhance returns.
Exploration
Acquire operated properties with existing production, development
opportunities, and exploration potential.
Acquisitions
Development
and
Exploitation
Focus on areas with development and exploration upside.
Implement re-engineering and development programs to extend field life,
increase proved reserves, lower unit operating costs, and enhance economics.
|
 8
Management History
2004-
2007
Southern Bay Energy, LLC
Gulf Coast, Permian Basin
REVERSE MERGED INTO
GEORESOURCES, INC.
2000-2007
Chandler Energy, LLC
Williston Basin, Rockies
ACQUIRED BY
GEORESOURCES, INC.
1988-2000
Chandler Company
Rockies, Williston Basin
MERGED INTO
SHENANDOAH THEN SOLD
TO QUESTAR
1992-1996
Hampton Resources Corp
Gulf Coast
SOLD TO BELLWETHER
EXPLORATION
Preferred investors –
30% IRR
Initial investors –
7x return
1997-2001
Texoil Inc.
Gulf Coast, Permian Basin
SOLD TO OCEAN ENERGY
Preferred investors –
2.5x return
Follow-on investors –
3x return
Initial investors –
10x return
2001-2004
AROC Inc.
Gulf Coast, Permian Basin, Mid-Con.
DISTRESSED ENTITY LIQUIDATED
FOR BENEFIT OF INITIAL
SHAREHOLDERS
Preferred investors –
17% IRR
Initial investors –
4x return
Track record of profitability and liquidity
Extensive industry and financial relationships
Significant technical and financial experience
Long-term repeat shareholders
Cohesive management and technical staff
Team has been together for up to 20
years through multiple entities |
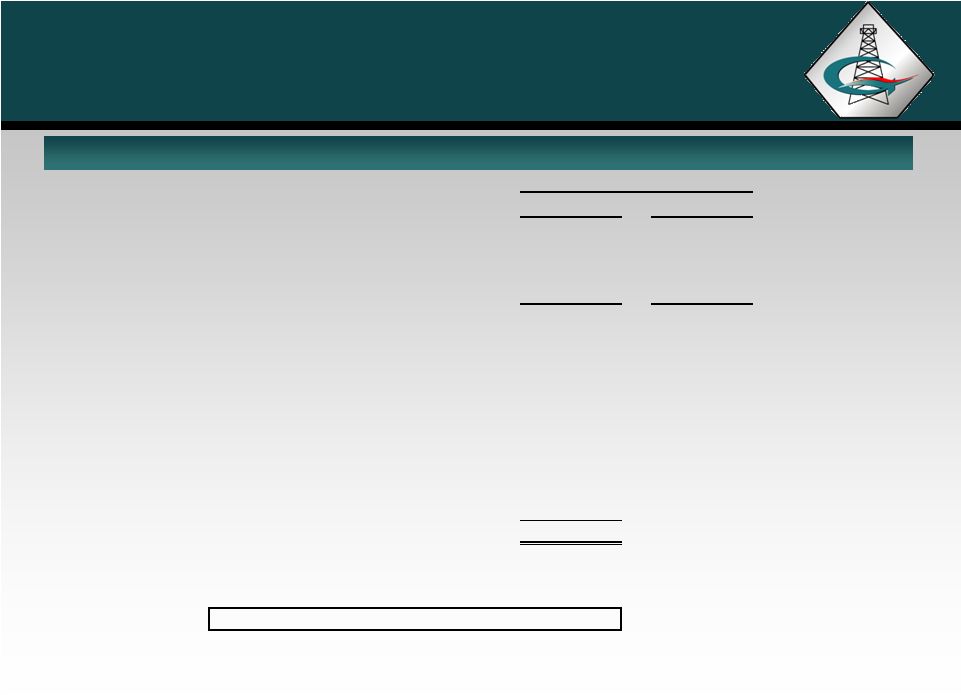 9
Net Asset Value
Net Asset Value
(1)
Nymex
strip pricing at June 30, 2010.
(2)
At June 30, 2010, excluding derivative financial instruments.
(3)
Assumed $2,000 per net acre for Bakken
acreage plus book value at 6/30/10 for other areas.
(4)
June 30, 2010 balance plus July borrowings for acquisitions.
($ in millions)
PV-10
(1)
% of Total
Proved Reserves:
Proved Developed Producing
246.0
$
64.1%
Proved Developed Non-Producing
63.0
16.4%
Proved Undeveloped
74.8
19.5%
Total Proved PV-10 Value
383.8
$
100.0%
Plus:
Working Capital
(2)
18.4
$
Unproved Property
(3)
84.5
Partnership Value
16.8
Less:
Total Debt
(4)
(85.0)
Total Net Asset Value
418.5
$
Shares Outstanding (thousands)
19,713
Net Asset Value Per Share
21.23
$
June 30, 2010 |
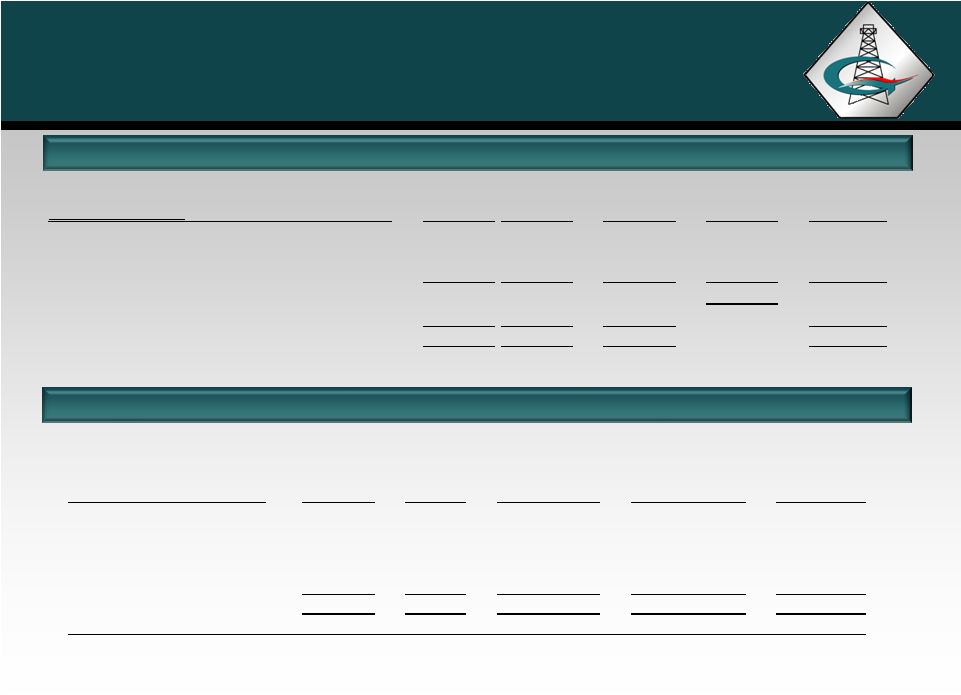 10
Proved Reserves
Proved Reserves by Category
Proved Reserves by Area
Partnership
Proved
% of
Interests
Total Proved
% of Total
Area
MMBOE
Proved
MMBOE
MMBOE
Reserves
Central and South Texas
9.1
37.9%
1.5
10.6
41.4%
Williston
6.7
27.9%
0.0
6.7
26.2%
Louisiana
3.8
15.8%
0.0
3.8
14.8%
Other
4.4
18.4%
0.1
4.5
17.6%
Total
24.0
100.0%
1.6
25.6
100.0%
($ in millions)
Oil
Gas
Total
% of
Corporate Interests
MMBO
BCF
MMBOE
Total
PV-10
PDP
8.3
37.4
14.6
60.8%
$246.0
PDNP
2.1
5.4
3.0
12.5%
63.0
PUD
3.1
20.3
6.4
26.7%
74.8
Total Proved Corporate Interests
13.5
63.1
24.0
100.0%
383.8
Partnership Interests
0.1
9.1
1.6
16.8
Total Proved Corporate and Partnerships
13.6
72.2
25.6
$400.6 |
 11
Selected Balance Sheet Data
Financial Summary
(1)
The above table does not include the balance sheet effects of hedge accounting for
derivative financial instruments which is required for financial statements
presented in accordance with generally accepted accounting principles. See the Company’s SEC filings for further
information.
(2)
June 30, 2010 was $69 million plus $16 million for July acquisitions.
($ & shares in millions)
June 30, 2010
Dec. 31, 2009
Dec. 31, 2008
Cash
15.9
$
12.7
$
14.0
$
Other Working Capital -
Net
(1)
2.5
$
3.3
$
(8.7)
$
Total Working Capital -
Net
(1)
18.4
$
16.0
$
5.3
$
Oil & Gas Assets (Successful Efforts)
262.2
$
248.4
$
181.6
$
Equity in Partnerships
2.7
$
3.5
$
3.3
$
Long-Term Debt
(2)
85.0
$
69.0
$
40.0
$
Common Stock and Additional Paid in Capital
147.6
$
147.2
$
112.7
$
Retained Earnings
41.3
$
30.8
$
21.0
$
Common Stock Outstanding
19.7
19.7
16.2 |
 12
Financial Summary
Historical Operating Data
($ in millions except per share data)
YTD 2010
2nd Qtr. 2010
2009
2008
Key Data:
Average realized oil price ($/Bbl)
70.55
$
70.48
$
61.09
$
82.42
$
Avg. realized natural gas price ($/Mcf)
5.25
$
4.90
$
3.97
$
8.12
$
Oil production (MBbl)
504
255
851
743
Natural gas production (MMcf)
2,580
1,300
4,944
2,962
Total revenue
53.0
$
26.4
$
80.4
$
94.6
$
Net income before tax
17.2
$
7.3
$
14.8
$
21.3
$
Net income after tax
10.5
$
4.4
$
9.8
$
13.5
$
Net income per share (basic)
0.53
$
0.23
$
0.59
$
0.87
$
EBITDAX
35.6
$
17.7
$
48.2
$
54.2
$ |
 13
Financial Summary
Historical Production Data
Historical Operating Netback Data
(1)
Represents severance tax expense and re-engineering and workover
expense.
YTD 2010
2nd
Qtr 2010
2009
2008
Oil Production (MBbls)
504
255
851
743
Gas Production (MMCF)
2,580
1,300
4,944
2,962
Total Production (Mboe)
934
472
1,675
1,237
Avg. Daily Production (Boe/d)
5,158
5,184
4,589
3,388
YTD 2010
2nd
Qtr 2010
2009
2008
($ per BOE)
Revenue
$56.72
$55.94
$48.01
$76.50
Less:
LOE
$10.94
11.00
$11.20
$18.53
G&A
4.13
4.32
5.07
5.80
Other Field Level Opex
(1)
4.10
3.80
3.84
8.92
Total Field Level Operating Costs
$19.17
$19.12
$20.11
$33.25
Field Level Operating Netback
$37.55
$36.82
$27.90
$43.25 |
 14
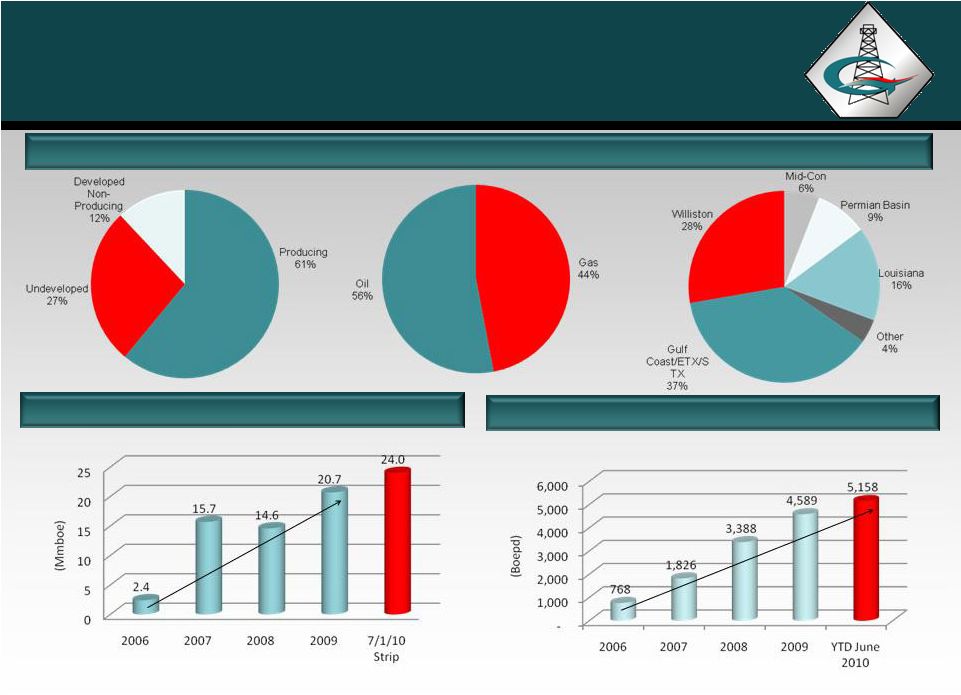
Proved
Reserves
(MMBOE)
(2)
Average Daily Production (BOEpd)
Reserves and Production –
Direct Interests
(1)
Current Proved Reserves –
24.0 MMBOE
(1)
Excludes
partnership
interests.
(2)
2006
–
2009
proved
reserves
based
on
SEC
guidelines.
(3) 2008 Reserves reflect divestitures. (4) 7/1/10 strip prices based
on NYMEX strip of 6/30/10. |
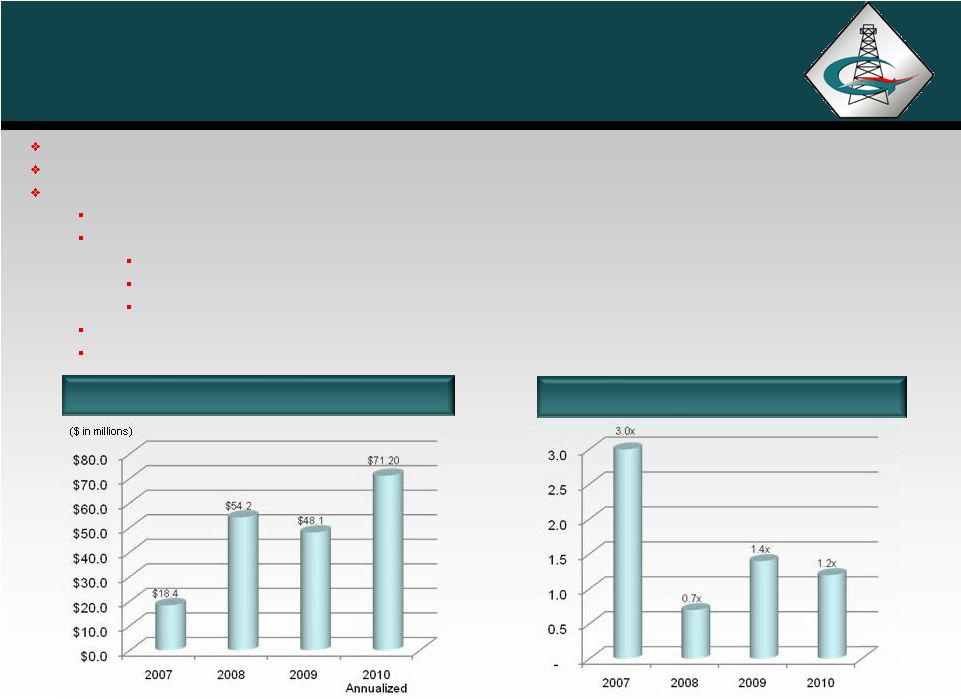 15
EBITDAX
Total Leverage
Can fund CapEx
without reliance on capital markets
Debt funding available for acquisitions
Conservative use of leverage to maintain strong balance sheet
$145 Million borrowing base
EBITDAX :
2
nd
Quarter
=
$17.7
Million
YTD 2010 = $35.6 Million
Annualized = $71.2 Million
Total debt of $85.0 million at June 30, 2010, pro-forma with
acquisition. Credit facility priced at LIBOR plus 2.25 –
3.00%
Strong Financial Position |
 16
Hedging Strategy
Oil Hedges
GEOI uses commodity price risk management in order to execute its business plan
throughout commodity price cycles.
Overall, about 67% of production is hedged for 2010 and 58% is hedged for
2011. Natural
gas
hedges
include
hedge
volumes
intended
to
cover
GEOI’s
share
of
partnership
production.
Term of hedges is July 1, 2010 through December 31, 2012.
Natural Gas Hedges |
 17
Southern Region
Accounts for approximately 71% of reserves and
70% of total production
High-impact exploration potential
Development and recompletion potential
Approximately 38% of proved reserves are oil
Successful Austin Chalk drilling program
Significant working interests plus partnership interests
Sixteen wells drilled with 100% success rate
68 producing wells
20 additional locations
Recent additional acreage acquisitions
Yegua, Eagle Ford and Georgetown potential
St. Martinville project to begin drilling in September 2010
Oil project supported by 3-D located in South Louisiana
Three new wells and one re-entry scheduled
Multiple stacked oil objectives above 7,000’
Additional shallow locations with significant gas objectives at
about 10,000’ |
 18
Northern Region
Accounts for approximately 29% of reserves and 30% of
total production
Approximately 93% of proved reserves are oil
Bakken Operated Joint Venture:
Acquired 50,000 net acres in Williams County, ND
Established development joint venture
Retained 47.5% WI (24,000 net acres) in AMI
Drilling scheduled to begin September 2010
Bakken Non-Operated Joint Venture:
10-18% WI in approximately 100,000 gross acres
(approximately 13,000 net acres)
Current four rig program
58 joint venture operated gross wells drilled
Acquired and/or participated in over 185 non-operated wells
Joint venture expects to drill 100 wells in the next 2 years
Williston Basin Other:
Starbuck & SW Starbuck waterflood installation completed in early 2008
& in early 2009 Initial response realized
Additional oil upside in horizontal and vertical infill locations within the unit
boundaries Proved undeveloped and non-proved oil drilling opportunities
within producing fields |
 19
Southern Region
Project Inventory
Project Expansion with Success |
 20
Capital Allocation and Budget
Project
Budgeted
Comments
$(Millions)
Bakken
Operated
$6.7
5 wells per month
Non-Operated
10.3
3 wells
Rip-Rap
1.3
Initial well Montana
Giddings
5.3
2 wells
St. Martinville
4.2
4 wells
$27.8
Acreage/seismic
12.0
$39.8
Remainder of 2010
Project inventory allows flexibility
Weighted towards oil and liquids
Oil and gas projects in inventory
Exploration and development
projects in inventory
Held by long-term leases or
production
Current allocations favors lower-risk,
high cash flow oil projects
Will move between oil and gas as
prices and costs dictate
Capital Allocations |
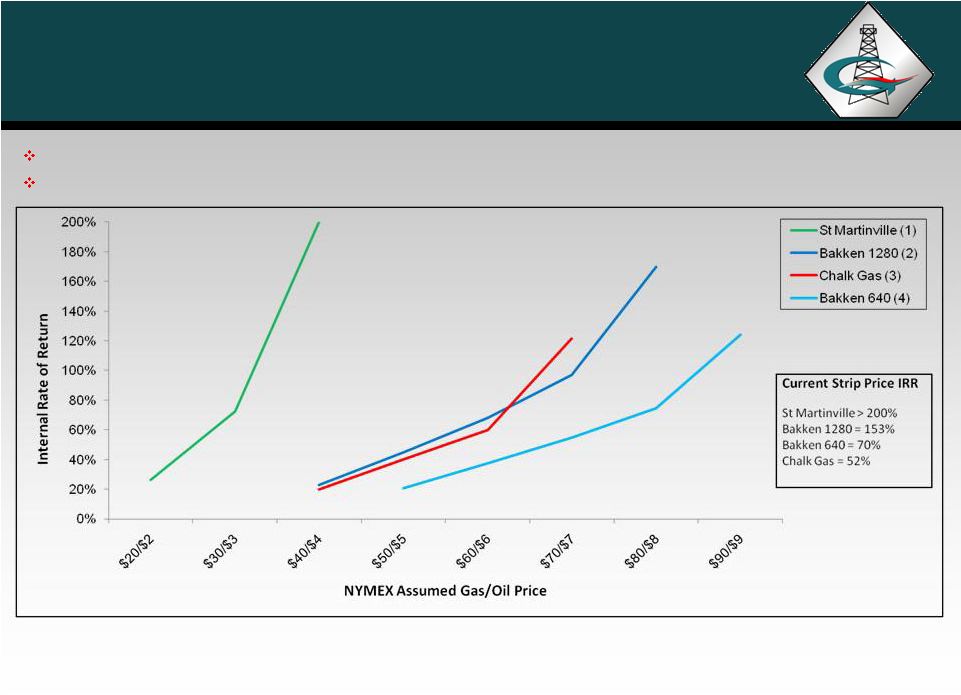 21
Type Well Economics
Diverse set of drilling opportunities provides for flexibility in changing
commodity price cycles Most
drilling
opportunities
remain
economic
in
the
current
price
environment
(1)
Well cost of $1.3 million and reserves of 250 MBO
(2)
Well cost of $6.2 million and reserves of 600 MBO
(3)
Well cost of $7.0 million and reserves of 6.5 BCF
(4)
Well cost of $5.2 million and reserves of 400 MBO. |
 APPENDICES |
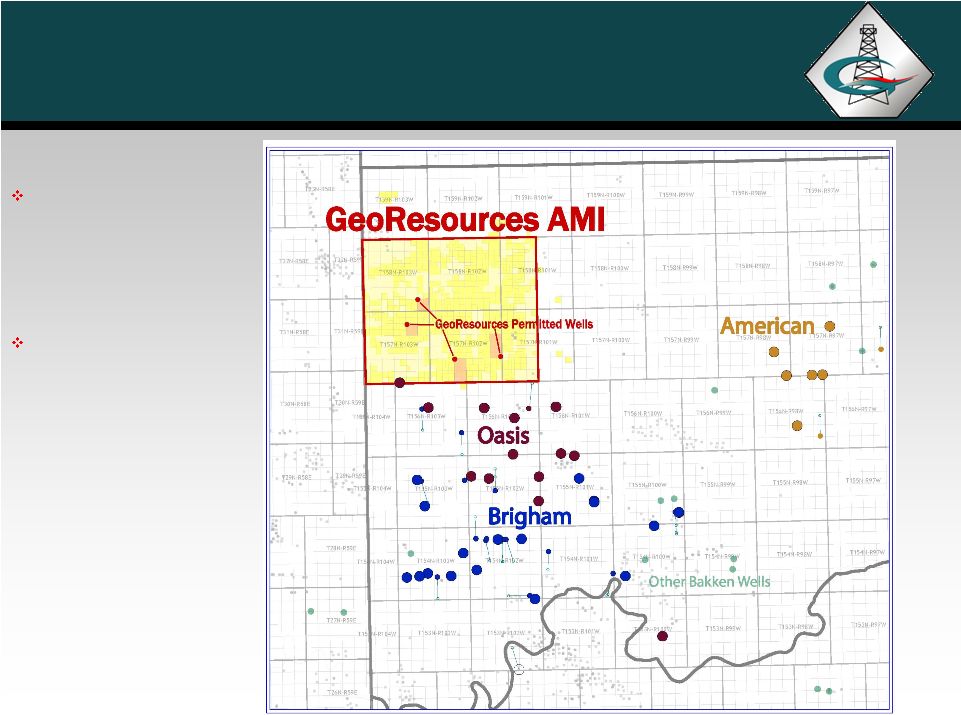
   Bakken
Shale Operated Williams County, ND Joint Venture Acreage
Joint Venture controls 50,000 Net Acres
GEOI operated
Partner with Resolute Energy and Private
Independent
GEOI = 47.5% Working Interest
GEOI = 24,000 net acres
Continued leasing
Plan to drill at least 3 wells beginning in
September 2010
Operator Activity in Williams County
American (Hess)
Brigham Exploration
Continental Resources
EOG
Oasis
Whiting
Exxon Mobil
CANADA
ND
MT
50 miles
Williams
County
Parshall
Sanish
23 |
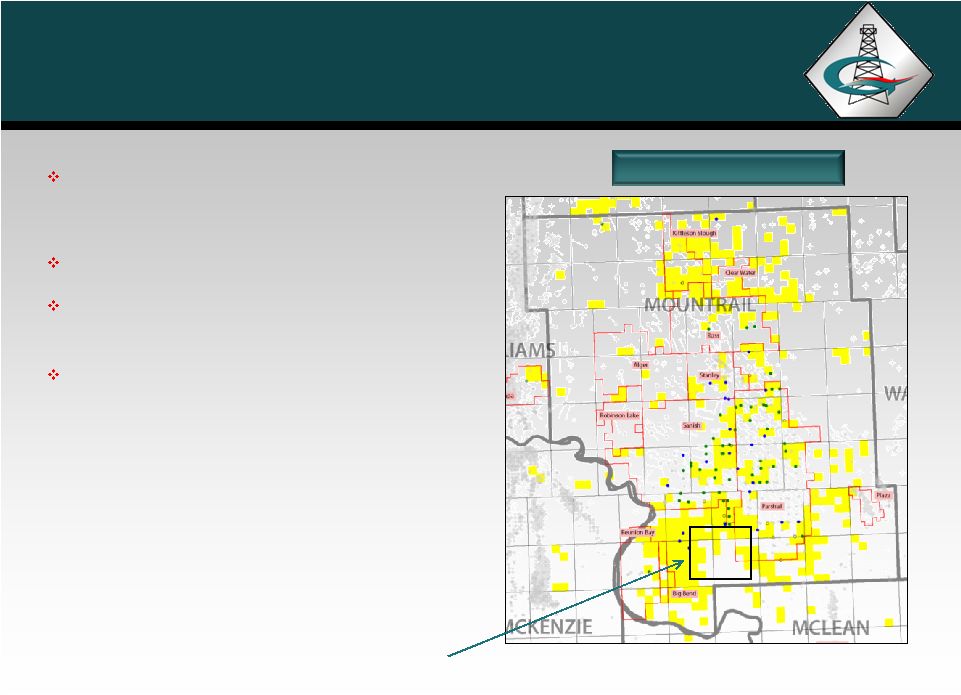
 Bakken Shale Operated
Williams County, ND Joint Venture Acreage
24
5 southern offsets to
GEOI AMI have state-
reported initial rates
of 1,181-1,947 bopd
5 wells south of
GEOI AMI either
completing, drilling or
permitted |
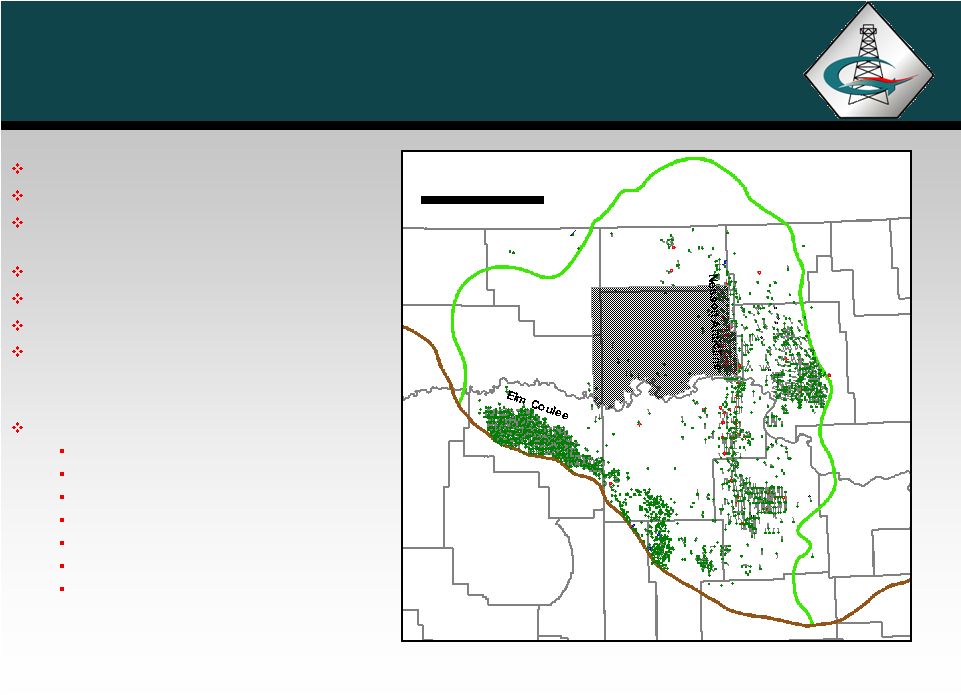
 25
Bakken Shale
Non-operated
Bakken Shale
Note: Yellow-highlighted areas represent the Company’s acreage
position. Working interests ranging from 10% to 18%
in 100,000 gross acres (approximately
13,000 net acres)
Four rigs running
Joint Venture has drilled 58 wells and
expects 100 wells in the next 24 months
Developing on 640 acre units as well as
1,280 acre and larger units
Detailed map on next slide |
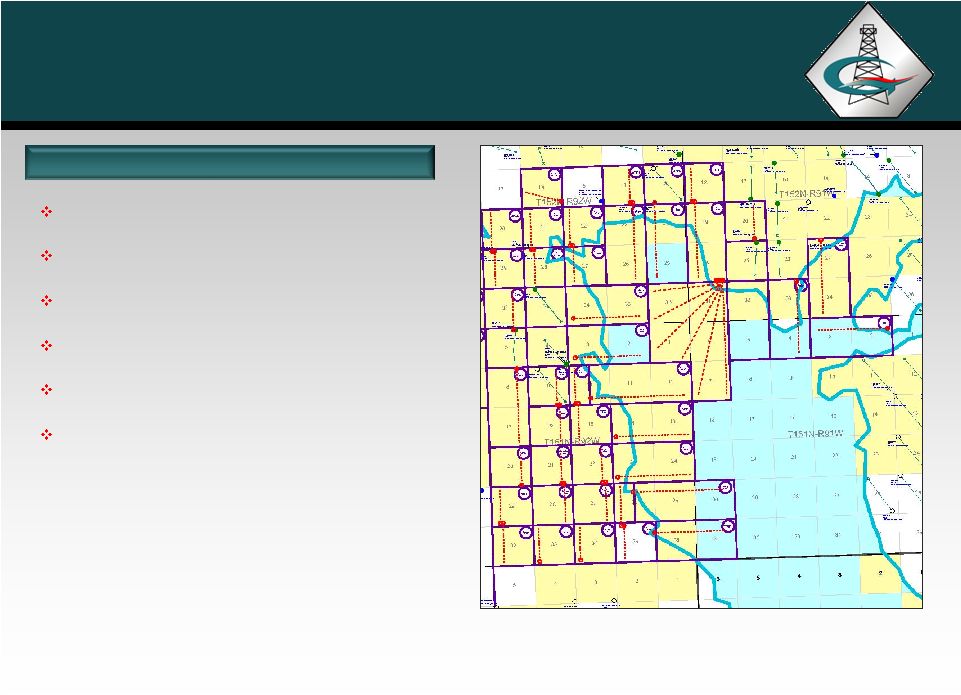 26
Bakken Shale
Non-operated
Note: Yellow-highlighted areas represent the Company’s acreage
position. 640 and 1,280 acre units being drilled
Some larger units under the lake
Multiple wells from single drilling pad
Minimize facilities and roads
Maximize infrastructure
Minimize disturbance and the number of
locations
Van Hook Area |
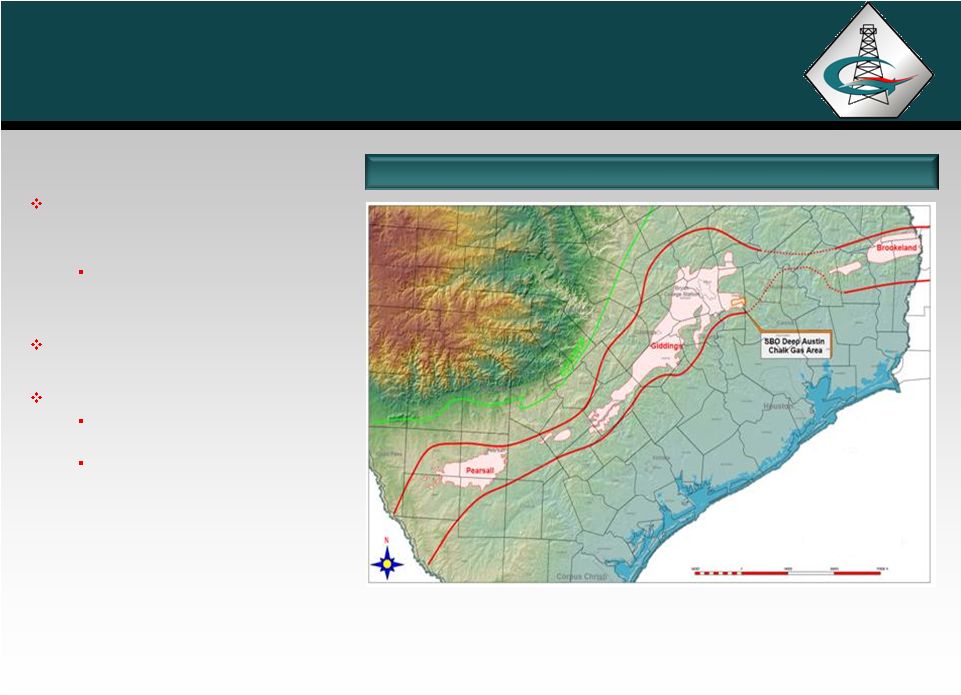 27
Giddings Field
Austin Chalk Play, Texas
Working interests range from
37% -
53% in 68,000 gross acres
(approximately 29,000 net acres)
20 additional gross drilling
locations (9.2 net wells)
16 wells drilled –
100% success
Additional upside includes:
Yegua, Eagle Ford and
Georgetown potential
Multiple wells with rate increase
potential from slick water
fracture stimulations |
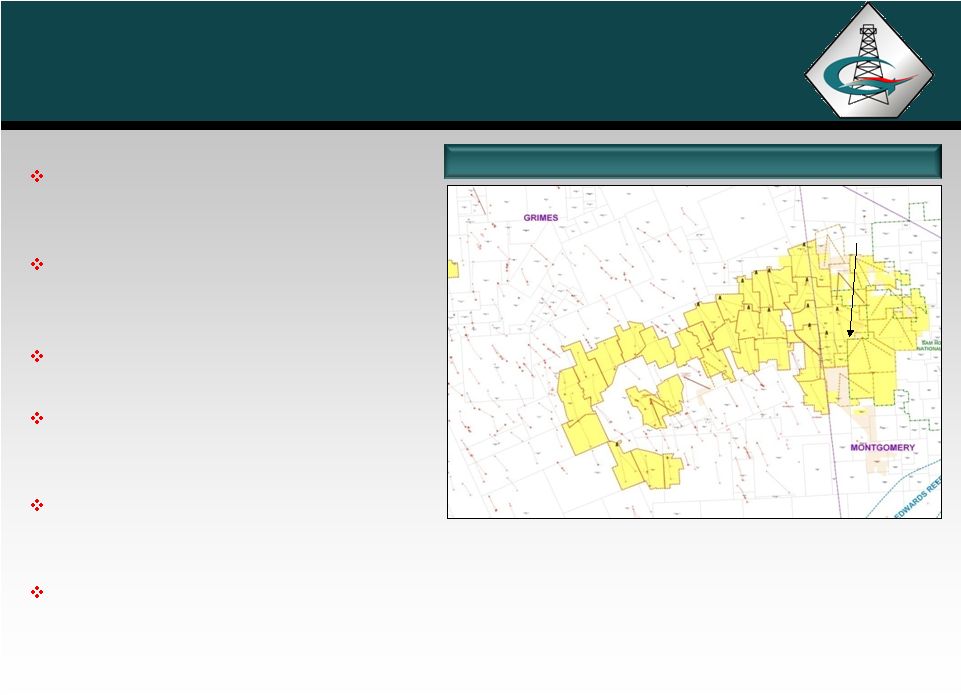 28
Grimes and Montgomery Counties, TX
Austin Chalk Development
Proved undeveloped and probable
horizontal locations
Longstreet 1H produced 1.0 BCFG in
67 days
Single and multiple laterals
Eastern Grimes / Western Montgomery
dry gas
Western Grimes gas with large volume
of liquids
Tight gas –
severance tax exemption
Longstreet 1H |
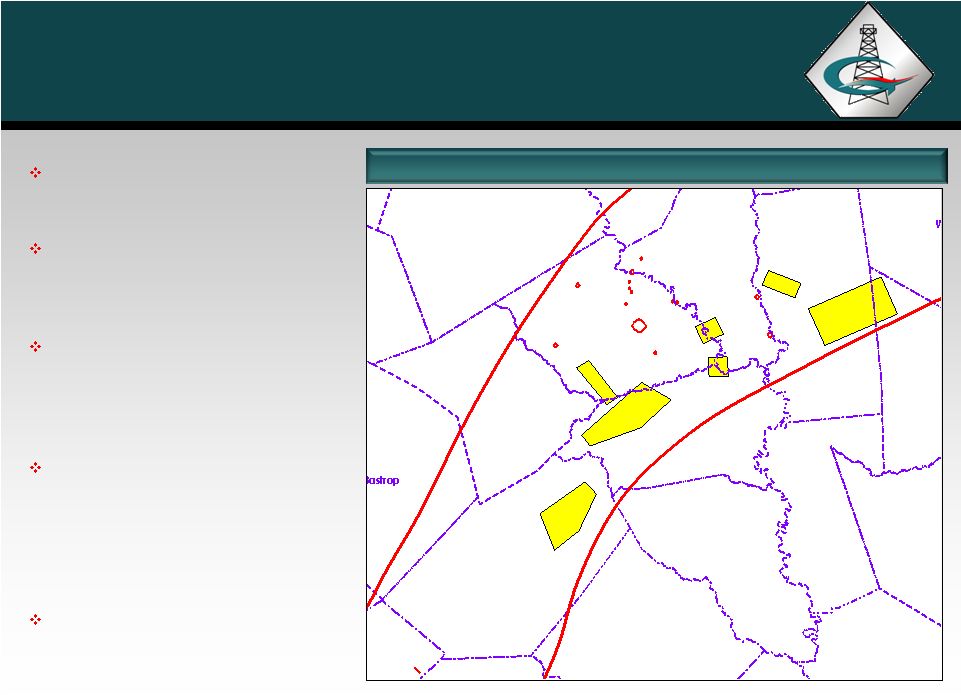 29
Recent Activity Map
Apache & Clayton Williams active
in Giddings Field
Apache drilled a combination of
vertical and horizontal wells with
older style completions
Our Brazos, Burleson, Fayette
and Washington County holdings
currently appear most prospective
for Eagle Ford
Eagle Ford
•
Early in development
•
Present over much larger
area than current
development
Recent initial rates by other
operators
from
234
–
492
BOPD
Central Texas Eagle Ford
APACHE
APACHE
APACHE
APACHE
APACHE
CWEI
CWEI
MAGNUM-HUNTER
Lee
Washington
Waller
Fayette
Austin
Colorado
Milam
Brazos
Grimes
Burleson |
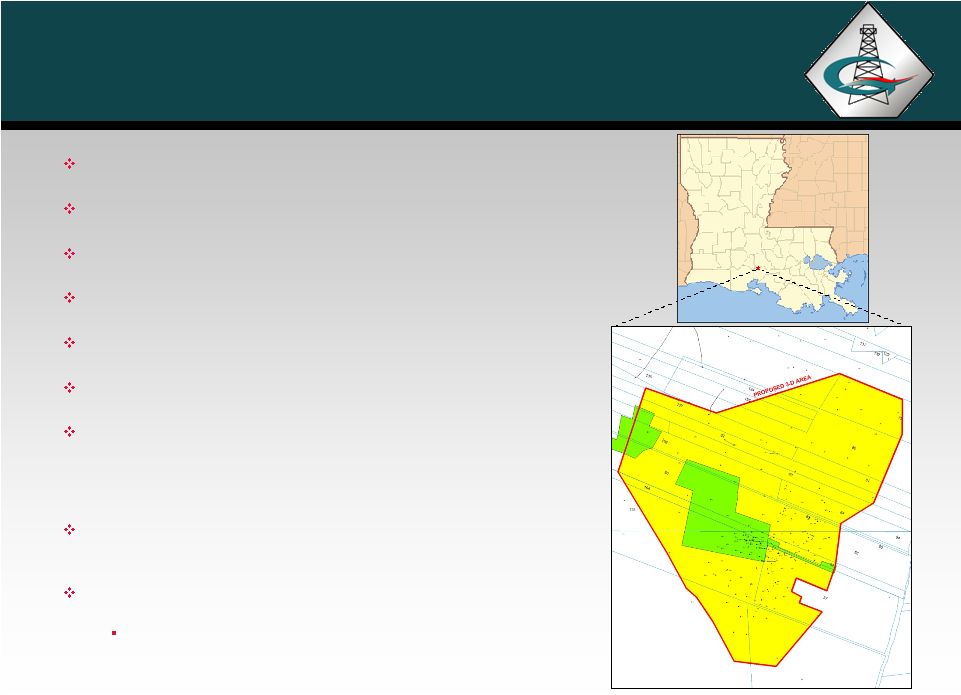 30
St. Martinville
St. Martinville
Recent
5.3
square
mile
“high
resolution”
3-D
survey
Intermediate depth salt dome
Average working interest 97% and average NRI 91%.
Faulted structural closures provide hydrocarbon traps
534 net acres of owned minerals (green)
2,585 net acres of HBP or leased (yellow)
Main objectives Miocene age, low risk, shallow, highly
productive
multi-sand,
oil,
from
3,000’
–
7,000’.
Over
50
individual sands productive in field with cumulative
shallow production of 15.2 MMBO and 16.6 BCFG
Most recent STD of Kansas #7 is 250 MBO with well
cost of $1.0 million.
Exploratory objectives in Discorbis
and Bol
perca
(gas
and condensate)
Discorbis
section
at
10,000’
produced
124
BCF
and 1.8 MMBO and is HBP.
LOUISIANA |
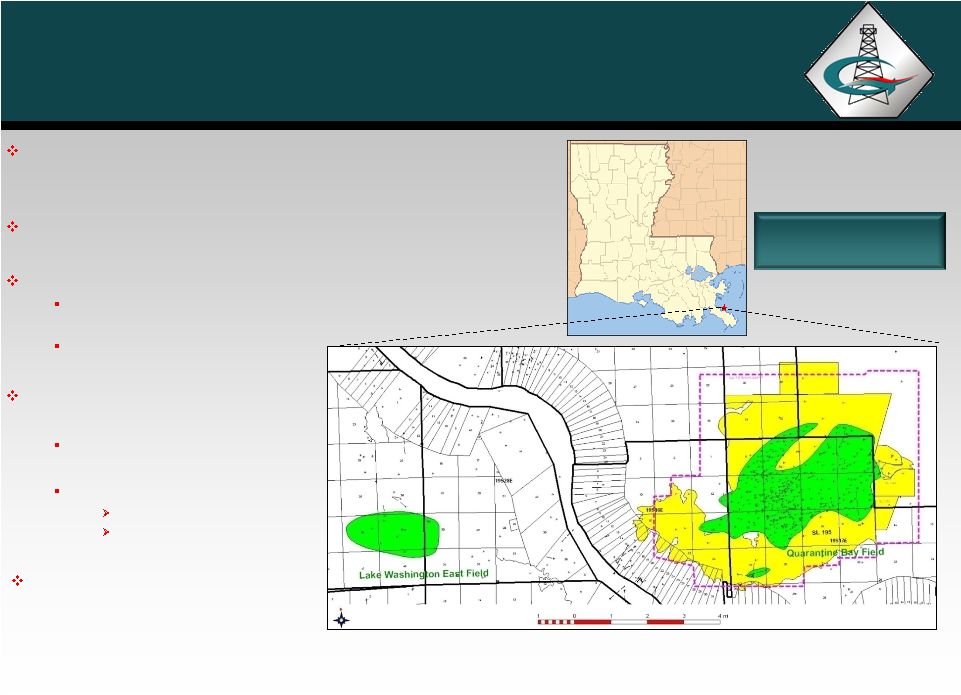 Quarantine Bay
Nearby Lake Washington East
which is an analogy for deep
production has produced 9 MMBO &
14 BCF from the Big Hum +-15,000’
31
LOUISIANA
Quarantine Bay
Field
GeoResources
has
a
7%
WI
above
10,500’
and
a
33%
WI
below 10,500’, in approximately 14,000 acres
Cumulative production = 180 MMBO and 285 BCF
Shallow zone potential (<10,500’):
Numerous behind pipe opportunities due to multiple stacked
sand reservoirs
Rate acceleration wells
Significant hi-potential exploration
deep potential:
Schlumberger reprocessed and
interpreted the 3-D seismic data
Prospect
Multiple objectives to 16,000’
Deeper objectives |
 32
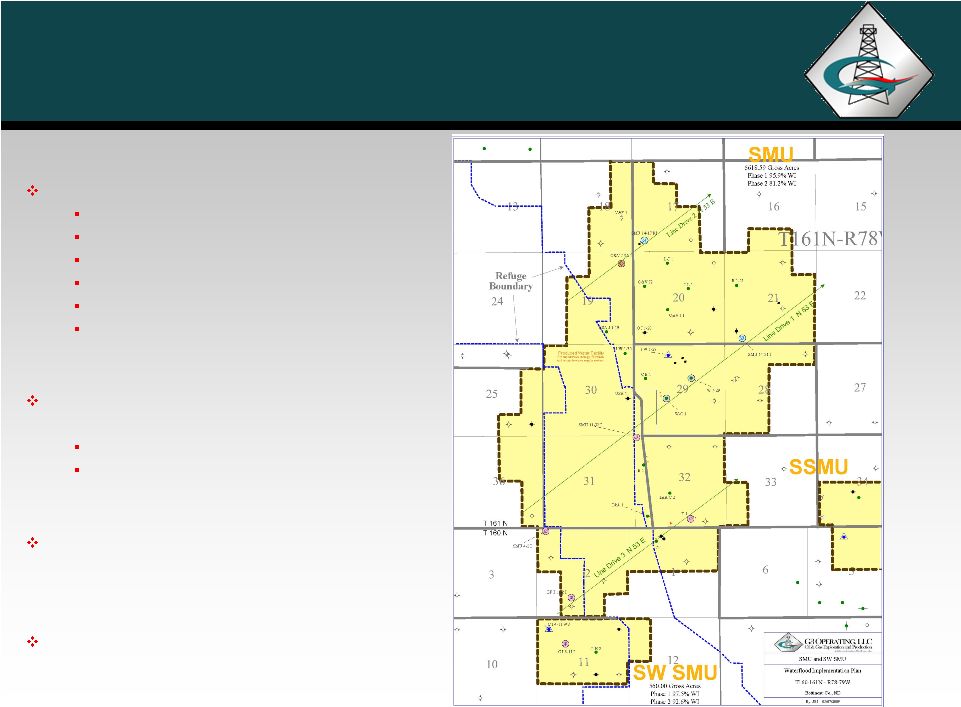
Starbuck and SW Starbuck Waterflood Units
Bottineau County, North Dakota
Starbuck Unit (6,618 acres, 96% WI)
Primary production 1.4 MMBO
Designed as line-drive waterflood
14 producers
6 injectors
One dedicated water supply well
One dedicated injection facility and one
shared facility with SSMU
SW Starbuck Unit (560 acres, 98% WI)
•
Primary production 170 MBO
Single producer/injector pair
Shared water supply well and injection facility
with larger Starbuck Unit
Additional vertical and horizontal wells
planned for both units as pressure response
and increased oil rate is achieved
Estimated additional reserves of 1.6 –
2.5
MMBO for both projects |