Attached files
| file | filename |
|---|---|
| 8-K - FORM 8-K - INTEGRAL SYSTEMS INC /MD/ | d8k.htm |
 AUGUST
2010 Exhibit 99.1 |
 2
•
This
presentation
contains
forward-looking
statements
within
the
meaning
of
Section
27A
of
the
Securities
Act
of
1933
and
Section
21E
of
the
Securities
Exchange
Act.
Such
forward-
looking
statements
include,
but
are
not
necessarily
limited
to,
our
anticipated
financial
performance,
business
prospects,
technological
developments,
new
products,
research
and development activities and similar statements concerning anticipated future events
and expectations that are not historical facts.
•
These forward-looking statements are based on current information and expectations. We
caution you that these statements are not guarantees of future performance and are
subject to numerous risks and uncertainties, including our reliance on contracts and
subcontracts funded by the U.S. government, intense competition in the ground systems
industry, the competitive bidding process to which our government and commercial
contracts are subject, our dependence on the satellite industry for most of our revenues,
rapid technological changes in the satellite industry, our acquisition strategy and
other risks and uncertainties noted in our Securities and Exchange Commission filings,
including our Annual Report on Form
10-K for the year ended September 25, 2009, and subsequent
filings.
We undertake no obligation to publicly update or revise any forward-looking
statement,
whether
as
a
result
of
new
information,
future
events
or
otherwise.
INTEGRAL SYSTEMS
SAFE HARBOR |
 3
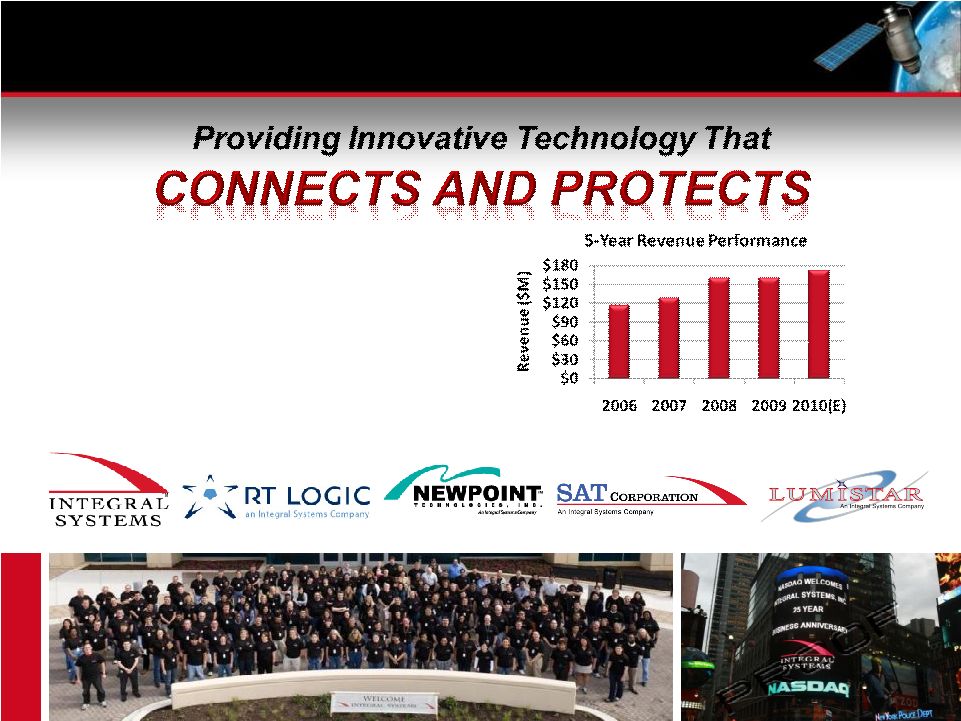
INTEGRAL SYSTEMS
AT A GLANCE
The Integral Systems Family of Solution Providers
•
NasdaqGS:
ISYS
•
Founded:
1982
•
Employees:
700 employees
•
Locations:
17 locations |
 4
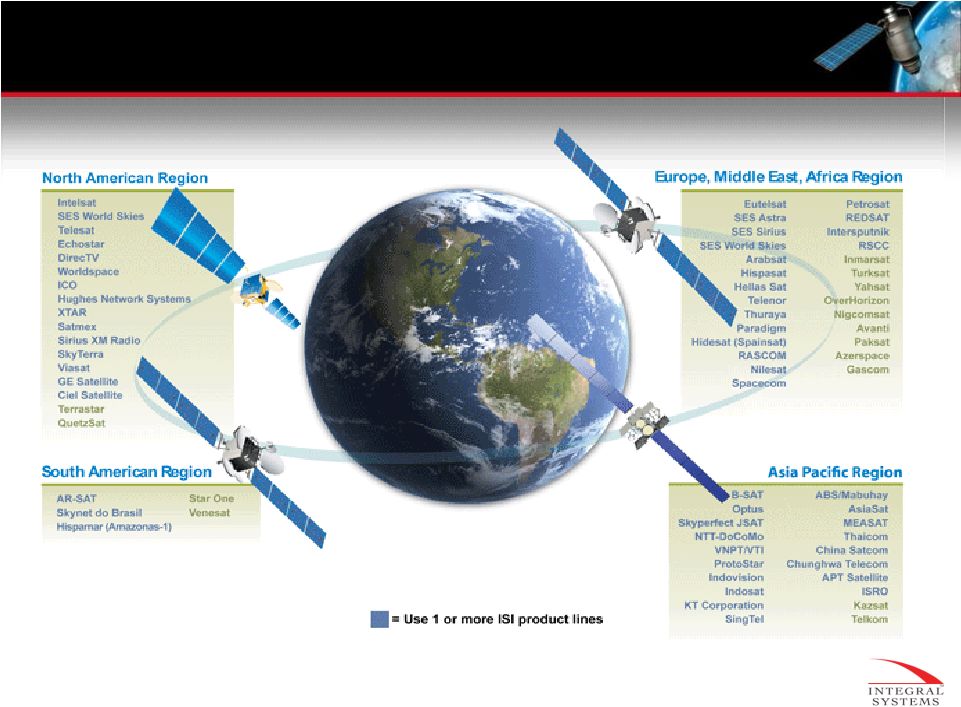
INTEGRAL SYSTEMS
DIVERSIFIED GLOBAL CUSTOMER BASE
A Leader in Our Industry:
•
U.S.
SBA
Region
III
Contractor
of
the
Year,
2009
•
Washington
Post
Top
200
Companies,
2009 |
 5
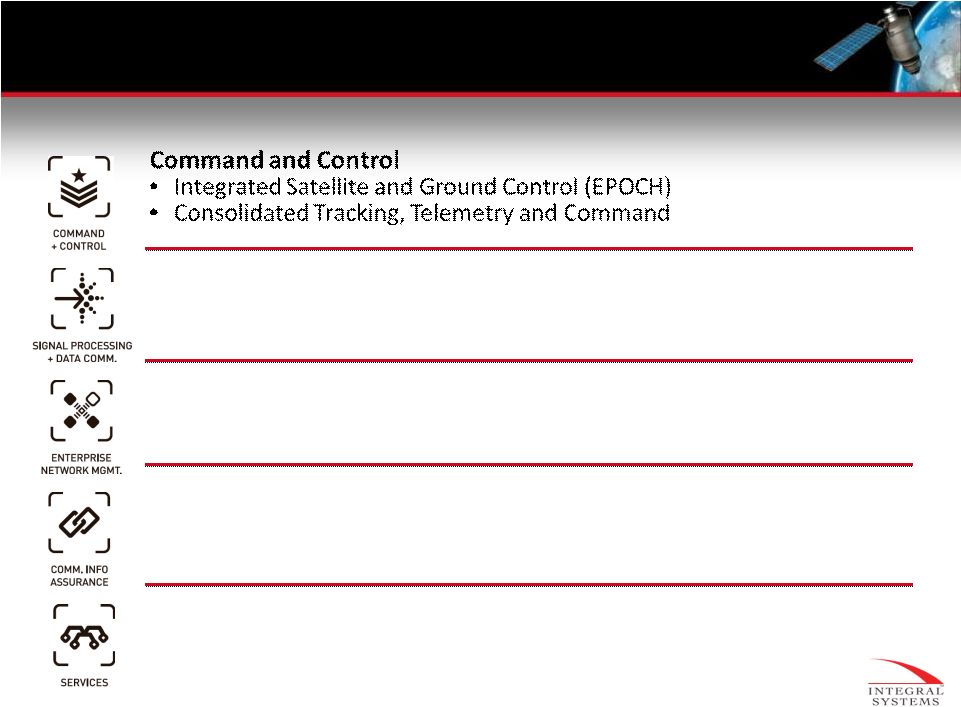
INTEGRAL SYSTEMS
MARKET LEADER IN COMMERCIAL SPACE CONTROL |
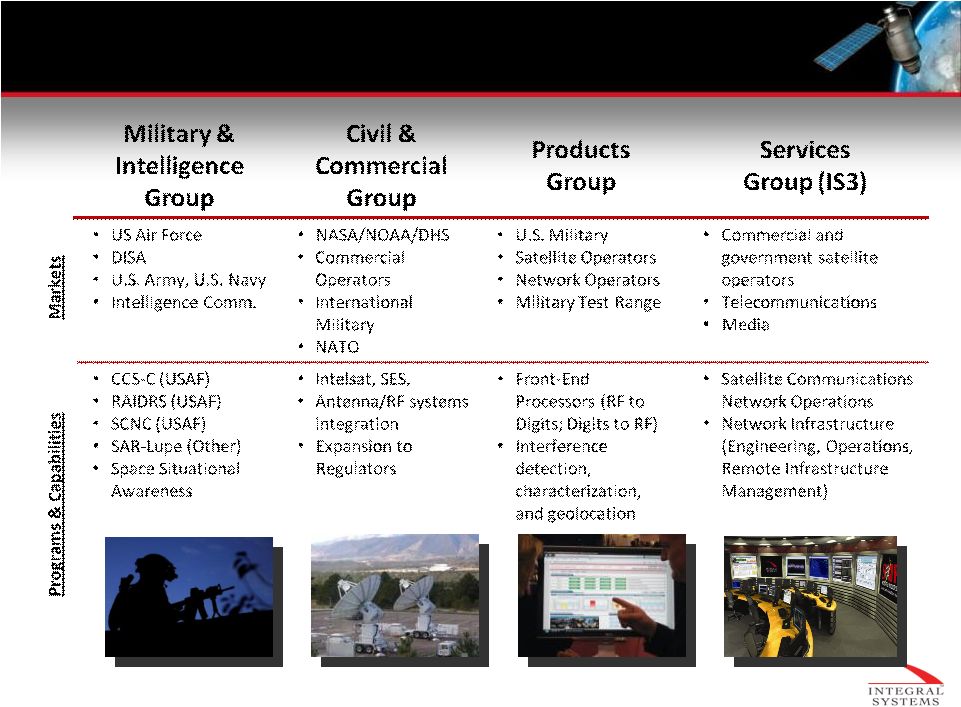
 6
Enterprise Network Management
•
Communications Infrastructure Management (Newpoint Compass)
•
Remote Site Monitoring (Newpoint Mercury)
Signal Processing & Data Communications
•
Software-Defined Front-End Systems (RT Logic)
•
SATCOM-On-The-Move (SATCOM Solutions)
Communications Information Assurance
•
Interference Detection; RF Monitoring; Digital Signal Processing
•
Spectrum Monitoring (SigMon), Interference Geolocation (satID)
Services
•
Satellite Communications Network Operations (SATCOM NetOps)
•
Subscription Services
INTEGRAL SYSTEMS
MARKET SEGMENTS |
 7
INTEGRAL SYSTEMS
ALIGNED OPERATIONS |
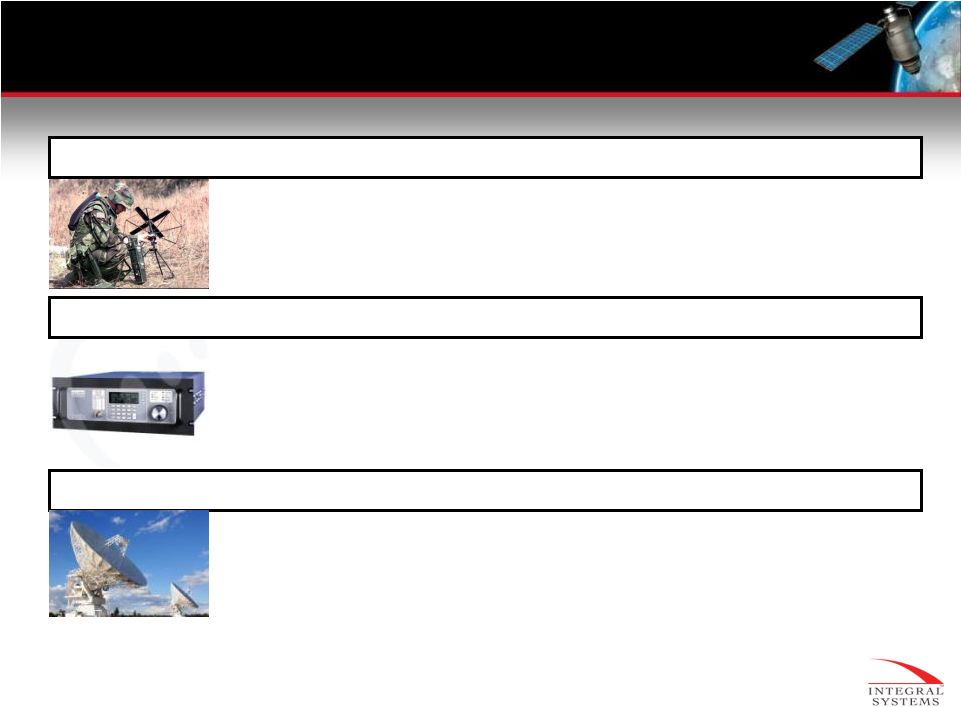 8
X, Ku, and Ka Band Micro Terminals
•
Smaller, Lighter, More Power Efficient SATCOM Terminals
•
Enable SATCOM-on-the-Move for Military, Special Operations,
National Guard, Government Agencies
SATCOM Solid State Power Amplifiers (SSPA)
•
Smaller, Lighter, More Power Efficient
•
Ku, Ka -Band 25W –
100W
•
Travelling Wave Tube Amplifier (TWTA) Replacement
Space Situational Awareness & Cyber Security
•
RF Interference, Detection, Geolocation & Cataloging
•
Cyber Enabled Products
•
Space Situational Awareness Architecture
INTEGRAL SYSTEMS
FUTURE GROWTH ENGINES |
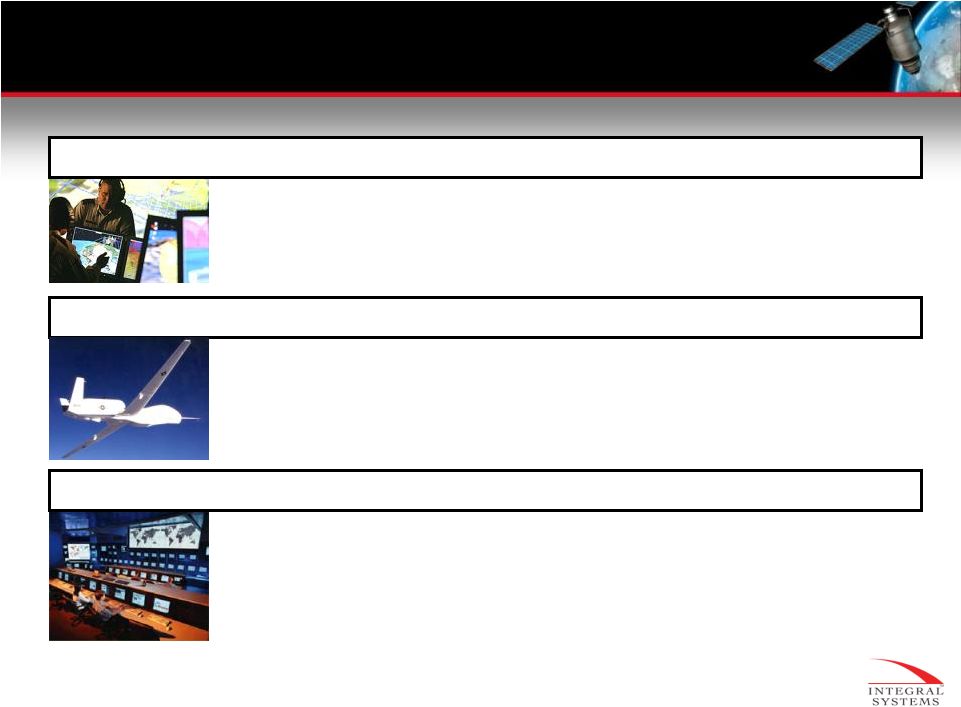 9
Intelligence Programs
•
Satellite
Command
&
Control
(Market
Leader
for
Commercial
Geo
Operations)
•
SATCOM RFI Detection, Characterization, & Geolocation
•
SATCOM Data Link Information Assurance & Cyber Security
Unmanned Aerial Systems (UAS)
•
Common Data Link Test Sets –
We Are the Gold Standard
•
UAS Modems & Communication Systems
•
UAS Flight & Ground RF Interference (RFI) Detection &
Countermeasure Systems
Network Operations Services
•
Global Quality of Service, RFI Detection & Geolocation
Services for
Future COMSATCOM Services Acquisition (FCSA)
•
RFI, Geolocation, & Network Operations Outsourcing for SATCOM
Network Providers
•
SATCOM Data Link Information Assurance & Cyber Security
INTEGRAL SYSTEMS
FUTURE GROWTH ENGINES |
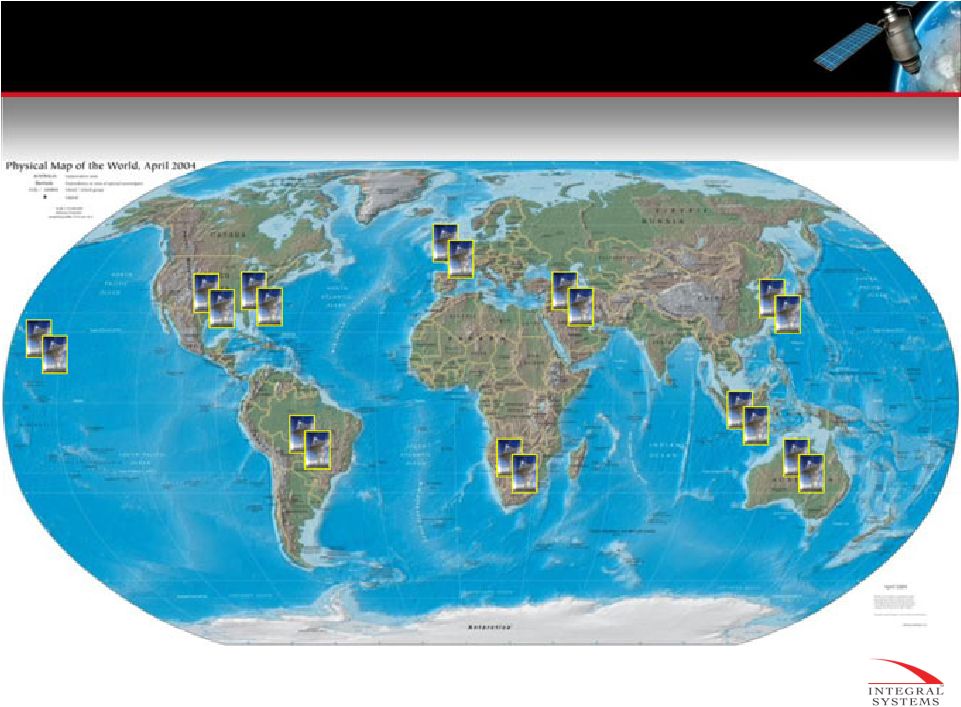 10
INTEGRAL SYSTEMS
GLOBAL SERVICES CAPABILITIES |
    11
FINANCIAL OVERVIEW |
 12
Significant Non-Recurring Expenses
•
Accounting
–
$2.7M Reserve Against DCAA Adjustments
•
Operating
Expenses:
Q3/YTD
–
Acquisition Integration Expenses: $600K/$1.8M
–
Legal Fees: $500K/$850K
–
Staff Reduction: $400K
–
Compliance Fees: $300K/$1.0M
Significant Other Expenses
•
P&L: Non-Cash Stock-Based Compensation
–
$600K/Q through Q411
•
Cash:
Real
Estate:
$1.2M/year
through
2015
–
Reserved through 6/2010
FY10 Investments
•
Integral
Systems
Service
Solutions
(IS3):
$2M
•
SATCOM
Solutions
R&D:
$750K
•
EPICOR
Material
Resource
Planning
System:
$1M
•
Product
Revamp
Newpoint
Technologies:
$300K
REVISED
FY10 GUIDANCE
Revenue
$170M -
$174M
Gross Profit Margin
37% -
39%
EBITDA
$9M -
$12M
Bookings
$170M -
$180M
INTEGRAL SYSTEMS
RECENT DEVELOPMENTS –
IMPACTS TO Q3 & FY10 |
 13
INTEGRAL SYSTEMS
EBITDA RECONCILIATION
2010 FORECAST
VARIANCE
EBITDA (A)
EBITDA (E)
Q1
$
4.0 Total Q1
$
4.0 Q2
$
4.0 M&A -
CVG Integration
$
1.8 Total Q2
$
1.8
$
2.2 Q3
$
6.0 Rate Reserve
$
2.7 CVG Avtec Revenue Miss
$
4.6 CVG Avtec Direct Costs
$
(1.9) Legal Costs
$
0.5 Compliance Costs
$
0.2 Employee Severance
$
0.4 M&A -
CVG Integration
$
0.6 Gross Margin -
Civil, Lumistar
$
0.6 Total Q3
$
7.8
$
(1.8) Q4
$
8.0 CVG Avtec Revenue Reduction
$
2.0 CVG Avtec Direct Costs
$
(0.3) Compliance Costs
$
0.3 Total Q4
$
2.0
$
6.3 Total EBITDA (Variance)
$
22.0
$
11.6 Revised FY2010 EBITDA(E)
$
10.7 |
 14
Key Opportunities
FY10 –
FY12
•
USAF Joint Space Operations Center Mission
Systems
(JSpOC
MS)
High
Accuracy
Catalog
•
USAF
RAIDRS
ECP-009
&
ECP-010
•
Special
Operations
(SOCOM)
Forces
Deployable
Nodelite
(SDN-Lite)
•
USN Military Sealift
Next Generation
Wideband
•
Future COMSATCOM Service Acquisition
(FCSA)
•
Army SMD
Wideband SATCOM Operations &
Technical Service (WSOTS)
•
Intelligence Community
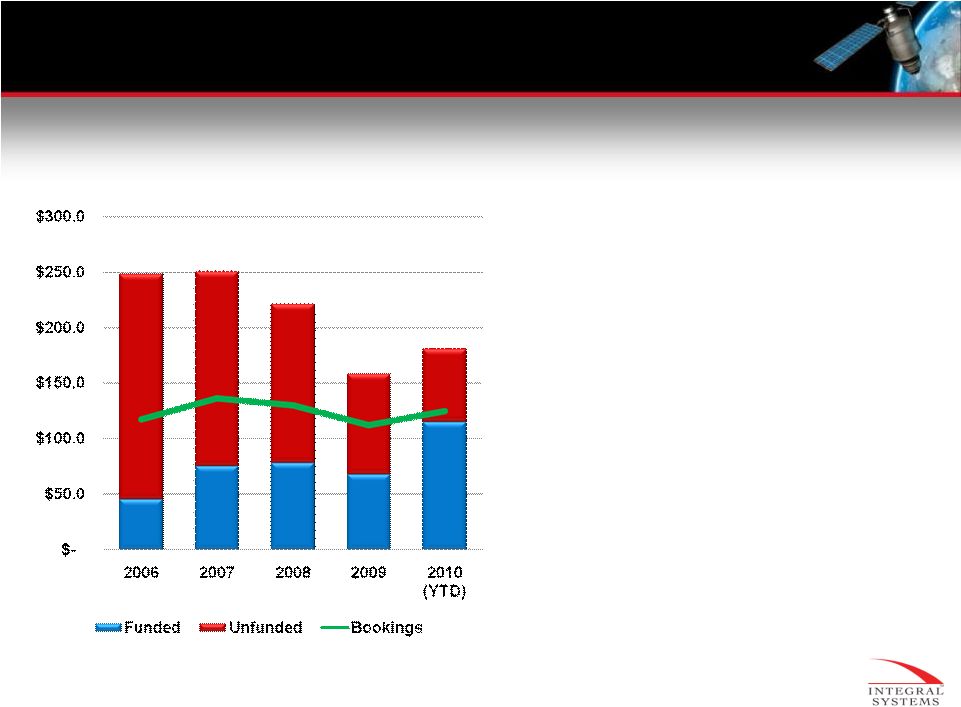
INTEGRAL SYSTEMS
BOOKINGS, BACKLOG, AND PIPELINE
Information reflect Q3 results as reported 8/2/10 |
 15
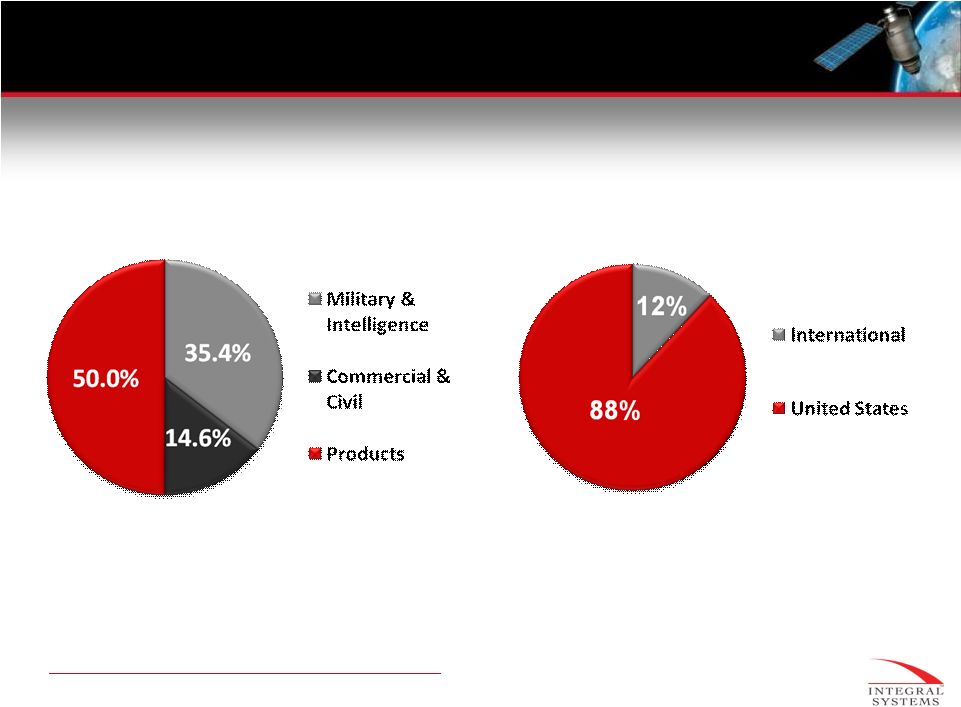
*BASED
UPON
Q3
FY
2010
RESULTS
DOES
NOT
ACCOUNT
FOR
INTERCOMPANY
ELIMINATION
**BASED UPON FY 2009 RESULTS DOES NOT ACCOUNT FOR INTERCOMPANY ELIMINATION
YTD FY10 SALES BY SEGMENT*
INTEGRAL SYSTEMS
YTD FY10 SALES
Information reflect Q3 results as reported 8/2/10
FY 2009 SALES GEOGRAPHY** |
 16
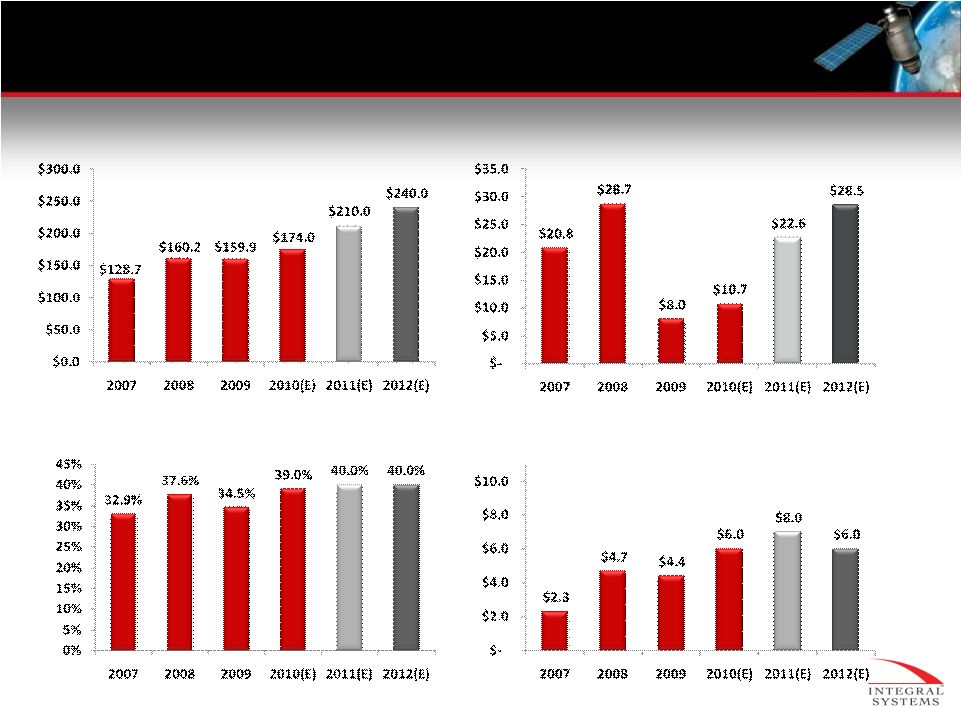
REVENUE
EBITDA
GROSS PROFIT MARGIN
CAPITAL EXPENDITURES
INTEGRAL SYSTEMS
FINANCIAL PERFORMANCE & EXPECTATIONS
Information reflect Q3 results as reported 8/2/10 |
 17
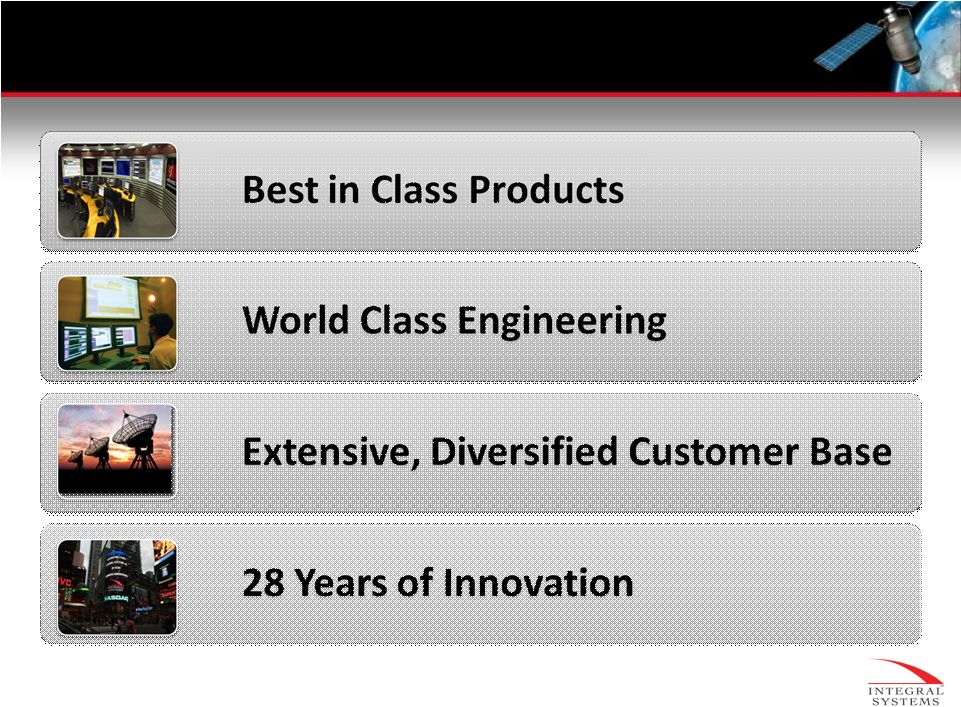
INTEGRAL SYSTEMS
SUMMARY |
 18
BACK UP
INTEGRAL SYSTEMS |
 19
USE OF NON-GAAP FINANCIAL MEASURES
INTEGRAL SYSTEMS
EBITDA
(earnings
before
interest,
taxes,
depreciation
and
amortization)
is
a
non-GAAP
financial
measure
used
by
management
to
evaluate
operating
performance.
Management
believes
that
the
presentation
of
EBITDA
helps
management
and
investors
to
make
a
meaningful
comparison
between
our
operating
results
and
those
of
other
companies,
as
well
as
providing
a
consistent
comparison
of
our
relative
historical
financial
performance.
The
presentation
of
this
non-GAAP
financial
measure
is
not
to
be
considered
in
isolation
or
as
a
substitute
for
our
financial
results
prepared
in
accordance
with
GAAP.
Below
are
reconciliations
of
fiscal
years
2007
-
2012
net
income
to
EBITDA:
2007
2008
2009
2010(E)
2011(E)
2012(E)
($ millions)
Net Income
$ 12.8
$ 18.2
$ 1.1
$ (1.2)
$ 4.1
$ 10.1
Other Income (Expense), net
$ (2.2)
$ (0.3)
$ 0.1
$ 0.9
$ 2.4
$ 1.2
Provision for Income Taxes
$ 6.3
$ 7.1
$ (1.0)
$ 1.1
$ 3.5
$ 5.0
Income From Operations
$ 16.9
$ 25.0
$ 0.2
$ 0.8
$ 10.0
$ 16.3
Non-Cash Stock Compensation
$ 0.9
$ 1.1
$ 3.5
$ 2.6
$ 2.3
$ 1.7
Depreciation and Amortization
$ 3.0
$ 2.6
$ 4.3
$ 7.3
$ 10.3
$ 10.5
EBITDA
$ 20.8
$ 28.7
$ 8.0
$ 10.7
$ 22.6
$ 28.5 |
 20
USE OF NON-GAAP FINANCIAL MEASURES
INTEGRAL SYSTEMS
EBITDA
(earnings
before
interest,
taxes,
depreciation
and
amortization)
is
a
non-GAAP
financial
measure
used
by
management
to
evaluate
operating
performance.
Management
believes
that
the
presentation
of
EBITDA
helps
management
and
investors
to
make
a
meaningful
comparison
between
our
operating
results
and
those
of
other
companies,
as
well
as
providing
a
consistent
comparison
of
our
relative
historical
financial
performance.
The
presentation
of
this
non-GAAP
financial
measure
is
not
to
be
considered
in
isolation
or
as
a
substitute
for
our
financial
results
prepared
in
accordance
with
GAAP.
Below
is
a
reconciliation
for
the
first
three
quarters
of
fiscal
years
2010
and 2009 net
income
to
EBITDA:
Quarter Ended
December 25,
2009
Quarter Ended
March 26,
2010
Quarter Ended
June 25,
2010
Quarter Ended
December 26,
2008
Quarter Ended
March 27,
2009
Quarter Ended
June 26,
2009
($ millions)
Q1 2010
Q2 2010
Q3 2010
Q3 YTD 2010
Q1 2009
Q2 2009
Q3 2009
Q3 YTD 2009
Net Income (Loss)
1.2
0.1
(3.8)
(2.5)
1.0
2.7
(1.5)
2.2
Other income ( Expense)
0.2
(0.1)
(0.3)
(0.5)
0.0
0.0
(0.1)
(0.1)
Provision for income taxes
(Benefit)
0.6
0.3
(1.6)
(0.7)
0.3
1.5
(2.4)
(0.6)
Income from Operations
2.0
0.3
(5.1)
(2.7)
1.3
4.2
(3.8)
1.7
Stock-based compensation
0.6
0.6
0.9
2.1
1.0
0.6
1.0
2.6
Depreciation & Amortization
1.4
1.2
2.4
5.1
0.6
1.0
1.3
2.9
EBITDA
4.0
2.2
(1.8)
4.5
2.9
5.8
(1.5)
7.2 |