Attached files
| file | filename |
|---|---|
| 8-K - FORM 8-K - ENDURANCE SPECIALTY HOLDINGS LTD | c05133e8vk.htm |
Exhibit 99.1

| Investor Presentation 2Q10 |

| 2 Forward looking statements & regulation G disclaimer Safe Harbor for Forward Looking Statements Some of the statements in this presentation include forward-looking statements which reflect our current views with respect to future events and financial performance. Such statements include forward-looking statements both with respect to us in general and the insurance and reinsurance sectors specifically, both as to underwriting and investment matters. Statements which include the words "expect," "intend," "plan," "believe," "project," "anticipate," "seek," "will," and similar statements of a future or forward-looking nature identify forward-looking statements in this presentation for purposes of the U.S. federal securities laws or otherwise. We intend these forward-looking statements to be covered by the safe harbor provisions for forward-looking statements in the Private Securities Litigation Reform Act of 1995. All forward-looking statements address matters that involve risks and uncertainties. Accordingly, there are or may be important factors that could cause actual results to differ from those indicated in the forward-looking statements. These factors include, but are not limited to, the effects of competitors' pricing policies, greater frequency or severity of claims and loss activity, changes in market conditions in the agriculture insurance industry, termination of or changes in the terms of the U.S. multiple peril crop insurance program, a decreased demand for property and casualty insurance or reinsurance, changes in the availability, cost or quality of reinsurance or retrocessional coverage, our inability to renew business previously underwritten or acquired, our inability to maintain our applicable financial strength ratings, our inability to effectively integrate acquired operations, uncertainties in our reserving process, changes to our tax status, changes in insurance regulations, reduced acceptance of our existing or new products and services, a loss of business from and credit risk related to our broker counterparties, assessments for high risk or otherwise uninsured individuals, possible terrorism or the outbreak of war, a loss of key personnel, political conditions, changes in insurance regulation, changes in accounting policies, our investment performance, the valuation of our invested assets, a breach of our investment guidelines, the unavailability of capital in the future, developments in the world's financial and capital markets and our access to such markets, government intervention in the insurance and reinsurance industry, illiquidity in the credit markets, changes in general economic conditions and other factors described in our Annual Report on Form 10-K for the year ended December 31, 2009. Forward-looking statements speak only as of the date on which they are made, and we undertake no obligation publicly to update or revise any forward-looking statement, whether as a result of new information, future developments or otherwise. Regulation G Disclaimer In presenting the Company's results, management has included and discussed certain non-GAAP measures. Management believes that these non-GAAP measures, which may be defined differently by other companies, better explain the Company's results of operations in a manner that allows for a more complete understanding of the underlying trends in the Company's business. However, these measures should not be viewed as a substitute for those determined in accordance with GAAP. For a complete description of non-GAAP measures and reconciliations, please review the Investor Financial Supplement on our web site at www.endurance.bm. The combined ratio is the sum of the loss, acquisition expense and general and administrative expense ratios. Endurance presents the combined ratio as a measure that is commonly recognized as a standard of performance by investors, analysts, rating agencies and other users of its financial information. The combined ratio, excluding prior year net loss reserve development, enables investors, analysts, rating agencies and other users of its financial information to more easily analyze Endurance's results of underwriting activities in a manner similar to how management analyzes Endurance's underlying business performance. The combined ratio, excluding prior year net loss reserve development, should not be viewed as a substitute for the combined ratio. Net premiums written (prior to deposit accounting adjustments) is a non-GAAP internal performance measure used by Endurance in the management of its operations. Net premiums written (prior to deposit accounting adjustments) represents net premiums written and deposit premiums, which are premiums on contracts that are deemed as either transferring only significant timing risk or transferring only significant underwriting risk and thus are required to be accounted for under GAAP as deposits. Endurance believes these amounts are significant to its business and underwriting process and excluding them distorts the analysis of its premium trends. In addition to presenting gross premiums written determined in accordance with GAAP, Endurance believes that net premiums written (prior to deposit accounting adjustments) enables investors, analysts, rating agencies and other users of its financial information to more easily analyze Endurance's results of underwriting activities in a manner similar to how management analyzes Endurance's underlying business performance. Net premiums written (prior to deposit accounting adjustments) should not be viewed as a substitute for gross premiums written determined in accordance with GAAP. Return on Average Equity (ROAE) is comprised using the average common equity calculated as the arithmetic average of the beginning and ending common equity balances for stated periods. Return on Beginning Equity (ROBE) is comprised using the beginning common equity for stated periods. The Company presents various measures of Return on Equity that are commonly recognized as a standard of performance by investors, analysts, rating agencies and other users of its financial information. |

| 3 Investor value proposition Specialty focus and strong diversification has the potential to generate industry leading returns for shareholders, with lower volatility Established a team of experienced specialized underwriters with deep expertise across business units Strong balance sheet supported by conservative investment portfolio and prudent reserving practices Transformed our business over the past five years to markedly improve the risk management and diversification of our business Management team has successfully generated superior returns Successfully executed our strategy to develop a diversified portfolio of specialized business (CHART) Price/Book vs. ROE Endurance Common stock price as a percentage of diluted book value per share as of August 6, 2010 Note: Composite peer median based on SNL data. Includes Allied World, Arch, Ren Re, Axis, Transatlantic, Everest, Partner Re, Montpelier, Platinum, Alterra, ACE, Aspen, Validus, Markel, RLI, W.R. Berkley, XL and Flagstone Endurance offers investors a proven franchise at an attractive valuation |
| 4 Introduction to Endurance Specialty Holdings Founded in 2001 Focused on the creation of shareholder value through the building and management of a diversified portfolio of specialized businesses Strong Market Positioning Widely diversified, global specialty insurance and reinsurance provider Over 780 employees in offices across the United States, Bermuda, Europe, and Asia Domiciled in Bermuda Solid Financial Foundation Excellent financial strength with nearly $8.5 BN in assets, $3.4 BN in total capital and $2.8 BN in shareholders' equity as of June 30, 2010 High quality (average rating of AA+), short duration (2.19 years), liquid investment portfolio Prudent loss reserves (67.7% of reserves are IBNR) Rated "A" by A.M. Best and Standard and Poor's and A2 by Moody's with stable outlooks Received the highest ERM ranking of "Excellent" from Standard and Poor's Excellent historical financial results Inception to date annualized operating ROE of 14.4% 21.3% average annualized growth in book value per share plus dividends since inception |

| 5 2010 Highlights Operating earnings of $57.7 million for the second quarter, $117.9 million year to date Operating return on equity of 8.2% for the second quarter and 8.4% year to date Book value per common share grew 4.1% during the quarter, and has increased 7.1% since year end Returned $82.6 million to investors through common dividends and share repurchases in the second quarter and $144.6 million year to date Generated a combined ratio of 91.0% in the second quarter and 93.8% year to date Net written premiums of $450.8 million, a decline of 6.1% over second quarter 2009 Reinsurance net written premiums of $255.8 million shrank 21.6% in the quarter Reduction in catastrophe lines due to reduced limits and pricing declines Decline in casualty premiums due to non-renewal of contracts that no longer met profitability targets and one large contract where the renewal was moved to the third quarter Insurance net written premiums of $195.0 million grew 26.8% in the quarter Growth in agriculture premiums driven by retaining more business on a net basis Growth in U.S. property and casualty lines of business as less external reinsurance purchased Year to date net written premiums of $1.2 billion increased 8.5% from a year ago |
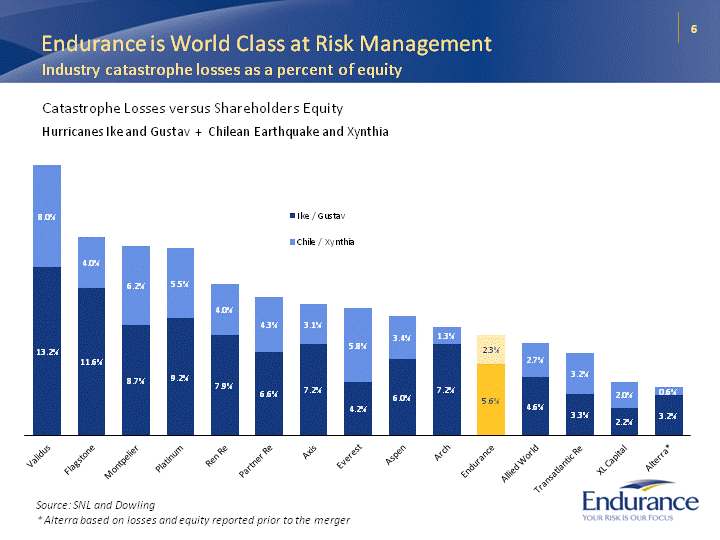
| 6 Endurance is World Class at Risk Management Industry catastrophe losses as a percent of equity Catastrophe Losses versus Shareholders Equity Hurricanes Ike and Gustav + Chilean Earthquake and Xynthia (CHART) Source: SNL and Dowling * Alterra based on losses and equity reported prior to the merger |

| 7 Our results Summary Strong return to shareholders 21.3% inception to date total return, measured by annual change in diluted book value per share plus dividends over beginning book value per share Superior returns on equity 15.5% 3 year average annual operating ROE from third quarter 2007 through second quarter 2010, and better than peer median throughout the cycle 14.4% inception to date average annual operating ROE Exceptional underwriting performance Inception to date combined ratio of 91.0% June 30th year to date 2010 impacted by higher industry catastrophe events, however impact lower for Endurance on a relative basis Disciplined capital management approach exemplified by Attractive dividend yield of ~3-4% Approximately $1.3 billion of capital returned to shareholders since inception |
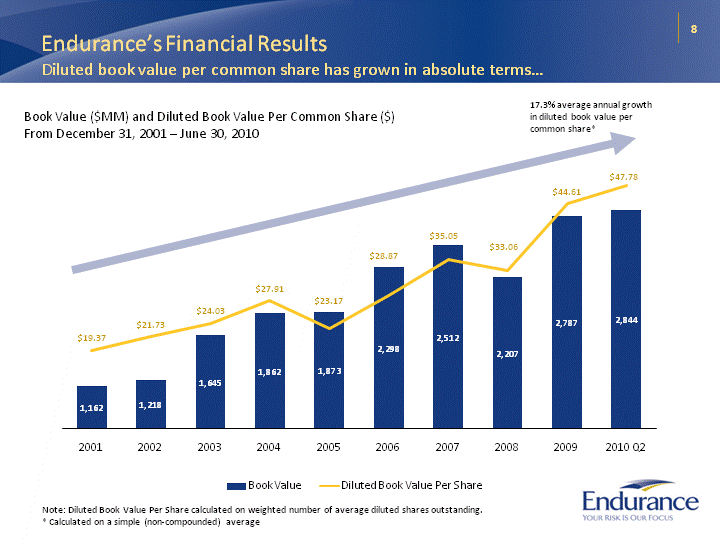
| 8 Endurance's Financial Results Diluted book value per common share has grown in absolute terms... Book Value ($MM) and Diluted Book Value Per Common Share ($) From December 31, 2001 - June 30, 2010 (CHART) Note: Diluted Book Value Per Share calculated on weighted number of average diluted shares outstanding. * Calculated on a simple (non-compounded) average 17.3% average annual growth in diluted book value per common share* |

| 9 Endurance's Financial Results Book value per common share has also grown on a relative basis Book Value Per Share Plus Dividend Growth From December 31, 2006 - June 30, 2010 (CHART) Note: Book value per share and dividend data provided by SNL |

| 10 (CHART) Operating ROE(%)1 From 2002-2Q 2010 1. ROE is defined as 3-yr rolling average operating ROAE 2. Composite peer median based on SNL data. Includes Allied World, Arch, Ren Re, Axis, Transatlantic, Everest, PartnerRe, Platinum, Montpelier and Alterra Impact of Hurricanes Gustav and Ike and mark to market accounting impact from investment portfolio Impact of Hurricanes Katrina, Rita, and Wilma claims Endurance ENH 3-year rolling average ROE Median peer 2 3-year rolling average ROE First year after inception; capital not yet fully deployed Our results We have outperformed peers throughout the cycle1 15.5% 13.3% Impact of Chile earthquake and European windstorm Xynthia |

| 11 Our strategy is focused on delivering superior returns to shareholders through specialization Our commitments to Investors Growth in book value Ethics, integrity, and transparency |
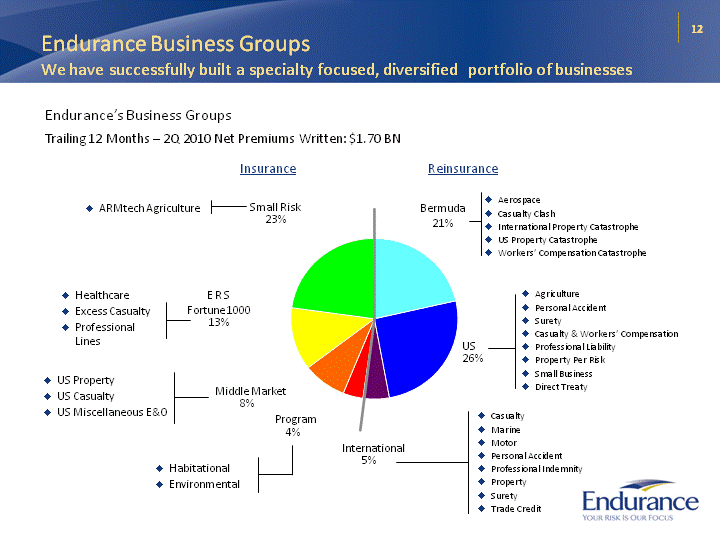
| 12 Endurance Business Groups We have successfully built a specialty focused, diversified portfolio of businesses Endurance's Business Groups Trailing 12 Months - 2Q 2010 Net Premiums Written: $1.70 BN Reinsurance Insurance Agriculture Personal Accident Surety Casualty & Workers' Compensation Professional Liability Property Per Risk Small Business Direct Treaty Aerospace Casualty Clash International Property Catastrophe US Property Catastrophe Workers' Compensation Catastrophe ARMtech Agriculture US Property US Casualty US Miscellaneous E&O Healthcare Excess Casualty Professional Lines Habitational Environmental International 5% E R S Fortune 1000 13% Middle Market 8% 23% Bermuda 21% US 26% Program 4% Casualty Marine Motor Personal Accident Professional Indemnity Property Surety Trade Credit Small Risk |
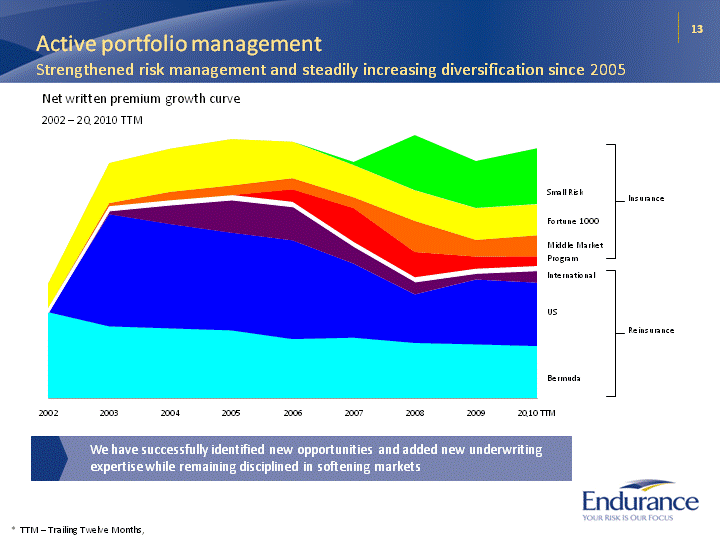
| 13 Active portfolio management Strengthened risk management and steadily increasing diversification since 2005 (CHART) Net written premium growth curve 2002 - 2Q 2010 TTM Small Risk Program Middle Market International Fortune 1000 US Bermuda Reinsurance Insurance We have successfully identified new opportunities and added new underwriting expertise while remaining disciplined in softening markets * TTM - Trailing Twelve Months, |

| 14 Active portfolio management Reinsurance book has reduced due to cycle management but is highly scalable (CHART) $1,375.0 $1,023.0 We have demonstrated discipline in writing reinsurance business as evidenced by the overall portfolio shrinking 35% since 2005 while at the same time maintaining our high margin catastrophe premiums and thoughtfully expanding in select geographies (Zurich, Singapore and Kansas City) Managing the reinsurance portfolio Active portfolio management has enhanced reinsurance portfolio: Lines of business have been actively reduced where pricing, terms or data quality have not met our requirements Casualty has declined 32% from its peak Property has declined 40% since its peak Aerospace and Marine has declined 80% from its peak We have maintained our underwriting expertise and are well positioned to grow as opportunities arise Reinsurance net premiums written $865.7 $803.7 $1,327.9 $888.8 (millions) |
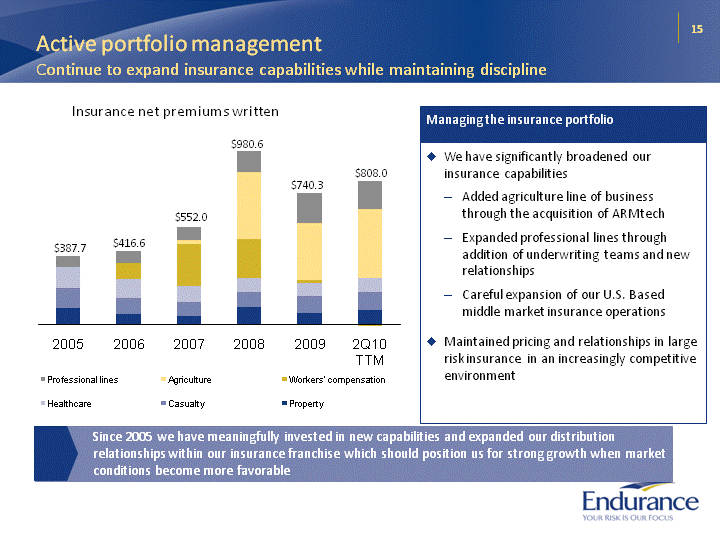
| 15 Active portfolio management Continue to expand insurance capabilities while maintaining discipline (CHART) $387.7 $980.6 Since 2005 we have meaningfully invested in new capabilities and expanded our distribution relationships within our insurance franchise which should position us for strong growth when market conditions become more favorable Managing the insurance portfolio We have significantly broadened our insurance capabilities Added agriculture line of business through the acquisition of ARMtech Expanded professional lines through addition of underwriting teams and new relationships Careful expansion of our U.S. Based middle market insurance operations Maintained pricing and relationships in large risk insurance in an increasingly competitive environment Insurance net premiums written $740.3 $552.0 $416.6 $808.0 |

| 16 Active portfolio management Acquired ARMtech in late 2007 - a highly specialized crop insurance company (CHART) ARMtech provides Endurance with a stable, diversifying book of business that is not impacted by market cycle pressures and benefits from an inflationary market ARMtech has delivered strong results since the acquisition Since acquiring ARMtech we have significantly invested in growing the business. Added marketing staff More than doubled the claims staff Expanding the agent base Since the acquisition, ARMtech has earned $845 million of net premiums and generated an underwriting ratio of 87.4% We believe changes to the standard reinsurance agreement will present an opportunity for ARMtech Lower A&O expense reimbursement will be largely offset by reduced agent commissions Concentration in group 2 and 3 states offsets margin reductions in group 1 states Strong technology, claims handling and compliance position ARMtech to continue gaining market share ARMtech NWP and Policy Counts Net Written Premiums (In millions) Policies |
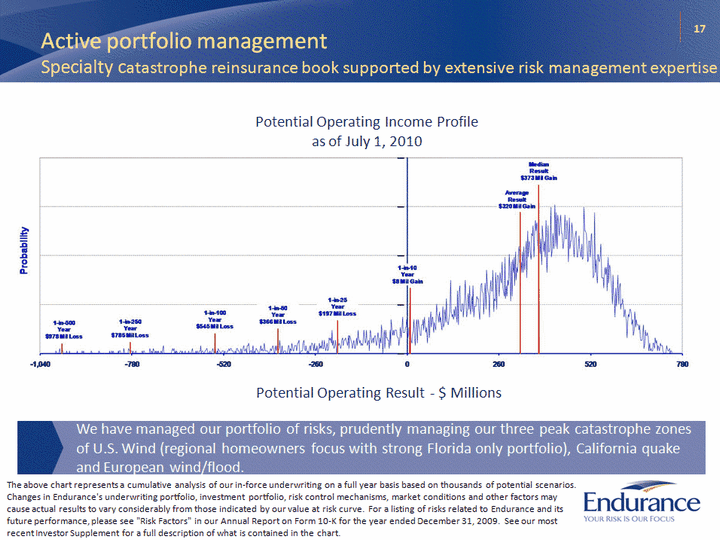
| 17 Active portfolio management Specialty catastrophe reinsurance book supported by extensive risk management expertise We have managed our portfolio of risks, prudently managing our three peak catastrophe zones of U.S. Wind (regional homeowners focus with strong Florida only portfolio), California quake and European wind/flood. The above chart represents a cumulative analysis of our in-force underwriting on a full year basis based on thousands of potential scenarios. Changes in Endurance's underwriting portfolio, investment portfolio, risk control mechanisms, market conditions and other factors may cause actual results to vary considerably from those indicated by our value at risk curve. For a listing of risks related to Endurance and its future performance, please see "Risk Factors" in our Annual Report on Form 10-K for the year ended December 31, 2009. See our most recent Investor Supplement for a full description of what is contained in the chart. |
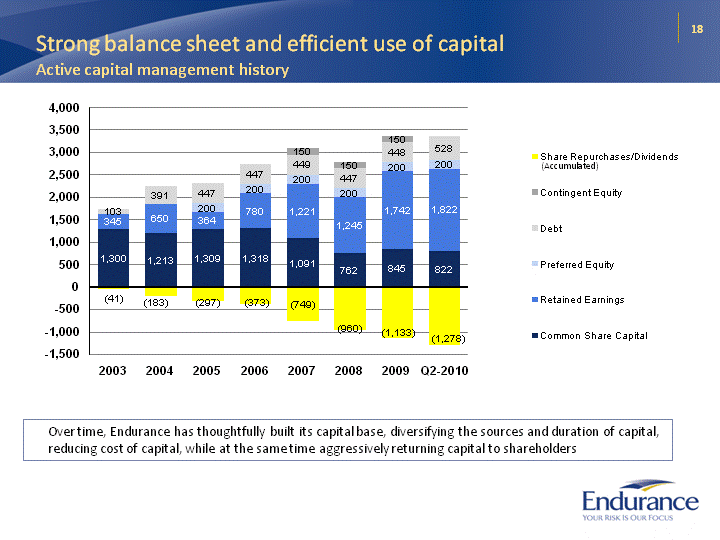
| (CHART) 18 Over time, Endurance has thoughtfully built its capital base, diversifying the sources and duration of capital, reducing cost of capital, while at the same time aggressively returning capital to shareholders Strong balance sheet and efficient use of capital Active capital management history (Accumulated) |
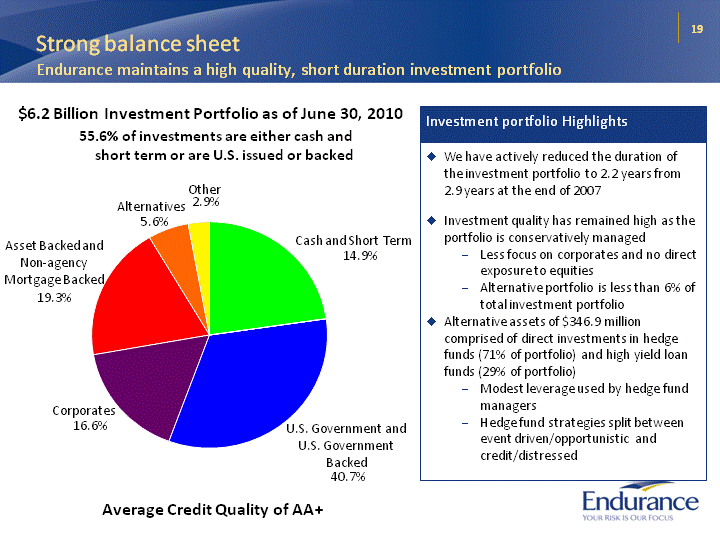
| 19 Strong balance sheet Endurance maintains a high quality, short duration investment portfolio Average Credit Quality of AA+ Investment portfolio Highlights We have actively reduced the duration of the investment portfolio to 2.2 years from 2.9 years at the end of 2007 Investment quality has remained high as the portfolio is conservatively managed Less focus on corporates and no direct exposure to equities Alternative portfolio is less than 6% of total investment portfolio Alternative assets of $346.9 million comprised of direct investments in hedge funds (71% of portfolio) and high yield loan funds (29% of portfolio) Modest leverage used by hedge fund managers Hedge fund strategies split between event driven/opportunistic and credit/distressed Cash and Short Term 14.9% U.S. Government and U.S. Government Backed 40.7% Other 2.9% Alternatives 5.6% Asset Backed and Non-agency Mortgage Backed 19.3% Corporates 16.6% $6.2 Billion Investment Portfolio as of June 30, 2010 55.6% of investments are either cash and short term or are U.S. issued or backed |

| Conclusion Endurance is a compelling investment opportunity Endurance offers investors..... Strong franchise positions in attractive specialty markets Globally diversified portfolio of insurance and reinsurance units operated with deep and distinctive expertise Superior distribution capabilities with strong access to independent agent, middle market and retail distribution networks Active portfolio management actions have maintained strong risk adjusted return potential while reducing overall volatility Excellent balance sheet strength and liquidity High quality short duration portfolio has an average credit quality of AA+ Prudent reserving philosophy and strong reserve position; Strong history of favorable development Industry leading ERM The outlook for Endurance's key areas of specialization remain attractive Agriculture business is price controlled and returns may be enhanced in an inflationary environment Catastrophe lines have remained disciplined and profitable Profitable niches within specialty lines exist Endurance's share price value Endurance is currently trading at a discount to book, despite strong absolute and relative performance and strong market positioning 20 |

| Appendix |

| 22 Growth through specialization We have a strong track record of entering new businesses to meet our strategic aims Buy Build Partner 2008 2006 2001 2002 2003 2004 2005 2007 Acquired LaSalle portfolio Acquired HartRe Acquired ARMtech Partnered with leading California workers' comp provider Acquired XL Surety reinsurance Established US reinsurance Established UK/Europe reinsurance Established Fortune 1000 insurance Established UK Middle Market insurance Established US Middle Market insurance Established Agriculture reinsurance Partnered with leading environmental contractor provider Established operations Partnered with leading habitational risk provider Established catastrophe reinsurance 2009 Established Zurich Office Established Singapore Office |

| 23 Balance sheet strength and durability Our commitment to ERM supports superior performance Best-in-class ERM Optimally manage capital and risks Manage towards a required return on risk-adjusted capital Quantify risks taken and limit ones that threaten solvency/viability Clearly defined risk tolerances and controls Asset management: approach incorporates capital-at-risk limits, stress testing and ratings triggers Liability management Concentration management Delegated authorities Strong governance structure Senior management understands and values ERM as a source of competitive advantage Board of Directors highly skilled in insurance and finance Corporate culture Ownership mentality Transparency and communication of ERM strategies "Excellent" ERM rating by S&P in 2008, affirmed in 2009 Youngest company and one of only five P&C companies in the world to achieve the highest designation |

| 24 Business organization and competitive advantages Each of our businesses are led by industry leading professionals with market expertise and maintain the following sources of competitive advantage Endurance Insurance 48%* Middle Market Small Risk Program Bermuda US Fortune 1000 International Reinsurance 52%* Diverse mix of access to exposure, split between insurance and reinsurance, and across customer segments Service and technology-based distribution strategy Strong local presences Strong product development Cost-efficient production Professional team with extremely strong underwriting experience Long-term relationships (over 20 years) with key brokers Very strong reinsurance relationships Individual risk underwriting model, as opposed to market share approach Very low historical loss ratio based on superior underwriting Deep distribution management capabilities Utilize technology to enhance control environment Multi-disciplined teams of professionals dedicated to program management and oversight Access to business through combination of insurance and reinsurance networks 3-pronged underwriting approach Specialized Relationship- based Opportunistic Dedicated professional teams with skills tailored to each approach Face-to-face service model and access to global network of clients Industry leading underwriting margins Aggressive portfolio management Industry leading technology and modeling Distinctive footprint and lean underwriting approach vs. most Bermuda competitors Shifting focus of business to Zurich and Singapore Strong local market presence with experienced professionals * TTM - Trailing Twelve Months |
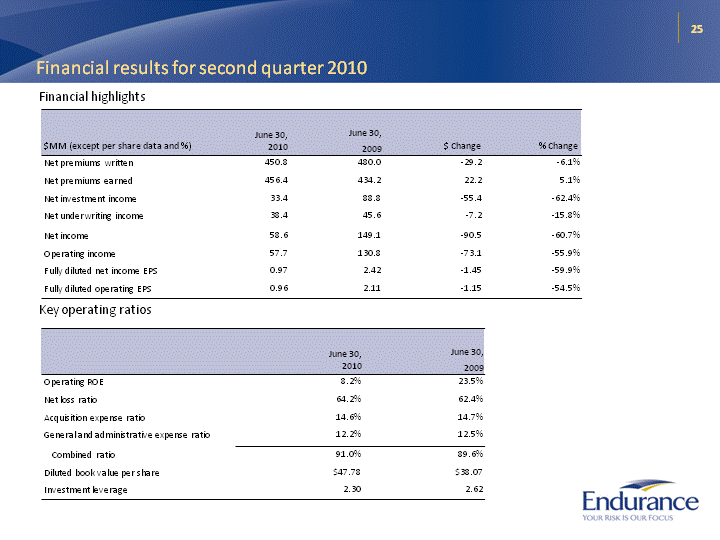
| 25 Financial results for second quarter 2010 $MM (except per share data and %) June 30, 2010 June 30,2009 $ Change % Change Net premiums written 450.8 480.0 -29.2 -6.1% Net premiums earned 456.4 434.2 22.2 5.1% Net investment income 33.4 88.8 -55.4 -62.4% Net underwriting income 38.4 45.6 -7.2 -15.8% Net income 58.6 149.1 -90.5 -60.7% Operating income 57.7 130.8 -73.1 -55.9% Fully diluted net income EPS 0.97 2.42 -1.45 -59.9% Fully diluted operating EPS 0.96 2.11 -1.15 -54.5% Financial highlights June 30, 2010 June 30,2009 Operating ROE 8.2% 23.5% Net loss ratio 64.2% 62.4% Acquisition expense ratio 14.6% 14.7% General and administrative expense ratio 12.2% 12.5% Combined ratio 91.0% 89.6% Diluted book value per share $47.78 $38.07 Investment leverage 2.30 2.62 Key operating ratios |

| 26 Second quarter 2010 net written premiums In $MM June 30, 2010 June 30,2009 $ Change % Change Property 41.0 22.1 18.9 85.5% Casualty 37.5 28.3 9.2 32.5% Healthcare liability 22.0 22.9 -0.9 -3.9% Workers' compensation -0.1 -2.6 2.5 -96.2% Agriculture 45.2 28.7 16.5 57.5% Professional lines 49.4 54.4 -5.0 -9.2% Total insurance 195.0 153.8 41.2 26.8% Insurance Segment In $MM June 30, 2010 June 30,2009 $ Change % Change Casualty 56.8 83.8 -27.0 -32.2% Property 40.0 55.2 -15.2 -27.5% Catastrophe 123.8 148.4 -24.6 -16.6% Aerospace and marine 22.1 21.5 0.6 2.8% Surety and other specialty 13.1 17.3 -4.2 -24.3% Total reinsurance 255.8 326.3 -70.5 -21.6% Reinsurance Segment |

| 27 Financial overview: historical In $MM 2002 2003 2004 2005 2006 2007 2008 2009 2Q 2010 YTD 2002 through 2Q 2010 Net premiums written 765 1,598 1,697 1,619 1,586 1,575 1,784 1,606 1,154 13,384 Net premiums earned 369 1,174 1,633 1,724 1,639 1,595 1,766 1,633 822 12,354 Net underwriting income 51 179 232 (410) 304 322 111 265 48 1,102 Net investment income 43 71 122 180 257 281 130 284 90 1,457 Net income before preferred dividend 102 263 355 (220) 498 521 99 536 114 2,270 Net income available to common shareholders 102 263 356 (223) 483 506 83 521 107 2,197 Diluted EPS $1.73 $4.00 $5.28 ($3.60) $6.73 $7.13 $1.31 $8.69 $1.88 $24.46 Financial highlights from 2002 through second quarter 2010 Key operating ratios 2002 2003 2004 2005 2006 2007 2008 2009 2Q 2010 Inception-to-date Combined ratio 86.2% 84.7% 85.8% 123.5% 81.5% 79.9% 93.5% 84.0% 91.0% 91.0% Operating ROE 7.8% 17.3% 19.9% (11.9%) 25.7% 23.8% 8.5% 22.0% 8.2% 14.4% Book value per share $21.73 $24.03 $27.91 $23.17 $28.87 $35.05 $33.06 $44.61 $47.78 |

| 28 Underwriting results have been strong Underwriting results have been strong Inception to Date Underwriting Ratio Inception to Date Consolidated Underwriting Ratio is 79.6% Underwriting Ratio Inception to Date Net Written Premium (in millions): $786 $2,375 $611 $534 $726 $318 $678 $663 $1,040 $2,395 $2,326 $552 $381 |
