Attached files
| file | filename |
|---|---|
| 8-K - FORM 8-K - BROCADE COMMUNICATIONS SYSTEMS INC | d8k.htm |
| EX-99.1 - PRESS RELEASE - BROCADE COMMUNICATIONS SYSTEMS INC | dex991.htm |
 Q3 FY 2010 EARNINGS
August 18, 2010
Exhibit 99.2 |
| Prepared comments provided by Rob Eggers, Investor Relations
Thank you for your interest in Brocade’s Q3 Fiscal 2010 earnings presentation,
which includes prepared remarks, slides, and a press release detailing fiscal
third quarter 2010 financial results. The press release was issued shortly after 1:00 p.m. Pacific
time on August 18, 2010, via Business Wire and First Call. The press release, along
with these prepared comments and slides, has
been
made
available
on
Brocade’s
Investor
Relations
website
at
www.BRCD.com
and
has
been
furnished
to
the
SEC
on
Form 8-K.
©
2010 Brocade Communications Systems, Inc.
Page 1
of 42 |
| Cautionary Statements and Disclosures
This presentation includes forward-looking statements regarding
Brocade’s financial results, plans and business outlook as well as
worldwide IT spending, which are only predictions and involve risks and
uncertainties such that actual results may vary significantly. These and
other risks are set forth in more detail in our Form 10-Q for the
fiscal quarter ended May 1, 2010 and our Form 10-K for the fiscal
year ended October 31, 2009. These forward-looking statements reflect
beliefs, assumptions, outlook, estimates and predictions as of today, and
Brocade expressly assumes no obligation to update any such
forward-looking statements. In addition, this presentation includes
various third party estimates regarding the total available market and
other measures, which do not necessarily reflect the view of Brocade.
Further, Brocade does not guarantee the accuracy or reliability of any
such information or forecast. Certain
financial
information
is
presented
on
a
non-GAAP
basis.
The
most
directly
comparable
GAAP
information
and
a
reconciliation
between
the
non-GAAP
and
GAAP
figures
are
provided
in
the
accompanying
press
release,
which
has
been
furnished
to
the
SEC
on
Form
8-K
and
posted
on
Brocade’s
website,
and
is
included
in
the
appendix
to
this
presentation.
Please see risk factors on Forms 10-K and 10-Q filed with the SEC
|
| ©
2010 Brocade Communications Systems, Inc.
Page 2
of 42
*
*
* |
 Agenda
Prepared comments followed by live Q&A call
Richard Deranleau
CFO
Mike Klayko
CEO |
| Today’s
prepared
comments
include
remarks
by
Mike
Klayko,
Brocade’s
CEO,
regarding
the
company’s
quarterly
results,
its
strategy
and
a
review
of
operations,
as
well
as
industry
trends
and
market/technology
drivers
related
to
its
business;
and
by
Richard
Deranleau,
Brocade’s
CFO,
who
will
provide
a
financial
review.
A
live
question-and-answer
conference
call
will
be
webcast
beginning
at
2:30
p.m.
Pacific
time
on
August
18
th
at
www.BRCD.com
and
will
be
archived
on
Brocade’s
Investor
Relations
website
for
approximately
12
months.
Participants
are
invited
to
submit
questions
via
email
at
ir@brocade.com
up
to
30
minutes
prior
to
the
conference
call
and
to
ask
live
questions
during the call.
©
2010 Brocade Communications Systems, Inc.
Page 3
of 42 |
 Fiscal 2010: Q3 Earnings
Mike Klayko, CEO
*
*
* |
| Prepared comments provided by Mike Klayko, CEO
©
2010 Brocade Communications Systems, Inc.
Page 4
of 42 |
 Q3 Executive Summary
Q3 Results
•
$503.5M revenues
•
$0.13 non-GAAP EPS*
Storage Area Networking (SAN)
•
Revenue performance ahead of
typical seasonality
•
SAN switch revenue grew 20%
Qtr./Qtr.
Ethernet
•
Sequential growth in EMEA, APAC,
and Americas (excluding Federal)
•
Federal up 15% Yr./Yr.
Solid performance across diversified business model
* Note: Non-GAAP, please see GAAP reconciliation in appendix
|
| Brocade reported Q3 revenues of $503.5M demonstrating the value of our
diversified business model across geographies, technology
segments
and
multiple
go-to-market
routes.
In
terms
of
business
segments,
we
performed
better-than-expected
in
storage
area
networking
(SAN)
with
switch
revenue
growing
double
digits
sequentially
in
what
is
typically
a
seasonally
challenging quarter. Our overall Ethernet business was slightly down sequentially
primarily due to softness in Japan and our Federal business, which was down
16% from a strong performance in Q2, while up 15% year-over-year.
There were a number of positive signs in our Ethernet business, as Americas
(excluding Federal), APAC and EMEA all grew sequentially. Another positive
sign comes from our net new Ethernet accounts which grew by 290 in Q3 10 and are beginning
to generate a larger portion of our revenues. These trends are noteworthy as they
indicate that our Ethernet business growth strategy is working in the areas
where we have focused our investments. I’ll cover our Ethernet business in greater detail in
the next two sections.
Other
key
Q3
financial
metrics
include
non-GAAP
EPS
(diluted)
of
$0.13
and
GAAP
EPS
(diluted)
of
$0.05,
for
the
quarter.
©
2010 Brocade Communications Systems, Inc.
Page 5
of 42 |
 Ethernet Initiatives Update
Hiring Goals:
•
Recruited top talent from
networking industry
•
Met Q3 hiring goals for field and
inside sales
EMEA Leadership:
•
Alberto Soto
•
Former VP of EMEA at HP ProCurve
•
Significant channel and end-user
expertise
GSI:
•
Andy Vandeveld
•
Extensive IP networking experience
•
Led IBM alliance at major competitor |
| Looking in more detail at Brocade’s Ethernet business, we continued
to execute well on our key initiatives to accelerate end- user demand and
increased our account footprint and penetration with our robust portfolio of Ethernet products.
Key
highlights
this
quarter
include
our
ability
to
recruit
top
talent
from
the
networking
industry
and
reaching
our
hiring
goals
for
our field and inside sales teams for Q3. Because of their relevant networking
expertise and industry knowledge, these individuals have already had a
positive impact and are expected to ramp their productivity in subsequent quarters.
We are also adding top talent to deepen the strength of our executive bench. In
June, we announced that Alberto Soto, former VP and general manager of EMEA
for HP ProCurve, joined Brocade as head of our EMEA sales. We also added executive
talent
to
drive
our
Global
Systems
Integrator
(GSI)
strategy/business
with
the
addition
of
Andy
Vandeveld
who
has
extensive
experience in the networking industry. This is an increasingly strategic
route-to-market for Brocade as indicated by industry estimates
from
firms
such
as
IDC
who
predicts
that
spending
on
GSIs
will
exceed
$103
billion
USD
globally
in
this
year
alone.
©
2010 Brocade Communications Systems, Inc.
Page 6
of 42 |
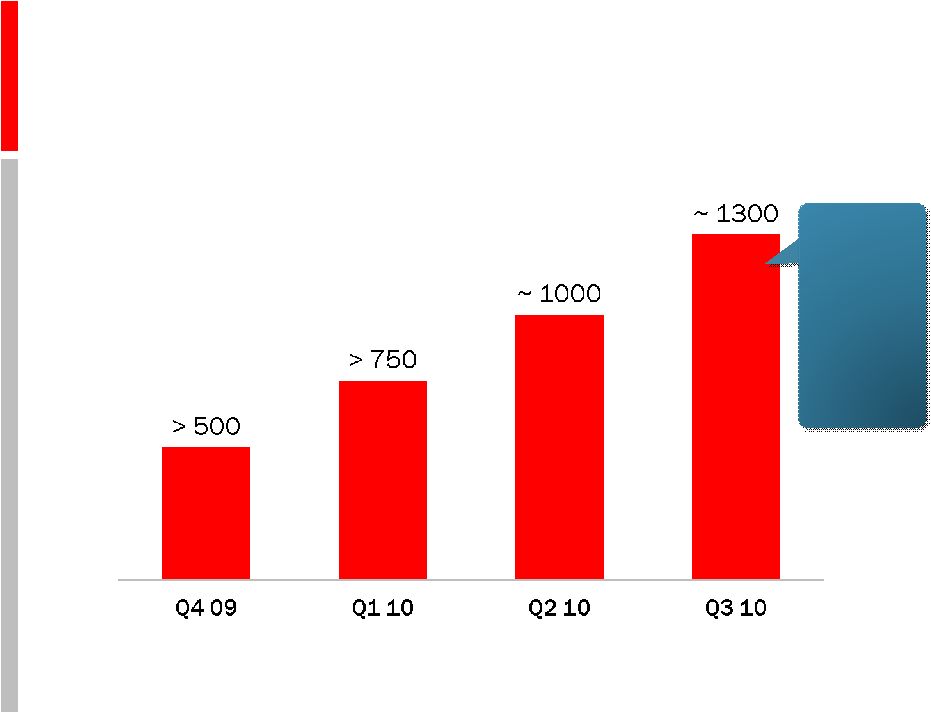    Ethernet Customer Account Penetration
Cumulative new Ethernet accounts
Highest
revenue
contribution
from new
accounts
since
Foundry
acquisition |
| We continue to make good headway in winning net-new enterprise
Ethernet accounts since the acquisition of Foundry. Exiting last quarter we
had a total of more than 1000 net new Ethernet customers. In Q3 we added 290 net-new accounts giving us a
running total of nearly 1300. These net-new accounts in Q3 contributed the
highest revenue than any other quarter since the acquisition of Foundry in Q1
09. Americas led the way in Q3 by adding 170 new accounts, which exceeded the entire worldwide
new accounts that were added in Q3 09. Additionally, we’re seeing other
positive trend lines in key metrics such as repeat purchases among new
accounts. In
addition,
as
of
Q3,
we
are
also
pleased
to
note
that
at
least
15%
of
the
Brocade
customers
in
the
Global
500/Fortune
1000
list purchased our Ethernet products in the last 18 months.
©
2010 Brocade Communications Systems, Inc.
Page 7
of 42 |
  Technology Day 2010
Enthusiastic
response
to
Brocade
One
TM
and
innovations |
| We were also pleased with the enthusiastic response from customers,
partners, global press and analysts to the launch of Brocade
One™
and
our
next-generation
Ethernet
fabric
technology
strategy
at
our
Technology
Day
in
June.
Brocade
One
is
our
unifying network architecture and strategy designed to help customers transition
seamlessly to highly virtualized infrastructures where information and
services are available in the cloud. The positive response provides us with a growing confidence that
we
are
on
the
right
track
in
terms
of
our
overall
Ethernet
business
and
strategy.
Brocade
One
encompasses
our
core
value
propositions
we
believe
should
be
inherently
designed
into
networks:
unmatched
simplicity,
investment
protection,
non-stop
networking,
and
optimized
applications.
Leveraging
Brocade
One
are
the
innovations
we
unveiled
at
Technology
Day:
Virtual
Cluster
Switching
(VCS),
Virtualization
Access
Layer
(VAL)
and
Automated
Port
Profile
Migration
(AMPP).
These
highly
advanced,
foundational
technologies
will
make
Brocade
networks
simpler
to
operate
and
highly
tuned
to
perform
in
virtualized
data
center
environments.
There is no question that server virtualization is one of the most important and
transformational technologies in IT today. According to a recent customer
survey, virtualization is at the top of the list of network infrastructure investments, with close to
40% of customers citing that they would move more than half of their production
applications to virtual machines in the next 18 months.
©
2010 Brocade Communications Systems, Inc.
Page 8
of 42 |
 Technology Day—Positive Reactions
Brocade One in the news
Long term, what Brocade was talking about
was where Cisco needs to get.
–Zeus Kerravala
”
“
Brocade Communications…
is promoting the concept of
a converged architecture for cloud-ready data centers.
–J. Bonasia
”
“
The network is the data center…
Brocade beat Juniper to the punch today.
–Craig Matsumoto
”
“
Brocade comes out of the networking shadows
and delivers a vision.
–Andre Kindness
“
” |
| Brocade One and these innovations align our technology strategies and
investments tightly with customer imperatives and key trends. In this slide
you can see some selected comments about our Technology Day announcements from press and
analysts.
©
2010 Brocade Communications Systems, Inc.
Page 9
of 42 |
 Brocade 1020 CNA
Product Innovation and Recognition
Brocade One delivering leading products today
Rated Best
Performing CNA
Brocade DCX Backbone
8 Gb/sec 64-port FC Blade
MLX 8×10 GbE Blade
10 GbE Converged
Network Adapter
Brocade MLX |
| Brocade
One
not
only
serves
as
our
strategy
for
future
products,
it
is
also
core
to
the
products
we’re
delivering
today.
For
example,
in
Q3
we
extended
our
industry
leadership
in
terms
of
price/
performance
and
network
scalability
through
the
introduction
of
the
8-Port
10
Gigabit
Ethernet
Module
for
the
Brocade
NetIron
MLX
Series
for
both
our
data
center
and
service
provider customers. We have been pleased with the strong customer demand for these
new modules, an indication that many customers are upgrading their networks
to meet constantly increasing demands in terms of network traffic and bandwidth.
Had
it
not
been
for
supply
constraints
that
are
typical
of
new
product
introductions,
our
Ethernet
business
performance
would
have been stronger this quarter.
On
the
Fibre
Channel
side,
we
introduced
the
64-Port
8
Gigabit
Fibre
Channel
blade
for
the
Brocade
DCX
Backbone.
This
new
blade
offers
industry-leading
wire-speed
performance
and
density
to
address
increasing
traffic
in
service
provider
networks
and
booming
server
virtualization
adoption
in
data
centers.
And
it
reinforces
Brocade’s
commitment
to
non-stop
networking
while
also
preserving
customers’
investments
in
their
existing
infrastructures,
which
are
both
Brocade
One
principles.
Additionally, we received important third-party recognition for our 10 Gigabit
Ethernet Converged Network Adapters (CNAs), a critical component of our
end-to-end data center networking architecture. Specifically, IT Brand Pulse declared that the
Brocade CNAs
performed better and offered the easiest migration paths in real-world
applications and IT scenarios compared to every other major competitor in
existence today. ©
2010 Brocade Communications Systems, Inc.
Page 10
of 42 |
   Brocade DCX–4S
Brocade Encryption Switch
Industry Recognition for Innovation
Brocade continues to show product leadership
Brocade NetIron CER 2000 Routers
Brocade FastIron Series Switches |
| Other third parties are taking note of Brocade’s product quality and
innovation. In Q3 Brocade products netted major industry awards from various
companies and publications including: •Communications
Solutions
Product
of
the
Year
Award
for
the
Brocade
NetIron
CER
2000
Routers
•Carrier
Infrastructure
Best
of
Show
Award
at
Interop
Tokyo
2010
also
for
the
Brocade
NetIron
CER
2000
Routers
•TMC
Unified
Communications
Excellence
Award
for
the
Brocade
FastIron
Series
Switches
•EMC
Partner
Solution
Award
for
Best
New
Offering
for
the
Brocade
Encryption
Switch
•Best
Of
Tech-Ed
2010
by
Windows
IT
Pro
and
SQL
Server
Magazines
for
the
Brocade
DCX-4S
These prestigious awards reflect Brocade’s customer-driven commitment to
developing higher performance, innovative solutions with the highest
standards of quality. ©
2010 Brocade Communications Systems, Inc.
Page 11
of 42 |
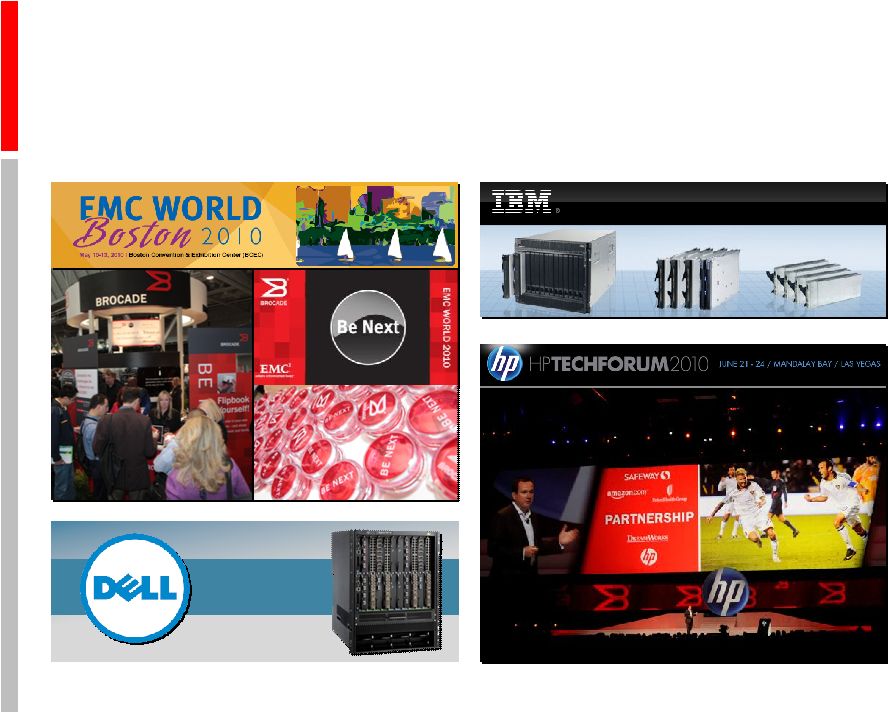  OEM Partner Momentum
Strengthening strategic relationships
System x
B-RX 16
B-RX 16 |
| In Q3 we continued to generate healthy momentum across several partner
categories, namely OEM, channel and solution partners. First,
an
update
at
two
important
OEM
events—EMC
World
in
May
and
HP
Technology
Forum
in
June.
What
a
difference
a
year
makes!
That was our theme coming out of this year’s EMC World, which may have been one
of the most productive EMC events for us in recent history. As we reported on
our Q2 conference call, EMC has become a reseller of our Ethernet switches and IP routers as part of tailored-
made EMC solutions such as remote backup, disaster recovery, virtualization and data
center consolidation. Brocade and EMC also announced “Be Next”, a
joint marketing campaign that defines how the two companies are collaborating to deliver private cloud
infrastructure.
We followed up EMC World with an equally successful engagement at HP Technology
Forum where we announced a new set of high- performance
Fibre
Channel
SAN
and
server
connectivity
solutions
designed
specifically
for
virtualized
data
center
environments.
The
extension
of
our
Fibre
Channel
portfolio
through
HP
was
significant
as
we
also
announced
that
the
two
companies
achieved
a
record-
breaking
milestone
by
shipping
over
7
million
HP
StorageWorks
B-series
Fibre
Channel
ports
to
date.
This
makes
HP
the
No.
1
OEM
for
Fibre
Channel in our 15-year history.
In
other
OEM
updates,
we
are
seeing
strong
traction
of
our
Fibre
Channel
host
bus
adapter
(HBA)
business
through
IBM
with
300%
growth sequentially. In Q3 IBM also qualified and launched a series of
top-of-rack Ethernet switches from Brocade optimized for its System
X (x86) enterprise servers. There is no question that we still have much to do in terms of growing the Ethernet business through
IBM.
But
we
remain
determined
in
continuing
to
develop
this
important
route-to-market
as
demonstrated
by
our
activities
this
quarter.
Moving
onto
Dell,
in
Q3
Dell
launched
a
factory-installed
version
of
the
Brocade
815
Fibre
Channel
HBA
offering
significant
pricing
advantages over competing products. Dell also is continuing to fill out its
portfolio of Dell-branded networking solutions from Brocade with
the
recent
addition
of
the
Brocade
BigIron
RX
16
Series
Switches.
We
are
pleased
with
the
results
to
date
of
the
Brocade/Dell
strategic
partnership
designed
to
offer
Dell
customers
end-to-end
computing,
networking
and
storage
solutions
through
Dell’s
global
sales
organization.
©
2010 Brocade Communications Systems, Inc.
Page 12
of 42 |
  Channel and Solution Partner Momentum
Phase II
Tightly integrated network
security solutions delivered
via channel partners
Power 100: The Most Powerful
Women Of The Channel |
| We are also making good progress with channel partners, which include
distributors and value-added resellers (VARs). These partners are
important to our success especially for our Ethernet portfolio and we are pleased to announce that we added
another 24 global distributors and VARs to our Alliance Partner Network program this
quarter, adding to the 300+ partners in the program already. We also
announced a new set of technology-centric channel partner specializations that will help our
channel partners address growing customer demand for skilled expertise across a
broad range of networking technologies. This program is designed to reward
qualified partners, who will receive a number of benefits including dedicated pre-sales
support, access to seed units and proof-of-concept labs, opportunities for
special accreditation, and dedicated lead assignments. Finally, we were also
delighted that Barbara Spicek, Brocade’s VP of Worldwide Channels, was named by
Computer Reseller News as one of its “Power 100,”
the list of the 100 most powerful women in the channel business.
In the area of solution partners, in Q3 we announced the second phase of our
strategic partnership with McAfee that will help enable the two companies to
deliver a broad set of fully interoperable, simplified network-based security solutions through
channel partners by jointly offering comprehensive channel marketing and sales
enablement programs. We are also continuing to collaborate with our
virtualization solutions partners to enhance our existing networks for optimization in virtual
environments. The most tangible example of that is the introduction of the Brocade
Application Resource Broker for VMware and other virtualization platforms,
which provides visibility into application performance across the network and virtual
machine infrastructures and helps ensure application service level agreements (SLA)
are met dynamically. ©
2010 Brocade Communications Systems, Inc.
Page 13
of 42 |
 Major Customers by Vertical
Brocade selling to the world’s best brands
Financial
Financial
Healthcare/
Healthcare/
Pharmaceuticals
Pharmaceuticals
Chemical
Chemical
Automotive
Automotive
Manufacturing/
Manufacturing/
Retail
Retail
Media &
Media &
Entertainment
Entertainment
Telecom
Telecom
Airlines
Airlines
Other
Other
Education
Education |
| Customers also are taking notice by standardizing their entire network
infrastructure using Brocade technologies. Highlights in Q3 include wins from
various higher education institutes who replaced their incumbent networking vendor with Brocade to take
advantage
of
higher
levels
of
reliability,
faster
ROI
and
better
support/service.
We
also
announced
that
a
number
of
service
providers turned to Brocade for similar reasons as these advantages in turn allow
them to offer advanced, differentiated
voice/video/data/mobility—otherwise
known
as
“Quad
Play”
services—to
their
customers
in
a
more
cost-effective
way.
We
offer
similar
benefits
and
advantages
to
all
customers
we
work
with
including
the
major,
global
brands
listed
in
this
slide.
©
2010 Brocade Communications Systems, Inc.
Page 14
of 42 |
 Focus and Execution in a
Challenging Environment
•
Uncertainty in worldwide macro-
economic climate
•
Variable IT spending patterns
•
Increasingly competitive
Ethernet market
We will remain focused
and execute on our strategy |
| Of course we do face challenges, both within and outside our control,
such as the uncertainty in the worldwide macro- economic climate and its
impact on IT spending patterns globally. Changing forecasts from the industry research firms make
it difficult to accurately predict when customers will place purchase orders and can
affect inventory levels at our partners. Another
challenge
is
the
increasingly
competitive
landscape
in
the
Ethernet
market.
But
as
mentioned
earlier,
we
believe
that
the
diversification
of
our
business
model
helps
mitigate
some
of
these
challenges.
©
2010 Brocade Communications Systems, Inc.
Page 15
of 42 |
 Q3 Summary
Q3 highlights include:
•
Better-than-expected performance in
our SAN business
•
Sequential growth in Americas, EMEA,
and APAC Ethernet business
•
Best quarter winning new Ethernet
accounts
•
Enthusiastic response for Brocade One
strategy and innovations at Tech Day
•
Industry-wide recognition for SAN and
Ethernet products |
| In summary, Brocade executed well during a challenging and highly
variable global market. Highlights in the quarter include:
•Better-than-expected performance in our SAN business driven by
strength in switch revenue, in the face of a typically seasonally soft
quarter •Sequential Ethernet revenue growth in 3 out of 4 geographies
(excluding Federal) •Our best quarter in winning net-new Ethernet
accounts with the highest revenue contribution in any quarter from those
accounts since the acquisition of Foundry
•Enthusiastic response from customers, partners, press and analysts on our
Brocade One strategy and innovations such as Brocade VCS, VAL, AMPP, etc.
•Wide industry recognition for both our SAN and Ethernet products,
demonstrating the competitively differentiated and advanced characteristics
of our portfolio ©
2010 Brocade Communications Systems, Inc.
Page 16
of 42 |
  Analyst
Day 2010
Join us for Brocade Analyst Day 2010!
BROCADE ANALYST DAY 2010
When:
September 15, 2010
8:00 am–1:30 pm
Where:
Brocade Campus
130 Holger
Way
San Jose, CA 95134
Speakers:
Brocade executives Mike Klayko, CEO,
Richard Deranleau, CFO, and several others |
| We
now
turn
our
attention
to
Q4
in
order
to
deliver
a
strong
finish
to
fiscal
year
2010.
Looking
ahead,
we
have
confidence
in
the plans we have developed and the actions we are taking to drive our business
forward. We believe our sales and marketing strategies as well as our product
portfolio are aligned well with customer imperatives and will drive our long-term
success. We will be discussing these topics in greater detail at
our annual Analyst Day, which will be hosted at our new
campus and webcast on September 15. We hope to see you there.
©
2010 Brocade Communications Systems, Inc.
Page 17
of 42 |
 Q3 FY 2010 Financials
Richard Deranleau, CFO |
| Prepared comments provided by Richard Deranleau, CFO
©
2010 Brocade Communications Systems, Inc.
Page 18
of 42 |
| Q3 Financial Highlights
Revenues
•
Q3 revenues $503.5M up 2% Yr./Yr.
•
SAN revenues up 4% Qtr./Qtr.
Profitability
•
Non-GAAP EPS* (diluted) of $0.13 up 8% Yr./Yr.
•
GAAP EPS (diluted) of $0.05 vs. ($0.06) in Q3 2009
Reducing debt
•
Additional $25M non-mandatory debt payments
•
Term loan below $400M at end of Q3 2010
* Note: Non-GAAP, please see GAAP reconciliation in appendix
|
| Brocade executed solidly in Q3, our softest seasonal quarter, and grew
revenues sequentially and 2.1% year-over-year. In Ethernet revenues,
the Americas (excluding Federal), APAC, and EMEA business regions all grew sequentially, with
weakness in Japan. As expected, our Federal Ethernet was down sequentially off a
very strong Q2 while up year-over-year. We
continued
to
manage
operating
expenses
below
our
long-term
model
while
making
significant
investments
in
our
Ethernet
sales
team.
Non-GAAP
earnings
per
share
on
a
diluted
basis,
were
$0.13
for
Q3.
I’ll
expand
on
all
these
points
in
my remarks today.
©
2010 Brocade Communications Systems, Inc.
Page 19
of 42 |
 Key Financial Metrics
Q3 09
Q4 09
Q1 10
Q2 10
Q3 10
Revenue
$493M
$522M
$539M
$501M
$504M
Sequential growth
(2.6)%
5.8%
3.4%
(7.1)%
.5%
Year-over-year growth
34.9%
30.9%
25.0%
(1.1)%
2.1%
Non-GAAP gross margin*
58.2%
59.5%
59.3%
56.7%
54.1%
Non-GAAP operating margin*
20.3%
22.7%
26.0%
20.5%
17.3%
Non-GAAP EPS*—diluted
$0.12
$0.15
$0.19
$0.13
$0.13
GAAP EPS—diluted**
($0.06)
$0.07
$0.11
$0.05
$0.05
* Note: Non-GAAP, please see GAAP reconciliation in appendix
** Note: Adjusted due to new accounting standards relating to convertible debt
instruments |
| Turning
first
to
revenues,
Q3
revenues
were
$503.5M
which
were
up
2.1%
year-over-year
and
up
slightly
over
Q2.
Q3
is
typically
our
seasonally
weakest
quarter
and,
as
a
comparison,
a
year
ago
Q2
09
to
Q3
09
was
down
2.6%.
Revenues
performed
in
the
range
of guidance we provided in our Q2 earnings call, which was flat to slightly up.
SAN product revenues were up 3.9% sequentially driven by higher switch sales,
which were up 20% compared to Q2 10. Ethernet product revenues were down 4.7%
sequentially driven by lower Federal revenue, weakness in Japan which offset growth in the
Americas,
APAC,
and
EMEA
regions.
Additionally,
demand
for
our
8
x
10
Gig
blade
outpaced
supply
in
the
initial
launch
quarter.
As
Mike mentioned, we are pleased with the performance and growth in our new accounts,
specifically in the Americas, and we believe this is a positive indicator of
the investments we have made in our Ethernet Sales. Global Services revenues were down 2.5%
sequentially driven by lower support and professional services revenues. OEM
inventory levels were just slightly up sequentially, thus sell-in
and
sell-thru
were
essentially
the
same
in
Q3.
Based
on
forward
looking
demand,
our
partners’
weeks
on
hand
inventory
was
down
from
Q2
and
is
currently
just
slightly
more
than
2
weeks
of
supply.
Non-GAAP Gross Margins of 54.1% were down 260 basis points sequentially. The
decrease in gross margins was principally driven by the increase in
inventory reserve charges for our Ethernet products as we enter new product cycles, higher COGS spending
related to new product introductions and Ethernet investments, and selected sales
programs for new Ethernet products. Non-GAAP
Operating
Margins
were
17.3%.
The
sequential
reduction
in
Operating
Margin
is
principally
a
reflection
of
the
impact
of
lower gross margins. Non-GAAP Operating Expenses were up slightly as a
percentage of revenue to 36.8%, driven by our investments in Sales, but
still comfortably below our long-term model of 38–39%. In Q3, we
completed various tax audits with the US Federal Government and the State of California, which resulted in a more
favorable outcome than expected in our tax reserve position. Inclusive of these
discrete events, the Q3 10 effective non-GAAP tax expense was 0.2% and
effective GAAP tax benefit was negative 220%. Our non-GAAP EPS benefit
from the lower tax rate was $0.03 for the quarter. Looking to
the Balance Sheet, Brocade repaid $30.6M of our senior secured debt, of which $25.0M was in excess of the mandatory
amount due, bringing our acquisition term debt to below $400M. Total diluted shares
were relatively unchanged for Q3 at 482M shares.
This
includes
the
repurchase
of
$5M
of
stock
during
the
quarter.
©
2010 Brocade Communications Systems, Inc.
Page 20
of 42 |
 Revenue: SAN, Ethernet, and Global Services |
| Turning
to
revenues
by
business
unit,
SAN
represented
58%
of
revenues
in
Q3
vs
56%
in
Q2.
Demand
for
Brocade’s
leading
SAN
products
remained
very
strong
in
Q3.
The
growth
in
Switch
revenues
was
driven
by
our
5300,
5100
and
300
product
families.
Based
on
our
internal
analysis,
we
believe
we
gained
share
in
Q3.
Our
revenue
that
we
identify
as
8
Gig
grew
from
78%
in
Q2
to
88%
in
Q3
for
Director
and
Switch
revenue.
As
of
Q3
10,
we
are essentially transitioned to 8 Gig.
SAN ASP sequential declines were in the low single digits.
Our Server product group, consisting of Embedded Switches, CNAs, HBAs, and
Mezzanine Cards, posted revenue of $39.6M which was up 26%
year-over-year and down 2% off our Q2. Embedded Switches were down 6% sequentially while the group
of CNAs, HBAs
and Mezzanine Cards were up 56% sequentially.
Our
Global
Services
business
represented
18%
of
revenues,
relatively
unchanged
vs
Q2.
Global
Services
revenue
was
down
2.2% year-over-year and was down 2.5% sequentially.
©
2010 Brocade Communications Systems, Inc.
Page 21
of 42 |
 Total Ethernet Revenue
$148.5
$151.0
$124.6
$156.7
$149.5 |
| Looking at our Ethernet business, including hardware and
Ethernet-based support and services, Q3
10
revenues
of
$149.5M
represent
a
slight
growth
year-over-year
and
a
decline
of
4.7%
off
our
strong
Q2
10.
Our Ethernet product revenues were $122.1M in the quarter, an improvement of 2.5%
year-over-year and down 4.7% sequentially.
Ethernet
product
revenue
represented
24%
of
total
revenue
vs
26%
in
Q2.
The Ethernet business was mixed across our regions, with our Americas region showing
particular strength (excluding Federal), with weakness in Japan. We saw good
growth in our new accounts with both initial sales in the quarter as well as
new
customers
from
previous
quarters
returning
and
buying
again.
As
expected,
Federal
business
was
down
16%
off
a
strong
Q2. However, Federal business was still up 15% year-over-year,
showing continued growth in this sector. Ethernet
ASP
sequential
declines
were
in
the
low
to
mid-single
digits,
consistent
with
the
prior
quarter.
©
2010 Brocade Communications Systems, Inc.
Page 22
of 42 |
 Revenue: 10% Customers,
Other OEM, Channel/Direct |
| In
Q3
Brocade
had
three
customers
that
had
revenues
greater
than
10%,
consistent
with
the
prior
quarter.
EMC,
IBM
and
HP
all contributed more than 10% of revenues individually. Collectively, our top 3 OEMs
contributed 44% of revenues in Q3, no change
vs.
Q2,
but
down
from
46%
in
the
year
ago
quarter.
Other
OEMs
represented
20%
of
revenues
in
Q3
vs.
19%
in
Q2.
Channel
and
Direct
were
36%
of
revenues
in
Q3
vs.
37%
in
Q2.
©
2010 Brocade Communications Systems, Inc.
Page 23
of 42 |
 Domestic and International
Reported Revenue
Reported revenue on a ship-to basis |
| Turning to geography, as reported, on a ship-to basis, the US was
again strong this quarter and represented 64% of revenues in Q3, slightly
down from Q2 at 65%. On an estimated end-user
basis, adjusting for those partners who take delivery of internationally bound products in the US,
the US represented 45% of total revenues in Q3, unchanged compared to Q2.
©
2010 Brocade Communications Systems, Inc.
Page 24
of 42 |
 Segment Revenues and
Gross Margin Snapshot
Q2 vs. Q3 revenue mix and non-GAAP* gross margin
* Note: Non-GAAP, please see GAAP reconciliation in appendix
Q2 10
Q3 10
Revenues by Segment ($M)
Non-GAAP* Gross Margin
by Segment |
| Gross margins, on a non-GAAP basis, were 54.1%, which were down
approximately 260 basis points quarter-over-quarter and approximately
410 basis points year-over-year. Q3 SAN gross margins were 63.5%, down from 65.2% in Q2. The lower
SAN gross margins were driven by a higher mix of Switch vs
Director revenues in the quarter as well as increased COGS
spending related to new product introductions. The impact of lower SAN gross margins
on overall company gross margins was approximately 100 basis points in Q3.
This was partially offset by a favorable mix to SAN products at an overall company
level which increased overall margins by approximately 40 basis points.
Q3 Ethernet gross margins were 35.5% down from 43.5% in Q2. The lower
Ethernet gross margins were primarily driven by higher inventory reserve
charges and higher COGS spending related to new products and Ethernet investments in the
quarter. The inventory reserve charges are driven by excess inventory for Ethernet
products based on our new product introductions and current sales forecast.
The impact of lower Ethernet gross margins on overall company gross margins was
approximately 200 basis points in Q3.
Based
on
our
new
forward-looking
forecast
and
the
remaining
Ethernet
inventory,
we
believe
the
impact
on
Ethernet
gross
margins
going
forward
in
Q4
10
and
beyond
will
be
considerably
less.
Global
Services
margins
were
relatively
flat
in
Q3
at
48.9%
vs
49.1%
in
Q2.
©
2010 Brocade Communications Systems, Inc.
Page 25
of 42 |
 Pricing/Mix
Overhead
Inventory
Reserves
Ethernet Gross Margin Detail
Yr./Yr. bridge
(3.3%)
(3.8%)
(6.5% )
Q3 09
Q3 10
49.1%
35.5% |
| Ethernet product gross margins, on a non-GAAP basis, were 35.5% in
Q3. Ethernet gross margins are lower year-over-year primarily driven
by the inventory reserves taken in Q3 (3.3 pts), increased overhead allocations tied to new product ramp and
increased manufacturing focus (3.8 pts), and pricing/mix impact (6.5 pts).
©
2010 Brocade Communications Systems, Inc.
Page 26
of 42 |
 Operating Expenses and Margins
Long-term model
operating margin
range: 20–23%
Non-GAAP* Operating Margins
Non-GAAP* Operating Expenses
as a Percentage of Revenues
Long-term model operating expense range: 38–39%
* Note: Non-GAAP, please see GAAP reconciliation in appendix
|
| While
increasing
our
investment
in
sales
headcount,
we
continued
to
focus
on
controlling
spending
in
non-sales
functional
areas.
On
a
non-GAAP
basis,
total
Operating
Expenses
were
36.8%
of
revenues
in
Q3
10
vs
36.2%
in
Q2
10.
Operating
expenses
were
better
than
our
long-term
target
model
of
38%
to
39%
of
revenues.
The
increase
in
operating
expenses
sequentially
reflects
the
investment
in
our
sales
organization.
Non-GAAP operating margins decreased on a sequential basis to 17.3% in Q3 from
Q2 margins of 20.5%, primarily due to our lower gross margins.
©
2010 Brocade Communications Systems, Inc.
Page 27
of 42 |
 Balance Sheet and Cash Flow
Highlights as of July 31, 2010
Cash flows enable de-leveraging and reinvestment
* Note: Adjusted EBITDA is as defined in the term debt credit agreement
** Note: Giving effect to the McDATA convertible debt of $173M repaid on
February 16, 2010 Q3 09
Q4 09
Q1 10
Q2 10
Q3 10
Cash from operations
$16.6M
$155.3M
$69.1M
$67.7M
$55.3M
Campus capital expenditures
$25M
$28M
$31M
$42M
$24M
Operating capital expenditures
$20M
$17M
$17M
$20M
$23M
Free cash flow
($28M)
$110M
$22M
$6M
$9M
Cash, equivalents, and
short term investments
$250M
$339M
$328M**
$290M
$296M
Debt payments
$33.1M
$57.9M
$506.5M
$202.2M
$30.6M
Senior secured debt
$1.01B
$0.95B
$1.04B
$1.01B
$0.99B
Adjusted EBITDA*
$119.3M
$130.0M
$154.7M
$116.4M
$101.5M
Stock repurchase
–
–
–
$20M
$5M
Senior secured leverage ratio
1.94x
1.87x
1.99x
1.95x
1.97x
Covenant
2.3x
2.3x
2.5x
2.5x
2.5x
Fixed charge coverage ratio
2.2x
2.1x
2.0x
1.8x
1.7x
Covenant
1.25x
1.25x
1.25x
1.25x
1.25x |
| Cash from operations was $55.3M in Q3, which is typically a weaker
seasonal quarter for cash generation. Total Capital Expenditures in the
quarter were $47M, which is composed of $24M for the campus and $23M for
operations. Free Cash Flow was $9M in the quarter. With the completion of the
campus, we expect an incremental cash generation of approximately $125M in
FY2011 compared to FY2010 via savings from capital expenditures and rent expense.
Cash, equivalents and short-term investments grew to $296M, up from $290M in Q2.
In Q3, we reduced our debt principal by $30.6M including $25.0M in excess of
the mandatory payment. Adjusted EBITDA in the quarter was $101.5M, which was
down from the Q2 level of $116.4M. The
Senior
Secured
Leverage
Ratio
of
1.97x
and
the
Fixed
Charge
Coverage
Ratio
of
1.7x
are
both
within
the
covenant
requirements of our term credit agreement.
Brocade’s restructured debt allows us to repurchase stock. Brocade repurchased
$5M of stock in Q3 which was approximately 900k
shares.
Brocade
has
Board
authorization
to
repurchase
up
to
$389M
and
our
debt
covenants
allow
us
to
repurchase
up
to
$75M
if
our
Senior
Secured
Leverage
Ratio
is
below
2.
Brocade
will
continue
to
repurchase
stock
on
an
opportunistic
basis.
©
2010 Brocade Communications Systems, Inc.
Page 28
of 42 |
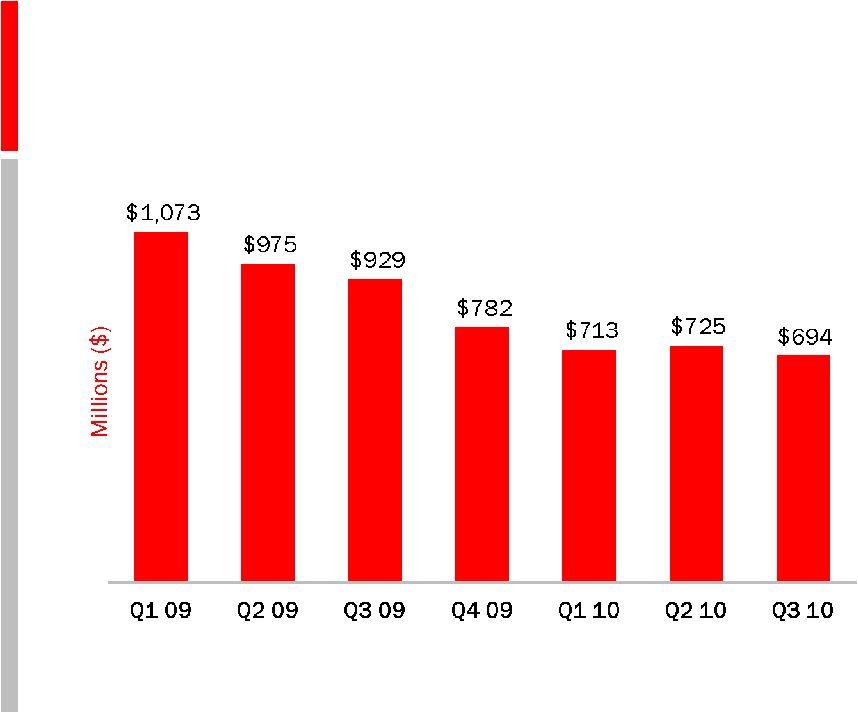 Net Debt:
Defined as Total Debt Less Total Cash
Reduction of $379M since Q1 2009 |
| Since acquiring Foundry last year, Brocade has steadily reduced Net Debt,
defined as Total Debt less Total Cash, Equivalents and Short-term
Investments. Net Debt has declined from $1,073M at the end of Q1 09 to $694M at the end of
Q3
10,
a
$379M
reduction.
Our
term
debt
loan
balance
is
now
down
to
$381M.
©
2010 Brocade Communications Systems, Inc.
Page 29
of 42 |
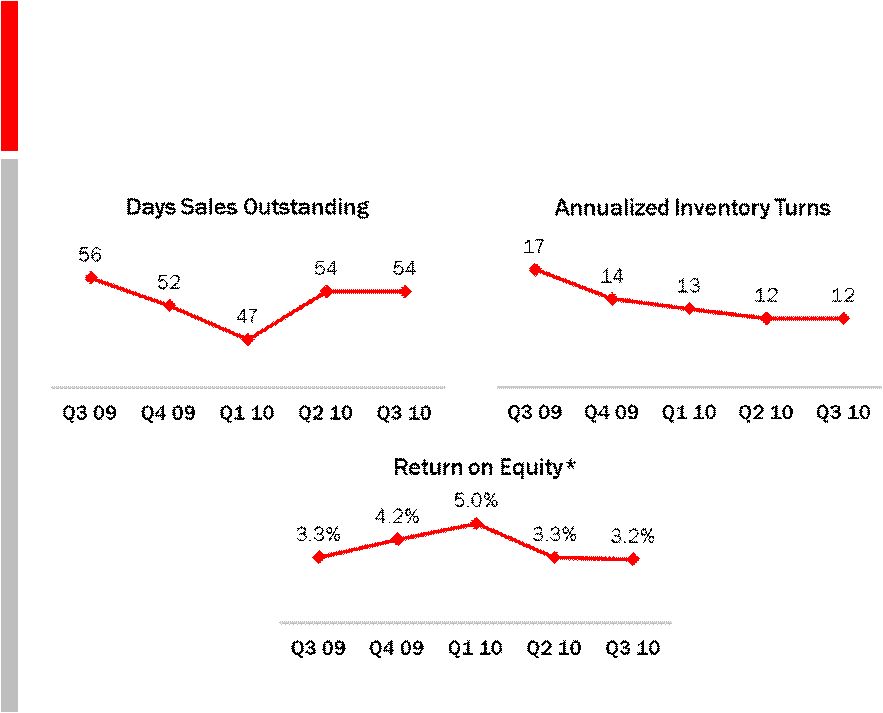 Selected Metrics
* Note: Return on Equity = Non-GAAP net income /total stockholders equity
Please see Non-GAAP reconciliation in appendix
|
| Days Sales Outstanding (DSO) was 54 days, unchanged from Q2. Inventories
turned 12 times, which were unchanged from Q2.
Return
on
Equity
was
3.2%,
essentially
flat
with
Q2.
©
2010 Brocade Communications Systems, Inc.
Page 30
of 42 |
| Q4/FY 2010 Planning Assumptions
IT market conditions
•
Macro economic challenges
•
Continued recovery in US but cautious regarding
international IT spending
ASP trends
•
Low single-digit declines in SAN pricing
•
Mid single-digit declines in Ethernet pricing
Taxes
•
Rates return to normal levels
OEM inventories
•
Expect to remain flat to slightly down |
| Now,
as
we
look
forward
to
Q4
10,
here
are
some
things
to
consider
in
developing
your
financial
models:
As Mike mentioned, we continue to see challenges in the macro economy, which could
negatively impact estimates for IT spending. We believe that the recovery in
the US will continue but are cautious about the IT spending environment in EMEA
and Japan.
We expect quarterly ASP declines in our SAN business to remain in the low-single
digits. ASP declines in our Ethernet business are expected to be in the
mid-single digits. From
a
tax
rate
perspective,
we
do
not
forecast
discrete
events
due
to
the
inherent
uncertainty
of
their
timing,
therefore
we
plan
for
our
tax
rate
to
return
to
normal
levels.
Regarding
OEM
inventory,
while
difficult
to
predict,
we
would
expect
OEM
inventory
levels
to
remain
flat
to
slightly
down
in
absolute
dollar
terms
as
we
head
into
our
seasonally
strong
quarter.
©
2010 Brocade Communications Systems, Inc.
Page 31
of 42 |
 Q4/FY 2010 Financial Outlook
As of August 18, 2010
* Note: Non-GAAP, please see GAAP reconciliation in appendix
Q4 2010
FY 2010
Revenue
$530M–$550M
$2.074B–$2.094B
Revenue growth
5%–9%
6%–7%
Non-GAAP gross margin*
56%–57%
56.6%–56.8%
Non-GAAP operating expenses*
36%–37%
35.5%–35.8%
Non-GAAP operating margin*
19%–21%
20.8%–21.3%
Non-GAAP tax rate*
~25%
~20%
Fully diluted shares outstanding
482M–487M
485M–487M
Non-GAAP EPS*
$0.12–$0.14
$0.57–$0.59
Operating cash flow
$80M–$90M
$272M–$282M
Operating capital expenditures
$20M–$25M
$80M–$85M
Campus capital expenditures
$28M
$124M
Free cash flow
$32M–$37M
$68M–$73M |
| Given these considerations, we expect:
•Q4 10 Revenue to be $530M to $550M, up 5% to 9% sequentially, which would
result in full fiscal year 2010 revenue growth of
6%
to
7%
year-over-year
($2.074B
to
$2.094B)
•Q4
10
Non-GAAP
gross
margins
to
be
56%
to
57%
and
for
the
full
year
to
be
56.6%
to 56.8%
•Q4
10
Non-GAAP
Operating
expenses
to
be
36%
to
37%
and
for
the
full
year
to
be
35.5%
to 35.8%
•Q4
10
Non-GAAP
Operating
margins
to
be
19%
to
21%
and
for
the
full
year
to
be
20.8%
to
21.3%,
which
is
in
Model
•Q4 10 Non-GAAP tax rate to be approximately 25% and full year tax rate to
be approximately 20% •Q4
10
Diluted
shares
outstanding
to
be
in
a
range
of
482M
to
487M
shares,
and
for
the
full
year
485M
to
487M
•Q4 10 Non-GAAP EPS to be in a range from 12 cents to 14 cents and full
year non-GAAP EPS to be in a range of 57 cents to 59 cents
•Q4 10 Operating Cash Flow of $80M to $90M and full year Operating Cash Flow
of $272M to $282M •Q4 10 Operational Capital Expenditures of $20M to
$25M and full year Operational Capital Expenditures of $80M to $85M •Q4
10 Campus Capital Expenditures of $28M and full year Campus Capital Expenditures of $124M
•Q4
10
Free
Cash
Flow
of
$32M
to
$37M
and
full
year
Free
Cash
Flow
of
$68M
to
$73M
©
2010 Brocade Communications Systems, Inc.
Page 32
of 42 |
 Financial Summary
Richard Deranleau, CFO |
| To
summarize,
we
had
a
solid
Q3
and
are
committed
to
be
in
our
long-term
operating
margin
model
for
the
fiscal
year
2010.
We
are
beginning
to
see
some
very
positive
results
in
our
Ethernet
go-to-market
strategy.
We
still
have
work
to
do
in
EMEA
and Japan and are conscious of a potentially tough IT spending environment in those
geographies. We continue to strengthen our balance sheet by reducing our debt
at a faster rate than outlined by our credit agreement. We
look
forward
to
answering
your
questions
in
the
Q&A
session
of
our
conference
call
and
seeing
you
at
our
Analyst
Day
on
September
15
th
in
San
Jose.
©
2010 Brocade Communications Systems, Inc.
Page 33
of 42 |
 Live Q&A Call
August 18, 2010, 2:30PM Pacific Time
Richard
Deranleau
CFO
John McHugh
CMO
Ian Whiting
SVP WW Sales
Dave Stevens
CTO
Mike Klayko
CEO |
| Prepared comments provided by Rob Eggers, Investor Relations
That
concludes
Brocade’s
prepared
comments.
At
2:30
p.m.
Pacific
Time
on
August
18
th
Brocade
will
host
a
webcast
conference
call
at
www.BRCD.com
primarily
devoted
to
answering
questions
submitted
via
email
to
ir@brocade.com
and
taken
live
from
participants
via
telephone.
Thank
you
for
your
interest
in
Brocade.
©
2010 Brocade Communications Systems, Inc.
Page 34
of 42 |
 Appendix and Reconciliations |
| *
*
©
2010 Brocade Communications Systems, Inc.
Page 35 of 42
*
* |
 Non-GAAP*
Income
Statement
Comparison
* Note: Non-GAAP, please see GAAP reconciliation in
appendix |
| *
*
©
2010 Brocade Communications Systems, Inc.
Page 36 of 42
*
* |
 Quarterly Net Income (Loss)
GAAP/Non-GAAP Reconciliation
* Adjusted as a result of adoption of new accounting standard relating to
convertible debt instruments (In Thousands)
Q3 09
Q4 09
Q1 10
Q2 10
Q3 10
Net income (loss) on a GAAP basis*
(23,494)
32,101
51,095
22,380
21,961
Adjustments:
Legal fees associated with indemnification obligations
and other related expenses, net
(561)
(14,612)
301
277
(74)
Stock-based compensation expense
43,313
35,715
21,523
30,146
24,682
Amortization of intangible assets
35,002
34,950
34,902
30,657
30,657
Acquisition and integration costs
1,450
333
204
–
–
Loss on sale of property
–
–
8,783
(47)
–
Legal fees associated with certain pre-acquisition litigation
–
546
299
17
13
Provision for certain pre-acquisition litigation
–
14,335
–
–
1,604
Interest due to adoption of new standard*
2,030
2,085
2,142
348
–
Income tax effect of adjustments
(2,364)
(32,091)
(25,239)
(21,044)
(15,217)
Non-GAAP net income
55,376
73,362
94,010
62,734
63,626 |
| *
*
©
2010 Brocade Communications Systems, Inc.
Page 37 of 42
*
* |
 Capital Expenditures
Cumulative campus spending: $278M to-date out of $316M* total
* Note: Excludes furniture and equipment leases of approximately
$14M
$14M
$14M
$13M
$16M
$20M
$17M
$17M
$20M
$23M
$80M
$23M
$22M
$25M
$28M
$31M
$42M
$24M
$28M
$20–
25M
$5M
Q3 08
Q4 08
Q1 09
Q2 09
Q3 09
Q4 09
Q1 10
Q2 10
Q3 10
Q4 10
Forecast
FY 11 final campus expenditures will be approximately $11M for the year
|
| *
*
©
2010 Brocade Communications Systems, Inc.
Page 38 of 42
*
* |
 Adjusted EBITDA and Sr. Secured Leverage Ratio
As defined in the term credit agreement
Consolidated Senior Secured Leverage Ratio
Q4 FY 2009
Q1 FY 2010
Q2 FY 2010
Q3 FY 2010
$ Thousand
Actual
Actual
Actual
Actual
Consolidated Net Income
$33,597
$51,095
$22,380
$21,961
plus
(i) Consolidated Interest Charges
$20,681
$22,073
$19,522
$22,061
(ii) Provision for Federal, state, local and foreign income taxes payable
$0
$1,277
$0
$0
(iii) Depreciation and amortization expense
$51,486
$51,012
$46,600
$50,493
(iv) Fees, costs and expenses incurred on or prior to the Acquisition Closing
Date in connection with the Acquisition and the financing thereof
–
–
–
$0
(v) Any cash restructuring charges and integration costs in connection with the
Acquisition, in an aggregate amount not to exceed $75,000,000
$333
$204
$0
$0
(vi) Non-cash restructuring charges incurred in connection with the
Transaction, all as approved by Arrangers
$2,097
$1,502
$1,084
$1,006
(vii) Other non-recurring expenses reducing such Consolidated Net Income
which do not represent a cash item in such period or any future period
(in each case of or by the Borrower and its Subsidiaries for such
Measurement Period) $0
$8,783
($47)
$0
(viii) Any non-cash charges for stock compensation expense in compliance
with FAS 123R and amortization of the fair value of unvested options
under the Acquired Business’ employee stock
option plan assumed by the Borrower
$35,714
$21,523
$30,146
$24,682
(ix)
Legal fees and expenses relating to the Borrower’s indemnification
obligations for the benefit of its former officers and directors in
connection with its historical stock option litigation $0
$250
724
376
minus
(i)
Federal, state, local and foreign income tax credits
($6,707)
$0
($840)
($15,096)
(ii)
All non-cash items increasing Consolidated Net Income (in each case of or
by the Borrower and its Subsidiaries for such Measurement Period)
($7,216)
($3,036)
($3,127)
($4,026)
Consolidated EBITDA
$129,985
$154,683
$116,442
$101,457
4 Quarter Trailing Consolidated EBITDA
$505,848
$523,861
$520,429
$502,567
Consolidated Senior Secured Debt
$948,028
$1,041,483
$1,015,957
$989,803
Consolidated
Senior
Secured
Leverage
Ratio
1.87
1.99
1.95
1.97 |
| *
*
©
2010 Brocade Communications Systems, Inc.
Page 39 of 42
*
* |
 Q3 FY 2010 Cash and Debt Covenant
Adjusted EBITDA* Performance
(In Millions)
Strong Capital Structure
(In Millions)
Within Debt Covenant
Cash Balance**
(In Millions)
* Note: Adjusted EBITDA is as defined in the term debt credit
agreement ** Cash, equivalents and short term investments |
| *
*
*
*
©
2010 Brocade Communications Systems, Inc.
Page 40 of 42 |
 2010 Share Repurchases
•
Company has remaining Board authorization of $389M
•
Brocade can repurchase an additional $75M under the terms of the
Term Debt Agreement if the Senior Secured Leverage Ratio is under 2.0
Amount
Shares
Q2 2010 Share repurchases
$20M
3.5M
Q3 2010 Share repurchases
$5M
0.9M
Total repurchases in 2010
$25M
4.4M |
| *
*
*
*
©
2010 Brocade Communications Systems, Inc.
Page 41 of 42 |
 Thank You
www.BRCD.com |
| *
*
*
*
©
2010 Brocade Communications Systems, Inc.
Page 42 of 42 |