Attached files
| file | filename |
|---|---|
| 8-K - FORM 8-K - ABERCROMBIE & FITCH CO /DE/ | c05143e8vk.htm |
| EX-99.2 - EXHIBIT 99.2 - ABERCROMBIE & FITCH CO /DE/ | c05143exv99w2.htm |
| EX-99.4 - EXHIBIT 99.4 - ABERCROMBIE & FITCH CO /DE/ | c05143exv99w4.htm |
| EX-99.1 - EXHIBIT 99.1 - ABERCROMBIE & FITCH CO /DE/ | c05143exv99w1.htm |
Exhibit 99.3

| Investor Presentation 2010 Second Quarter |

| 2 SAFE HARBOR STATEMENT UNDER THE PRIVATE SECURITIES LITIGATION REFORM ACT OF 1995 A&F cautions that any forward-looking statements (as such term is defined in the Private Securities Litigation Reform Act of 1995) contained in this presentation or made by management of A&F involve risks and uncertainties and are subject to change based on various important factors, many of which may be beyond the Company's control. Words such as "estimate," "project," "plan," "believe," "expect," "anticipate," "intend," and similar expressions may identify forward-looking statements. The factors included in the disclosure under the heading " FORWARD-LOOKING STATEMENTS AND RISK FACTORS" in "ITEM 1A. RISK FACTORS" of A&F's Annual Report on Form 10-K for the fiscal year ended January 30, 2010, in some cases have affected and in the future could affect the Company's financial performance and could cause actual results for the 2010 fiscal year and beyond to differ materially from those expressed or implied in any of the forward-looking statements included in this presentation or otherwise made by management. OTHER INFORMATION All dollar amounts are in $000's unless otherwise stated. Sub-totals and totals may not foot due to rounding. After-tax operating results of Ruehl for 2009 and prior periods included in discontinued operations. |

| 3 Q2 P&L Summary |

| 4 Year-to-Date P&L Summary |

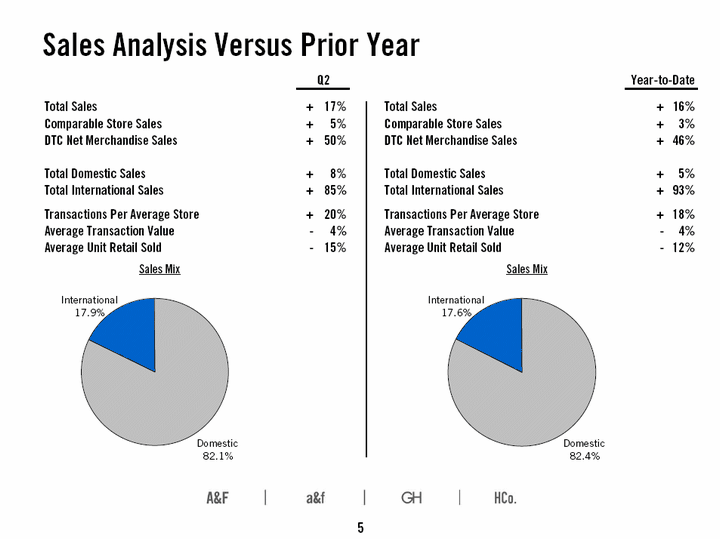
| 5 Sales Analysis Versus Prior Year Sales Mix Sales Mix |

| 6 Gross Margin Analysis |

| 7 Operating Expense |

| 8 Q3 Operating Expense Outlook Store Occupancy Approximately $168 million All Other Stores and Distribution Approximately flat to 2009's 25.2% rate of sales Marketing, General & Administrative Expense Mid-teen percentage increase vs. 2009 |

| 9 Confirmed Flagship Openings |

| 10 International Store Openings - Cumulative |

| 11 Domestic Store Closures 2010 - Approximately 60 2011 - Approximately 50 $2.2 million Q2 impairment charge Additional expected costs related to lease buyouts, de- branding, and other |

| 12 Inventory Change Analysis* * Amounts expressed in millions and represent contribution to overall inventory increase of $155 million versus prior year |

| 13 Liquidity and Capex |

| 14 Appendix: EPS (Unaudited) |

| 15 Appendix: Q2 Store Count Activity Store Count - By Brand and Region |

| 16 Appendix: Year-To-Date Store Count Activity Store Count - By Brand and Region |

| 17 Appendix: Guidance Summary S&D: Q3 Occupancy approximately $168 million Q3 All Other S&D approximately flat to 2009's 25.2% rate of sales M,G &A: Mid-teen percentage increase in Q3 Tax Rate: Full year effective rate projected at approximately 37% |
