Attached files
| file | filename |
|---|---|
| EX-31.2 - MAN AHL DIVERSIFIED I LP | efc10-553_ex312.htm |
| EX-32.1 - MAN AHL DIVERSIFIED I LP | efc10-553_ex321.htm |
| EX-32.2 - MAN AHL DIVERSIFIED I LP | efc10-553_ex322.htm |
| EX-31.1 - MAN AHL DIVERSIFIED I LP | efc10-553_ex311.htm |
UNITED STATES
SECURITIES AND EXCHANGE COMMISSION
WASHINGTON, D.C. 20549
FORM 10-Q
|
[X]
|
QUARTERLY REPORT PURSUANT TO SECTION 13 OR 15(d) OF THE SECURITIES EXCHANGE ACT OF 1934
|
For the quarterly period ended June 30, 2010
OR
|
[ ]
|
TRANSITION REPORT PURSUANT TO SECTION 13 OR 15(d) OF THE SECURITIES EXCHANGE ACT OF 1934
|
For the transition period from to
Commission File number: 000-53043
Man-AHL Diversified I L.P.
(Exact name of registrant as specified in charter)
|
Delaware
|
06-1496634
|
|
|
(State or other jurisdiction of incorporation or organization)
|
(IRS Employer Identification No.)
|
|
c/o Man Investments (USA) Corp.
|
||
|
123 North Wacker Drive
|
||
|
28th Floor
|
||
|
Chicago, Illinois
|
60606
|
|
|
(Address of principal executive offices)
|
(Zip Code)
|
(312) 881-6800
(Registrant’s telephone number, including area code)
Indicate by check mark whether the registrant (1) has filed all reports required to be filed by Section 13 or 15(d) of the Securities Exchange Act of 1934 during the preceding 12 months (or for such shorter period that the registrant was required to file such reports), and (2) has been subject to such filing requirements for the past 90 days.
Yes [X] No [ ]
Indicate by check mark whether the registrant has submitted electronically and posted on its corporate Web site, if any, every Interactive Data File required to be submitted and posted pursuant to Rule 405 of Regulation S-T (§232.405 of this chapter) during the preceding 12 months (or for such shorter period that the registrant was required to submit and post such files).
Yes [ ] No [ ]
Indicate by check mark whether the registrant is a large accelerated filer, an accelerated filer, a non-accelerated filer or a smaller reporting company. See the definitions of “large accelerated filer,” “accelerated filer” and “smaller reporting company” in Rule 12b-2 of the Exchange Act.
|
Large Accelerated Filer [ ]
|
|
Accelerated Filer [ ]
|
|
Non-Accelerated Filer [ ]
|
Smaller reporting company [X]
|
Indicate by check mark whether the registrant is a shell company (as defined in Rule 12b-2 of the Exchange Act).
Yes [ ] No [X]
PART I - FINANCIAL INFORMATION
ITEM 1. Financial Statements.
Man-AHL Diversified I L.P.
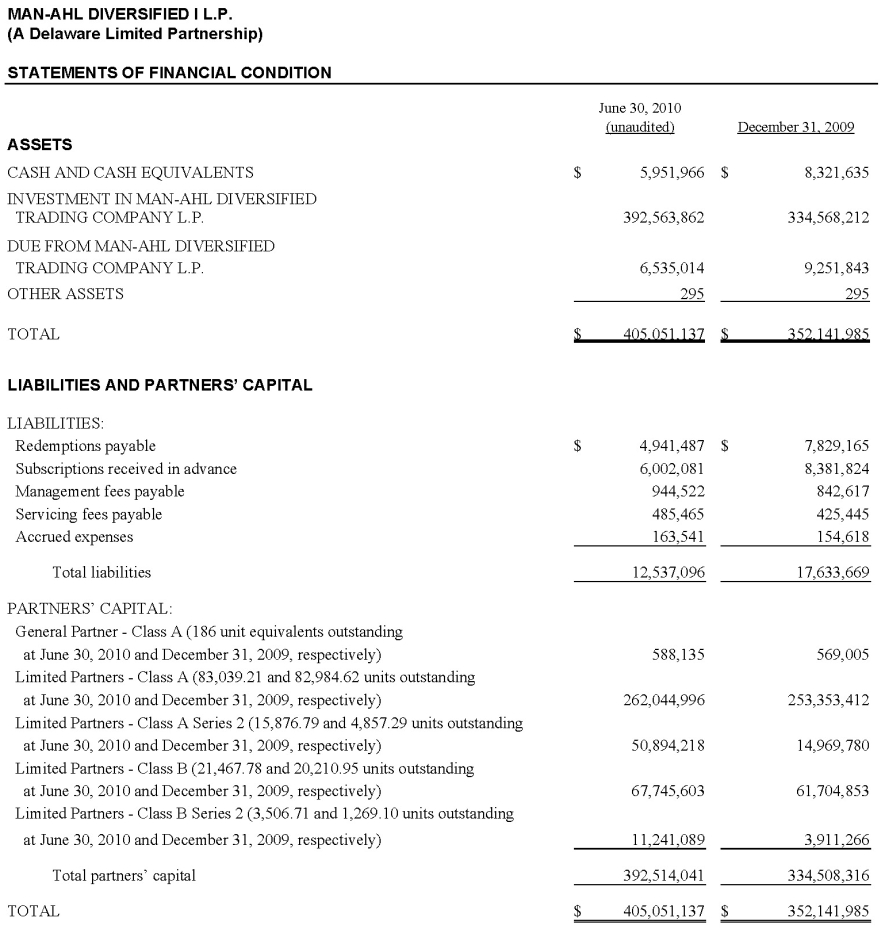
STATEMENTS OF FINANCIAL CONDITION (a)
STATEMENTS OF OPERATIONS (b)
STATEMENTS OF CHANGES IN PARTNERS’ CAPITAL (c)
STATEMENTS OF CASH FLOWS (c)
NOTES TO THE FINANCIAL STATEMENTS (UNAUDITED)
|
(a)
|
At June 30, 2010 (unaudited) and December 31, 2009
|
|
(b)
|
For the three months ended June 30, 2010 and 2009 (unaudited) and for the six months ended June 30, 2010 and 2009 (unaudited)
|
|
(c)
|
For the six months ended June 30, 2010 and 2009 (unaudited)
|
2
3

4

5

6

7
Notes to Financial Statements (unaudited)
The accompanying unaudited financial statements, in the opinion of management, include all adjustments (consisting only of normal recurring adjustments) necessary for a fair presentation of Man-AHL Diversified I L.P.’s (a Delaware Limited Partnership) (the “Partnership”) financial condition at June 30, 2010 and the results of its operations for the three months ended June 30, 2010 and 2009 and six months ended June 30, 2010 and 2009. These financial statements present the results of interim periods and do not include all the disclosures normally provided in annual financial statements. It is suggested that these financial statements be read in conjunction with the audited financial statements and notes included in the Partnership’s annual report on Form 10-K filed with the Securities and Exchange Commission for the year ended December 31, 2009. The December 31, 2009 information has been derived from the audited financial statements as of December 31, 2009.
|
1.
|
ORGANIZATION OF THE PARTNERSHIP
|
Man-AHL Diversified I L.P. (a Delaware Limited Partnership) (the “Partnership”) was organized in September 1997 under the Delaware Revised Uniform Limited Partnership Act and commenced operations on April 3, 1998, for the purpose of engaging in the speculative trading of futures and forward contracts. The Partnership is a “feeder” fund in a “master-feeder” structure, whereby the Partnership invests substantially all of its assets in Man-AHL Diversified Trading Company L.P. (the “Trading Company”). Man-AHL (USA) Limited (the “Advisor”), a United Kingdom company, is the Partnership’s trading advisor. Man Investments (USA) Corp. (the “General Partner”), a Delaware corporation serves as the Partnership’s general partner. The General Partner is a subsidiary of Man Group plc, a United Kingdom public limited company that is listed on the London Stock Exchange. The General Partner oversees the operations and management of the Partnership. The General Partner is registered with the Commodity Futures Trading Commission (“CFTC”) as a commodity pool operator and commodity trading adviser and is a member of the National Futures Association (“NFA”) in such capacities. Man Investments Holdings Limited, a United Kingdom holding company that is part of Man Group plc, a United Kingdom public limited company, is the sole shareholder of the Advisor, and Man Investments Holdings Inc., a Delaware corporation that is part of Man Group plc, is the sole shareholder of the General Partner.
The Partnership’s units are distributed through the Partnership or other selling agents, including Man Investments Inc. (“MII”), an affiliate of the Advisor and General Partner. MII is a registered broker-dealer and a member of the Financial Industry Regulatory Authority (“FINRA”).
On January 28, 2008, the Partnership filed a registration statement on Form 10 with the Securities and Exchange Commission to register the Partnership’s units of limited partnership interests as required by Section 12(g) of the Securities Exchange Act of 1934, as amended.
Effective July 1, 2008, the Partnership issued a new class of units of limited partnership interests, Class B. Class B was created solely for retirement plan investors. The fee structure is identical to Class A.
On April 1, 2009, the Partnership added two new series of units: Class A Series 2 (“Class A-2”) and Class B Series 2 units (“Class B-2”). Except as described in Footnote 2 below, Class A-2 and Class B-2 units are identical to Class A and B units, respectfully.
|
2.
|
SIGNIFICANT ACCOUNTING POLICIES
|
The Partnership prepares its financial statements in conformity with accounting principles generally accepted in the United States of America. The following is a summary of the significant accounting and reporting policies used in preparing the financial statements.
Use of Estimates — The preparation of financial statements in conformity with accounting principles generally accepted in the United States of America requires the General Partner to make estimates and assumptions that affect the reported amounts of assets and liabilities (and disclosure of contingent assets and liabilities) at the date of the financial statements and the reported amounts of revenues and expenses during the reporting period. Actual results could differ from those estimates.
8
Investment in Man-AHL Diversified Trading Company L.P. — The Partnership’s investment in the Trading Company is valued at fair value at the Partnership’s proportionate interest in the net assets of the Trading Company. Investment transactions are recorded on a trade date basis. The performance of the Partnership is directly affected by the performance of the Trading Company. Attached are the financial statements of the Trading Company, which are an integral part of these financial statements. Valuation of investments held by the Trading Company is discussed in the notes to the Trading Company’s financial statements.
In September 2009, the Financial Accounting Standards Board (“FASB”) issued Accounting Standard Update No. 2009-12, Investments in Certain Entities that Calculate Net Asset value per share (or its equivalent), an amendment of Fair Value Measurements and Disclosure (Topic 820), or ASU 2009-12. This amendment provides additional guidance on using the net asset value per share, provided by an investee, when estimating the fair value of an alternative investment that does not have a readily determinable fair value and enhances the disclosures concerning these investments. Examples of alternative investments, within the scope of this amendment, include investments in hedge funds, private equity funds, real estate funds, and venture capital partnerships. This amendment is effective for interim and annual periods ending after December 15, 2009.
At June 30, 2010 and December 31, 2009, the Partnership owned 40,455 and 36,545 units, respectively, of the Trading Company. The Partnership’s aggregate ownership percentage of the Trading Company at June 30, 2010 and December 31, 2009 was 72.59% and 68.10%, respectively.
The Partnership is able to redeem its investment from the Trading Company on a monthly basis. As of March 31, 2010, the Partnership could redeem its investment without restriction at the month-end net asset value of the Trading Company that had been determined in accordance with Accounting Standards Codification (“ASC”) 946, “Financial Services – Investment Companies”. As a result, in accordance with ASU 2009-12, the Partnership transferred its investment in the Trading Company from a Level 3 to a Level 2 fair value measurement at year-end on a prospective basis. The categorization of investments held by the Trading Company has been disclosed in the attached financial statements.
Expenses — The Advisor earns a monthly management fee in an amount equal to 0.1667% (2% annually) of the Partnership’s month-end Net Asset Value, as defined in the Limited Partnership Agreement (the “Agreement”). In addition, the General Partner earns a monthly general partner fee in an amount equal to 0.0833% (1% annually) of the month-end Net Asset Value of Class A and Class B units. The general partner fee is included in management fees in the statements of operations.
The Advisor also earns a monthly incentive fee equal to 20% of any Net New Appreciation, as defined in the Agreement, achieved by the Partnership. The incentive fee is retained by the Advisor even if subsequent losses are incurred; however, no subsequent incentive fees will be paid to the Advisor until any such trading losses are recouped by the Partnership.
The Partnership pays a monthly servicing fee to MII, as described in the supplement to the Agreement dated July 15, 2008, in an amount equal to 0.1250% (1.5% annually) of the month-end Net Asset Value of Class A and Class B units. The Partnership also pays a monthly servicing fee to MII, as described in the supplement to the Agreement, dated January 2, 2009, in an amount equal to 0.1042% (1.25% annually) of the month-end Net Asset Value of Class A-2 and Class B-2 units. For all classes of units, MII serves as the placement agent for the Partnership.
Derivative Contracts — The Partnership’s operating activities involve trading, indirectly through its investment in the Trading Company, in derivative contracts that involve varying degrees of market and credit risk. With respect to the Partnership’s investment in the Trading Company, the Partnership has limited liability, and, therefore, its maximum exposure to either market or credit loss is limited to the carrying value of its investment in the Trading Company, as set forth in the statements of financial condition.
9
The Trading Company utilizes MF Global, Inc. (“MFG”) and Credit Suisse to clear its futures trading activity. The Trading Company utilizes Royal Bank of Scotland (“RBS”) and JPMorgan Chase to clear its forward trading activity.
|
3.
|
RECENT ACCOUNTING PRONOUNCEMENTS
|
Effective January 1, 2010, the Partnership has adopted the provisions of the FASB issued ASU No. 2010-06, Fair Value Measurements and Disclosures (Topic 820): Improving Disclosures about Fair Value Measurements ("ASU 2010-06") to add new requirements for disclosures about transfers into and out of Level 1 and Level 2 and separate disclosures about purchases, sales, issuances, and settlements relating to Level 3 measurements. It also clarifies existing fair value disclosures about the level of disaggregation and about inputs and valuation techniques used to measure fair value. ASU 2010-06 is effective for the first reporting period (including interim periods) beginning after December 15, 2009, except for the requirement to provide the Level 3 activity of purchases, sales, issuances, and settlements on a gross basis, which will be effective for fiscal years beginning after December 15, 2010, and for interim periods within those fiscal years. The adoption of ASU 2010-06 only affected financial statement disclosures and had no impact on the financial position, results of operations, or cash flows of the Partnership.
|
4.
|
SUBSEQUENT EVENTS
|
The General Partner has evaluated the impact of subsequent events on the Partnership through the date of financial statement issuance, and noted no subsequent events that require adjustment to or disclosure in these financial statements.
10
Financial Statements
Man-AHL Diversified Trading Company L.P.
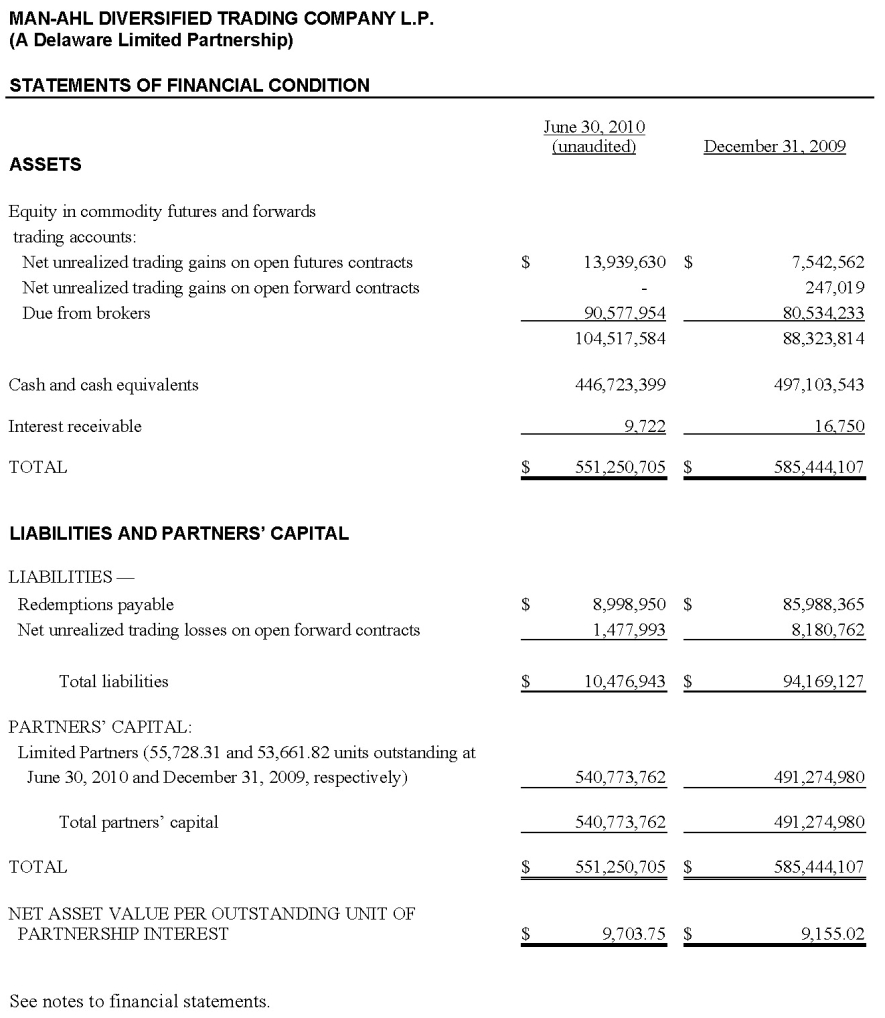
STATEMENTS OF FINANCIAL CONDITION (a)
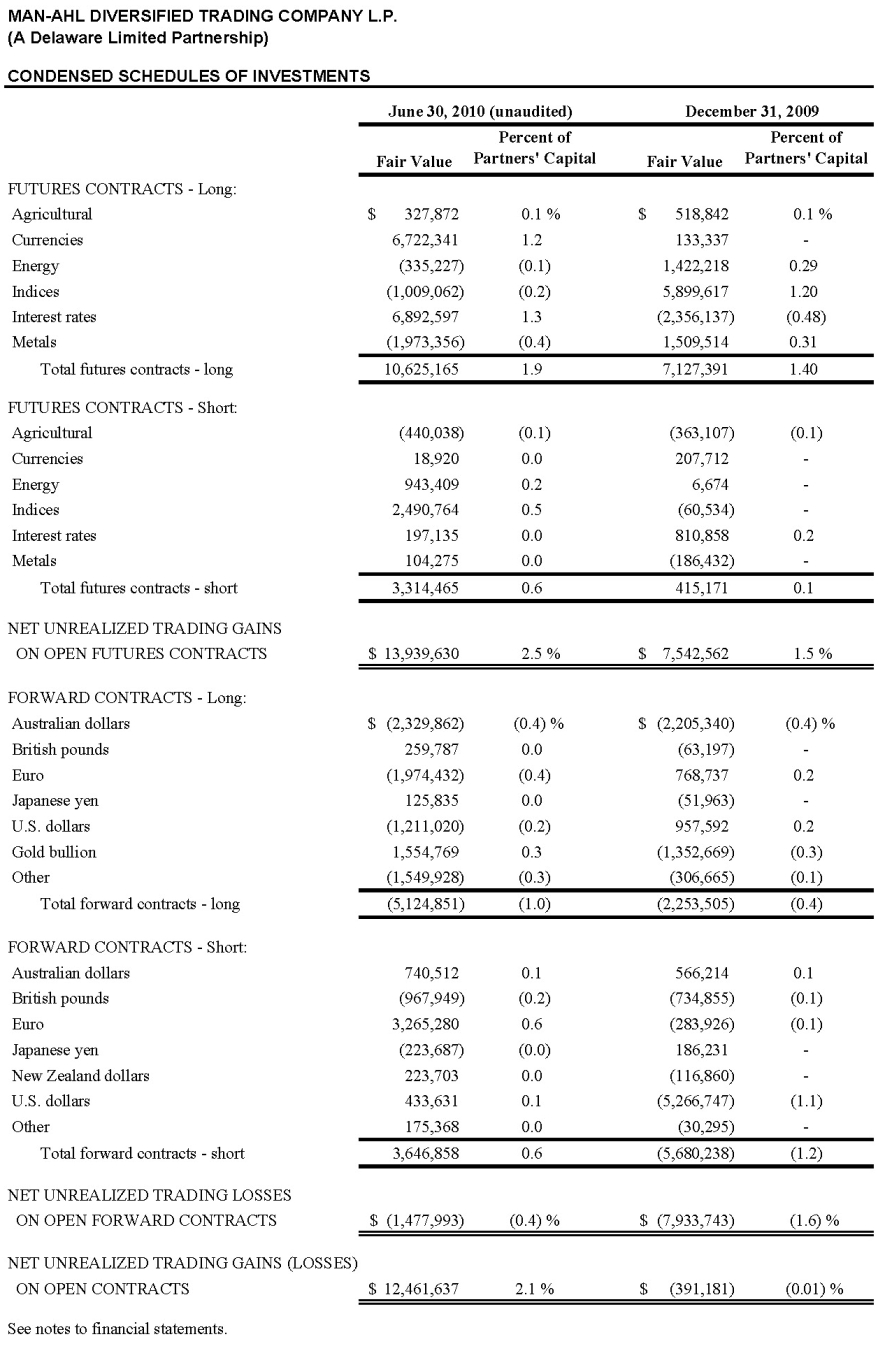
CONDENSED SCHEDULES OF INVESTMENTS (a)
STATEMENTS OF OPERATIONS (b)
STATEMENTS OF CHANGES IN PARTNERS’ CAPITAL (c)
STATEMENTS OF CASH FLOWS (c)
NOTES TO THE FINANCIAL STATEMENTS (UNAUDITED)
(a) At June 30, 2010 (unaudited) and December 31, 2009
(b) For the three months ended June 30, 2010 and 2009 (unaudited) and for the six months ended June 30, 2010 and 2009 (unaudited)
(c) For the six months ended June 30, 2010 and 2009 (unaudited)
11
12
13

14

15

16
Notes to Financial Statements (unaudited)
The accompanying unaudited financial statements, in the opinion of management, include all adjustments (consisting only of normal recurring adjustments) necessary for a fair presentation of Man-AHL Diversified Trading Company L.P.’s (a Delaware Limited Partnership) (the “Trading Company”) financial condition at June 30, 2010 and the results of its operations for the three months ended June 30, 2010 and 2009 and six months ended June 30, 2010 and 2009. These financial statements present the results of interim periods and do not include all the disclosures normally provided in annual financial statements. It is suggested that these financial statements be read in conjunction with the audited financial statements and notes included in Man-AHL Diversified I L.P.’s annual report on Form 10-K filed with the Securities and Exchange Commission for the year ended December 31, 2009. The December 31, 2009 information has been derived from the audited financial statements as of December 31, 2009.
|
1.
|
ORGANIZATION OF THE TRADING COMPANY
|
Man-AHL Diversified Trading Company L.P. (a Delaware Limited Partnership) (the “Trading Company”) was organized in November 1997 under the Delaware Revised Uniform Limited Partnership Act and commenced operations on April 3, 1998, for the purpose of engaging in the speculative trading of futures and forward contracts. Man Investments (USA) Corp. (the “General Partner”), a Delaware corporation, serves as the Trading Company’s general partner. The General Partner is a subsidiary of Man Group plc, a United Kingdom public limited company that is listed on the London Stock Exchange. The General Partner oversees the operations and management of the Trading Company. The General Partner is registered with the CFTC as a commodity pool operator and commodity trading adviser and is a member of the NFA in such capacities.
The Trading Company was formed to serve as a trading vehicle for certain limited partnerships sponsored by the General Partner in a “master-feeder” structure. The limited partners, Man-AHL Diversified I L.P., Man-AHL Diversified II L.P., and Man-AHL Diversified L.P., are limited partnerships whose general partner is the General Partner. Man-AHL Diversified L.P. fully redeemed from the Trading Company as of December 31, 2009 and transferred a portion of the assets to Man-AHL Diversified I L.P. on January 1, 2010.
Man-AHL (USA) Limited (the “Advisor”), a limited liability company incorporated in the United Kingdom, acts as trading advisor to the Trading Company. The Advisor is an affiliate of the General Partner and a subsidiary of Man Group plc. The Advisor is registered with the CFTC as a commodity pool operator and commodity trading advisor, and is a member of the NFA, in such capacities in addition to registration with the Financial Services Authority in the United Kingdom. On April 21, 2008, the Trading Company engaged Man Investments Limited, a company organized under the Laws of the United Kingdom, to manage the foreign currency forward component of the AHL Diversified Program, at no additional cost to the Trading Company. The personnel of Man Investments Limited responsible for implementing the foreign currency forwards trading component of the AHL Diversified Program on behalf of the Trading Company are the same as those of the Advisor who implement the AHL Diversified Program.
|
2.
|
SIGNIFICANT ACCOUNTING POLICIES
|
The Trading Company prepares its financial statements in conformity with accounting principles generally accepted in the United States of America. The following is a summary of the significant accounting and reporting policies used in preparing the financial statements.
Use of Estimates — The preparation of financial statements in conformity with accounting principles generally accepted in the United States of America requires the General Partner to make estimates and assumptions that affect the reported amounts of assets and liabilities (and disclosure of contingent assets and liabilities) at the date of the financial statements and the reported amounts of revenues and expenses during the reporting period. Actual results could differ from those estimates.
Due From Brokers — Due from brokers consists of balances due from MF Global, Inc. (“MFG”), Credit Suisse, JPMorgan Chase and Royal Bank of Scotland (“RBS”). In general, the brokers pay the
17
Trading Company interest monthly, based on agreed upon rates, on the Trading Company’s average daily balance.
MFG is registered with the CFTC as a futures commission merchant and is a member of the NFA.
Amounts due from brokers include cash held at brokers and cash posted as collateral. Included in due from broker on the statements of financial condition is $13,200,853 and $32,588,852 of cash restricted as collateral held as of June 30, 2010 and December 31, 2009, respectively.
Derivative Contracts — In the normal course of business, the Trading Company enters into derivative contracts (“derivatives”) for trading purposes. Derivatives traded by the Trading Company include futures contracts and forward contracts. The Trading Company records derivatives at fair value. Futures contracts, which are traded on a national exchange, are valued at the close price as of the valuation day, or if no sale occurred on such day, at the close price on the most recent date on which a sale occurred. Forward contracts, which are not traded on a national exchange, are valued at fair value using current market quotations provided by brokers.
Realized and unrealized changes in fair values are included in realized and unrealized gains and losses on investments and foreign currency transactions in the statements of operations. All trading activities are accounted for on a trade-date basis.
|
3.
|
PARTNERSHIP AGREEMENT
|
The Advisor is the sole trading advisor to the Trading Company.
The General Partner and limited partners share in the profits and losses of the Trading Company in proportion to the number of units or unit equivalents held by each partner. However, no limited partner is liable for obligations of the Trading Company in excess of its capital contribution and net profits or losses, if any. The General Partner owned no direct interest in the Trading Company during the years ended December 31, 2009 and 2008.
Distributions (other than redemption of units), if any, are made on a pro rata basis at the sole discretion of the General Partner.
Expenses incurred by the Trading Company are not reflected in the financial reporting of the Trading Company level but are allocated pro rata among the investors in the Trading Company and reflected directly in the financial reporting of the limited partners. These expenses include, but are not limited to, all costs relating to trading activity, such as brokerage commissions, management and incentive fees, continuing offering expenses and legal, audit and tax return preparation fees. Partner contributions occur as of the first day of any month at the opening net asset value. Limited partners may redeem any or all of their units as of the end of any month at net asset value per unit upon 10 days prior written notice to the General Partner. The General
Partner may suspend redemptions of units of the Trading Company only if the Trading Company’s ability to withdraw capital from any investment is restricted. The Trading Company will be dissolved on December 31, 2037, or upon the occurrence of certain events as specified in the Trading Company’s limited partnership agreement.
|
4.
|
FAIR VALUE MEASUREMENTS
|
The Trading Company segregates its investments into three levels based upon the inputs used to derive the fair value. “Level 1” investments use inputs from unadjusted quoted prices from active markets. “Level 2” investments reflect inputs other than quoted prices, but use observable market data. “Level 3” investments are valued using unobservable inputs. These unobservable inputs for “Level 3” investments reflect the Trading Company’s assumption about the assumptions market participants would use in pricing the investments. Future contracts are valued based on quoted prices from the exchange and are categorized as Level 1 investments in the fair value hierarchy. Forward contracts are valued at fair value using independent pricing services and are categorized as Level 2
18
investments in the fair value hierarchy. As of June 30, 2010 and December 31, 2009, the Trading Company did not have any positions in “Level 3”.

Effective January 1, 2010, the Trading Company has adopted the provisions of the Financial Accounting Standards Board (“FASB”) issued Accounting Standard Update No. 2010-06, Fair Value Measurements and Disclosures (Topic 820): Improving Disclosures about Fair Value Measurements ("ASU 2010-06") to add new requirements for disclosures about transfers into and out of Level 1 and Level 2 and separate disclosures about purchases, sales, issuances, and settlements relating to Level 3 measurements. It also clarifies existing fair value disclosures about the level of disaggregation and about inputs and valuation techniques used to measure fair value. ASU 2010-06 is effective for the first reporting period (including interim periods) beginning after December 15, 2009, except for the
requirement to provide the Level 3 activity of purchases, sales, issuances, and settlements on a gross basis, which will be effective for fiscal years beginning after December 15, 2010, and for interim periods within those fiscal years. The adoption of ASU 2010-06 only affected financial statement disclosures and had no impact on the financial position, results of operations, or cash flows of the Trading Company. There were no transfers between Level 1 and Level 2 investments.
|
5.
|
DERIVATIVE TRANSACTIONS
|
The investment objective of the Trading Company is achieved by participation in the AHL Diversified Program directed on behalf of the Trading Company by Man-AHL (USA) Limited. The AHL Diversified Program is a futures and forward price trend-following trading system, entirely quantitative in nature, and implements trading positions on the basis of statistical analyses of past price histories. The objective of the AHL Diversified Program is to deliver substantial capital growth for commensurate levels of volatility over the medium term, independent of the movement of the stock and bond markets, through the speculative trading, directly and indirectly, of physical commodities, futures contracts, spot and forward contracts, options on the foregoing, exchanges of futures for physical transactions and other investments on domestic and international exchanges and markets (including the interbank and OTC markets). The AHL Diversified Program trades globally in several market sectors, including, without limitation, currencies, bonds, energies, stocks indices, interest rates, metals and agriculture.
All the strategies and systems of the AHL Diversified Program are designed to target defined volatility levels rather than returns, and the investment process is underpinned by computer-supported analytical instruments and disciplined real-time risk and management information systems. A proprietary risk measurement method similar to the industry standard “value-at-risk” helps ensure that the rule-based decisions that drive the investment process remain within predefined risk parameters. Margin-to-equity ratios are monitored daily, and the level of exposure in each market is quantifiable at any time and is adjusted in accordance with market volatility. Market correlation is closely monitored to prevent over-concentration of risk and ensure optimal portfolio weightings. Market liquidity is examined with the objective of ensuring that the Trading Company will be able to initiate and close out trades as indicated by AHL Diversified Program’s systems at
19
market prices, while brokerage selection and trade execution are continually monitored with the objective of ensuring quality market access.
During the quarter ended June 30, 2010, the Trading Company traded 108,536 exchange-traded future contracts and settled 56,399 OTC forward contracts. During the six month period ended June 30, 2010, the Trading Company traded 184,550 exchange-traded future contracts and settled 98,185 OTC forward contracts. During the quarter ended June 30, 2009, the Trading Company traded 65,567 exchange-traded future contracts and settled 24,950 OTC forward contracts. During the six month period ended June 30, 2009, the Trading Company traded 117,481 exchange-traded future contracts and settled 35,994 OTC forward contracts.
The Trading Company trades derivative financial instruments that involve varying degrees of market and credit risk. Market risks may arise from unfavorable changes in interest rates, foreign exchange rates, or the fair values of the instruments underlying the contracts. All contracts are stated at fair value, and changes in those values are reflected in the change in net unrealized trading gains (losses) on open contracts in the statements of operations.
Credit risk arises from the potential inability of counterparties to perform in accordance with the terms of the contract. The credit risk from counterparty non-performance associated with these instruments is the net unrealized trading gain, if any, included in the statements of financial condition. Forward contracts are entered into on an arm’s-length basis with RBS and JPMorgan Chase. As required by the Derivatives and Hedging Topic of the FASB Accounting Standards Codification, the Trading Company’s accounting policy is such that open contracts with the same counterparty are netted at the account level, in accordance with master netting arrangements in place with each party, as applicable. Netting is effective across products and cash collateral when so specified in the
applicable netting agreement. At June 30, 2010 and December 31, 2009, estimated credit risk with regard to forward contracts was $0 and $247,019, respectively.
For exchange-traded contracts, the clearing organization functions as the counterparty of specific transactions and, therefore, bears the risk of delivery to and from counterparties to specific positions, which mitigates the credit risk of these instruments.
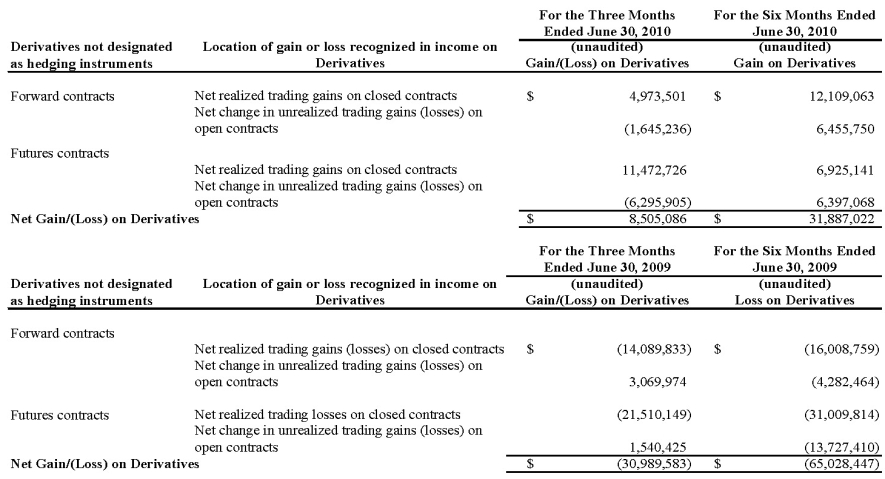
The following table presents the fair value of the Trading Company’s derivative instruments and statement of financial condition location.

20
** Open forward and future contracts are presented on the gross basis for the purposes of the tables above. Net unrealized trading gains and losses are netted by counterparty in the Statements of Financial Condition in accordance with generally accepted accounting principles related to the right of offset under ASC 210, Balance Sheet.
The following table presents the impact of derivative instruments on the Statements of Operations. The Trading Company did not designate any derivatives as hedging instruments for the three months and six months ended June 30, 2010 and June 30, 2009.
|
6.
|
SUBSEQUENT EVENTS
|
The General Partner has evaluated the impact of subsequent events on the Trading Company through the date of financial statement issuance, and noted no subsequent events that require adjustment to or disclosure in these financial statements.
21
|
ITEM 2.
|
Management's Discussion and Analysis of Financial Condition and Results of Operations.
|
Introduction
Reference is made to Item 1, “Financial Statements.” The information contained therein is essential to, and should be read in conjunction with, the following analysis.
Operational Overview
Man-AHL Diversified I L.P. (the “Partnership”) is a speculative managed futures fund which trades through its investment in Man-AHL Diversified Trading Company L.P. (the “Trading Company”) pursuant to the AHL Diversified Program, directed on behalf of the Trading Company by Man-AHL (USA) Limited (the “Advisor”). The AHL Diversified Program is a futures and forward price trend-following trading system, entirely quantitative in nature, and implements trading positions on the basis of statistical analyses of past price histories. The AHL Diversified Program is proprietary and confidential, so that substantially the only information that can be furnished regarding the Partnership’s results of operations is contained in the performance record of its trading through the Trading Company. Past performance is not necessarily indicative of its futures results. Man Investments (USA) Corp., the general partner of the Partnership (the “General Partner”) does believe, however, that there are certain market conditions, for example, markets with pronounced price trends, in which the Partnership has a greater likelihood of being profitable than in other market environments.
Capital Resources and Liquidity
Units of limited partnership interests (“Units”) of the Partnership may be offered for sale as of the beginning, and may be redeemed as of the end, of each month.
The Partnership raises additional capital only through the sale of Units and capital is increased through trading profits (if any) and interest income. The Partnership does not engage in borrowing. The Partnership, not being an operating company, does not incur capital expenditures. It functions solely as a passive trading vehicle, investing the substantial majority of its assets in the Trading Company. Its remaining capital resources are used only as assets available to make further investments in the Trading Company and to pay Partnership level expenses. Accordingly, the amount of capital raised for the Partnership should not have a significant impact on its operations.
Partnership assets not invested in the Trading Company are maintained in cash and cash equivalents in bank accounts or accounts with the JPMorgan Chase Bank, N.A. (the “Broker”) and are readily available to the Partnership. The Partnership may redeem any part or all of its limited partnership interest in the Trading Company at any month-end at the net asset value per unit of the Trading Company. The Trading Company’s assets are generally held as cash or cash equivalents which are used to margin futures and provide collateral for forward contracts and other over-the-counter contract positions and are withdrawn, as necessary, to pay redemptions (to the Partnership and other investors in the Trading Company). Other than potential market-imposed limitations on liquidity, due, for example, to limited open interest in certain futures markets or to daily price fluctuation limits, which are inherent in the Trading Company’s futures trading, the Trading Company’s assets are highly liquid and are expected to remain so.
There have been no material changes with respect to the Partnership's critical accounting policies, off-balance sheet arrangements or disclosure of contractual obligations as reported in the Partnership's Form 10-K filed March 31, 2010.
22
Results of Operations
Due to the nature of the Partnership’s trading, the results of operations for the interim period presented should not be considered indicative of the results that may be expected for the entire year.
Periods Ended June 30, 2010:
|
30-Jun-10
|
|
|
Ending Equity
|
$392,514,041
|
Three months ended June 30, 2010:
Net assets decreased $4,802,910 for the three months ended June 30, 2010. This decrease was attributable to subscriptions in the amount of $17,018,042, redemptions in the amount of $23,213,918 and a net gain from operations of $1,392,965.
Management Fees of $2,842,103, brokerage commissions of $433,952 and servicing fees of $1,461,461 were paid or accrued, and interest of $146,813 was earned or accrued on the Partnership’s cash and cash equivalent investments, for the three months ended June 30, 2010.
The Partnership’s other expenses paid or accrued for the three months ended June 30, 2010 were $165,437.
Six months ended June 30, 2010:
Net assets increased $58,005,725 for the six months ended June 30, 2010. This increase was attributable to subscriptions in the amount of $94,622,392, redemptions in the amount of $50,354,702 and a net gain from operations of $13,738,034.
Management Fees of $5,644,257, brokerage commissions of $806,053 and servicing fees of $2,903,856 were paid or accrued, and interest of $275,644 was earned or accrued on the Partnership’s cash and cash equivalent investments, for the six months ended June 30, 2010.
The Partnership’s other expenses paid or accrued for the six months ended June 30, 2010 were $260,716.
Three months ended June 30, 2010:
The agriculturals sector posted a loss in the second quarter. There was no real underlying trend in the agriculturals sector as a whole, resulting in the majority of contracts being held both long and short at different times over the period. Long cotton positions were the leading detractors. Having risen over 50% in the past 12 months, cotton prices were more volatile in the quarter, largely moving between 5% up and 5% down, therefore causing a whipsawing of positions. Further losses came from cocoa and wheat positions. The AHL Diversified Program was unable to lock in gains related to positions on cocoa contracts as cocoa prices exhibited no stable trend in the quarter. Wheat positions were held short for the entire quarter and consequently suffered as wheat prices rallied on the back of supply concerns.
Bond market trading posted strong and consistent gains in the second quarter. Long positions in US, European and Japanese bonds proved particularly profitable as investors demand for “safe haven” assets surged amid fears that the global economic recovery would be hurt by the eurozone sovereign debt crisis. Data releases in the US, such as May’s private sector figures from the US non-farm payroll showing that only 41,000 jobs were created, also helped to rally bond prices as investors increasingly grew concerned over the fragility of the economic recovery. Japanese bonds also received a boost from increased investor confidence after the Japanese government pledged to balance its books within 10 years, restrict debt sales and overhaul the domestic tax system.
23
The currency sector produced mixed performances in the second quarter and ultimately posted a loss. The main detractors were long positions in commodity-linked and emerging market currencies against the US dollar, including trades such as long AUD/USD, CAD/USD, ZAR/USD and BRL/USD. With the onset of a higher level of investor risk aversion due to the European sovereign debt crisis and concerns over a global economic slowdown, currencies linked to higher growth rates faltered as investors fled from more risky assets in favor of “safe haven” currencies. For example the Australian dollar fell 8.3% versus the US dollar over the quarter while the US dollar rallied 4.5% on a trade-weighted basis. On the positive side, the dominating trade was short euro positions as the AHL Diversified Program capitalized on the Greek debt crisis and subsequent concerns over the future stability of the euro. Leading trades in this theme included short euro positions against the US dollar and Japanese yen as the euro fell 9.4% against the dollar and 14.3% against the yen. Other notable gains came from short British pound positions due to concerns over UK’s fiscal position and speculation that UK may have its credit rating cut as a result.
The energy sector posted a loss in the second quarter. Losses were predominantly due to short positions in natural gas as prices rose on forecasts of hot weather in the US and government predictions of an extremely active hurricane season later this year. As a result, demand increased while the outlook for supply dampened. Further losses were due to long positions in crude oil and other oil related products. Prices of crude oil and other oil related products were negatively affected as fears over the future demand outlook on the back of sovereign debt issues in Europe weighed on investors and by signs of a slowdown in China’s economic growth towards the end of the quarter.
Trading in the interest rate sector produced profits in the second quarter. Short-term interest rate trading posted a profit as long positions in various contracts benefitted after sovereign debt issues and reduced future growth expectations raised speculation that interest rates around the globe were unlikely to be raised for a prolonged period of time. Long positions in Eurodollar proved particularly profitable as investors grew concerned over weaker-than-expected jobs data and comments from the Federal Reserve, highlighting their cautious outlook on the US economy. Long Euribor positions also generated strong gains as lingering sovereign debt issues in Europe continued to weigh on investor expectations for growth. Elsewhere, long positions in Short Sterling added gains due to worries that UK’s emergency budget, which proposed savage cuts to public spending, would pose a threat to UK’s economic recovery. As a result, prices rose as investors increasingly expected that the Bank of England would continue to keep UK interest rates at record lows in order to support the fragile recovery.
Metals trading ended the second quarter with a loss, despite a profitable start in April. The majority of long positions profited in April amid expectations that commodity demand from China will remain firm, as evidenced by China’s strong economic growth in the first quarter. However, the outlook for demand deteriorated in May following reports that China had implemented additional measures to cool its rapidly expanding economy. In particular, long positions in nickel and copper dragged on performance. While long positions in gold benefitted from continued demand for “safe haven” assets as investors increasingly took flight from the sovereign debt troubles in Europe, such risk aversion theme continued in June to the detriment of long base metal positions, with losses resulting from such positions outweighing the profits accrued from long gold positions.
Trading in stock indices posted a loss in the second quarter. The majority of long positions proved unprofitable over the quarter, led by Germany’s Dax, Japan’s Nikkei 225 and France’s CAC 40. Losses were more a function of marginal losses widely dispersed across a large number of contracts. Losses across the board indicated a broad global sell-off as investors shunned risky assets, sending stock prices steeply lower. In Europe, fears that the Greek debt debacle could repeat itself in other countries drove investors from local stock markets over the majority of the quarter. Meanwhile in Asia, stock indices largely took their direction from European markets. In particular, stocks in Japanese exporters fell due to concerns over the effect that the crisis will have on exports to the region. In June, the ongoing “risk on/risk off” environment proved troublesome with losses experienced on both the long and short side for the majority of contracts as the AHL Diversified Program failed to work around whipsawing equity
24
prices. On the positive side, long positions in the Russell 2000 and short positions in S&P 500 managed to post modest gains over the quarter.
Three months ended March 31, 2010:
The agriculturals sector ended the first quarter relatively flat after significant gains generated from short wheat positions were offset by losses sustained mainly from long positions in cotton, soy, sugar, cocoa and coffee.
Bond market trading ended the quarter down as profitable positions in European bonds were offset by losses in US Treasuries and Japanese government bonds. In the case of European bonds, long positions were beneficial in January in particular as concerns rose on the back of Greece’s fiscal problems. 10-year European bond yields continued to edge downwards over February and March, ending the quarter 30bps lower. The directional nature of European bonds was in contrast to 10-year US Treasury yields which fluctuated in the range of 3.5% - 3.9%, the choppy nature causing losses on both the long and short positions. It was a similar scenario for trading in Japanese bonds; long positions posted losses at the beginning and end of the quarter as yields advanced.
The currency sector performed well over the period as several strong trends emerged. The general ‘risk on’ trade continued to produce returns as commodity linked currencies, most notably the Australian dollar, rose on the back of the general recovery theme. The Australian dollar was further buoyed as the Reserve Bank of Australia raised interest rates to the benefit of long positions against the US dollar. However, the majority of the sector’s returns were a function of the sovereign debt concerns in the eurozone. Fears over high levels of debt in Greece, but also Ireland, Spain, Italy and Portugal led to a substantial fall in the value of the euro and resulted in large profits from the program’s short euro positioning. Further profits accrued elsewhere in Europe with the British pound coming under pressure following a combination of poor economic data, general election concerns and comments from the Bank of England suggesting a potential expansion of the quantitative easing program. On the negative side, whipsawing of positions led losses in the euro:pound and yen:dollar currency pairs.
The energy sector posted a modest profit in the period. A large profit was made on the back of shorting natural gas as it dropped to below $4 MMBtu by the end of March. This was due to seasonal temperature rises and concerns over growing supply as US gas stocks rose for the first time this year with weekly inventories up 11bn cubic feet, slightly above consensus market forecasts. Trading in crude oil was far more difficult as prices proved volatile and positions whipsawed. Prices were negatively affected by the concerns over sovereign debt in Europe and the possibility of monetary tightening in China. However, they were also bolstered by more positive news from the eurozone at the end of the period as a financial support package for Greece was agreed upon.
Trading in the interest rate sector produced profits as long positions in Euribor, Eurodollar and Short Sterling contracts performed well amid rising prices. Euribor headed the group; interest rate expectations in the eurozone remained low as the region worked towards a solution to Greece’s debt issues. In addition, concerns over the economic performance of other member nations such as Portugal, Ireland and Spain indicated to investors that rates would need to remain low in order to support an economic recovery. In the US, comments by Federal Reserve officials reiterated that rates would remain low for an extended period, driving Eurodollar prices higher. Long trades in Short Sterling were also beneficial as the UK’s budget position, the possibility of further quantitative easing and a timid economic rebound lowered expectations of a near-term rate hike.
Metals trading ended the quarter relatively flat. In January, the majority of long exposures weighed on performance. Fears that potential increases in interest rates in China, US and other major economies and sovereign debt problems in Europe could negatively impact demand for resources capped the performance of metals. Gold prices fell sharply towards the end of January as its appeal as a hedge against a weakened US dollar lessened as the US currency firmed over the month. Despite continued weakness in gold prices in February and March, sentiment towards commodities generally improved as
25
the period progressed, amid bouts of weakness in the US dollar which prompted a broad return to risky assets, leading to gains for some long metals positions, notably nickel.
The majority of stock positions were held long over the quarter. However, long positions proved to be slightly detrimental. Despite positive trading in US stocks, losses made in the European and Asian markets were significant enough to wipe out gains. European stocks suffered due to credit difficulties in Greece which rose to the fore in mid-January. Over the three months, fears over European countries’ ability to repay its sovereign debt spread to Portugal and Spain. As a result, European stocks fell, with the MSCI Europe losing 1.8% over the quarter. As for Asian stocks, Chinese stocks were particularly impacted by concerns over imminent monetary tightening in China and the possibility of a revaluation of the renminbi. The Hang Seng Index led losses in this period.
Periods Ended June 30, 2009:
|
30-Jun -09
|
|
|
Ending Equity
|
$270,592,541
|
Three months ended June 30, 2009:
Net assets increased $38,269,933 for the three months ended June 30, 2009. This increase was attributable to subscriptions in the amount of $72,966,664, redemptions in the amount of $15,608,783 and a net loss from operations of $19,087,948.
Management Fees of $1,976,382, brokerage commissions of $163,458 and servicing fees of $990,802 were paid or accrued, and interest of $98,540 was earned or accrued on the Partnership’s cash and cash equivalent investments, for the three months ended June 30, 2009.
The Partnership’s other expenses paid or accrued for the three months ended June 30, 2009 were $99,333.
Six months ended June 30, 2009:
Net assets increased $51,350,781 for the six months ended June 30, 2009. This increase was attributable to subscriptions in the amount of $118,078,449, redemptions in the amount of $29,211,508 and a net loss from operations of $37,516,160.
Management Fees of $3,714,397, brokerage commissions of $290,623 and servicing fees of $1,859,809 were paid or accrued, and interest of $230,367 was earned or accrued on the Partnership’s cash and cash equivalent investments, for the six months ended June 30, 2009.
The Partnership’s other expenses paid or accrued for the six months ended June 30, 2009 were $270,287.
Three months ended June 30, 2009:
Agriculture produced significant losses during the quarter, primarily driven by cotton, wheat, coffee and cocoa positions. Cotton reached a six month high in early May, although the AHL Diversified Program did not lock-in any profits due to volatile trading. Short positions in wheat for April and May resulted in losses, as prices rose. Losses were partially recovered in late June as short positions profited from declining prices. Switching in mid-May to a long position in coffee proved profitable in the short term, as wholesale coffee prices rose due to continued demand despite the economic downturn. However, all gains were reversed as prices fell sharply in June. Cocoa prices were highly volatile again this quarter, as market sentiment over long term demand whipsawed, preventing any profits from emerging. Sugar produced the greatest return as long positions gained from a sustained rally.
26
The bond sector experienced a loss over the quarter, dragged particularly by April’s negative performance. The AHL Diversified Program’s long positions in US and European government bonds proved particularly damaging to performance after prices generally fell as risk appetite rose.
Renewed concerns over a dramatic increase in US government bond issuance over the coming months weighed heavily on US Treasuries. Prices fell further after a report on home prices supported the view that the US housing market was stabilizing. In Europe, bond prices slumped after the European Central Bank cut rates by a smaller-than-expected amount. Elsewhere, long positions in UK Gilts also proved damaging over April and May as prices fell amid increasing alarm over UK’s rising debt levels and fears that it could lose its triple A credit status.
Elsewhere, long positions in Japanese government bonds were impacted by significant fluctuations in May price movements. A switch to short positions in early June also proved unfavourable as prices rallied strongly throughout June. Poor economic data, which suggested a slow economic recovery, was the main driver of demand for the safe haven asset. Profits generated from exposure to Australian bonds over May and June managed to trim losses. As Australian bond prices trended lower, the AHL Diversified Program’s short positions benefited.
Currency market trading incurred a loss for the quarter as a large degree of choppy movements negatively impacted performance and offset gains elsewhere.
At the beginning of the period, world equity markets had enjoyed a month of strong rising markets as investors responded to an improvement in news flow by increasing risk levels. This rally in riskier assets continued in April and May as signs of life in the banking system grew larger and China’s huge stimulus plan began to filter through to official statistics. The latter played a key role in the advance of commodity-linked currencies such as AUD, ZAR, BRL and NZD in which the AHL Diversified Program held long positions against USD. All contributed strongly to returns over the period, although the month of June was less beneficial than the previous two, as trends eased to trade largely within a band.
For many currencies, volatility in June was merely a continuation of choppy movements experienced in the previous two months. For currency pairs, EUR/GBP and JPY/USD, the quarter was significantly volatile with little observable trends developing. This led to a significant fluctuation of positions which ultimately caused losses for the AHL Diversified Program. The same was apparent with trading in EUR/CHF although losses here were extended further due to a sharp snapback in late June. Finally, the largest loss to the AHL Diversified Program came from short positions in GBP/USD as the British pound advanced on the back of the rise in risk appetite seen over April and May. In June, the currency traded within a band with no notable trend, negatively impacting returns again.
The energy sector produced the largest contribution to overall returns during the quarter. Switching in early May to a long position in Crude Oil proved profitable as it rallied to an eight month high of over USD 73 per barrel in June. However, profits tailed off slightly towards the end of the month on news of weaker-than-expected US consumer confidence. Gains also came from long positions in Gasoline which closely followed the performance of crude. Natural gas detracted from profits as prices significantly fluctuated due to conflicting economic data and concerns over a “supply crunch” after Gazprom announced investment cuts and production delays.
Interest rate trading was the principal source of losses for the quarter. Primarily long positions in Eurodollar, Euribor and Short Sterling were responsible for the losses as the previously profitable trend reversed in the second half of May and in early June. Eurodollar prices plummeted over the period as positive economic data, better than expected US unemployment figures being the main trigger, sparked speculation of a rise in the US interest rates and a significant increase in LIBOR rates towards the back end of the year. However, losses were limited by gains secured in May especially from long positions in Eurodollar, Euribor and Short Sterling.
27
Metals positions suffered losses over the quarter. Base metals produced the worst return with short positions in Nickel, Aluminum and Copper losing heavily as these commodities climbed on positive manufacturing surveys in the US, Europe and China and a weak US dollar. Long positions in the precious metals all incurred small losses as prices fell sharply mid-way through June. Long positions in Gold made steady profits during May, but again were quickly reversed in June as the dollar strengthened.
Trading in stock indices for the quarter finished negative despite accumulating gains in April. Highly volatile markets since mid May meant the AHL Diversified Program could not benefit from any sustained trends and duly surrendered all earlier profits. The biggest losses were from exposure to the S&P 500. Despite the index having its best quarter since 1998, choppy trading meant the AHL Diversified Program was unable to lock-in these gains. Other detractors came from European markets with the Euro-Stoxx and Dax Index also lacking any consistent trends. Long positions in the Hang Seng generated profits for the quarter as Asian stocks surged upwards encouraged by signs of a global economic recovery.
Three months ended March 31, 2009:
Equity markets continued on their downward trend in early 2009, before rallying strongly in March. Concerns over the severity of the worldwide recession and lingering fears of bank nationalization drove equity values lower in January and February. However, optimism returned to the market in March as economic data improved and market commentators started to talk of a market bottom being reached.
Amid this environment, the AHL Diversified Program failed to build on its strong performance from last quarter. Numerous long standing trends, from which the AHL Diversified Program had profited in the past, became volatile or reversed direction. This was the case for the majority of sectors, but currency and bond markets in particular. Currency trading posted a loss over the quarter, with the majority of losses coming in the last three weeks of March. Long Japanese yen positions against the US dollar proved to be the largest detractor to performance. Demand for the yen fell over the period as its appeal as a “safe haven” asset came under threat. Poor export data and GDP figures painted a bleak picture of the Japanese economy, while an uptick in risk appetite also reduced demand for the yen. Within bond markets, primarily long positions in almost all markets (US Treasuries and Japanese bond position in particular) were responsible for losses as previously profitable trends became volatile and choppy, with many positions impacted by a whipsawing in prices.
On the positive side, exposure to equity and short-term interest rate markets posted gains. A number of short equity positions capitalized on the slide in equity values around the world, with short S&P 500 contracts providing the greatest gains. On the short-term interest rate market side, long Euribor positions were solely responsible for the positive returns seen within the sector.
The agriculturals sector had mixed performance after small gains from wheat positions were offset by slight losses from exposure to soymeal, soybeans and corn. Short positions in wheat posted gains as prices continued to edge lower due to demand concerns fuelled by the weakening economy. However, short positions in soy and corn proved detrimental, especially in March, after prices rose as Argentine farmers halted grain sales after the government rejected demands to cut a 35% export tariff on soya.
Trading in government bond markets posted a loss over the quarter. Primarily long positions in almost all markets were responsible for the losses as previously profitable trends became volatile and choppy, with many positions impacted by a whipsawing in prices. Falling equity prices in January and February drove more investors into bond markets. However, March saw a large rally in equities as risk appetite improved, removing some demand for government securities.
Currency trading posted a loss over the quarter, with the majority of losses coming in the last three weeks of March. Long Japanese yen positions against the US dollar proved to be the largest detractor to performance. Demand for the yen fell over the period. Short British pound positions versus the US dollar posted losses, mainly due to volatility in this currency pair as the FX rate finished the quarter relatively unchanged. The Swiss National Bank’s (SNB) decision to intervene and devalue its currency produced
28
negative performance for the AHL Diversified Program’s long positions in the Swiss franc against the US dollar. The SNB narrowed its target interest rate range, sold francs and bought bonds in an attempt to provide stimulus to the countries export-driven economy and to avoid deflation. Short Euro versus US dollar positions also weighed on performance, particularly over the latter half of the quarter. The US currency weakened as the Federal Reserve announced it was set to implement a quantitative approach to monetary policy. The Fed stated it would buy $300bn of long-term US Treasuries in an effort to boost market liquidity, surprising most investors.
Energy trading had an overall negative quarter as the previous year’s trend in the oil market came to an end. The AHL Diversified Program struggled with whipsawing trends in oil markets as prices became largely range bound as market forces in both directions bought against each other. Global recession pushed oil prices down while OPEC agreed to cut production and some positive economic data helped rally commodities. Losses were improved by gains in short natural gas trades.
Interest rate trading posted gains for the quarter. Long Euribor positions were responsible for almost all of the sector’s positive performance. Fears of deflation, expectations of interest rates cuts and actual ECB moves in the Eurozone area boosted prices throughout the period. Holding back further gains were losses from Eurodollar positions held in February.
Trading in base metals made a slight loss over the period. Short positions in copper were the largest detractor from performance as the commodity experienced a rally towards the end of the period amidst improving US economic data and a more optimistic outlook for the Chinese economy. Short positions in aluminum proved to be the best performer as prices declined sharply over January as the outlook for future demand deteriorated and stock levels increased, pushing prices lower. Trading in precious metals posted a loss over the quarter. Short positions in silver proved to be misplaced as prices rose during the first of the period on safe haven buying. Long gold trades benefited from this safe haven buying over the first half of the period. However, prices failed to break through the all important $1000 mark, falling back quickly and becoming largely range bound, leading to losses over the second half of the quarter.
ITEM 3. Quantitative and Qualitative Disclosures About Market Risk.
Not required.
ITEM 4T. Controls and Procedures.
The General Partner, with the participation of the General Partner's Chief Executive Officer and Chief Financial Officer, has evaluated the effectiveness of the design and operation of the Partnership’s disclosure controls and procedures as of the end of the fiscal quarter ended June 30, 2010. Based on such evaluation, the Partnership’s Chief Executive Officer and Chief Financial Officer have concluded that the Partnership’s disclosure controls and procedures were effective as of the fiscal quarter ended June 30, 2010.
Changes in Internal Control over Financial Reporting
There were no significant changes in the Partnership’s internal control over financial reporting during the quarter ended June 30, 2010 that have materially affected, or are reasonably likely to materially affect, the Partnership’s internal control over financial reporting.
29
PART II - OTHER INFORMATION
Item 1. Legal Proceedings.
None.
Item 1A. Risk Factors.
Not required.
Item 2. Unregistered Sales of Equity Securities and Use of Proceeds.
(a) Pursuant to the Partnership’s Limited Partnership Agreement, the Partnership may sell Units of Limited Partnership Interests (“Units”) as of the last business day of any calendar month or at such other times as the General Partner may determine. On April 30, 2010, May 31, 2010 and June 30, 2010, the Partnership sold Class A Units, exclusive of non-cash transfers, to existing and new Limited Partners in the amount of $3,381,908, $3,775,815, and $4,613,383, respectively. On April 30, 2010, May 31, 2010 and June 30, 2010, the Partnership sold Class A-2 Units, exclusive of non-cash transfers, to existing and new Limited Partners in the amount of $350,000, $815,000 and $360,692, respectively. On April 30, 2010, May 31, 2010 and June 30, 2010, the Partnership sold Class B Units, exclusive of non-cash transfers, to existing and new Limited Partners in the amount of $1,001,808, $902,000 and $1,452,335, respectively. On January April 30, 2010, May 31, 2010 and June 30, 2010, the Partnership sold Class B-2 Units, exclusive of non-cash transfers, to existing and new Limited Partners in the amount of $181,000, $122,000 and $62,000, respectively. There were no underwriting discounts or commissions in connection with the sales of the Units described above.
(b) Not applicable.
(c) Pursuant to the Partnership’s Limited Partnership Agreement, a Limited Partner may redeem some or all of its Units as of the last business day of each calendar month at the then current month-end Net Asset Value. The redemption of Units has no impact on the value of Units that remain outstanding, and Units are not reissued once redeemed. The following table summarizes the amount of Units redeemed, exclusive of non-cash transfers, during the three months ended June, 2010:
|
Class A Units
|
Class A-2 Units
|
Class B Units
|
Class B-2 Units
|
|||||
|
Date of Redemption:
|
Amount Redeemed:
|
Amount Redeemed:
|
Amount Redeemed:
|
Amount Redeemed:
|
||||
|
April 30, 2010
|
$7,268,388
|
$1,078,120
|
$894,749
|
$112,800
|
||||
|
May 31, 2010
|
$5,997,247
|
$2,559,132
|
$286,880
|
$25,000
|
||||
|
June 30, 2010
|
$3,575,413
|
$1,073,896
|
$342,293
|
$0
|
||||
|
TOTAL
|
$16,841,048
|
$4,711,148
|
$1,523,922
|
$137,800
|
Item 3. Defaults upon Senior Securities.
None.
Item 4. (Removed and Reserved).
30
Item 5. Other Information.
None.
Item 6. Exhibits.
The following exhibits are included herewith:
Designation Description
|
31.1
|
Rule 13a-14(a)/15d-14(a) Certification of Principal Executive Officer
|
|
31.2
|
Rule 13a-14(a)/15d-14(a) Certification of Principal Financial Officer
|
|
32.1
|
Section 1350 Certification of Principal Executive Officer
|
|
32.2
|
Section 1350 Certification of Principal Financial Officer
|
The following exhibits are incorporated by reference herein from the exhibits of the same description and number filed on January 28, 2008 with the Partnership's Registration Statement on Form 10 (Reg. No. 000-53043).
|
3.1
|
Certificate of Limited Partnership of Man-AHL Diversified I L.P.
|
|
10.1
|
Form of Customer Agreement between E D & F Man International Inc. and Man-AHL Diversified Trading Company L.P.
|
|
10.2
|
Form of Trading Advisor Agreement between Man-AHL Diversified I L.P., Man Investments (USA) Corp. and Man-AHL (USA) Limited.
|
|
10.3
|
Form of Selling Agreement between Man Investments (USA) Corp. and Man Investments Inc.
|
The following exhibits are incorporated by reference herein from the exhibits of the same description and number filed on March 31, 2010 with the Partnership's Annual Report on Form 10-K.
|
4.2
|
Sixth Amended Limited Partnership Agreement of Man-AHL Diversified I L.P.
|
31
SIGNATURES
Pursuant to the requirements of the Securities Exchange Act of 1934, the registrant has duly caused this report to be signed on its behalf by the undersigned thereunto duly authorized on August [ ], 2010.
|
Man-AHL Diversified I L.P.
(Registrant)
|
|||
| By: Man Investments (USA) Corp.
General Partner
|
|||
| By: | /s/ Andrew Stewart | ||
|
President and Chief Executive Officer
(Principal Executive Officer)
|
|||
| By: | /s/ Alicia Borst Derrah | ||
|
Vice President, Chief Financial Officer and Secretary
(Principal Financial and Chief Accounting Officer)
|
|||
32
EXHIBIT INDEX
Exhibit Number Description of Document
|
31.1
|
Rule 13a-14(a)/15d-14(a) Certification of Principal Executive Officer
|
|
31.2
|
Rule 13a-14(a)/15d-14(a) Certification of Principal Financial Officer
|
|
32.1
|
Section 1350 Certification of Principal Executive Officer
|
|
32.2
|
Section 1350 Certification of Principal Financial Officer
|
33