Attached files
| file | filename |
|---|---|
| EX-23.1 - CONSENT OF INDEPENDENT REGISTERED PUBLIC ACCOUNTING FIRM - Cibolan Gold Corp | gnmt_ex231.htm |
| EX-31.2 - CERTIFICATION - Cibolan Gold Corp | gnmt_ex312.htm |
| EX-32.1 - CERTIFICATION - Cibolan Gold Corp | gnmt_ex321.htm |
| EX-32.2 - CERTIFICATION - Cibolan Gold Corp | gnmt_ex322.htm |
| EX-31.1 - CERTIFICATION - Cibolan Gold Corp | gnmt_ex311.htm |
UNITED STATES
SECURITIES AND EXCHANGE COMMISSION
Washington, D.C. 20549
FORM 10-K
(Mark One)
|
þ
|
ANNUAL REPORT PURSUANT TO SECTION 13 OR 15(d) OF THE SECURITIES EXCHANGE ACT OF 1934
|
|
For the fiscal year ended April 30, 2010
|
o
|
TRANSITION REPORT UNDER SECTION 13 OR 15(d) OF THE SECURITIES EXCHANGE ACT OF 1934
|
|
For the transition period from ______________________ to ______________________
Commission file number 000-30230
|
General Metals Corporation
|
|
(Exact name of registrant as specified in its charter)
|
|
Delaware
|
65-0488983
|
|
|
(State or other jurisdiction of incorporation or organization)
|
(I.R.S. Employer Identification No.)
|
|
615 Sierra Rose Drive, Suite 1, Reno, NV
|
89511
|
|
|
(Address of principal executive offices)
|
(Zip Code)
|
|
Registrant's telephone number, including area code:
|
775-583-4636
|
Securities registered pursuant to Section 12(b) of the Act:
|
Title of Each Class
|
Name of Each Exchange On Which Registered
|
|
|
N/A
|
N/A
|
Securities registered pursuant to Section 12(g) of the Act:
|
N/A
|
|
(Title of class)
|
|
Indicate by check mark if the registrant is a well-known seasoned issuer, as defined in Rule 405 the Securities Act.
|
||||||
|
Yes o No þ
|
||||||
|
Indicate by check mark if the registrant is not required to file reports pursuant to Section 13 or Section 15(d) of the Act
|
||||||
|
Yes o No þ
|
||||||
|
Indicate by check mark whether the registrant: (1) has filed all reports required to be filed by Section 13 or 15(d) of the Securities Exchange Act of 1934 during the preceding 12 months (or for such shorter period that the registrant was required to file such reports) and (2) has been subject to such filing requirements for the last 90 days.
|
||||||
|
Yes þ No o
|
||||||
|
Indicate by check mark whether the registrant has submitted electronically and posted on its corporate Website, if any, every Interactive Data File required to be submitted and posted pursuant to Rule 405 of Regulation S-K (§229.405 of this chapter) during the preceding 12 months (or for such shorter period that the registrant was required to submit and post such files).
|
||||||
|
Yes o No o
|
||||||
|
Indicate by check mark if disclosure of delinquent filers pursuant to Item 405 of Regulation S-K (§229.405 of this chapter) is not contained herein, and will not be contained, to the best of registrant's knowledge, in definitive proxy or information statements incorporated by reference in Part III of this Form 10-K or any amendment to this Form 10-K.
|
||||||
|
o
|
||||||
|
Indicate by check mark whether the registrant is a large accelerated filer, an accelerated filer, a non-accelerated filer, or a smaller reporting company. See definition of “large accelerated filer,” “accelerated filer” and “smaller reporting company” in Rule 12b-2 of the Exchange Act.
|
||||||
|
Large accelerated filer
|
o
|
Accelerated filer
|
o |
|
Non-accelerated filer
|
o
|
Smaller reporting company
|
þ |
|
Indicate by check mark whether the registrant is a shell company (as defined in Rule 12b-2 of the Exchange Act).
|
||||||
|
Yes o Noþ
|
||||||
The aggregate market value of Common Stock held by non-affiliates of the Registrant on October 31, 2009 was $11,743,255 based on a $0.06 closing price for the Common Stock on October 30, 2009. For purposes of this computation, all executive officers and directors have been deemed to be affiliates. Such determination should not be deemed to be an admission that such executive officers and directors are, in fact, affiliates of the Registrant.
|
Indicate the number of shares outstanding of each of the registrant’s classes of common stock as of the latest practicable date.
|
|
219,821,625 shares of common stock issued & outstanding as of August 11, 2010
|
DOCUMENTS INCORPORATED BY REFERENCE
None.
TABLE OF CONTENTS
| Item 1. | Business | 1 | |||
| Item 1A. | Risk Factors | 3 | |||
| Item 2. | Properties | 7 | |||
| Item 3. | Legal Proceedings | 10 | |||
| Item 4. | Submissions of Matters to a Vote of Security Holders | 10 | |||
| Item 5. | Market for Common Equity and Related Stockholder Matters | 11 | |||
| Item 6. | Selected Financial Data | 15 | |||
| Item 7. | Management’s Discussion and Analysis of Financial Condition and Results of Operations | 15 | |||
| Item 7A. | Quantitative and Qualitative Disclosures About Market Risk | 26 | |||
| Item 8. | Financial Statements and Supplementary Data | 26 | |||
| Item 9. | Changes in and Disagreements with Accountants on Accounting and Financial Disclosure | 59 | |||
| Item 9A (T). | Controls and Procedures | 50 | |||
| Item 9B. | Other Information | 52 | |||
| Item 10. | Directors, Executive Officers and Corporate Governance | 53 | |||
| Item 11. | Executive Compensation | 59 | |||
| Item 12. | Security Ownership of Certain Beneficial Owners and Management and Related Stockholder Matters | 61 | |||
| Item 13. | Certain Relationships and Related Transactions, and Director Independence | 61 | |||
| Item 14. | Principal Accountants Fees and Services | 62 | |||
| Item 15. | Exhibits, Financial Statement Schedules | 63 |
i
PART I
|
ITEM 1.
|
BUSINESS
|
This annual report contains forward-looking statements. These statements relate to future events or our future financial performance. In some cases, you can identify forward-looking statements by terminology such as “may”, “should”, “expects”, “plans”, “anticipates”, “believes”, “estimates”, “predicts”, “potential” or “continue” or the negative of these terms or other comparable terminology. These statements are only predictions and involve known and unknown risks, uncertainties and other factors, including the risks in the section entitled “Risk Factors”, that may cause our or our industry’s actual results, levels of activity, performance or achievements to be materially different from any future results, levels of activity, performance or achievements expressed or implied by these forward-looking statements.
Although we believe that the expectations reflected in the forward-looking statements are reasonable, we cannot guarantee future results, levels of activity, performance or achievements. Except as required by applicable law, including the securities laws of the United States, we do not intend to update any of the forward-looking statements to conform these statements to actual results.
Our financial statements are stated in United States Dollars (US$) and are prepared in accordance with United States Generally Accepted Accounting Principles.
In this annual report, unless otherwise specified, all dollar amounts are expressed in United States Dollars and all references to “common shares” refer to the common shares in our capital stock.
As used in this annual report, the terms “we”, “us”, “our company”, mean General Metals Corporation a Delaware corporation and our subsidiary, General Gold Corporation, a Nevada corporation, unless otherwise indicated.
Corporate History
We were organized in the State of New Jersey on March 4, 1995 under the name Interactive Multimedia Network, Inc. We were reincorporated in the State of Delaware on September 13, 1995. We changed our name to RECOV Energy Corp. effective March 29, 2005. On or about January 12, 2006 we changed our name to General Metals Corporation.
On January 20, 2006, we entered into a Share Purchase Agreement with General Gold Corporation, a Nevada company incorporated on July 17, 1998, and the former shareholders of General Gold set out in the Agreement. The closing of the transactions contemplated in the Agreement and the acquisition by our company of all of the issued and outstanding and convertible securities of General Gold occurred on March 15, 2006.
Our business office is located at 615 Sierra Rose Drive, Suite 1, Reno, NV 89511. This is our mailing address as well. Our telephone number is 775-583-4636.
There is no assurance that a commercially viable mineral deposit exists on the property and further exploration will be required before a final evaluation as to the economic feasibility is determined.
We have no plans to change its business activities or to combine with another business, and are not aware of any events or circumstances that might cause us to change our plans.
1
Our Current Business
We are a junior mineral resource company engaged in the acquisition, exploration, development and mining of gold, silver and other precious and base metal properties.
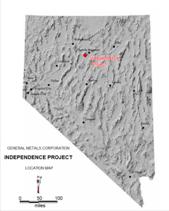
In April 2005, we acquired through the assignment of a lease certain unpatented mining claims located in the Battle Mountain District, Lander County, State of Nevada, as more particularly described in the lease, known also as the “Independence Mine”. In August 2007 we expanded the Independence Mine by adding four mining claims and 2 additional easements. These claims cover the area where the existing cyanide decantation mill and operating facilities are currently sited and the area where the Pioneer haul road to and from the Sunshine pit crosses the Independence claims; specifically, Independence #1, #2, DC#83 and An Old Glory. Since acquiring the lease, and additional mining claims and easements, our exploration and development activities have been focused on getting the Independence Mine into production. See Item 2 Properties for a more detailed discussion.
The purchase price paid by us to Gold Range, LLC in consideration for the assignment of the lease was $75,000, 5,000,000 of our restricted common shares and a 1% net smelter return royalty payable to Gold Range, LLC in addition to other underlying net smelter return requirements.
On March 15, 2007, we acquired a 100% interest in Mikite Gold Resources, a Ghanaian corporation with exclusive exploration rights to the 150 square kilometer Nyinahin mining concession near Bibiani, Ghana. On October 31, 2008 we sold all of our interest in the Nyinahin mining concession for $500,000 in cash, and 2,000,000 restricted shares of common stock of Sunergy Inc. On November 3, 2008, we received a partial payment of $12,500 due on the principal payment as noted under the agreement for the sale of the Nyinahin Mining. On December 5, 2008, we amended the agreement with Sunergy to allow for the remainder of the initial payment to be made on or before December 31, 2008. On December 30, 2008, we accepted 500,000 freely tradable shares as a $250,000 payment on the purchase price in lieu of cash. As of April 30, 2009, we received stock consideration from Sunergy as noted in the agreements above. On or about July 29, 2009, we entered into an agreement with Sunergy, Inc for the final terms for the sale of the Nyinahin Mining Concession to Sunergy. Pursuant to the agreement with General Metals, as amended, the outstanding consideration payable by Sunergy consisted of 2,000,000 shares of common stock of Sunergy in satisfaction of $237,500, which was due on April 30, 2010. Subsequent to April 30, 2010, General Metals sold its rights to collect the $237,500 or the 2,000,000 shares remaining outstanding on the agreement to third parties for $75,000. The Company retains a 5% Net Smelter Return Royalty in the property.
In addition to the on-going development of the Independence Mine, we are continually seeking to acquire other mining claims, as our funding permits.
Competition
The mining industry is intensely competitive. We compete with numerous individuals and companies, including many major mining companies, which have substantially greater technical, financial and operational resources and staffs. Accordingly, there is a high degree of competition for access to funds. There are other competitors that have operations in the area and the presence of these competitors could adversely affect our ability to compete for financing and obtain the service providers, staff or equipment necessary for the exploration and exploitation of our properties.
Compliance with Government Regulation
Mining operations and exploration activities are subject to various national, state, provincial and local laws and regulations in the United States, as well as other jurisdictions, which govern prospecting, development, mining, production, exports, taxes, labor standards, occupational health, waste disposal, protection of the environment, mine safety, hazardous substances and other matters.
We believe that we are and will continue to be in compliance in all material respects with applicable statutes and the regulations passed in the United States. There are no current orders or directions relating to our company with respect to the foregoing laws and regulations.
2
Employees
Currently our only employees are our directors, officers, office administrator and an investor relations consultant. We do not expect any material changes in the number of employees over the next 12 month period. We do and will continue to outsource contract employment as needed.
Going Concern
We anticipate that additional funding will be required in the form of equity financing from the sale of our common stock. At this time, we cannot provide investors with any assurance that we will be able to raise sufficient funding from the sale of our common stock or through a loan from our directors to meet our obligations over the next twelve months. We do not have any definitive arrangements in place for any future equity financing.
Subsidiaries
General Gold Corporation, a Nevada corporation is our wholly owned subsidiary.
REPORTS TO SECURITY HOLDERS
We are not required to deliver an annual report to our stockholders but will voluntarily send this form 10-K report which includes our annual audited financial statements upon request. We are required to file annual, quarterly and current reports, proxy statements, and other information with the Securities and Exchange Commission. Our Securities and Exchange Commission filings are available to the public over the Internet at the SEC's website at http://www.sec.gov.
The public may read and copy any materials filed by us with the SEC at the SEC's Public Reference Room at 100 F Street, NE, Washington DC 20549. The public may obtain information on the operation of the Public Reference Room by calling the SEC at 1-800-SEC-0330. We are an electronic filer. The SEC maintains an Internet site that contains reports, proxy and information statements, and other information regarding issuers that file electronically with the SEC. The Internet address of the site is http://www.sec.gov.
|
ITEM 1A.
|
RISK FACTORS
|
Much of the information included in this annual report includes or is based upon estimates, projections or other “forward looking statements”. Such forward looking statements include any projections and estimates made by us and our management in connection with our business operations. While these forward-looking statements, and any assumptions upon which they are based, are made in good faith and reflect our current judgment regarding the direction of our business, actual results may vary, sometimes materially, from any estimates, predictions, projections, assumptions or other future performance suggested herein.
Such estimates, projections or other “forward looking statements” involve various risks and uncertainties as outlined below. We caution the reader that important factors in some cases have affected and, in the future, could materially affect actual results and cause actual results to differ materially from the results expressed in any such estimates, projections or other “forward looking statements”.
Risks Related To Our Business:
We do not expect positive cash flow from operations in the near term. If we are unable to obtain financing in the amounts and on terms deemed acceptable to us, we may be unable to continue our business and as a result may be required to scale back or cease operations for our business.
We do not expect positive cash flow from operations in the near term. There is no assurance that actual cash requirements will not exceed our estimates. In particular, additional capital may be required in the event that:
- drilling, exploration and completion costs for our Independence mine project increase beyond our expectations; or
- we encounter greater costs associated with general and administrative expenses or offering costs.
The occurrence of any of the aforementioned events could adversely affect our ability to meet our business plans.
3
We will depend almost exclusively on outside capital to pay for the continued exploration and development of our properties. Such outside capital may include the sale of additional stock and/or commercial borrowing. We can provide no assurances that any financing will be successfully completed.
Capital may not continue to be available if necessary to meet these continuing development costs or, if the capital is available, that it will be on terms acceptable to us. The issuance of additional equity securities by us would result in a significant dilution in the equity interests of our current stockholders. Obtaining commercial loans, assuming those loans would be available, will increase our liabilities and future cash commitments.
If we are unable to obtain financing in the amounts and on terms deemed acceptable to us, we may be unable to continue our business and as a result may be required to scale back or cease operations for our business, the result of which would be that our stockholders would lose some or all of their investment.
We have a limited operating history and if we are not successful in continuing to grow our business, then we may have to scale back or even cease our ongoing business operations.
We have no history of revenues from operations and limited tangible assets. We have yet to generate positive earnings and there can be no assurance that we will ever operate profitably. Our company has a limited operating history and must be considered in the development stage. The success of our company is significantly dependent on a successful acquisition, drilling, completion and production program. Our company’s operations will be subject to all the risks inherent in the establishment of a developing enterprise and the uncertainties arising from the absence of a significant operating history. We may be unable to locate recoverable reserves or operate on a profitable basis. We are in the development stage and potential investors should be aware of the difficulties normally encountered by enterprises in the development stage. If our business plan is not successful, and we are not able to operate profitably, investors may lose some or all of their investment in our company.
Because of the early stage of development and the nature of our business, our securities are considered highly speculative.
Our securities must be considered highly speculative, generally because of the nature of our business and the early stage of its development. We are engaged in the business of exploring and, if warranted, developing commercial reserves of gold and silver. Our properties are in the exploration stage only and are without known reserves of gold and silver. Accordingly, we have not generated any revenues nor have we realized a profit from our operations to date and there is little likelihood that we will generate any revenues or realize any profits in the short term. Any profitability in the future from our business will be dependent upon locating and developing economic reserves of gold, silver or other minerals, which itself is subject to numerous risk factors as set forth herein. Since we have not generated any revenues, we will have to raise additional monies through the sale of our equity securities or debt in order to continue our business operations.
As our properties are in the exploration and development stage there can be no assurance that we will establish commercial discoveries on our properties.
Exploration for mineral reserves is subject to a number of risk factors. Few properties that are explored are ultimately developed into producing mines. Our properties are in the exploration and development stage only and are without proven reserves. We may not establish commercial discoveries on any of our properties.
4
Because of the unique difficulties and uncertainties inherent in mineral exploration ventures, we face a high risk of business failure.
Potential investors should be aware of the difficulties normally encountered by new mineral exploration companies and the high rate of failure of such enterprises. The likelihood of success must be considered in light of the problems, expenses, difficulties, complications and delays encountered in connection with the exploration of the mineral properties that we plan to undertake. These potential problems include, but are not limited to, unanticipated problems relating to exploration, and additional costs and expenses that may exceed current estimates. The expenditures to be made by us in the exploration of the mineral claim may not result in the discovery of mineral deposits. Problems such as unusual or unexpected formations and other conditions are involved in mineral exploration and often result in unsuccessful exploration efforts. If the results of our exploration programs do not reveal viable commercial mineralization, we may decide to abandon our claim and acquire new claims for new exploration. The acquisition of additional claims will be dependent upon us possessing capital resources at the time in order to purchase such claims. If no funding is available, we may be forced to abandon our operations.
Because of the speculative nature of exploration of mineral properties, there is no assurance that our exploration activities will result in the discovery of new commercially exploitable quantities of minerals.
We plan to continue exploration on our mineral properties. The search for valuable minerals as a business is extremely risky. We can provide investors with no assurance that additional exploration on our properties will establish that additional commercially exploitable reserves of precious metals on our properties. Problems such as unusual or unexpected geological formations or other variable conditions are involved in exploration and often result in exploration efforts being unsuccessful. The additional potential problems include, but are not limited to, unanticipated problems relating to exploration and attendant additional costs and expenses that may exceed current estimates. These risks may result in us being unable to establish the presence of additional commercial quantities of ore on our mineral claims with the result that our ability to fund future exploration activities may be impeded.
Because we anticipate our operating expenses will increase prior to our earning revenues, we may never achieve profitability.
Prior to completion of our exploration stage, we anticipate that we will incur increased operating expenses without realizing any revenues. We therefore expect to incur significant losses into the foreseeable future. We recognize that if we are unable to generate significant revenues from the exploration of our mineral claims, we will not be able to earn profits or continue operations. There is no history upon which to base any assumption as to the likelihood that we will prove successful, and we can provide no assurance that we will generate any revenues or ever achieve profitability. If we are unsuccessful in addressing these risks, our business will most likely fail.
Because of the inherent dangers involved in mineral exploration, there is a risk that we may incur liability or damages as we conduct our business.
The search for valuable minerals involves numerous hazards. As a result, we may become subject to liability for such hazards, including pollution, cave-ins and other hazards against which we cannot insure or against which we may elect not to insure. At the present time we have no coverage to insure against these hazards. The payment of such liabilities may have a material adverse effect on our financial position.
If our exploration costs are higher than anticipated, then our profitability will be adversely affected.
We are currently proceeding with exploration of our mineral properties on the basis of estimated exploration costs. If our exploration costs are greater than anticipated, then we will not be able to carry out all the exploration of the properties that we intend to carry out. Factors that could cause exploration costs to increase are: adverse weather conditions, difficult terrain and shortages of qualified personnel.
As we face intense competition in the mining industry, we will have to compete with our competitors for financing and for qualified managerial and technical employees.
The mining industry is intensely competitive in all of its phases. Competition includes large established mining companies with substantial capabilities and with greater financial and technical resources than we have. As a result of this competition, we may be unable to acquire additional attractive mining claims or financing on terms we consider acceptable. We also compete with other mining companies in the recruitment and retention of qualified managerial and technical employees. If we are unable to successfully compete for financing or for qualified employees, our exploration and development programs may be slowed down or suspended.
5
As we undertake exploration of our mineral claim, we will be subject to compliance with government regulation that may increase the anticipated cost of our exploration program.
There are several Federal and State governmental regulations that materially restrict mineral exploration. We will be subject to the laws of the State of Nevada and the regulations of the Bureau of Land Management as we carry out our exploration programs. We may be required to obtain work permits, post bonds and perform remediation work for any physical disturbance to the land in order to comply with these laws. While our planned exploration program budgets for regulatory compliance, there is a risk that new regulations could increase our costs of doing business and prevent us from carrying out our exploration program.
Any change to government regulation/administrative practices may have a negative impact on our ability to operate and our profitability.
The laws, regulations, policies or current administrative practices of any government body, organization or regulatory agency in the United States or any other jurisdiction, may be changed, applied or interpreted in a manner which will fundamentally alter the ability of our company to carry on our business.
The actions, policies or regulations, or changes thereto, of any government body or regulatory agency, or other special interest groups, may have a detrimental effect on us. Any or all of these situations may have a negative impact on our ability to operate and/or our profitably.
Our By-laws contain provisions indemnifying our officers and directors against all costs, charges and expenses incurred by them.
Our By-laws contain provisions with respect to the indemnification of our officers and directors against all costs, charges and expenses, including an amount paid to settle an action or satisfy a judgment, actually and reasonably incurred by him, including an amount paid to settle an action or satisfy a judgment in a civil, criminal or administrative action or proceeding to which he is made a party by reason of his being or having been one of our directors or officers.
Investors' interests in our company will be diluted and investors may suffer dilution in their net book value per share if we issue additional shares for significant amount of services or raise funds through the sale of equity securities.
Our constating documents authorize the issuance of 500,000,000 shares of common stock with a par value of $0.001 and 50,000,000 preferred shares with a par value of $0.001. In the event that we are required to issue any additional shares or enter into private placements to raise financing through the sale of equity securities, investors' interests in our company will be diluted and investors may suffer dilution in their net book value per share depending on the price at which such securities are sold. If we issue any such additional shares, such issuances also will cause a reduction in the proportionate ownership and voting power of all other shareholders. Further, any such issuance may result in a change in our control.
Some of our directors and officers are residents of countries other than the United States and investors may have difficulty enforcing any judgments against such persons within the United States.
Some of our directors and officers are nationals and/or residents of countries other than the United States, and all or a substantial portion of such persons’ assets are located outside the United States. As a result, it may be difficult for investors to enforce within the United States any judgments obtained against our company or our officers or directors, including judgments predicated upon the civil liability provisions of the securities laws of the United States or any state thereof.
6
Risks Associated With Our Common Stock:
Our stock is a penny stock. Trading of our stock may be restricted by the Securities and Exchange Commission’s penny stock regulations and the Financial Industry Regulatory Authority’s sales practice requirements, which may limit a stockholder's ability to buy and sell our stock.
Our stock is a penny stock. The Securities and Exchange Commission has adopted Rule 15g-9 which generally defines "penny stock" to be any equity security that has a market price (as defined) less than $5.00 per share or an exercise price of less than $5.00 per share, subject to certain exceptions. Our securities are covered by the penny stock rules, which impose additional sales practice requirements on broker-dealers who sell to persons other than established customers and "accredited investors". The term "accredited investor" refers generally to institutions with assets in excess of $5,000,000 or individuals with a net worth in excess of $1,000,000 or annual income exceeding $200,000 or $300,000 jointly with their spouse. The penny stock rules require a broker-dealer, prior to a transaction in a penny stock not otherwise exempt from the rules, to deliver a standardized risk disclosure document in a form prepared by the Securities and Exchange Commission which provides information about penny stocks and the nature and level of risks in the penny stock market. The broker-dealer also must provide the customer with current bid and offer quotations for the penny stock, the compensation of the broker-dealer and its salesperson in the transaction and monthly account statements showing the market value of each penny stock held in the customer's account. The bid and offer quotations, and the broker-dealer and salesperson compensation information, must be given to the customer orally or in writing prior to effecting the transaction and must be given to the customer in writing before or with the customer's confirmation. In addition, the penny stock rules require that prior to a transaction in a penny stock not otherwise exempt from these rules, the broker-dealer must make a special written determination that the penny stock is a suitable investment for the purchaser and receive the purchaser's written agreement to the transaction. These disclosure requirements may have the effect of reducing the level of trading activity in the secondary market for the stock that is subject to these penny stock rules. Consequently, these penny stock rules may affect the ability of broker-dealers to trade our securities. We believe that the penny stock rules discourage investor interest in and limit the marketability of our common stock.
In addition to the "penny stock" rules promulgated by the Securities and Exchange Commission, the Financial Industry Regulatory Authority has adopted rules that require that in recommending an investment to a customer, a broker-dealer must have reasonable grounds for believing that the investment is suitable for that customer. Prior to recommending speculative low priced securities to their non-institutional customers, broker-dealers must make reasonable efforts to obtain information about the customer's financial status, tax status, investment objectives and other information. Under interpretations of these rules, the Financial Industry Regulatory Authority believes that there is a high probability that speculative low priced securities will not be suitable for at least some customers. The Financial Industry Regulatory Authority requirements make it more difficult for broker-dealers to recommend that their customers buy our common stock, which may limit your ability to buy and sell our stock.
ITEM 1B. UNRESOLVED STAFF COMMENTS
As a “smaller reporting company”, we are not required to provide the information required by this Item.
ITEM 2. PROPERTIES
On April 28, 2009, we purchased a 480 acre of private land which will be used for mineral processing, equipment storage and maintenance. The full purchase price was $67,767 with 30% down and the balance by way of seller. The financing carries an interest rate of 10% per annum for a period of 10 years with quarterly payments of $1,874 with no pre-payment penalty. Legal Description: Township 30 North, Range 43 East, M.D.M., Section 17 N/2, SW/4 comprising 480 acres.
Our principal business offices are located 615 Sierra Rose Drive, Suite 1, Reno, NV 89511. We currently lease our space at an annual cost of $32,256. We believe that our current lease arrangements provide adequate space for our foreseeable future needs.
7
The Independence Mine Property
We currently control a 100% undivided leasehold interest in the Wilson-Independence Gold – Silver Mine, situated in the Battle Mountain Mining District, Lander County, Nevada. The property consists of 14 whole and fractional mining claims encompassing 240 acres. Due diligence completed by our company shows that all claims are valid and in good standing through and for the assessment year ending August 31, 2010.
The Wilson-Independence project is wholly owned by General Metals though it subsidiary company General Gold Corporation under a mining lease/option agreement with Independence Gold Silver Mines of Seattle, Washington. Under the terms of the agreement General Metals was required to expend a minimum of $625,000 towards exploration development and commercial production of ores, minerals or materials which expenditure was fulfilled prior to our fiscal year ended April 30, 2008. During the year ended April, 30, 2010, we spent approximately $910,000 on exploration and development including the initiation of the permitting process.
The term of the lease is for a period of 20 years commencing October 1, 2005. There is a production royalty payable for the sale of all gold, silver or platinum based upon the average daily price of gold on the London Metal Exchange as follows: 3% when the price of gold per ounce is less than $375, 4% when the price of gold per ounce is between $375 and $475 and 5% when the price of gold is over $475. There is also a production royalty of 3% payable on the sale of all substances other than gold, silver and platinum. In addition, any future production is subject to a 1% net smelter royalty obligation payable to Gold Range, LLC.
We have the option to purchase the property for $3.0 million (which eliminates the royalty described above) within 10 years of the date the lease commenced provided all obligations have been met.
Location and Access
 |
All infrastructure necessary for the exploration, development and operation of a mine is readily available. The property is accessed via federal, state and county maintained all weather paved and gravel roads from the nearby town of Battle Mountain. A well-trained work force is available in the town of Battle Mountain, situated 30 miles north of the property along Interstate highway 80. Adequate ground water is available for diversion for future mining operations which enjoy special treatment as temporary or interim uses under Nevada water laws. Electrical power has recently been extended to within one mile of the project to service the Phoenix project, and the transcontinental natural gas line passes within 1.5 miles of the property. | |
| The property has been the site of intermittent historic exploration and mining activities since the late 1920s. Past mining operations extracted 65,000 tons of high grade gold and silver ores from the property. The bulk of this activity occurred during two periods, the first from high grade ores shipped for direct smelting during the late 1940s and early 1950s, and a second from 1975 to 1983 when a significant amount of underground development took place, and a mill erected on the property. During its peak period of production in 1976 the mine shipped up to 1 ton of gold and silver bullion per month. |
The Independence Mines property consists of 14 whole and fractional unpatented lode mining claims, which cover approximately 240 acres.
8
Core and reverse circulation drilling to date indicate two targets. These two targets are referred to as the Independence Deep (A Target), and the Independence Surface (B Target). Historic mining operations have generated in excess of 70,000 tons of waste dumps, mill tailings, and other waste rock products on the property. Samples of this material contain gold and silver values which suggest potential to recover gold and silver values.
The Wilson-Independence Property covers a mineralized zone on strike with the World Class, Fortitude / Phoenix Gold Skarn Deposit. The property has potential to develop a high grade underground resource in the Antler Sequence, together with a shallow, near surface resource in the overlying Pumpernickel Formation. Situated at the intersection of the Battle Mountain-Eureka Gold Trend and the Northern Nevada Rift (Twin Creeks-McCoy lineament), the Independence Project, like Fortitude and Cove/McCoy, is one of a number of Gold Skarns which occur along the Battle Mountain – Eureka and Northern Nevada Rift Zone mineral lineaments.
Mineralized outcrops are common on the property. Many on the southern part of the property have been prospected by shallow prospect shafts, pits and trenches. In addition, over 100 Reverse Circulation and Core holes, and extensive shallow underground mine workings in the Independence Mine indicate wide spread, shallow, near surface mineralization which we feel represents a valid exploration target for potential future surface, bulk mining operations
Historic drilling and underground mine workings indicate wide spread mineralization, both in shallow, near surface, and deep targets. There are presently no identified reserves or resources on the property. We intend to conduct phased exploration programs to evaluate the mineral potential of this property, with the objective of identifying and developing mineral resources and reserves reportable under SEC Industry Guide 7.
Independence Deep Target
A large body of mineralized material is clearly indicated by previous drilling in the Deep Target. It is likely that proper logging and subsequent geologic modeling has potential to result in the identification of an economic resource. All core, approximately 25,000 feet, is stored on site, and re-logging was completed during the summer of 2006
Mineralization identified in the deep target to date is contained in the lower plate of the Golconda Thrust in rocks of the Battle Mountain and Edna Formations of the Antler Sequence.
Independence Shallow Target
Promising shallow and near surface mineralization has been identified. The Shallow Target contains an oxide target hosted entirely in the Pumpernickel Formation. To date over 130 drill holes and roughly eight (8) miles of underground workings have penetrated portions of this target, all of which have encountered highly anomalous to high grade mineralization. The principle limiting factor for surface/ shallow resources has been the lack of drilling information. . In addition, review of the work done by those which held interests in the property previously has identified a total of 8 shallow near surface mineralized targets on the property with 4 of those being north of the Canyon Fault and 3 others where no mining has been performed and minimal geologic sampling and drilling work completed. To date, we spent over $1.0 million drilling sampling and evaluating these targets. A report on the detailed review of these targets and the results of the exploration and development program follows in Item 7 Management's Discussion and Analysis or Plan of Operation.
Mill & Building On Site
A relatively intact 50 to 75 ton per day Counter Current – Decantation cyanide mill is situated on the property. The present condition of the jaw crusher, cone crusher and ball mill are being evaluated and could possibly be returned to serviceable condition. A complete set of new rubber liners for the ball mill are on site. The mill is housed in a metal clad building erected in 1987.
Mineral Ownership
The Wilson-Independence claims are 100% controlled by our company.
9
ITEM 3. LEGAL PROCEEDINGS
We know of no material, existing or pending legal proceedings against us, nor are we involved as a plaintiff in any material proceeding or pending litigation. There are no proceedings in which any of our directors, officers or affiliates, or any registered or beneficial shareholder, is an adverse party or has a material interest adverse to our company.
ITEM 4. [ REMOVED AND RESERVED ]
10
PART II
ITEM 5. MARKET FOR COMMON EQUITY AND RELATED STOCKHOLDER MATTERS
The high and low bid prices of our common stock for the periods indicated below are as follows:
|
National Association of Securities Dealers OTC Bulletin Board(1)
|
||
|
Quarter Ended
|
High
|
Low
|
|
April 30, 2010
|
$0.05
|
$0.03
|
|
January 31, 2010
|
$0.07
|
$0.04
|
|
October 31, 2009
|
$0.09
|
$0.04
|
|
July 31, 2009
|
$0.09
|
$0.02
|
|
April 30, 2009
|
$0.05
|
$0.02
|
|
January 31, 2009
|
$0.034
|
$0.012
|
|
October 31, 2008
|
$0.11
|
$0.025
|
|
July 31, 2008
|
$0.16
|
$0.071
|
|
April 30, 2008
|
$0.23
|
$0.09
|
|
January 31, 2008
|
$0.22
|
$0.14
|
|
October 31, 2007
|
$0.23
|
$0.12
|
|
July 31, 2007
|
$0.51
|
$0.20
|
|
April 30, 2007
|
$0.29
|
$0.082
|
(1) Over-the-counter market quotations reflect inter-dealer prices without retail mark-up, mark-down or commission, and may not represent actual transactions.
Our shares of common stock are issued in registered form. The registrar and transfer agent for our shares of common stock is Nevada Agency and Transfer Company, 50 West Liberty Street, Suite 880, Reno, NV 89501 (Telephone: 1-775-322 0626; Facsimile: 1-775-322 5623).On August 7, 2010, the list of stockholders for our shares of common stock showed 338 registered stockholders and 219,821,625 shares of common stock outstanding.
Dividends
We have not declared any dividends on our common stock since the inception of our company on March 4, 1995. There is no restriction in our Articles of Incorporation and Bylaws that will limit our ability to pay dividends on our common stock. However, we do not anticipate declaring and paying dividends to our shareholders in the near future.
11
Equity Compensation Plan Information
We have no formal authorized Equity Compensation Plans. The Board grants warrants and/or stock when it deems appropriate. The following table provides a summary of the warrants outstanding, the weighted average price and number of securities remaining available for issuance, all as at April 30, 2010.
|
Plan category
|
Number of securities to be issued upon exercise of outstanding options, warrants and rights
|
Weighted average exercise price of outstanding options, warrants and rights
|
Number of securities remaining available for future issuance under equity compensation plans (excluding securities reflected in column (a))
|
|||
|
(a)
|
(b)
|
(c)
|
||||
|
Equity compensation plans approved by security holders
|
Nil
|
Nil
|
Nil
|
|||
|
Equity compensation plans not approved by security holders
|
Nil
|
Nil
|
Nil
|
|||
|
Total
|
Nil
|
Nil
|
Nil
|
|
Outstanding Equity Awards at Fiscal Year-End
|
The following table sets forth for each named executive officer and director certain information concerning the outstanding equity awards as of April 30, 2010.
|
Option Awards
|
Stock Awards
|
||||||||
|
Name
|
Number of Securities Underlying Unexercised Options Exercisable
|
Number of Securities Underlying Unexercised Options Unexercisable
|
Equity Incentive Plan Awards: Number of Securities Underlying Unexercised Unearned Options
|
Option Exercise Price
|
Option Expiration Date
|
Number of Shares or Units of Stock that Have Not Vested
|
Market Value of Shares or Units of Stock that Have Not Vested
|
Equity Incentive Plan Awards : Number of Unearned Shares, Units or Other Rights that Have Not Vested
|
Equity Incentive Plan Awards : Market or Payout Value of Unearned Shares, Units or Other Rights that Have Not Vested
|
|
Stephen Parent(1)
|
Nil
|
Nil
|
Nil
|
Nil
|
Nil
|
Nil
|
Nil
|
Nil
|
Nil
|
|
Robert Carrington(2)
|
Nil
|
Nil
|
Nil
|
Nil
|
Nil
|
Nil
|
Nil
|
Nil
|
Nil
|
|
Paul Wang (3)
|
Nil
|
Nil
|
Nil
|
Nil
|
Nil
|
Nil
|
Nil
|
Nil
|
Nil
|
|
Daniel Forbush
|
Nil
|
Nil
|
Nil
|
Nil
|
Nil
|
Nil
|
Nil
|
Nil
|
Nil
|
|
David Salari
|
Nil
|
Nil
|
Nil
|
Nil
|
Nil
|
Nil
|
Nil
|
Nil
|
Nil
|
|
Larry M. Bigler
|
Nil
|
Nil
|
Nil
|
Nil
|
Nil
|
Nil
|
Nil
|
Nil
|
Nil
|
|
(1)
|
Mr. Parent resigned as President and a director January 28, 2010.
|
|
(2)
|
Mr. Carrington was appointed President and a director on January 28, 2010.
|
|
(3)
|
Mr. Wang was appointed a Director on March 11, 2010.
|
Purchase of Equity Securities by the Issuer and Affiliated Purchasers
We did not purchase any of our shares of common stock or other securities during the year ended April 30, 2010.
12
Recent Sales of Unregistered Securities
The table below summarized the issuance of shares during the year ended April 30, 2008
|
Description
|
# of shares
|
|||
|
Common Stock issued to convert Debt at $0.075 per share
|
513,333 | |||
|
Common Stock Issued for Cash at $0.125 In Private Placement
|
667,040 | |||
|
Common Stock Issued in Exercise of Share Purchase Warrants at $0.075
|
2,520,979 | |||
|
Common Stock Issued in Exercise of Share Purchase Warrants at $0.20
|
654,500 | |||
|
Common Stock Issued in Exercise of Share Purchase Warrants at $0.125
|
44,000 | |||
|
Common Stock Issued for purchase of asset at $0.125
|
132,000 | |||
|
Common Stock Issued in Exercise of Share Purchase Warrants at $0.20
|
216,000 | |||
|
Common Stock Issued for Cash at $0.125 In Private Placement
|
52,470 | |||
|
Common Stock Issued for Cash at $0.20 In Private Placement
|
2,503,000 | |||
|
Common Stock Issued in Exercise of Share Purchase Warrants at $0.07
|
733,334 | |||
|
Common Stock Issued for Cash at $0.15 In Private Placement
|
900,000 | |||
|
Common Stock Issued in Exercise of Share Purchase Warrants at $0.068
|
146,667 | |||
|
Common Stock Issued in Exercise of Share Purchase Warrants at $0.10
|
110,000 | |||
|
Common Stock Issued in Exercise of Share Purchase warrants at $0.114
|
176,000 | |||
|
Common Stock Issued for services to the advisory board at $0.15
|
2,000,000 | |||
|
Common Stock Issued for Cash at $0.15 In Private Placement
|
100,000 | |||
|
Common Stock Issued in Exercise of Share Purchase warrants at $0.075
|
86,667 | |||
|
Common Stock Issued in Exercise of Share Purchase warrants at $0.114
|
2,200 | |||
|
Common Stock Issued for Cash at $0.20 In Private Placement
|
590,000 | |||
|
Common Shares issued for Cash at $0.15 In Private Placement
|
44,299 | |||
|
Common Stock Issued in Exercise of Share Purchase warrants at $0.068
|
146,300 | |||
|
Common Stock Issued for services at $0.125
|
100,000 | |||
|
Common Stock Issued for Cash at $0.20 In Private Placement
|
100,000 | |||
|
Common Stock Issued for Cash at $0.05 In Private Placement
|
400,000 | |||
|
Common Stock Issued in Exercise of Share Purchase warrants at $0.05
|
275,000 | |||
|
Common Stock Issued in Exercise of Share Purchase warrants at $0.085
|
29,412 | |||
|
Total
|
13,243,201 | |||
We issued the securities to accredited investor pursuant to exemptions from registration as set out in Rule 506 of Regulation D and/or Section 4(2) of the Securities Act of 1933, as amended.
13
The table below summarized the issuance of shares during the year ended April 30, 2009
|
Description
|
# of shares
|
|||
|
Cancellation of previously issued common stock
|
(180,000 | ) | ||
|
Common Stock Issued for Cash at $0.014 In Private Placement
|
7,000,000 | |||
|
Common Stock Issued for Cash at $0.015 In Private Placement
|
2,000,000 | |||
|
Common Stock Issued for Cash at $0.018 In Private Placement
|
1,000,000 | |||
|
Common Stock Issued for Cash at $0.02 In Private Placement
|
8,400,000 | |||
|
Common Stock Issued for Cash at $0.025 In Private Placement
|
2,502,000 | |||
|
Common Stock Issued for Cash at $0.05 In Private Placement
|
8,274,000 | |||
|
Common Stock Issued for Cash at $0.075 In Private Placement
|
870,000 | |||
|
Common Stock Issued for Cash at $0.10 In Private Placement
|
150,000 | |||
|
Common Stock Issued for Cash at $0.15 In Private Placement
|
416,000 | |||
|
Common Stock Issued for services at $0.017
|
750,000 | |||
|
Common Stock Issued for services at $0.02
|
3,500,000 | |||
|
Common Stock Issued for services at $0.021
|
4,250,000 | |||
|
Common Stock Issued for services at $0.024
|
2,500,000 | |||
|
Common Stock Issued for services at $0.025
|
1,000,000 | |||
|
Common Stock Issued for services at $0.029
|
581,396 | |||
|
Common Stock Issued for services at $0.03
|
10,000,000 | |||
|
Common Stock Issued for services at $0.036
|
11,000,000 | |||
|
Common Stock Issued for services at $0.05
|
3,100,000 | |||
|
Common Stock Issued for services at $0.075
|
838,000 | |||
|
Common Stock Issued for services at $0.08
|
4,147,000 | |||
|
Common Stock Issued for services at $0.086
|
2,000,000 | |||
|
Common Stock Issued for services at $0.10
|
150,000 | |||
|
Common Stock Issued in Exercise of Share Purchase Warrants at $0.085
|
33,930 | |||
|
Total
|
74,282,326 | |||
The table below summarized the issuance of shares during the year ended April 30, 2010
|
Description
|
# of shares
|
|||
|
Common Stock Issued for Cash at $0.15 in Private Placement
|
17,561,665 | |||
|
Common Stock Issued for Cash at $0.02 in Private Placement
|
1,605,000 | |||
|
Common Stock Issued for Cash at $0.022 in Private Placement
|
3,050,000 | |||
|
Common Stock Issued for Cash at $0.025 in Private Placement
|
700,000 | |||
|
Common Stock Issued for Cash at $0.033 in Private Placement
|
300,000 | |||
|
Common Stock Issued for Cash at $0.035 in Private Placement
|
240,000 | |||
|
Common Stock Issued for Cash at $0.04 in Private Placement
|
1,125,000 | |||
|
Common Stock Issued for Cash at $0.045 in Private Placement
|
7,047,300 | |||
|
Common Stock Issued for Cash at $0.05 in Private Placement
|
1,090,000 | |||
|
Common Stock Issued for services at $0.02
|
1,000,000 | |||
|
Common Stock Issued for services at $0.028
|
8,400,000 | |||
|
Common Stock Issued for services at $0.032
|
1,500,000 | |||
|
Common Stock Issued for services at $0.035
|
12,500 | |||
|
Common Stock Issued for services at $0.047
|
100,000 | |||
|
Common Stock Issued for services at $0.050
|
750,000 | |||
|
Common Stock Issued for services at $0.065
|
60,000 | |||
|
Common Stock Issued for services at $0.083
|
66,666 | |||
|
Common Stock Issued for Cash at $0.035 in Private Placement
|
314,300 | |||
|
Common Stock Issued for Cash at $0.045 in Private Placement
|
2,872,400 | |||
|
Common Stock Issued for services at $0.041
|
1,850,000 | |||
|
Common Stock Issued for services at $0.050
|
250,000 | |||
|
Common Stock Issued for Cash at $0.05 in Private Placement
|
440,000 | |||
|
Common Stock Issued for settlement of lawsuit at $0.05
|
1,000,000 | |||
|
Common Stock Issued for services at $0.048
|
500,000 | |||
|
Cancellation of Issued Common Stock due to non-payment on receivable
|
(996,700 | ) | ||
|
Common Stock Issued for services at $0.043
|
300,000 | |||
|
Total
|
51,138,131 | |||
14
ITEM 6. SELECTED FINANCIAL DATA
As a “smaller reporting company”, we are not required to provide the information required by this Item.
ITEM 7. MANAGEMENT'S DISCUSSION AND ANALYSIS OF FINANCIAL CONDITION AND RESULTS OPERATIONS
The following discussion should be read in conjunction with our audited financial statements and the related notes for the years ended April 30, 2010 and April 30, 2009 that appear elsewhere in this annual report. The following discussion contains forward-looking statements that reflect our plans, estimates and beliefs. Our actual results could differ materially from those discussed in the forward looking statements. Factors that could cause or contribute to such differences include, but are not limited to those discussed below and elsewhere in this registration statement, particularly in the section entitled "Risk Factors" beginning on page 7 of this annual report.
Our audited financial statements are stated in United States Dollars and are prepared in accordance with United States Generally Accepted Accounting Principles.
Successes and Accomplishments Fiscal Year 2010
During the quarter ended July 31, 2009, our company:
|
1.
|
located all of the sample pulps from the historic (1985-1987) Noranda Minerals drilling in the Independence Gold Skarn target in the Independence Deep Target on our Independence Mine Property and inventoried this pulp library.
|
|
2.
|
validated the data base for the Independence Skarn assays.
|
|
3.
|
released the diamond drill results from the high grade Independence Gold Skarn Target at our Independence property in the Battle Mountain Mining District of Nevada. These intercepts are historic in nature and from diamond drilling conducted by Noranda Minerals from 1985 through 1989 and Great Basin Gold Corp. in 1998. Except for Great Basin Gold drill hole WI-001, none of these results have been previously disclosed.
|
|
4.
|
secured Great Basin Pulps from the High Grade Independence Gold Skarn Target
|
|
5.
|
through analysis and modeling of the Noranda and Great Basin Gold drilling in the Independence Gold Skarn system, identified a target more than half a mile wide and three quarters of a mile long which contains three highly prospective structural / stratigraphic zones.
|
|
6.
|
completed the baseline environmental surveys recently including flora, fauna and bat studies. The reports of these studies are in our company’s files.
|
|
7.
|
collected characterization samples to define appropriate material for bulk samples to be used in advanced metallurgical studies, received the assay results and selected the appropriate material for two bulk samples
|
|
8.
|
received the check assay results required to validate the 2007-2008 drilling results under evaluation for the Independent Report. These results are being evaluated by our company's independent qualified person.
|
|
9.
|
appointed Henry S. Brock, CPA, MBA, CLU, ChFC to our Advisory Board and as Vice President of our company
|
15
During the quarter ended October 31, 2009, our company:
|
1.
|
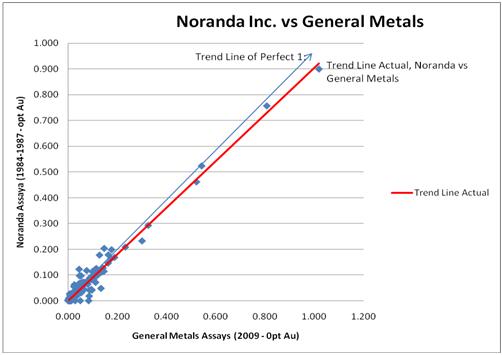
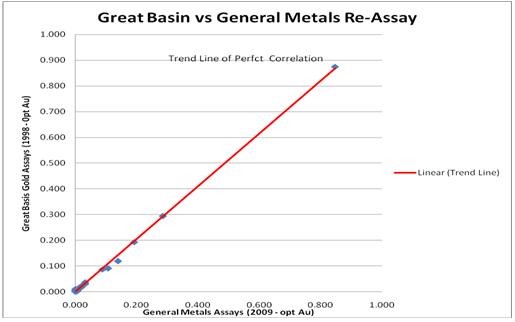
completed the QA/QC on all final re-assays for the major mineralized drill intercepts in the Independence Gold Skarn in the Independence Deep Target. The results correlate exceptionally well with original drill data by Noranda Exploration and Great Basin Gold. Re-assay of Noranda Exploration pulps from their 1984 - 1987 diamond core drilling program returned results that were consistently higher than original assays and on average four percent (4%) higher in grade than the original assays. Importantly, drift in higher grade samples consistently showed that the original Noranda assays underreported the gold content of the gold skarn as shown in Chart 1 below.
|
|
2.
|
collected and delivered two bulk samples of surface oxide mineralization for metallurgical testing including column leach tests at the Independence. The samples were collected under the supervision of personnel from McClelland Laboratories Inc. (McClelland) of Sparks, Nevada. Each sample weighed approximately 2 1/2 tons and both samples have been delivered to McClelland for processing.
|
|
3.
|
through General Gold Corporation, our wholly owned subsidiary, received a grant of water rights for portions of Sections 28 and 33 (T31N, R43E), in Lander County, NV, the proposed center of the Independence Mine's process area.
|
|
4.
|
received initial metallurgical characterization results for bulk samples of surface and near surface, oxide mineralization were completed by McClelland Metallurgical Laboratories of Sparks, Nevada during the quarter ended October 31, 2009. Both the Hill Zone and Independence South Zone samples indicate excellent solution access regardless of feed size with the 2 inch material returning essentially identical gold extraction and recovery in the same leach time as the minus 10 mesh material as seen in the following table.
|
16
Table 1. Gold and Silver Recovery Independence Bottle Roll Tests
|
Au
|
Ag
|
|||||
|
Feed
|
Recovery,
|
Recovery,
|
||||
|
Composite
|
Size
|
%
|
%
|
|||
|
Sample #1 (Hill Zone)
|
2"
|
82.5
|
22.2
|
|||
|
Sample #1 (Hill Zone)
|
1"
|
84.2
|
23.1
|
|||
|
Sample #1 (Hill Zone)
|
1/2"
|
81
|
21.4
|
|||
|
Sample #1 (Hill Zone)
|
10M
|
82.2
|
48.1
|
|||
|
Average
|
82.5
|
28.7
|
||||
|
Sample #2 (South Zone)
|
2"
|
63
|
22.2
|
|||
|
Sample #2 (South Zone)
|
1"
|
58.8
|
27.6
|
|||
|
Sample #2 (South Zone)
|
1/2"
|
61.1
|
30.8
|
|||
|
Sample #2 (South Zone)
|
10M
|
63.6
|
54.7
|
|||
|
Average
|
61.6
|
33.8
|
Test Results Suggest Improved Economics: All test results to date suggest that expensive crushing can be minimized and that Carbon column recovery may be a less expensive processing solution than the previously discussed Merrill Crowe system. Project economics may have improved substantially with these results.
|
5.
|
instructed McClelland to proceed immediately with a large diameter column leach test on the Hill Zone. McClelland will be conducting additional analytical and characterization work to better characterize the leach parameters to optimize leach results for the large diameter column leach in the South Zone. Due to the exceptional recovery in the coarse fractions of the bottle rolls, column leach tests of each sample will be conducted at 2 and 6 inch.
|
|
6.
|
received final approval and has satisfied the required bonding of the drilling permits with the Bureau of Land Management (BLM).
|
|
7.
|
completed 5 of the planned 44 hole 2009 drilling which is designed with three specific objectives:
|
|
a.
|
upgrade all the Hill Zone gold-silver mineralization into measured and indicated categories,
|
|
b.
|
provide sufficient drill density to identify higher grade zones within the Hill Zone mineralization, and
|
|
c.
|
provide sufficient detail to facilitate pit design and detailed mine planning.
|
17
During the quarter ended January 31, 2010, we:
|
1.
|
successfully completed the Company's 2009 - 2010 drilling program of 12,895 feet in 44 drill holes. This drilling program augmented our drilling and added drill density to the Hill Zone area to confirm continuity of grade. Results of the program will be released as pending final assays are received, reviewed and interpreted.
|
|
2.
|
the significant intercepts contained in holes GM 85, 86, 87, 88, 89, 90, 91 and 92
|
|
Drill Hole
|
From (ft)
|
To (ft)
|
Length
|
opt Au
|
opt Ag
|
|
GM-85
|
25
|
40
|
15
|
0.034
|
0.298
|
|
Also
|
75
|
175
|
100
|
0.013
|
0.269
|
|
GM-86
|
0
|
120
|
120
|
0.015
|
0.303
|
|
including
|
65
|
85
|
20
|
0.022
|
0.298
|
|
GM-87
|
0
|
75
|
75
|
0.014
|
0.308
|
|
Also
|
100
|
115
|
15
|
0.023
|
1.372
|
|
GM-88
|
95
|
290
|
195
|
0.035
|
0.527
|
|
Including
|
95
|
110
|
15
|
0.069
|
0.462
|
|
Including
|
140
|
150
|
10
|
0.223
|
14.24
|
|
GM-89
|
325
|
360
|
35
|
0.008
|
0.84
|
|
GM-90
|
340
|
425
|
85
|
0.18
|
0.49
|
|
Bottomed at 425 feet in
|
0.020
|
0.29
|
|||
|
GM-91
|
0
|
85
|
85
|
0.021
|
0.37
|
|
GM-92
|
0
|
30
|
30
|
0.024
|
0.23
|
|
GM-95
|
0
|
90
|
90
|
0.010
|
0.33
|
|
GM-99
|
60
|
195
|
135
|
0.020
|
0.264
|
|
Including
|
115
|
140
|
25
|
0.044
|
1.49
|
|
3.
|
announced that, in keeping with its historic and ongoing efforts to maximize shareholder value, it has been reviewing highly qualified candidates to transition the Company from its current status as a junior explorer to an effective and profitable producing company. To facilitate this transition, Steve Parent has joined the Company's Advisory Board and stepped down from the Board of Directors and as President and CEO. The Board of Directors has appointed Robert Carrington to the Board of Directors and as President to assist in the transition.
|
18
During the quarter ended April 30, 2010, our company:
|
1.
|
completed large diameter column leach tests on coarse crushed ore from the Independence which yielded greater than 90% gold extraction after a 140 day leach cycle.
|
|
2.
|
announced the significant intercepts contained in holes GM 93, 94, 96 thru 102, 111, 112, 115, 116, 121, 122, 124,127, and 128. These results improved the potential economics of the project.
|
|
Drill Hole
|
From
|
To
|
Intercept
|
Gold
|
Silver
|
|||||
|
feet
|
meters
|
feet
|
meters
|
feet
|
meters
|
opt
|
g/T
|
opt
|
g/T
|
|
|
GM-93
|
180
|
54.9
|
245
|
74.7
|
65
|
19.8
|
0.019
|
0.710
|
0.2
|
7.471
|
|
GM-94
|
0
|
0
|
40
|
12
|
40
|
12
|
0.011
|
0.42
|
0.47
|
17.57
|
|
GM-96
|
0
|
0.0
|
25
|
7.6
|
25
|
7.6
|
0.014
|
0.53
|
0.34
|
12.85
|
|
GM-97
|
35
|
10.7
|
65
|
19.8
|
30
|
9.1
|
0.015
|
0.57
|
0.28
|
10.58
|
|
GM-98
|
110
|
34
|
200
|
61
|
90
|
27
|
0.020
|
0.76
|
0.42
|
15.52
|
|
Including
|
110
|
34
|
135
|
41
|
25
|
8
|
0.035
|
1.32
|
0.47
|
17.46
|
|
And
|
155
|
47
|
180
|
55
|
25
|
8
|
0.030
|
1.13
|
0.57
|
21.28
|
|
GM-100
|
45
|
13.7
|
85
|
25.9
|
40
|
12.2
|
0.013
|
0.49
|
0.48
|
18.14
|
|
GM-101
|
155
|
47.3
|
185
|
56.4
|
30
|
9.1
|
0.019
|
0.72
|
0.20
|
7.56
|
|
GM-102
|
145
|
44
|
170
|
52
|
25
|
8
|
0.009
|
0.34
|
0.42
|
15.71
|
|
GM-111
|
305
|
93
|
405
|
123
|
100
|
30
|
0.058
|
2.19
|
0.88
|
32.91
|
|
Including
|
320
|
98
|
355
|
108
|
35
|
11
|
0.080
|
3.02
|
1.33
|
49.73
|
|
GM-112
|
215
|
66
|
300
|
91
|
85
|
26
|
0.028
|
1.06
|
0.38
|
14.21
|
|
Including
|
230
|
70
|
265
|
81
|
35
|
11
|
0.047
|
1.78
|
0.37
|
13.84
|
|
GM-115
|
Bottomed at 135 feet, did not reach target
|
|||||||||
|
GM-116
|
150
|
45.7
|
260
|
79.3
|
110
|
33.5
|
0.018
|
0.68
|
0.16
|
6.05
|
|
Including
|
230
|
70.1
|
245
|
74.7
|
15
|
4.6
|
0.051
|
1.93
|
0.31
|
11.71
|
|
GM-121
|
295
|
89.9
|
310
|
94.5
|
15
|
4.6
|
0.02
|
0.747
|
0.14
|
5.229
|
|
And
|
345
|
105.2
|
400
|
122.0
|
55
|
16.8
|
0.02
|
0.747
|
0.54
|
20.171
|
|
GM-122
|
245
|
75
|
270
|
82
|
25
|
8
|
0.023
|
0.87
|
0.18
|
6.77
|
|
Including
|
335
|
102
|
380
|
116
|
45
|
14
|
0.017
|
0.64
|
0.40
|
15.07
|
|
GM-124
|
275
|
83.8
|
375
|
114.3
|
100
|
30.5
|
0.019
|
0.72
|
0.11
|
4.16
|
|
Including
|
295
|
89.9
|
340
|
103.7
|
45
|
13.7
|
0.034
|
1.28
|
0.13
|
4.91
|
|
GM-127
|
80
|
24.4
|
95
|
29.0
|
15
|
4.6
|
0.027
|
1.02
|
0.18
|
6.80
|
|
Also
|
155
|
47.3
|
200
|
61.0
|
45
|
13.7
|
0.260
|
9.83
|
0.13
|
4.91
|
|
Including
|
155
|
47.3
|
165
|
50.3
|
10
|
3.0
|
0.908
|
34.31
|
0.36
|
13.60
|
|
GM-128
|
295
|
89.9
|
525
|
160.1
|
230
|
70.1
|
0.079
|
2.99
|
0.24
|
9.07
|
|
Including
|
310
|
94.5
|
325
|
991
|
15
|
4.6
|
1.019
|
38.51
|
.99
|
37.42
|
|
3.
|
reported that the State of Nevada, Division of Water Resources (NDWR) formally awarded General Metals water rights which will be immediately available to the Company upon completion of a well.
|
|
4.
|
completed the independent Quality Assurance – Quality Control (QA – QC) assessment which confirmed that the reported results were accurate.
|
|
5.
|
appointed Paul Wang to the Company's board of directors
|
19
Plan of Operation
Fiscal Year 2011 –Permitting and Development Program
During fiscal year 2011, the Company continues an aggressive program, restricted by available funds, to rapidly move the Independence project toward production. We anticipate being able to secure necessary studies and permits to allow us to proceed to production in the near term. On May 5, 2010, we announced completion of a current, independent, technical report and resource calculation compliant with Canadian National Instrument 43-101. The report was submitted to Canadian authorities for review and approval preparatory to the Company being able to use the report with Canadian investment firms to assist the Company in acquiring the resources necessary to complete our aggressive program. This report does not meet SEC Industry Guide 7 guidelines but will provide information in a familiar format for our Canadian and European investors.
Dyer Engineering of Reno, Nevada continues the permitting process necessary to place the Independence Mine into commercial production
Additional extractive metallurgical studies will be undertaken. When these studies are completed, a mine plan will be developed which the Company believes will see much of the mineralization identified in its drilling converted into reserve categories.
We anticipate being able to secure necessary permits to allow us to proceed to production. We anticipate initially mining the Hill Zone and are completing all necessary work to be able to finalize permits to allow us to begin there. Additional drilling and assaying planned to further delineate the Hill Zone mineralization will allow us to maximize our cash flows early in the production cycle.
20
Independence Shallow Target Area
Our drilling program during calendar year 2007 through 2010, confirmed a large body of near surface oxide mineralization over a strike length of more than 4,100 feet and discovered the new Hill Zone. Mineralization is open to depth and along strike to the north. We completed 38,950 feet in 128 drill holes. Holes range from vertical to 45 degrees easterly and vary from 25 to 580 feet deep averaging 304 feet in depth. Drilling in the northern part of the target in drill hole GM 128 intercepted Drilling encountered a 15 foot (4.6 meter) zone estimated to represent the approximate true thickness of high grade gold -- silver mineralization which averaged 1.033 ounces per ton (opt) or 39.04 grams per metric tonne (g/T) gold equivalent (Au Equiv) from 310 to 325 feet (94.5 -- 99.1 meters). This bonanza grade intercept is contained within a much larger 230 foot (70.1 meter) intercept which averages 0.083 opt (3.14 g/T) Au Equiv from 295 to 525 feet (89.9 -- 160.1 meters). This intercept is believed to represent a high grade fluid conduit or a potential high grade mineralized zone similar to those mined historically from the Independence Mine. Mineralization in the Independence Target is open down dip to the west and to the north as well as up slope to the east.
Mineralized drill intercepts correlated well up and down dip and along strike from section to section. The interpretation is supported by accessible mine workings. Potentially surface bulk mineable mineralization in the Company’s drill intercepts is consistently wider than anticipated from underground mapping and sampling results.
The mineralized zone intersected in drilling typically consists of a higher grade core surrounded be a broad halo of low grade which is often 100 to 200 feet wide. All mineralization encountered is thoroughly oxidized throughout the zones being tested. Exposures in historic mine workings suggest the mineralization is oxidized to depths of more than 400 feet below the present surface and has a high degree of continuity along strike and down dip.
Results including grade, width, and oxide nature of mineralization, indicate excellent potential for a low cost, open pit heap leach operation with near term production potential for which planning permitting studies are underway.
The orientation of the mineralized zone at the Independence allows the Company to drill holes which are roughly perpendicular to mineralization, resulting in drill intercepts which are believed to represent approximate true thickness.
Geochemical and structural modeling of the property indicates that mineralization may extend northerly on the Company’s property for more than 5,000 feet in the direction of the Sunshine Open Pit Mine formerly operated by Battle Mountain Gold Corp., now Newmont Mining.
Hill Zone
The Hill Zone was discovered as a part of the ongoing integration of current drill and analytical data with the historic geologic, geochemical and mining data. Historically, mineralization at the Independence mine was believed to be terminated to the north by the Canyon fault. Interpretation of General Metals drilling in the Independence target and historic gold-silver surface sampling data indicated the offset of the Canyon fault to be minimal and projected the favorable hosts and the mineralized zone to continue north of the Canyon Fault. Drilling has extended the gold-silver mineralization an additional 1,000 feet to the north. Although the indicated width and thickness of the Hill Zone mineralization is similar to the Independence target, mineralization remains open to the west, north east and at depth. Drilling results from previous operators suggest the Hill Zone mineralization may be significantly wider than that in the Independence target.
21
The following budget outline is anticipated to be necessary to move the Independence Project forward to the brink of production in the coming twelve months.
|
Direct exploration and development costs
|
||||
|
Core drilling program
|
$ | 500,000 | ||
|
Updated Independent Technical Report
|
100,000 | |||
|
Metallurgical testing programs
|
250,000 | |||
|
Additional permitting costs
|
500,000 | |||
|
Land Payments
|
20,000 | |||
|
Contingency
|
60,000 | |||
|
Total direct exploration and development costs
|
1,430,000 | |||
|
Indirect costs
|
||||
|
Office rent and other operating expenses
|
50,000 | |||
|
Wages and salaries and payroll related expenses
|
200,000 | |||
|
Insurance expenses
|
140,000 | |||
|
Other general and administrative expenses
|
150,000 | |||
|
Legal expenses
|
30,000 | |||
|
Total indirect costs
|
570,000 | |||
|
Total budget for the next twelve months
|
$ | 2,000,000 | ||
North Target
Located at the north end of the Independence claim block, the North target is a shallow low grade occurrence situated approximately 1,200 ft SE of Newmont’s Sunshine mine. The North target is based on 11 drill holes with a nominal spacing of 380 ft defining a mineralized area approximately 1000 ft by 470 ft. Gold mineralization occurs in a granitic host rock and extends from the surface to 250 ft. Average gold intercept values range from 0.01 opt to 0.026 opt and mineralization is open to the north, east, south and at depth.
Independence Deep Target:
The Company recently received 275 assays for the majority of all mineralized intercepts with samples above and below these intercepts from American Assay Laboratories of Sparks, Nevada for extensive check assays of the mineralized zones. The results are in excellent agreement with the original results and are now 43-101 compliant.
These are original pulps from Noranda Minerals’ 1985 - 1989 diamond drill programs which have been maintained by the underlying property owners together with the entire original Noranda core library. Our consultants verified the location and chain of custody of the samples from the Great Basin Gold drilling program and submitted these samples for similar check assay. The results of these check assays were incorporated in the independent technical report General Metals completed and filed with Canadian Regulatory Authorities. All core from the Great Basin Drilling is also stored in the property’s core library.
When taken together, the Noranda and Great Basin Gold drilling in the Independence Gold Skarn system identify a target more than half a mile wide and three quarters of a mile long which contains three highly prospective structural/stratigraphic zones, all of which have been demonstrated to host significant levels of gold mineralization.
To date more than 25,000 feet of core in eight holes have been drilled to test mineralization in the Independence Gold Skarn. Virtually every hole which has targeted the gold skarn to date has intersected significant gold mineralization over an area which is more than three quarters of a mile long and half a mile wide, with most holes containing multiple mineralized horizons.
The highest grade portion of the Independence Gold Skarn occurs in favorable carbonate rich rocks below the Golconda Thrust, and directly beneath the Surface Oxide Mineralization. It is highly likely that the sub-vertical structural system which controls the surface oxide mineralization acted as a conduit, permitting mineralizing fluids circulating in the gold skarn to migrate to the near surface, depositing the gold and silver that form the Surface Oxide portion of the Independence System as the "fingerprint" of the deeper gold skarn. Surface "leakage" halos or fingerprints related to deeper mineralization form the basis for modern geochemical prospecting, and many such features related to deeper high grade mineralization are known along the Battle Mountain gold trend, including the Cove - McCoy system to the south and the Ivanhoe - Hollister system to the north where high grade underground ore bodies exhibited surface geochemical halos that were in themselves economically viable mines.
22
We believe the combined Independence Surface Oxide and Gold Skarn represents a world class target in the world class Battle Mountain Mining District along an indisputable world class gold trend.
Corporate Development Strategy
We are aggressively moving the Independence project toward production. We obtained necessary studies and to allow us to continue with the permitting to allow us to proceed to production as soon as financing and regulatory authorities will allow. We anticipate initially mining the Hill Zone and are completing all necessary work to be able to finalize permits to allow us to begin there. Additional drilling and assaying are required to bring the Hill Zone into production and the permitting required to allow for that program is underway. We believe the Hill Zone is amenable to open pit mining and heap leaching, and rapidly evaluate the potential of these target areas for near term production.
We require additional funds of approximately $2 million to proceed with our plan of operation over the next twelve months to 24 month, exclusive of any acquisition or exploration costs. As we do not have the funds necessary to cover our projected operating expenses for the next twelve month period, we will be required to raise additional funds through the issuance of equity securities, through loans or through debt financing. There can be no assurance that we will be successful in raising the required capital or that actual cash requirements will not exceed our estimates. We intend to fulfill any additional cash requirement through the sale of our equity securities.
If we are not able to obtain the additional financing on a timely basis, if and when it is needed, we will be forced to scale down or perhaps even cease the operation of our business.
Capital Expenditures
We do not intend to invest in capital expenditures during the twelve-month period ending April 30, 2011.
General and Administrative Expenses
We expect to spend $570,000 during the twelve-month period ending April 30, 2011 on general and administrative expenses including legal and auditing fees, rent, office equipment and other administrative related expenses.
Product Research and Development
We do not anticipate expending any funds on research and development, manufacturing and engineering over the twelve months ending April 30, 2011.
Personnel Plan
We do not expect any material changes in the number of employees over the next 12 month period (although we may enter into employment or consulting agreements with our officers or directors). We do and will continue to outsource contract employment as needed. As at April 30, 2010, our only employees were our directors and officers.
23
Results of Operations for the Years Ended April 30, 2010 and 2009
The following summary of our results of operations should be read in conjunction with our audited financial statements for the years ended April 30, 2010 and 2009.
Our operating results for the years ended April 30, 2010 and 2009 are summarized as follows:
|
Year Ended
April 30
|
||||||||
|
2010
|
2009
|
|||||||
| Revenue | $ | Nil | $ | Nil | ||||
|
Operating Expenses
|
$ | 2,174,972 | $ | 2,720,879 | ||||
|
Net Loss
|
$ | 3,475,281 | $ | 1,476,327 | ||||
Revenues
We have not earned any revenues since our inception and we do not anticipate earning revenues in the near future.
Operating Expenses
Our operating expenses for the year ended April 30, 2010 and April 30, 2009 are outlined in the table below:
|
Year Ended
April 30
|
||||||||
|
2010
|
2009
|
|||||||
|
Depreciation and amortization
|
$ | 7,255 | $ | 6,431 | ||||
|
General and administrative
|
$ | 199,676 | $ | 178,730 | ||||
|
Management and consulting
|
$ | 874,227 | $ | 1,433,495 | ||||
|
Exploration and development
|
$ | 909,728 | $ | 994,335 | ||||
|
Professional fees
|
$ | 184,086 | $ | 107,888 | ||||
The expenditures on the Independence project during the year were $85,000 less than the prior year as identified in the exploration and development category. The decreased cost were incurred in drilling, assaying, and geologic consulting and resulted from a lack of funding in the last half of the year. We decreased our business development efforts as well as our investor awareness campaigns causing the significant decrease in the management and consulting costs of the Company in the current year. We anticipate that the management and consulting costs should remain at these levels. Significant cost increases were incurred in fiscal year 2010 in Professional fees as the result of restating the 2008 financial statements as well as each quarterly form 10-Q report during the year.
Liquidity and Financial Condition
Our total assets at April 30, 2010 were $947,861 and our total current liabilities were $981,478 and we had a working capital deficit of $769,396 as compared to working capital of $1,152,727 as of April 30, 2010. Our financial statements report a net loss of $3,475,281 for the year ended April 30, 2010, and a net loss of $9,658,724 for the period from March 15, 2006 (date of inception) to April 30, 2010. We had cash in the amount of $9,636 as of April 30, 2010.
We have suffered recurring losses from operations. The continuation of our company is dependent upon our company attaining and maintaining profitable operations and raising additional capital as needed. In this regard we have raised additional capital through equity offerings and loan transactions.
24
|
Cash Flows
|
||||||||
|
Year Ended
April 30
|
||||||||
|
2010
|
2009
|
|||||||
|
Net Cash Used by Operating Activities
|
$ | 1,138,854 | $ | 789,424 | ||||
|
Net Cash Used by Investing Activities
|
$ | 8,987 | $ | 55,267 | ||||
|
Net Cash Provided by Financing Activities
|
$ | 1,177,534 | $ | 807,034 | ||||
|
Increase/(Decrease) In Cash During The Period
|
$ | 29,963 | $ | (37,657 | ) | |||
Our principal sources of funds have been from sales of our common stock.
Contractual Obligations
As a “smaller reporting company”, we are not required to provide tabular disclosure obligations.
Going Concern
The audited financial statements included with this annual report have been prepared on the going concern basis which assumes that adequate sources of financing will be obtained as required and that our assets will be realized and liabilities settled in the ordinary course of business. Accordingly, the consolidated audited financial statements do not include any adjustments related to the recoverability of assets and classification of assets and liabilities that might be necessary should we be unable to continue as a going concern.
Off-Balance Sheet Arrangements
We have no off-balance sheet arrangements that have or are reasonably likely to have a current or future effect on our financial condition, changes in financial condition, revenues or expenses, results of operations, liquidity, capital expenditures or capital resources that is material to stockholders.
APPLICATION OF CRITICAL ACCOUNTING POLICIES
Our audited financial statements and accompanying notes are prepared in accordance with generally accepted accounting principles used in the United States. Preparing financial statements requires management to make estimates and assumptions that affect the reported amounts of assets, liabilities, revenue, and expenses. These estimates and assumptions are affected by management's application of accounting policies. We believe that understanding the basis and nature of the estimates and assumptions involved with the following aspects of our consolidated financial statements is critical to an understanding of our financials.
Investments
Management determines the appropriate classification of its investments in equity securities at the time of purchase and re-evaluates such determinations at each reporting date. The Company accounts for its equity security investments as available-for-sale securities in accordance with US GAAP, The Company periodically evaluates whether declines in fair values of its investments below the Company’s carrying value are other-than-temporary. The Company’s policy is to generally review declines in the investment’s quoted market value when factors may indicate the decline as an other-than-temporary decline in value. The Company also monitors its investments for events or changes in circumstances that have occurred that may have a significant adverse effect on the fair value of the investment and evaluates qualitative and quantitative factors regarding the severity and duration of the unrealized loss and the Company’s ability to hold the investment until a forecasted recovery occurs to determine if the decline in value of an investment is other-than-temporary. Declines in fair value below the Company’s carrying value deemed to be other-than-temporary are charged to earnings.
25
Stock Issued For Services
The Company bases the value of stock issued for services on the market value of our common stock at the date of issue or our estimate of the fair value of the services received, whichever is more reliably measurable.
Stock Based Compensation
The Company records the cost of employee and non-employee services received in exchange for an award of equity instruments based on the estimated grant-date fair value of the award. That cost is recognized over the period during which an employee or non-employee is required to provide service in exchange for the award—the requisite service period (usually the vesting period). No compensation cost is recognized for equity instruments for which the requisite service period is not rendered. The grant-date fair value of equity awards is estimated using a Black-Scholes pricing model.
NEW ACCOUNTING PRONOUNCEMENTS
Recent accounting pronouncements that the Company has adopted or will be required to adopt in the future are summarized in Footnote 2 in our financial statements.
ITEM 7A. QUANTITATIVE AND QUALITATIVE DISCLOSURES ABOUT MARKET RISK
As a “smaller reporting company”, we are not required to provide the information required by this Item.
ITEM 8. FINANCIAL STATEMENTS AND SUPPLEMENTARY DATA
Our audited financial statements are stated in United States dollars (US$) and are prepared in accordance with United States Generally Accepted Accounting Principles.
The following audited financial statements are filed as part of this annual report:
Independent Auditor's Report, dated August 12, 2010.
Audited Consolidated Balance Sheet as at April 30, 2010.
Audited Consolidated Statements of Operations for the year ended April 30, 2010 and for the year ended April 30, 2009.
Audited Consolidated Statements of Changes in Stockholders' Equity from inception to April 30, 2010
Audited Consolidated Statements of Cash Flows for the year ended April 30, 2010 and for the year ended April 30, 2009.
Notes to the Financial Statements.
26
Report of Independent Registered Public Accounting Firm
To the Board of Directors and Stockholders of
General Metals Corporation
We have audited the accompanying consolidated balance sheets of General Metals Corporation (an exploration stage company) as of April 30, 2010 and 2009, and the related consolidated statements of operations, stockholders’ equity and comprehensive income, and cash flows for the years then ended and from inception (March 15, 2006) to date. These consolidated financial statements are the responsibility of the Company’s management. Our responsibility is to express an opinion on these consolidated financial statements based on our audits.
We conducted our audits in accordance with the standards of the Public Company Accounting Oversight Board (United States). Those standards require that we plan and perform the audits to obtain reasonable assurance about whether the financial statements are free of material misstatement. The Company is not required to have, nor were we engaged to perform, an audit of its internal control over financial reporting. Our audits included consideration of internal control over financial reporting as a basis for designing audit procedures that are appropriate in the circumstances, but not for the purpose of expressing an opinion on the effectiveness of the Company’s internal control over financial reporting. Accordingly, we express no such opinion. An audit also includes examining, on a test basis, evidence supporting the amounts and disclosures in the consolidated financial statements, assessing the accounting principles used and significant estimates made by management, as well as evaluating the overall consolidated financial statement presentation. We believe that our audits provide a reasonable basis for our opinion.
In our opinion, the consolidated financial statements referred to above present fairly, in all material respects, the consolidated financial position of General Metals Corporation as of April 30, 2010 and 2009, and the results of its consolidated operations and cash flows for the years then ended and inception to date, in conformity with accounting principles generally accepted in the United States of America.
The accompanying consolidated financial statements have been prepared assuming that the Company will continue as a going concern. As discussed in Note 1 of the accompanying consolidated financial statements, the Company has incurred losses, has not generated any revenue, and has negative operating cash flows since the inception of the exploration activities. These factors, and the need for additional financing in order for the Company to meet its business plans, raise substantial doubt about its ability to continue as a going concern. Management’s plan to continue as a going concern is also described in Note 1. The consolidated financial statements do not include any adjustments that might result from the outcome of this uncertainty.
/s/ Mark Bailey & Company, Ltd.
Reno, Nevada
August 12, 2010
27
General Metals Corporation and Subsidiaries
(An Exploration Stage Company)
Consolidated Balance Sheets
| April 30 2010 | April 30 2009 | |||||||
| ASSETS | ||||||||
|
Current assets
|
||||||||
|
Cash and cash equivalents
|
$ | 9,636 | $ | - | ||||
|
Short-term investments
|
177,796 | 1,275,000 | ||||||
|
Prepaid expenses
|
24,650 | 379,019 | ||||||
|
Other receivables (net)
|
- | 237,500 | ||||||
|
Other current assets
|
- | 245 | ||||||
|
Total current assets
|
212,082 | 1,891,764 | ||||||
|
Other assets
|
||||||||
|
Land
|
67,742 | 67,767 | ||||||
|
Mineral property
|
613,941 | 613,941 | ||||||
|
Property and equipment, net
|
16,296 | 25,733 | ||||||
|
Other assets
|
37,800 | 17,444 | ||||||
|
Total other assets
|
735,779 | 724,885 | ||||||
|
Total assets
|
$ | 947,861 | $ | 2,616,649 | ||||
| LIABILITIES AND STOCKHOLDERS' EQUITY/(DEFICIT) | ||||||||
|
Current Liabilities
|
||||||||
|
Cash deficit
|
$ | - | $ | 20,057 | ||||
|
Notes payable, current portion
|
106,750 | 2,898 | ||||||
|
Accounts payable
|
610,326 | 372,362 | ||||||
|
Accrued liabilities
|
120,439 | 216,974 | ||||||
|
Accounts payable to related parties
|
95,163 | 93,066 | ||||||
|
Loan from related parties
|
48,800 | 33,680 | ||||||
|
Total current liabilities
|
981,478 | 739,037 | ||||||
|
Long-term liabilities
|
||||||||
|
Notes payable, net of current portion
|
42,155 | 44,143 | ||||||
|
Total long-term liabilities
|
42,155 | 44,143 | ||||||
|
Total liabilities
|
1,023,633 | 783,180 | ||||||
|
Commitments and Contingencies
|
||||||||
|
Stockholders' equity/(deficit)
|
||||||||
|
Preferred stock, authorized 50,000,000
|
||||||||
|
shares, par value $0.001, zero issued and outstanding
|
||||||||
|
|
||||||||
|
Common stock, authorized 220,000,000 shares, par value $0.001,
|
||||||||
|
issued and outstanding on April 30, 2010 and April 30, 2009
|
||||||||
|
is 219,321,625 and 168,183,494 respectively
|
219,322 | 168,184 | ||||||
|
Additional paid-in capital
|
9,388,630 | 7,974,740 | ||||||
|
Subscriptions (receivable)
|
(25,000 | ) | (151,012 | ) | ||||
|
Accumulated other comprehensive income
|
- | 25,000 | ||||||
|
Accumulated deficit during exploration stage
|
(9,658,724 | ) | (6,183,443 | ) | ||||
|
Total stockholders' equity/(deficit)
|
(75,772 | ) | 1,833,469 | |||||
|
Total liabilities and stockholders' equity/(deficit)
|
$ | 947,861 | $ | 2,616,649 | ||||
The accompanying notes are an integral part of these statements
28
General Metals Corporation and Subsidiaries
(An Exploration Stage Company)
Consolidated Statements of Operations
| March 15, 2006 | ||||||||||||
| (Inception) | ||||||||||||
| Year ended April 30, | to April 30, | |||||||||||
| 2010 | 2009 | 2010 | ||||||||||
|
Revenue
|
$ | - | $ | - | $ | - | ||||||
|
Operating expenses
|
||||||||||||
|
Depreciation and amortization
|
7,255 | 6,431 | 24,570 | |||||||||
|
General and administrative
|
198,426 | 178,730 | 1,324,035 | |||||||||
|
Management and consulting
|
874,227 | 1,433,495 | 5,145,996 | |||||||||
|
Exploration and development
|
909,728 | 994,335 | 2,562,238 | |||||||||
|
Professional fees
|
184,086 | 107,888 | 545,502 | |||||||||
|
Total expenses
|
2,173,722 | 2,720,879 | 9,602,341 | |||||||||
|
(Loss) from operations
|
(2,173,722 | ) | (2,720,879 | ) | (9,602,341 | ) | ||||||
|
Other income (expenses)
|
||||||||||||
|
Interest expense
|
(6,923 | ) | (14,227 | ) | (23,026 | ) | ||||||
|
Other income
|
7,200 | 2,500 | 12,200 | |||||||||
|
Gain on sale of fixed assets
|
- | |||||||||||
|
Gain on sale of mineral properties
|
- | 1,249,072 | 1,249,072 | |||||||||
|
Realized (loss) on sale of investments
|
(77,489 | ) | - | (77,489 | ) | |||||||
|
Other than temporary impairment of investments
|
(1,224,302 | ) | (1,224,302 | ) | ||||||||
|
Gain/(loss) on foreign currency exchange
|
(45 | ) | 7,207 | 7,162 | ||||||||
|
(Loss) before income taxes
|
(3,475,281 | ) | (1,476,327 | ) | (9,658,724 | ) | ||||||
|
Provision for income taxes
|
- | - | - | |||||||||
|
Net (loss)
|
$ | (3,475,281 | ) | $ | (1,476,327 | ) | $ | (9,658,724 | ) | |||
|
Loss per common share:
|
||||||||||||
|
Basic & Diluted
|
$ | (0.02 | ) | $ | (0.01 | ) | ||||||
|
Weighted average shares outstanding:
|
||||||||||||
|
Basic & Diluted
|
210,780,419 | 120,708,380 | ||||||||||
The accompanying notes are an integral part of these statements
29
General Metals Corporation and Subsidiaries
(An Exploration Stage Company)
Consolidated Statements of Stockholders' Equity
inception March 15, 2006 to April 30, 2010
|
(Deficit)
|
||||||||||||||||||||||
|
Accumulated
|
Accumulated
|
|||||||||||||||||||||
|
Common Stock
|
Stock
|
During
|
Other
|
Total
|
||||||||||||||||||
|
Issued
|
Paid in
|
Subscriptions
|
Exploration
|
Comprehensive
|
Equity/
|
|||||||||||||||||
|
Shares
|
Amount
|
Capital
|
(Receivable)
|
Stage
|
Income/(Loss)
|
(Deficit)
|
||||||||||||||||
|
Balance, April 30, 2005
|
31,354,400 | $ | 31,354 | $ | 450,523 | $ | (127,500 | ) | $ | (208,251 | ) | - | $ | 146,126 | ||||||||
|
Cash Received for Subscriptions
|
||||||||||||||||||||||
|
Receivable
|
127,500 | 127,500 | ||||||||||||||||||||
|
Common Stock Issued for Cash at $0.25
|
||||||||||||||||||||||
|
In Private Placement
|
44,000 | 44 | 4,956 | 5,000 | ||||||||||||||||||
|
Common Stock Issued for Cash at $0.125
|
||||||||||||||||||||||
|
In Private Placement
|
26,400 | 26 | 2,974 | 3,000 | ||||||||||||||||||
|
Common Stock Issued at $0.001 to
|
||||||||||||||||||||||
|
exercise lease agreement
|
5,500,000 | 5,500 | 530,350 | 535,850 | ||||||||||||||||||
|
Common Stock Issued for Cash at $0.125
|
||||||||||||||||||||||
|
In Private Placement
|
2,782,450 | 2,782 | 313,406 | 316,188 | ||||||||||||||||||
|
Common Stock Issued in Reorganization
|
8,436,541 | 8,437 | (787,983 | ) | 208,251 | (571,295 | ) | |||||||||||||||
|
Common Stock Issued to Convert Debt at
|
||||||||||||||||||||||
|
0.0185 as Agreed in February 2005
|
22,034,546 | 22,035 | 591,998 | 614,033 | ||||||||||||||||||
|
Common Stock Issued as Incentive
|
550,000 | 550 | (50 | ) | 500 | |||||||||||||||||
|
Common Stock Returned and Cancelled
|
(550,000 | ) | (550 | ) | 50 | (500 | ) | |||||||||||||||
|
Common Stock Issued in Exercise of
|
||||||||||||||||||||||
|
Warrants at $0.25
|
702,900 | 703 | 159,047 | 159,750 | ||||||||||||||||||
|
Net (Loss)
|
(637,068 | ) | (637,068 | ) | ||||||||||||||||||
|
Balance, April 30, 2006
|
70,881,237 | 70,881 | 1,265,271 | - | (637,068 | ) | - | 699,084 | ||||||||||||||
|
Deposit received on Private Placement
|
76,000 | 76,000 | ||||||||||||||||||||
|
Common Stock Issued in Exercise of
|
||||||||||||||||||||||
|
Warrants at $0.25
|
110,000 | 110 | 24,890 | 25,000 | ||||||||||||||||||
|
Common Stock Issued for Cash at $0.125
|
||||||||||||||||||||||
|
In Private Placement
|
440,000 | 440 | 49,560 | (50,000 | ) | - | ||||||||||||||||
|
Common Stock Issued for Service at
|
||||||||||||||||||||||
|
$0.125 per share
|
158,400 | 158 | 17,842 | 18,000 | ||||||||||||||||||
|
Common Stock Issued for Purchase of
|
||||||||||||||||||||||
|
fixed asset at $0.075
|
220,000 | 220 | 14,780 | 15,000 | ||||||||||||||||||
|
Common Stock Issued for Cash at $0.075
|
164,495 | 164 | 11,052 | 11,216 | ||||||||||||||||||
|
Common Stock Issued for Services at
|
||||||||||||||||||||||
|
$0.075 per share
|
330,000 | 330 | 22,170 | 22,500 | ||||||||||||||||||
|
Common Stock Issued to Convert Debt
|
||||||||||||||||||||||
|
$0.075 per share
|
513,333 | 513 | 34,487 | 35,000 | ||||||||||||||||||
|
Common Stock Issued for Cash at $0.075
|
||||||||||||||||||||||
|
In Private Placement
|
3,770,063 | 3,770 | 253,280 | (163,800 | ) | 93,250 | ||||||||||||||||
|
Common Stock Issued for Cash at $0.075
|
||||||||||||||||||||||
|
For Exploration Rights
|
1,100,000 | 1,100 | 249,828 | 250,928 | ||||||||||||||||||
|
Common Stock Issued for Cash at $0.075
|
||||||||||||||||||||||
|
For Employee Incentive
|
275,000 | 275 | 18,475 | 18,750 | ||||||||||||||||||
|
Common Stock Issued for Cash at $0.125
|
||||||||||||||||||||||
|
In Private Placement
|
2,332,000 | 2,332 | 262,668 | 265,000 | ||||||||||||||||||
|
Common Stock Issued for Cash at $0.125
|
||||||||||||||||||||||
|
In Private Placement
|
363,440 | 363 | 40,937 | (41,300 | ) | - | ||||||||||||||||
|
Cash Received for Subscriptions
|
||||||||||||||||||||||
|
Receivable
|
137,800 | 137,800 | ||||||||||||||||||||
|
Stock-based compensation expense
|
1,447,734 | 1,447,734 | ||||||||||||||||||||
|
Net (Loss)
|
(2,087,666 | ) | (2,087,666 | ) | ||||||||||||||||||
The accompanying notes are an integral part of these statements
30
|
(Deficit)
|
||||||||||||||||||||||
|
Accumulated
|
Accumulated
|
|||||||||||||||||||||
|
Common Stock
|
Stock
|
During
|
Other
|
Total
|
||||||||||||||||||
|
Issued
|
Paid in
|
Subscriptions
|
Exploration
|
Comprehensive
|
Equity/
|
|||||||||||||||||
|
Shares
|
Amount
|
Capital
|
(Receivable)
|
Stage
|
Income/(Loss)
|
(Deficit)
|
||||||||||||||||
|
Balance, April 30, 2007
|
80,657,967 | 80,656 | 3,712,974 | (41,300 | ) | (2,724,734 | ) | - | 1,027,596 | |||||||||||||
|
Common Stock issued to convert Debt at
|
||||||||||||||||||||||
|
$0.075 per share
|
513,333 | 513 | 34,487 | 35,000 | ||||||||||||||||||
|
Common Stock Issued for Cash at $0.125
|
||||||||||||||||||||||
|
In Private Placement
|
667,040 | 667 | 75,133 | 75,800 | ||||||||||||||||||
|
Common Stock Issued in Exercise of
|
||||||||||||||||||||||
|
Share Purchase Warrants at $0.075
|
2,520,979 | 2,522 | 157,243 | 159,765 | ||||||||||||||||||
|
Common Stock Issued in Exercise of
|
||||||||||||||||||||||
|
Share Purchase Warrants at $0.20
|
654,500 | 655 | 118,345 | 119,000 | ||||||||||||||||||
|
Common Stock Issued in Exercise of
|
||||||||||||||||||||||
|
Share Purchase Warrants at $0.125
|
44,000 | 44 | 4,956 | 5,000 | ||||||||||||||||||
|
Common Stock Issued for purchase of
|
||||||||||||||||||||||
|
asset at $0.125
|
132,000 | 132 | 14,868 | 15,000 | ||||||||||||||||||
|
Common Stock Issued in Exercise of
|
||||||||||||||||||||||
|
Share Purchase Warrants at $0.20
|
216,000 | 216 | 42,984 | 43,200 | ||||||||||||||||||
|
Common Stock Issued for Cash at $0.125
|
||||||||||||||||||||||
|
In Private Placement
|
52,470 | 53 | 6,506 | 6,559 | ||||||||||||||||||
|
Cash Received for Subscriptions
|
||||||||||||||||||||||
|
Receivable
|
50,300 | 50,300 | ||||||||||||||||||||
|
Common Stock Issued for Cash at $0.20
|
||||||||||||||||||||||
|
In Private Placement
|
2,503,000 | 2,503 | 484,497 | (160,000 | ) | 327,000 | ||||||||||||||||
|
Common Stock Issued in Exercise of
|
||||||||||||||||||||||
|
Share Purchase Warrants at $0.07
|
733,334 | 733 | 49,267 | 50,000 | ||||||||||||||||||
|
Common Stock Issued for Cash at $0.15
|
||||||||||||||||||||||
|
In Private Placement
|
900,000 | 900 | 134,100 | (35,000 | ) | 100,000 | ||||||||||||||||
|
Cash Received for Subscriptions
|
||||||||||||||||||||||
|
Receivable
|
151,000 | 151,000 | ||||||||||||||||||||
|
Common Stock Issued in Exercise of
|
||||||||||||||||||||||
|
Share Purchase Warrants at $0.068
|
146,667 | 147 | 9,853 | 10,000 | ||||||||||||||||||
|
Common Stock Issued in Exercise of
|
||||||||||||||||||||||
|
Share Purchase Warrants at $0.10
|
110,000 | 110 | 7,390 | 7,500 | ||||||||||||||||||
|
Common Stock Issued in Exercise of Share
|
||||||||||||||||||||||
|
Purchase warrants at $0.114
|
176,000 | 176 | 19,824 | 20,000 | ||||||||||||||||||
|
Common Stock Issued for services to the
|
||||||||||||||||||||||
|
advisory board at $0.15
|
2,000,000 | 2,000 | 298,000 | 300,000 | ||||||||||||||||||
|
Common Stock Issued for Cash at $0.15
|
||||||||||||||||||||||
|
In Private Placement
|
100,000 | 100 | 14,900 | 15,000 | ||||||||||||||||||
|
Common Stock Issued in Exercise of Share
|
||||||||||||||||||||||
|
Purchase warrants at $0.075
|
86,667 | 87 | 8,913 | (9,000 | ) | - | ||||||||||||||||
|
Common Stock Issued in Exercise of Share
|
||||||||||||||||||||||
|
Purchase warrants at $0.114
|
2,200 | 2 | 248 | 250 | ||||||||||||||||||
|
Common Stock Issued for Cash at $0.20
|
||||||||||||||||||||||
|
In Private Placement
|
590,000 | 590 | 58,410 | 59,000 | ||||||||||||||||||
|
Common Shares issued for Cash at $0.15
|
||||||||||||||||||||||
|
In Private Placement
|
44,299 | 44 | 6,601 | 6,645 | ||||||||||||||||||
|
Common Stock Issued in Exercise of
|
||||||||||||||||||||||
|
Share Purchase warrants at $0.068
|
146,300 | 147 | 9,853 | 10,000 | ||||||||||||||||||
|
Common Stock Issued for services
|
||||||||||||||||||||||
| $ at 0.125 | 100,000 | 100 | 12,400 | 12,500 | ||||||||||||||||||
|
Common Stock Issued for Cash at $0.20
|
||||||||||||||||||||||
|
In Private Placement
|
100,000 | 100 | 9,900 | 10,000 | ||||||||||||||||||
|
Common Stock Issued for Cash at $0.05
|
||||||||||||||||||||||
|
In Private Placement
|
400,000 | 400 | 19,600 | 20,000 | ||||||||||||||||||
|
Common Stock Issued in Exercise
|
||||||||||||||||||||||
|
of Share Purchase warrants at $0.05
|
275,000 | 275 | 13,475 | 13,750 | ||||||||||||||||||
|
Common Stock Issued in Exercise of
|
||||||||||||||||||||||
|
Share Purchase warrants at $0.085
|
29,412 | 30 | 2,470 | 2,500 | ||||||||||||||||||
|
Cash Received for Subscriptions
|
||||||||||||||||||||||
|
Receivable
|
38,500 | 38,500 | ||||||||||||||||||||
|
Stock-based compensation expense
|
139,333 | 139,333 | ||||||||||||||||||||
|
Net (Loss)
|
(1,982,382 | ) | (1,982,382 | ) |
The accompanying notes are an integral part of these statements
31
|
(Deficit)
|
||||||||||||||||||||||
|
Accumulated
|
Accumulated
|
|||||||||||||||||||||
|
Common Stock
|
Stock
|
During
|
Other
|
Total
|
||||||||||||||||||
|
Issued
|
Paid in
|
Subscriptions
|
Exploration
|
Comprehensive
|
Equity/
|
|||||||||||||||||
|
Shares
|
Amount
|
Capital
|
(Receivable)
|
Stage
|
Income/(Loss)
|
(Deficit)
|
||||||||||||||||
|
Balance, April 30, 2008
|
93,901,168 | $ | 93,902 | $ | 5,466,530 | $ | (5,500 | ) | $ | (4,707,116 | ) | $ | - | $ | 847,816 | |||||||
|
Common Stock Issued for Cash at $0.14
|
||||||||||||||||||||||
|
In Private Placement
|
7,000,000 | 7,000 | 93,000 | (95,000 | ) | 5,000 | ||||||||||||||||
|
Common Stock Issued for Cash at $0.15
|
||||||||||||||||||||||
|
In Private Placement
|
2,000,000 | 2,000 | 28,000 | (14,387 | ) | 15,613 | ||||||||||||||||
|
Common Stock Issued for Cash at $0.18
|
||||||||||||||||||||||
|
In Private Placement
|
1,000,000 | 1,000 | 16,500 | 17,500 | ||||||||||||||||||
|
Common Stock Issued for Cash at $0.2
|
||||||||||||||||||||||
|
In Private Placement
|
8,400,000 | 8,400 | 159,600 | (15,000 | ) | 153,000 | ||||||||||||||||
|
Common Stock Issued for Cash at $0.25
|
||||||||||||||||||||||
|
In Private Placement
|
2,502,000 | 2,502 | 59,998 | (1,000 | ) | 61,500 | ||||||||||||||||
|
Common Stock Issued for Cash at $0.05
|
||||||||||||||||||||||
|
In Private Placement
|
8,274,000 | 8,274 | 380,326 | (34,000 | ) | 354,600 | ||||||||||||||||
|
Common Stock Issued for Cash at $0.075
|
||||||||||||||||||||||
|
In Private Placement
|
870,000 | 870 | 64,280 | 65,150 | ||||||||||||||||||
|
Common Stock Issued for Cash at $0.10
|
||||||||||||||||||||||
|
In Private Placement
|
150,000 | 150 | 14,850 | 15,000 | ||||||||||||||||||
|
Common Stock Issued for Cash at $0.15
|
||||||||||||||||||||||
|
In Private Placement
|
416,000 | 416 | 30,784 | 31,200 | ||||||||||||||||||
|
Common Stock Issued in Exercise of
|
||||||||||||||||||||||
|
Share Purchase warrants at $0.085
|
33,930 | 34 | 2,841 | (625 | ) | 2,250 | ||||||||||||||||
|
Common Stock Issued for services
|
||||||||||||||||||||||
| $ at 0.017 | 750,000 | 750 | 12,250 | 13,000 | ||||||||||||||||||
|
Common Stock Issued for services
|
||||||||||||||||||||||
| $ at 0.02 | 3,500,000 | 3,500 | 66,500 | 70,000 | ||||||||||||||||||
|
Common Stock Issued for services
|
||||||||||||||||||||||
| $ at 0.021 | 4,250,000 | 4,250 | 85,000 | 89,250 | ||||||||||||||||||
|
Common Stock Issued for services
|
||||||||||||||||||||||
| $ at 0.024 | 2,500,000 | 2,500 | 57,500 | 60,000 | ||||||||||||||||||
|
Common Stock Issued for services
|
||||||||||||||||||||||
| $ at 0.025 | 1,000,000 | 1,000 | 24,000 | 25,000 | ||||||||||||||||||
|
Common Stock Issued for services
|
||||||||||||||||||||||
| $ at 0.029 | 581,396 | 581 | 20,326 | 20,907 | ||||||||||||||||||
|
Common Stock Issued for services
|
||||||||||||||||||||||
| $ at 0.03 | 10,000,000 | 10,000 | 290,000 | 300,000 | ||||||||||||||||||
|
Common Stock Issued for services
|
||||||||||||||||||||||
| $ at 0.036 | 11,000,000 | 11,000 | 385,000 | 396,000 | ||||||||||||||||||
|
Common Stock Issued for services
|
||||||||||||||||||||||
| $ at 0.05 | 3,100,000 | 3,100 | 151,900 | 155,000 | ||||||||||||||||||
|
Common Stock Issued for services
|
||||||||||||||||||||||
| $ at 0.075 | 838,000 | 838 | 61,912 | 62,750 | ||||||||||||||||||
|
Common Stock Issued for services
|
||||||||||||||||||||||
| $ at 0.08 | 4,147,000 | 4,147 | 327,613 | 331,760 | ||||||||||||||||||
|
Common Stock Issued for services
|
||||||||||||||||||||||
| $ at 0.086 | 2,000,000 | 2,000 | 170,000 | 172,000 | ||||||||||||||||||
|
Common Stock Issued for services
|
||||||||||||||||||||||
| $ at 0.10 | 150,000 | 150 | 14,850 | 15,000 | ||||||||||||||||||
|
Cancellation of Issued Common Stock
|
||||||||||||||||||||||
|
due to non-payment on receivable
|
(180,000 | ) | (180 | ) | (8,820 | ) | 9,000 | - | ||||||||||||||
|
Cash Received for Subscriptions
|
||||||||||||||||||||||
|
Receivable
|
5,500 | 5,500 | ||||||||||||||||||||
|
Unrealized Gain/(Loss) on Available-for-sale
|
25,000 | |||||||||||||||||||||
|
Securities (net of tax)
|
||||||||||||||||||||||
|
Net (Loss)
|
(1,476,327 | ) | ||||||||||||||||||||
|
Total comprehensive income (loss)
|
(1,451,327 | ) |
The accompanying notes are an integral part of these statements
32
|
(Deficit)
|
||||||||||||||||||||||
|
Accumulated
|
Accumulated
|
|||||||||||||||||||||
|
Common Stock
|
Stock
|
During
|
Other
|
Total
|
||||||||||||||||||
|
Issued
|
Paid in
|
Subscriptions
|
Exploration
|
Comprehensive
|
Equity/
|
|||||||||||||||||
|
Shares
|
Amount
|
Capital
|
(Receivable)
|
Stage
|
Income/(Loss)
|
(Deficit)
|
||||||||||||||||
|
Balance, April 30, 2009
|
168,183,494 | 168,184 | 7,974,740 | (151,012 | ) | (6,183,443 | ) | 25,000 | 1,833,469 | |||||||||||||
|
Common Stock Issued for Cash at $0.015
|
||||||||||||||||||||||
|
In Private Placement
|
17,561,665 | 17,562 | 245,863 | (16,250 | ) | 247,175 | ||||||||||||||||
|
Common Stock Issued for Cash at $0.02
|
||||||||||||||||||||||
|
In Private Placement
|
1,605,000 | 1,605 | 30,495 | (1,700 | ) | 30,400 | ||||||||||||||||
|
Common Stock Issued for Cash at $0.022
|
||||||||||||||||||||||
|
In Private Placement
|
3,050,000 | 3,050 | 64,710 | - | 67,760 | |||||||||||||||||
|
Common Stock Issued for Cash at $0.025
|
||||||||||||||||||||||
|
In Private Placement
|
700,000 | 700 | 16,800 | - | 17,500 | |||||||||||||||||
|
Common Stock Issued for Cash at $0.033
|
||||||||||||||||||||||
|
In Private Placement
|
300,000 | 300 | 9,700 | - | 10,000 | |||||||||||||||||
|
Common Stock Issued for Cash at $0.035
|
||||||||||||||||||||||
|
In Private Placement
|
240,000 | 240 | 8,160 | - | 8,400 | |||||||||||||||||
|
Common Stock Issued for Cash at $0.04
|
||||||||||||||||||||||
|
In Private Placement
|
1,125,000 | 1,125 | 43,875 | (12,900 | ) | 32,100 | ||||||||||||||||
|
Common Stock Issued for Cash at $0.045
|
||||||||||||||||||||||
|
In Private Placement
|
7,047,300 | 7,048 | 310,100 | (30,422 | ) | 286,726 | ||||||||||||||||
|
Common Stock Issued for Cash at $0.05
|
||||||||||||||||||||||
|
In Private Placement
|
1,090,000 | 1,090 | 53,410 | 54,500 | ||||||||||||||||||
|
Common Stock Issued for services
|
||||||||||||||||||||||
| $ at 0.02 | 1,000,000 | 1,000 | 19,000 | 20,000 | ||||||||||||||||||
|
Common Stock Issued for services
|
||||||||||||||||||||||
| $ at 0.028 | 8,400,000 | 8,400 | 226,800 | 235,200 | ||||||||||||||||||
|
Common Stock Issued for services
|
||||||||||||||||||||||
| $ at 0.032 | 1,500,000 | 1,500 | 46,500 | 48,000 | ||||||||||||||||||
|
Common Stock Issued for services
|
||||||||||||||||||||||
| $ at 0.035 | 12,500 | 12 | 428 | 440 | ||||||||||||||||||
|
Common Stock Issued for services
|
||||||||||||||||||||||
| $ at 0.047 | 100,000 | 100 | 4,600 | 4,700 | ||||||||||||||||||
|
Common Stock Issued for services
|
||||||||||||||||||||||
| $ at 0.050 | 750,000 | 750 | 36,750 | 37,500 | ||||||||||||||||||
|
Common Stock Issued for services
|
||||||||||||||||||||||
| $ at 0.065 | 60,000 | 60 | 3,840 | 3,900 | ||||||||||||||||||
|
Common Stock Issued for services
|
||||||||||||||||||||||
| $ at 0.083 | 66,666 | 67 | 5,433 | 5,500 | ||||||||||||||||||
|
Common Stock Issued for Cash at $0.035
|
||||||||||||||||||||||
|
In Private Placement
|
314,300 | 314 | 10,686 | 11,000 | ||||||||||||||||||
|
Common Stock Issued for Cash at $0.045
|
||||||||||||||||||||||
|
In Private Placement
|
2,872,400 | 2,872 | 126,358 | (10,000 | ) | 119,230 | ||||||||||||||||
|
Common Stock Issued for services
|
||||||||||||||||||||||
| $ at 0.041 | 1,850,000 | 1,850 | 74,000 | 75,850 | ||||||||||||||||||
|
Common Stock Issued for services
|
||||||||||||||||||||||
| $ at 0.050 | 250,000 | 250 | 12,250 | 12,500 | ||||||||||||||||||
|
Cash Received for Subscriptions
|
||||||||||||||||||||||
|
Receivable
|
110,000 | 110,000 | ||||||||||||||||||||
|
Common Stock Issued for Cash at $0.05
|
||||||||||||||||||||||
|
In Private Placement
|
440,000 | 440 | 21,560 | 22,000 | ||||||||||||||||||
|
Common Stock Issued for settlement
|
||||||||||||||||||||||
|
of lawsuit at $0.05
|
1,000,000 | 1,000 | 49,000 | 50,000 | ||||||||||||||||||
|
Common Stock Issued for services
|
||||||||||||||||||||||
|
previously unrendered at $0.048
|
500,000 | 500 | 23,500 | 24,000 | ||||||||||||||||||
|
Cancellation of Issued Common Stock
|
||||||||||||||||||||||
|
due to non-payment on receivable
|
(996,700 | ) | (997 | ) | (42,528 | ) | 43,525 | - | ||||||||||||||
|
Cash Received for Subscriptions
|
||||||||||||||||||||||
|
Receivable
|
24,622 | 24,622 | ||||||||||||||||||||
|
Common Stock Issued for services
|
||||||||||||||||||||||
| $ at 0.043 | 300,000 | 300 | 12,600 | 12,900 | ||||||||||||||||||
|
Cash Received for Subscriptions
|
||||||||||||||||||||||
|
Receivable
|
19,137 | 19,137 | ||||||||||||||||||||
|
Reclassification of losses on Available-for-Sale
|
||||||||||||||||||||||
|
Securities (net of tax)
|
(25,000 | ) | (25,000 | ) | ||||||||||||||||||
|
Net (loss)
|
(3,475,281 | ) | ||||||||||||||||||||
|
Total comprehensive (loss)
|
(3,475,281 | ) | ||||||||||||||||||||
|
Balance, April 30, 2010
|
219,321,625 | $ | 219,322 | $ | 9,388,630 | $ | (25,000 | ) | $ | (9,658,724 | ) | - | $ | (75,772 | ) |
The accompanying notes are an integral part of these statements
33
General Metals Corporation and Subsidiaries
(An Exploration Stage Company)
Consolidated Statements of Cash Flows
|
March 15, 2006
|
||||||||||||
|
(Inception)
|
||||||||||||
|
Year Ended April 30,
|
to April 30,
|
|||||||||||
|
2010
|
2009
|
2010
|
||||||||||
|
Operating activities
|
||||||||||||
|
Net loss
|
$ | (3,475,281 | ) | $ | (1,476,327 | ) | $ | (9,658,724 | ) | |||
|
Adjustments to reconcile net loss
|
||||||||||||
|
Stock issued for services
|
581,248 | 1,284,249 | 2,643,328 | |||||||||
|
Stock issued for payment of interest on debt
|
- | 12,750 | 12,750 | |||||||||
|
Non-cash financing costs
|
- | 46,234 | 46,234 | |||||||||
|
Realized loss on sale of investments
|
77,489 | - | 77,489 | |||||||||
|
Gain on sale of mineral property
|
- | (1,249,072 | ) | (1,249,072 | ) | |||||||
|
Depreciation and amortization
|
7,255 | 6,431 | 24,570 | |||||||||
|
Stock-based compensation
|
132,104 | - | 1,719,171 | |||||||||
|
Other -than-temporary impairment of investments
|
1,224,302 | - | 1,224,302 | |||||||||
|
Impairment of Long-lived assets
|
- | 17,500 | 17,500 | |||||||||
|
Bad debt expense
|
22,387 | 22,387 | ||||||||||
|
Gain on sale of fixed asset
|
(1,250 | ) | - | (1,250 | ) | |||||||
|
Changes in assets and liabilities
|
||||||||||||
|
(Increase)/decrease in other current assets
|
(22,142 | ) | (245 | ) | (22,387 | ) | ||||||
|
(Increase)/decrease in prepaid expenses
|
(10,596 | ) | 4,340 | (22,181 | ) | |||||||
|
Increase/(decrease) in accounts payable
|
240,061 | 347,742 | 705,489 | |||||||||
|
Increase/(decrease) in accrued liabilities
|
85,569 | 216,974 | 302,543 | |||||||||
|
Net cash used by operating activities
|
(1,138,854 | ) | (789,424 | ) | (4,157,851 | ) | ||||||
|
Investment activities
|
||||||||||||
|
Investments:
|
||||||||||||
|
Purchases
|
(1,357 | ) | - | (1,357 | ) | |||||||
|
Proceeds from sales
|
9,270 | - | 9,270 | |||||||||
|
Acquisition of mineral property
|
- | - | (78,091 | ) | ||||||||
|
Investment in General Copper
|
- | - | (17,500 | ) | ||||||||
|
Investment in Lahontan
|
(2,563 | ) | - | (2,563 | ) | |||||||
|
Deposit on water rights
|
(800 | ) | - | (800 | ) | |||||||
|
Deposit on reclamation bond
|
(16,994 | ) | - | (34,438 | ) | |||||||
|
Proceeds from sale of mineral property
|
- | 12,500 | 12,500 | |||||||||
|
Proceeds from sale of fixed asset
|
8,000 | - | 8,000 | |||||||||
|
Purchase of land
|
25 | (67,767 | ) | (67,742 | ) | |||||||
|
Purchase of equipment
|
(4,568 | ) | - | (17,616 | ) | |||||||
|
Net cash used by investment activities
|
(8,987 | ) | (55,267 | ) | (190,337 | ) | ||||||
|
Financing activities
|
||||||||||||
|
Proceeds from loans from related parties
|
25,000 | 33,680 | 121,864 | |||||||||
|
Repayments of loans from related parties
|
(9,880 | ) | - | (38,064 | ) | |||||||
|
Proceeds from issuance of debt
|
102,800 | 47,041 | 149,841 | |||||||||
|
Repayments of debt
|
(936 | ) | - | (936 | ) | |||||||
|
Proceeds from the sale of stock
|
1,060,550 | 726,313 | 4,125,119 | |||||||||
|
Net cash provided by financing activities
|
1,177,534 | 807,034 | 4,357,824 | |||||||||
|
Net increase / (decrease) in cash
|
29,693 | (37,657 | ) | 9,636 | ||||||||
|
Cash, beginning of period
|
(20,057 | ) | 17,600 | - | ||||||||
|
Cash, end of period
|
$ | 9,636 | $ | (20,057 | ) | $ | 9,636 | |||||
|
Supplemental Information:
|
||||||||||||
|
Interest paid
|
$ | 1,477 | $ | 3,353 | ||||||||
|
Income taxes paid
|
$ | - | $ | - | $ | - | ||||||
|
Non-cash activities:
|
||||||||||||
|
Stock issued for service as prepaid expenses
|
$ | 14,054 | $ | 367,435 | $ | 14,054 | ||||||
|
Stock issued to acquire mineral property lease
|
$ | - | $ | - | $ | 783,687 | ||||||
|
Stock issued for payment of interest on debt
|
$ | - | $ | 12,750 | $ | 12,750 | ||||||
|
Stock issued as reduction of accrued expenses
|
$ | 150,000 | $ | 46,234 | $ | 196,234 | ||||||
|
Stock issued as reduction of contingent liability
|
$ | 50,000 | $ | - | $ | 50,000 | ||||||
The accompanying notes are an integral part of these statements
34
General Metals Corporation
and Subsidiaries
(An Exploration Stage Company)
Notes to Audited Consolidated Financial Statements
(For the periods ended April 30, 2010 and 2009)
NOTE 1. ORGANIZATION AND DESCRIPTION OF BUSINESS
Nature of Business
Since March 2006, the Company’s principal business is the acquisition, exploration, and development of mineral properties, specifically the development of the Independence gold and silver mine located in north central Nevada. The Company has not presently determined whether its properties contain mineral reserves that are economically recoverable.
The Company is considered a development (exploration) stage entity for financial reporting purposes by United States generally accepted accounting principles (US GAAP) since it has not generated material revenue from its principal business activities.
Basis of Presentation and Consolidation
The accompanying consolidated financial statements have been prepared in accordance with US GAAP. The Company operates on an April 30 fiscal year end.
The accompanying consolidated financial statements include the accounts of General Metals Corporation and its wholly owned subsidiary, General Gold Corporation. Collectively, they are referred herein as the Company. All inter-company balances and transactions have been eliminated on consolidation.
Going Concern
The accompanying financial statements have been prepared assuming that the Company will continue as a going concern, which contemplates the realization of assets and the liquidation of liabilities in the normal course of business. At April 30, 2010 the Company had an accumulated loss of $9,658,724, a cash balance of $9,636, no revenue, $981,478 in current liabilities and negative cash flows from operations. This raises substantial doubt about the Company’s ability to continue as a going concern. The financial statements do not include any adjustments that might result from this uncertainty.
Management continues to seek funding from its shareholders and other qualified investors to pursue its exploration and development programs. These funds may be raised through equity financing, debt financing, or other sources, which may result in further dilution in the equity ownership of our shares. There is still no assurance that the Company will be able to maintain operations at a level sufficient for an investor to obtain a return on investment. Further, the Company may continue to be unprofitable. The Company needs to raise additional funds in the immediate future in order to proceed with its exploration program.
35
NOTE 2. SUMMARY OF SIGNIFICANT ACCOUNTING POLICIES
Use of estimates
The preparation of financial statements in conformity with US GAAP requires management to make estimates and assumptions that affect the reported amounts of assets and liabilities and disclosures of contingent assets and liabilities at the date of the financial statements and the reported amounts of revenues and expenses during the period. Actual results could differ from those estimates.
Cash and Cash Equivalents
Cash and cash equivalents consist of cash and short term deposits with original maturities of three months or less when purchased. As of April 30, 2010 the Company had $9,636 in cash.
Property and Equipment
Property and equipment is stated at cost and depreciated on a straight-line basis over the estimated economic useful lives of the assets, which range from three to seven years.
Following is a summary of property and equipment at April 30, 2010 and April 30, 2009:
|
Fiscal Year Ended
|
||||||||
|
April 30,
|
April 30,
|
|||||||
|
2010
|
2009
|
|||||||
|
Furniture and Equipment
|
$ | 8,848 | $ | 6,348 | ||||
|
Vehicles
|
23,768 | 36,700 | ||||||
|
Less: Accumulated Depreciation
|
(16,320 | ) | (17,315 | ) | ||||
|
Property and Equipment, Net
|
$ | 16,296 | $ | 25,733 | ||||
Loss per Share
The Company computes net loss per share in accordance US GAAP. This requires presentation of both basic and diluted earnings per share (EPS) on the face of the income statement. Basic EPS is computed by dividing net loss by the weighted average number of shares outstanding during the period. Diluted EPS gives effect to all dilutive potential common shares outstanding during the period using the treasury stock method using the if-converted method. All periods presented reflect net losses, therefore, all instruments convertible to common shares are considered anti-dilutive.
Financial Instruments
The Company’s financial instruments consist of cash; cash in trust, short term investments, accounts payable, accrued liabilities and amounts due to related parties. The Company is not exposed to significant interest, currency or credit risks arising from these financial instruments. The fair value of cash, cash in trust, accounts payable and accrued liabilities and amounts due to related parties approximates their carrying values due to the immediate or short term maturity of these financial instruments.
36
Allowance for Doubtful Accounts
The Company recognizes an allowance for losses on receivables in an amount equal to the estimated probable losses net of recoveries. The allowance is based on an analysis of historical bad debt experience, current receivables aging, expected future write-offs, as well as an assessment of specific identifiable customer accounts considered at risk or uncollectible. The expense associated with the allowance for doubtful accounts is recognized as general and administrative expense.
Investments
The Company’s investments are primarily in equity securities, which are classified as available-for-sale and are reported at fair value (based primarily on quoted prices and market observable inputs) using the specific identification method. Unrealized gains and losses, net of taxes, are reported as a component of stockholders’ equity. Realized gains and losses on investments are included in other income/(expense), net. An impairment loss will be recognized in earnings and will reduce an investment’s carrying amount to its fair market value when a decline in the fair market value of an individual security below its cost or carrying value is determined to be other than temporary.
The Company determines impairment is other than temporary when there is intent to sell the security, it is more likely than not that the security will be required to be sold before recovery in value or it is not expected to recover its entire cost basis. See Note 13 of Notes to the Consolidated Financial Statements for additional information.
Mineral Property Costs
Mineral property acquisition costs are capitalized. Exploration and development costs are expensed as incurred. When it has been determined that a mineral property can be economically developed as a result of establishing proven and probable reserves, the costs incurred to develop such property, are capitalized. Such costs will be amortized using the units-of-production method over the estimated life of the probable reserve. If mineral properties are subsequently abandoned or impaired, any capitalized costs will be charged to operations.
Long-Lived Assets
The carrying value of long-lived assets is reviewed on a regular basis for the existence of facts or circumstances that may suggest impairment. The Company recognizes impairment when the sum of the expected undiscounted future cash flows is less than the carrying amount of the asset. Impairment losses, if any, are measured as the excess of the carrying amount of the asset over its estimated fair value.
Reclamation Liabilities and Asset Retirement Obligations
Minimum standards for site reclamation and closure have been established by various government agencies that affect certain of our operations. The Company calculates estimates of reclamation liabilities based on current laws and regulations and the expected undiscounted future cash flows to be incurred in reclaiming, restoring, and closing of operating mine sites. US GAAP requires that the fair value of a liability for an asset retirement obligation be recognized in the period in which it is incurred. It further requires us to record a liability for the present value of our estimated environmental remediation costs and the related asset created with it when a recoverable asset (long-lived asset) can be realized.
37
Income Taxes
The Company recognizes deferred tax liabilities and assets using the liability method. Under this method, deferred tax liabilities and assets are determined based on the temporary differences between the financial statements carrying values and tax bases of assets and liabilities using enacted tax rates in effect in the years in which the differences are expected to reverse. The Company calculates a provision for income taxes using the asset and liability method, under which deferred tax assets and liabilities are recognized by identifying the temporary differences arising from the different treatment of items for tax and accounting purposes. In determining the future tax consequences of events that have been recognized in the financial statements or tax returns, judgment and interpretation of statutes is required. Judgments and interpretation of statutes are inherent in this process. Future income tax assets are recorded in the financial statements if realization is considered more likely than not.
For previously taken tax positions considered to be uncertain, the Company prescribes a recognition threshold and measurement attribute. In the event certain tax positions do not meet the appropriate recognition threshold, de-recognition of income tax assets and liabilities, classification of current and deferred income tax assets and liabilities, and accounting for interest and penalties associated with tax positions is required.
The Company files income tax returns in the U.S. federal jurisdiction and various states. With limited exception, the Company is no longer subject to U.S. federal, state and local tax audits by taxing authorities for years before 2005.
Stock Issued For Services
The Company bases the value of stock issued for services on the market value of our common stock at the date of issue or our estimate of the fair value of the services received, whichever is more reliably measurable.
Stock Based Compensation
The Company records the cost of employee and non-employee services received in exchange for an award of equity linked instruments based on the estimated grant-date fair value of the award. That cost is recognized over the period during which an employee or non-employee is required to provide service in exchange for the award—the requisite service period (usually the vesting period). No compensation cost is recognized for equity linked instruments for which the requisite service period is not rendered. The grant-date fair value of equity linked awards is estimated using a Black-Scholes pricing model.
Comprehensive Income
The Company’s comprehensive income is comprised of net income and unrealized gains and losses on marketable securities classified as available-for-sale.
Reclassifications
The Company has revised the presentation of certain prior period amounts reported within the Consolidated Balance Sheet for payables to related parties. The revision had no impact on the total current liabilities, financial position, results of operations, or cash flows in the periods presented.
Recently Adopted Authoritative Guidance
Recent accounting pronouncements that the Company has adopted are summarized below.
Fair Value Measurements and Disclosures
In the first quarter of fiscal 2010, we adopted new authoritative guidance that specifies the way in which fair value measurements should be made for non-financial assets and liabilities that are not measured and recorded at fair value on a recurring basis, and specifies additional disclosures related to these fair value measurements. The adoption of this guidance did not have a material impact on our consolidated financial statements.
38
Disclosure about Derivative Instruments and Hedging Activities
The pronouncement requires additional disclosures about the objectives of derivative instruments and hedging activities, the method of accounting for such instruments, and a tabular disclosure of the effects of such instruments and related hedged items on Financial Statements. The adoption of the pronouncement did not have a material impact on the consolidated financial statements since the Company currently does not enter into derivative or hedging transactions.
Accounting for and disclosure about Subsequent Events
The pronouncement codifies existing standards of accounting for and disclosures of events that occur after the balance sheet date but before financial statements are issued or are available to be issued. The adoption did not have any impact on the Company’s Consolidated Financial Statements.
Impairment of Securities
The pronouncement changed the impairment recognition and presentation model for securities. An other-than-temporary impairment is now triggered when there is intent to sell the security, it is more likely than not that the security will be required to be sold before recovery in value, or the security is not expected to recover its entire cost basis. The Company adopted the pronouncement in the first quarter of Fiscal 2010. See Note 13 of Notes to Consolidated Financial Statements for additional information.
Recently Issued Authoritative Guidance Not Yet Adopted
In June 2009, the FASB issued revised guidance which changes the model for determining whether an entity should consolidate a variable interest entity (“VIE”). The standard replaces the quantitative-based risks and rewards calculation for determining which enterprise has a controlling financial interest in a VIE with an approach focused on identifying which enterprise has the power to direct the activities of a VIE and the obligation to absorb losses of the entity or the right to receive the entity’s residual returns. The statement is effective as of the first quarter of our fiscal 2011, and early adoption is prohibited. We do not expect the adoption of this new authoritative guidance to have a material impact on our consolidated financial statements.
39
NOTE 3. OTHER COMPREHENSIVE INCOME
At April 30, 2010 and April 30, 2009, the accumulated other comprehensive income was as follows:
|
Net
|
|||||||||
|
Unrealized
|
Unrealized
|
||||||||
|
April 30, 2010
|
Gain/(Loss)
|
Tax Effect
|
Gain/(Loss)
|
||||||
|
Sunergy, Inc. Common Shares
|
-
|
-
|
-
|
||||||
|
$
|
-
|
$
|
-
|
$
|
-
|
||||
|
Net
|
|||||||||
|
Unrealized
|
Unrealized
|
||||||||
|
April 30, 2009
|
Gain/(Loss)
|
Tax Effect
|
Gain/(Loss)
|
||||||
|
Sunergy, Inc. Common Shares
|
25,000
|
––
|
25,000
|
||||||
|
$
|
25,000
|
$
|
––
|
$
|
25,000
|
||||
The following are the components of comprehensive income:
|
Year ended
|
||||||||
|
April 30,
2010
|
April 30,
2009
|
|||||||
|
Net (loss)
|
$
|
(3,475,281
|
)
|
$
|
(1,476,327
|
)
|
||
|
Net unrealized gain on marketable securities
|
-
|
25,000
|
||||||
|
Comprehensive income
|
$
|
(3,475,281
|
)
|
$
|
(1,451,327
|
)
|
||
As discussed in Note 2, Summary of Significant Accounting Policies, accumulated other comprehensive income consists of the accumulated unrealized gains and losses on available-for-sale investments, net of tax.
During the year ended April 30, 2010, in accordance with recent pronouncements, fair value measurement of securities and other-than-temporary impairment, the Company evaluated the fair value compared to the cost basis of the unrealized loss on the available-for-sale securities of Sunergy, Inc. and determined that the impairment was other-than-temporary. As such, the Company wrote down the cost basis of the shares to fair market value at the balance sheet date and recognized a loss in earnings equal to the amount of write-down on the available for sale securities.
40
NOTE 4. RELATED PARTY TRANSACTIONS
The President, CFO, former and current members of the Board of Directors, and members of the Advisory Board have provided short-term financing to the company in the form of demand notes with no fixed or determinable repayment dates. The amounts are recorded as current liabilities with the balance as of April 30, 2010 and April 30, 2009 of $48,800 and $33,680 respectively.
Forbush and Associates, of which Dan Forbush, CFO, is the President, provides accounting support and services to the Company at a billed by hour incurred basis. Rates for services are charged only for the staff member’s hours at rates ranging from $45 to $125 per hour. Forbush and Associates is owed $16,249 and $36,073 relating to hours incurred and reimbursable expenses paid by Forbush and Associates on behalf of the Company at April 30, 2010 and 2009 respectively. In fiscal year 2009, Forbush and Associates received $33,837 for reimbursement of health insurance cost for the Company’s officers which cost was included in General and administrative expenses, $13,505 for reimbursable expenses included in General and administrative expenses, and $34,490 in professional fees included in Management and consulting. In fiscal year 2010, Forbush and Associates received $23,671 for reimbursement of health insurance cost for the Company’s officers which cost was included in General and administrative expenses, $28,451 for reimbursable expenses included in General and administrative expenses, and $47,650 in professional fees included in Management and consulting.
On January 28, 2010, Robert Carrington was appointed as President and as a director to the Company. Robert Carrington, as managing member of Carrington Consultants LLC, provides contract geological consulting services to the company on an ongoing monthly basis at the rate of $550 per day plus expenses. In addition, Robert Carrington was a member of the Advisory Board prior to his appointment to the Board of Directors and incurred a monthly fee of $500 for such services rendered. Robert Carrington and Carrington Consultants LLC, are owed $73,661 and $ 44,421 as of April 30, 2010 and 2009, respectively included in accounts payable to related parties. Expenses for the professional services provided by Mr. Carrington totaling $64,421 and $66,259 for the years ended April 30, 2010 and 2009, respectively are included in Exploration and Development in each year and $6,000 is included in Management and Consulting for Advisory Committee and Directors fees in each year. Mr. Carrington does not charge the Company for services related to his position as President. Mr. Carrington is a partner in Gold Range LLC which holds a 1% Net Smelter Return Royalty in the Independence project.
As of April 30, 2010, $5,253 is due to Larry Bigler and David Salari for reimbursable expenses incurred in their position as members of the Board of Directors and fees related to thereto.
At April 30, 2009, $12,573 was due to our former President, Stephen Parent as reimbursement for expenses incurred while traveling and is shown as part of accounts payable to related parties.
41
NOTE 5. STOCKHOLDERS' EQUITY
Preferred Stock
The Company is authorized to issue 50,000,000 preferred shares with a par value of $0.001 per share. As of April 30, 2010 and 2009, no preferred stock has been issued and is outstanding.
Common Stock
The Company is authorized to issue 220,000,000 common shares with a par value of $0.001 per share at April 30, 2010.
The following detail of the Company’s common stock transactions includes only the two years ended April 30, 2010 and 2009. For previous transactions please refer to the appropriate period Form 10-K on file with the Securities and Exchange Commission.
During May 2008, the Company issued 23,530 common shares from the exercise of warrants at $0.085 per share or $2,000; 7,382,000 common shares in a private placement at $0.05 per share or $369,100; 150,000 common shares in a private placement at $0.10 per share or $15,000; 600,000 common shares for services at $0.05 per share; 50,000 common shares for services at $0.08 per share; 150,000 common shares for services at $0.10 per share. In addition, the Company collected $5,500 of outstanding subscriptions receivable as of April 30, 2008.
During June 2008, the Company issued 10,400 common shares from the exercise of warrants at $0.085 per share or $875; 2,500,000 common shares for services at $0.05 per share.
During July 2008, the Company issued 416,000 common shares in a private placement at $0.075 per share or $31,200.
During August 2008, the Company issued 2,000,000 common shares for services at $0.086 per share; 67,000 common shares for services at $0.075 per share.
During September 2008, the Company issued 20,000 common shares in a private placement at $0.05 per unit or $1,000; 870,000 common shares in a private placement at $0.075 per unit or $65,150; 771,000 common shares for services at $0.075 per share; 4,097,000 common shares for services at $0.08 per share.
During October 2008, the Company issued 872,000 common shares in a private placement at $0.05 per share or $43,500; 581,396 common shares for services at $0.029 per share; and cancelled the issuance of 180,000 common shares previously issued in a private placement during May 2008 due to non-payment.
42
During November 2008, the Company issued 2,000,000 common shares in a private placement at $0.02 per share or $40,000.
During December 2008, the Company issued 750,000 common shares for services at $0.017 per share; 1,000,000 common shares for services at $0.025 per share; 3,500,000 common shares for services at $0.03 per share; 2,502,000 common shares in a private placement at $0.025 per share for $62,500.
During January 2009, the Company issued 3,500,000 common shares for services at $0.02 per share; 6,500,000 common shares for services at $0.03 per share; 1,000,000 common shares in a private placement at $0.0175 per share for $17,500; 2,350,000 in a private placement at $0.02 per share for $47,000.
During February 2009, the Company issued 11,000,000 common shares for services at $0.036 per share; 850,000 common shares in a private placement at $0.02 per share for $17,000.
During March 2009, the Company issued 2,500,000 common shares for services at $0.024 per share; 2,000,000 common shares in a private placement at $0.015 per share for $30,000; 2,200,000 in a private placement at $0.02 per share for $44,000.
During April 2009, the Company issued 4,250,000 common shares for services at $0.021 per share; 7,000,000 common shares in a private placement at $0.014 per share for $100,000; 1,000,000 in a private placement at $0.02 per share for $20,000.
During the year ended April 30, 2009, the Company received $5,500 as payment on account for outstanding subscriptions receivable from the period ending April 30, 2008. In addition, the Company issued shares in private placements and exercise of warrants of which $151,012 remained outstanding as of April 30, 2009.
During May 2009, we issued 6,765,000 common shares at prices ranging from $0.015 to $0.05 per share in private placements for a total of $124,650 in cash; 10,900,000 common shares were issued for services and payment of accrued wages for a total recorded value of $303,200.
During June 2009 we issued 10,359,165 common shares at prices ranging from $0.015 to $0.05 per share in private placements for a total of $189,875 in cash and 139,166 common stock for services at a total value $9,840.
During July 2009 we issued 15,594,800 common shares in private placements at prices ranging from $0.015 to $0.05 per share or $501,308 in cash; 850,000 shares of common stock of the company were issued for services at a total value $42,200.
During August 2009, we issued 2,100,000 shares of common stock for services at a total value of $88,350.
During September 2009, we issued 3,186,700 common shares at prices ranging from $0.035 to $0.045 or $140,230 in cash.
43
During October 2009, we issued no shares of the company.
During November 2009, we issued 440,000 common shares in private placements at $0.05 per share for $22,000 in cash; we issued 1,000,000 common shares valued at $50,000 in accordance with the Pompano settlement liability previously disclosed at April 30, 2009.
During December 2009, we issued no shares of the company.
During January 2010, we canceled 996,700 common shares of the company in private placements due to non-payment on the subscription agreement in the amount of $43,525.
During February 2010, we issued no shares of the company.
During March 2010, we issued 800,000 shares of the company for services for a total value of $36,900.
During April 2010, we issued no shares of the company.
During the year ended April 30, 2010, we received $126,012 in payment of subscriptions receivable outstanding at April 30, 2009
Warrants (Non-employee)
As part of certain equity private placement transactions, the Company issues warrants. The following table illustrates the warrant activity for the periods ending April 30, 2010 and 2009.
|
Shares
|
Weighted Average
Exercise Price
|
|||||||
|
Outstanding at April 30, 2008
|
5,503,299
|
$
|
0.21
|
|||||
|
Granted
|
1,740,500
|
0.20
|
||||||
|
Exercised
|
––
|
––
|
||||||
|
Forfeited/Expired
|
(4,719,000)
|
0.22
|
||||||
|
Outstanding at April 30, 2009
|
2,524,799
|
0.20
|
||||||
|
Granted
|
1,100,000
|
0.07
|
||||||
|
Exercised
|
––
|
––
|
||||||
|
Forfeited/Expired
|
(284,299)
|
0.21
|
||||||
|
Outstanding at April 30, 2010
|
3,340,500
|
0.17
|
||||||
|
Warrants Outstanding
|
|||||||||||
|
Range price ($)
|
Number of Warrants
|
Weighted Average
Remaining Life
|
Weighted Average
Exercise Price
|
||||||||
| $ | 0.07 |
1,100,000
|
0.20 years
|
$ |
0.07
|
||||||
| $ | 0.15 |
407,500
|
0.45 years
|
$ |
0.15
|
||||||
| $ | 0.20 |
783,000
|
0.29 years
|
$ |
0.20
|
||||||
| $ | 0.25 |
550,000
|
0.01 years
|
$ |
0.25
|
||||||
| $ | 0.30 |
500,000
|
0.20 years
|
$ |
0.30
|
||||||
44
Outstanding warrants
During the three months ended October 31, 2009, Management issued shares in private placements with accredited investors. In addition, Management identified total warrants outstanding of approximately 3.3 million, where one warrant is exercisable into one share of common stock. On September 10, 2009, the Company issued shares at which point the total number of warrants outstanding exceeded the total number of shares available in conjunction with the total number of authorized shares of the company if every warrant were to be exercised, which would require liability reclassification from equity. Management evaluated the estimated fair market value of these warrants at that date and again at April 30, 2010 using a Black-Scholes Pricing model and noted that the total value of the shares were immaterial to the financial statements, therefore, no amounts were reclassified from equity to liability.
NOTE 6. STOCK BASED COMPENSATION
The Company does not have a formally approved stock based compensation plan. The Company’s Board periodically compensates officers, employees, and certain service providers with stock warrants. These warrant issuances are not required to be approved by shareholders.
The grant date fair value of stock warrants for compensation is estimated using a Black-Scholes model. The exercise price of warrant grants approximates the closing price of the Company’s common stock on the date of the grant.
The following table illustrates the warrant activity as of April 30, 2010:
|
Shares
|
Weighted Average
Exercise Price
|
|||||||
|
Outstanding at April 30, 2008
|
1,800,000
|
$
|
0.24
|
|||||
|
Granted
|
––
|
––
|
||||||
|
Exercised
|
––
|
––
|
||||||
|
Forfeited/Expired
|
––
|
––
|
||||||
|
Outstanding at April 30, 2009
|
1,800,000
|
0.24
|
||||||
|
––
|
||||||||
|
Granted
|
––
|
––
|
||||||
|
Exercised
|
––
|
––
|
||||||
|
Forfeited/Expired
|
(1,800,000)
|
0.24
|
||||||
|
Outstanding at April 30, 2010
|
––
|
––
|
||||||
The outstanding warrants did not have any intrinsic value.
|
Black Scholes Variables
|
During Year Ended April 30, 2010
|
During Year Ended April 30, 2009
|
||||||
|
Exercise Price
|
$ |
0.20 - $0.25
|
$ |
0.075 - $0.25
|
||||
|
Risk Free Rate
|
1.33% - 2.62%
|
3.72% - 4.95%
|
||||||
|
Strike Price
|
$ |
0.09 - $0.17
|
$ |
0.18 - $0.23
|
||||
|
Volatility
|
111.331896% -112.199954%
|
111.331896% - 126.713325%
|
||||||
45
NOTE 9. PROVISION FOR INCOME TAXES
Provision for Income Taxes
At April 30, the income tax expense (benefit) consisted of the following:
|
2010
|
2009
|
|||||||
|
Current
|
$
|
––
|
$
|
––
|
||||
|
Deferred
|
––
|
––
|
||||||
|
Total tax (benefit)
|
$
|
––
|
$
|
––
|
||||
At April 30, gross deferred tax assets and liabilities consisted of the following:
|
2010
|
2009
|
|||||||
|
Deferred Tax Inventory
|
||||||||
|
NOL
|
$
|
2,296,000
|
$
|
1,641,000
|
||||
|
Stock compensation expense
|
––
|
513,000
|
||||||
|
Installment sale gain
|
(74,000)
|
(74,000)
|
||||||
|
Impairment loss
|
6,000
|
|
6,000
|
|||||
|
Investments
|
429,000
|
|
(9,000
|
)
|
||||
|
Property, plant & equipment
|
(3,000)
|
(4,000
|
)
|
|||||
|
Gross deferred tax assets
|
2,654,000
|
2,073,000
|
||||||
|
Less: Valuation allowance
|
(2,654,000)
|
(2,073,000
|
)
|
|||||
|
Net deferred tax assets
|
$
|
––
|
$
|
––
|
||||
At April 30, the income tax expense (benefit) differs from the amount obtained by applying the U.S. federal statutory rate to income before income taxes as follows:
|
2010
|
2009
|
|||||||
|
Tax rate reconciliation
|
||||||||
|
Federal statutory rate
|
35
|
%
|
35
|
%
|
||||
|
Tax at federal statutory rate
|
35.00
|
%
|
35.00
|
%
|
||||
|
Permanent differences
|
(0.08
|
)
|
(3.55
|
)
|
||||
|
Net operating loss carryforward
|
(21.41)
|
(34.40
|
)
|
|||||
|
Installment sale
|
––
|
4.65
|
||||||
|
Unrealized gain (loss)
|
(13,47)
|
(1.92)
|
||||||
|
Other temporary differences, net
|
(0.04
|
)
|
0.22
|
|||||
|
Total
|
0.00
|
%
|
0.00
|
%
|
||||
As of April 30, 2010, the Company had a federal net operating loss carryforward of approximately $6.6 million. The federal net operating loss carryforward will expire beginning in fiscal 2026. Utilization of net operating losses may be subject to limitations due to ownership changes and other limitations provided by the Internal Revenue Code and similar state provisions. If such a limitation applies, the net operating loss and tax credit carryforwards may expire before full utilization. The Company has not taken any positions in its tax returns that could be termed as uncertain tax positions.
46
NOTE 10. MINERAL PROPERTY
Independence Mine
At April 30, 2010 the Company’s Mineral property valued at $613,941 consists of the acquisition cost of the Independence Mining Claims located in Lander County, Nevada. The Company continues to explore and develop the mining claims. For the years ended April 30, 2010 and 2009 the Company incurred costs of $909,728 and $994,335, respectively, for the on-going exploration and development. Since obtaining the rights, the Company has expensed $2,562,238 associated with these activities. If the Company successfully establishes proven and probable reserves, additional development costs will be capitalized and depleted using the units of production method. There is a production royalty payable for the sale of all gold, silver or platinum based upon the average daily price of gold on the London Metal Exchange as follows: 3% when the price of gold per ounce is less than $375, 4% when the price of gold per ounce is between $375 and $475 and 5% when the price of gold is over $475. There is also a production royalty of 3% payable on the sale of all substances other than gold, silver and platinum. In addition, any future production is subject to a 1% net smelter royalty obligation payable to Gold Range, LLC. As of April 30, 2010 there were no proven or probable reserves associated with the Independence Mining Claim.
NOTE 11. NOTES PAYABLE
On April 28, 2009, the Company purchased 480 acres of private land which will be used for mineral processing, equipment storage and maintenance. The full purchase price was $67,742 with 30% down and the balance by way of seller financing at 10% per annum for a period of 10 years with quarterly payments of $1,874 amortized over 10 years with no pre-payment penalty. The note is secured by the land.
During the year ended April 30, 2010, the Company entered into private placement subscription agreements with accredited investors in the amount of $102,800. Due to the insufficient number of authorized shares at the time of subscription, the Company was not able to issue restricted shares. The private placement agreement calls for monies received when authorized capital was insufficient to be deemed short-term notes payable bearing no interest, no repayment schedule, and to be converted to 3,000,000 common shares upon an increase in authorized capital. As such, the monies received have been classified, jointly with the current portion of the land note payable, as part of Notes Payable current portion. Funds from these agreements were used to finance the latest round of drilling during our third fiscal quarter ended January 31, 2010.
Additionally, the Company has $48,800 due in short-term notes payable to related parties as disclosed in footnote 4 above.
Future principal repayments at April 30, 2010 are as follows:
|
Short-term Note Payable & Related Party Notes Payable
|
Secured Note Payable
|
|||||||
|
2011
|
$
|
151,600
|
$
|
3,950
|
||||
|
2012
|
-
|
3,531
|
||||||
|
2013
|
-
|
3,898
|
||||||
|
2014
|
-
|
4,302
|
||||||
|
2015
|
––
|
4,749
|
||||||
|
Thereafter
|
––
|
25,675
|
||||||
|
Total
|
$
|
151,600
|
$
|
46,105
|
||||
NOTE 12. COMMITMENTS & CONTINGENCIES
The Company leases office space under a non-cancelable operating lease. Rent expense was approximately $25,211 in fiscal 2010, and $24,747 in fiscal 2009. Future annual minimum lease commitments at April 30, 2010 are as follows:
|
Minimum lease payments
|
||||
|
2011
|
$
|
38,721
|
||
|
2012
|
33,552
|
|||
|
2013
|
35,724
|
|||
|
2014
|
37,884
|
|||
|
2015
|
––
|
|||
|
Thereafter
|
––
|
|||
|
Total
|
$
|
145,881
|
||
47
NOTE 13. INVESTMENTS
The Company’s investments in equity securities are classified as available-for-sale. The investments are initially recorded at cost and reduced for any impairment losses.
The following table presents the Company’s hierarchy for its assets and liabilities measured at fair value on a recurring basis:
|
April 30, 2010
|
April 30, 2009
|
|||||||||||||||||||||||||||||||
|
Level 1
|
Level 2
|
Level 3
|
Total
|
Level 1
|
Level 2
|
Level 3
|
Total
|
|||||||||||||||||||||||||
|
Sunergy common stock ( available for sale)
|
$ | 177,796 | $ | –– | $ | –– | $ | 177,796 | $ | 1,275,000 | $ | –– | $ | –– | $ | 1,275,000 | ||||||||||||||||
|
Total assets measured at fair value on recurring basis
|
$ | 177,796 | $ | –– | $ | –– | $ | 177,796 | $ | 1,275,000 | $ | –– | $ | –– | $ | 1,275,000 | ||||||||||||||||
During the year ended April 30, 2010 Management sold 168,517 freely trading shares for total proceeds of $9,270. Additionally, Management identified a plan intended to liquidate its investment in Sunergy in order to further finance development of the Independence mineral property and pay down outstanding payables. Management evaluated the 4,336,483 shares of Sunergy Inc. held at April 30, 2010 for impairment using the two step process outlined in US GAAP. The following factors were used during the evaluation process:
|
●
|
All Sunergy shares are of the same class, though 336,483 are unrestricted and freely trading and 4 million are restricted shares.
|
|
●
|
The fair value of the shares at April 30, 2010 ($177,796) was less than its historical carrying cost ($1,402,097)
|
|
●
|
The concern of the ability of the investee to continue as a going concern. As of the most recent public information released by Sunergy for the period September 30, 2009, the investee had less than $1,000 in cash, and negative cash flow from operations.
|
|
●
|
The Board initiated a plan in the period ended April 30, 2010, to sell the remaining shares and does not expect the fair value of the shares to recover before the expected time of sale.
|
48
After evaluation of all factors, Management determined that the decrease in value of the remaining Sunergy shares was an other-than-temporary impairment and required an impairment loss in the period in which the decision to sell occurred. As such, the Company has recorded an impairment loss of $1,224,302 in the period ended April 30, 2010.
The following table summarizes, by major security type, the fair value and amortized cost of the Company’s investments, impairment loss charged to earnings, and unrealized gain/(loss) recorded as components of accumulated other comprehensive income at the respective balance sheet dates. All equity security investments are recorded as short-term investments in the Consolidated Statements of Financial Position.
|
April 30, 2010
|
April 30, 2009
|
|||||||||||||||||||
|
Fair
|
Other-than-Temporary
|
Fair
|
Unrealized
|
|||||||||||||||||
|
Value
|
Cost
|
Loss recognized in Earnings
|
Value
|
Cost
|
Gain/(Loss)
|
|||||||||||||||
|
Investments
|
||||||||||||||||||||
|
Equity securities
|
$ | 177,796 | $ | 177,796 | $ | (1,224,302 | ) | $ | 1,275,000 | $ | 1,250,000 | $ | 25,000 | |||||||
|
Total investments
|
$ | 177,796 | $ | 177,796 | $ | (1,224,302 | ) | $ | 1,275,000 | $ | 1,250,000 | $ | 25,000 | |||||||
NOTE 14. SUBSEQUENT EVENTS
Authorized Stock Increase
Subsequent to year end, the Company held its annual and special meeting on May 15, 2010. During the meeting, a vote of the shareholders was held toamend the Articles of Incorporation to increase the number of authorized shares from 220 million shares to 500 million shares; to amend the Articles of Incorporation to authorize the Board of Directors to determine designations, rights, or other variations in relation to the authorized preferred shares of the Company; and to approve an 11 for 10 forward stock split which would increase the number of authorized shares to 550 million at the date of record of the split. All three proposals passed with majority approval. As of August 6, 2010, the Board of Directors has only issued 500,000 common shares since the end of the previous fiscal year to pay outstanding invoices as of April 30, 2010 and has issued no preferred shares. Additionally, the Board of Directors has not enacted the forward stock split.
Sale of Sunergy Shares
The Board of Directors consented to a sale of the remaining Sunergy shares. The 2 million restricted shares were sold in a transaction with a private investor in the amount of $50,000. Rights to the additional 2 million restricted shares were also sold in a transaction with a private investor for $75,000. The remaining 336,483 shares were sold in public transactions through a brokerage house for approximately $16,000. As of August 10, 2010, the Company no longer holds any shares of Sunergy.
49
NOTE 15. SUPPLEMENTAL CONSOLIDATED FINANCIAL INFORMATION
|
April 30,
|
April 30,
|
|||||||
|
2010
|
2009
|
|||||||
|
Other receivables:
|
||||||||
|
Gross other receivables
|
$
|
22,387
|
$
|
237,500
|
||||
|
Allowance for doubtful accounts
|
(22,387
|
)
|
--
|
|||||
|
Total
|
$
|
-
|
$
|
237,500
|
||||
|
ITEM 9.
|
CHANGES IN AND DISAGREEMENTS WITH ACCOUNTANTS ON ACCOUNTING AND FINANCIAL DISCLOSURE
|
On June 23, 2009, we decided to engage new auditors as our independent accountants to audit our financial statements. Our board of directors and our audit committee approved the change of accountants to Mark Bailey & Company, Ltd., Certified Public Accountants. Accordingly, we dismissed Moore & Associates, on June 23, 2009.
In connection with the audits of our company’s financial statements for each of the two fiscal years ended April 30, 2007 and April 30, 2008 and in the subsequent interim periods through January 31, 2009, there were no disagreements with Moore & Associates on any matter of accounting principles or practices, financial statement disclosure, or auditing scope and procedures which, if not resolved to the satisfaction of Moore & Associates would have caused Moore & Associates to make reference to the matter in their report. The reports on the financial statements prepared by Moore & Associates, for the past two fiscal years did not contain an adverse opinion or a disclaimer of opinion, and were not qualified or modified as to uncertainty, audit scope or accounting principles except that Moore & Associates, expressed in their reports substantial doubt about our ability to continue as a going concern.
|
ITEM 9A (T).
|
CONTROLS AND PROCEDURES
|
We maintain disclosure controls and procedures that are designed to ensure that information required to be disclosed in our reports filed under the Securities Exchange Act of 1934, as amended, is recorded, processed, summarized and reported within the time periods specified in the Securities and Exchange Commission's rules and forms, and that such information is accumulated and communicated to our management, including our president and chief executive officer (who is acting as our principal executive officer) and our chief financial officer (who is acting as our principal financial officer and principle accounting officer) to allow for timely decisions regarding required disclosure.
50
As of April 30, 2010, the year end covered by this report, we carried out an evaluation, under the supervision and with the participation of our president and chief executive officer (who is acting as our principal executive officer) and our chief financial officer (who is acting as our principal financial officer and principle accounting officer), of the effectiveness of the design and operation of our disclosure controls and procedures. Based on the foregoing, our president and chief executive officer (who is acting as our principal executive officer) and our chief financial officer (who is acting as our principal financial officer and principle accounting officer) concluded that our disclosure controls and procedures were not effective as of the end of the period covered by this annual report.
Management’s Report on Internal Control over Financial Reporting
Our management is responsible for establishing and maintaining adequate internal control over financial reporting, as such term is defined in Rules 13a-15(f) and 15d-15(f) under the Exchange Act, for the company.
Internal control over financial reporting includes those policies and procedures that: (1) pertain to the maintenance of records that, in reasonable detail, accurately and fairly reflect the transactions and dispositions of our assets; (2) provide reasonable assurance that transactions are recorded as necessary to permit preparation of financial statements in accordance with generally accepted accounting principles, and that our receipts and expenditures are being made only in accordance with authorizations of its management and directors; and (3) provide reasonable assurance regarding prevention or timely detection of unauthorized acquisition, use or disposition of our assets that could have a material effect on the financial statements.
Management recognizes that there are inherent limitations in the effectiveness of any system of internal control, and accordingly, even effective internal control can provide only reasonable assurance with respect to financial statement preparation and may not prevent or detect material misstatements. In addition, effective internal control at a point in time may become ineffective in future periods because of changes in conditions or due to deterioration in the degree of compliance with our established policies and procedures.
A material weakness is a significant deficiency, or combination of significant deficiencies, that results in there being a more than remote likelihood that a material misstatement of the annual or interim financial statements will not be prevented or detected.
Under the supervision and with the participation of our president, management conducted an evaluation of the effectiveness of our internal control over financial reporting, as of April 30, 2010, based on the framework set forth in Internal Control-Integrated Framework issued by the Committee of Sponsoring Organizations of the Treadway Commission (COSO). Based on our evaluation under this framework, management concluded that our internal control over financial reporting was not effective as of the evaluation date due to the factors stated below.
51
Management assessed the effectiveness of the Company’s internal control over financial reporting as of evaluation date and identified the following material weaknesses:
Insufficient Resources: We have an inadequate number of personnel with requisite expertise in the key functional areas of finance and accounting.
Inadequate Segregation of Duties: We have an inadequate number of personnel to properly implement control procedures.
Management is committed to improving its internal controls and will (1) continue to use third party specialists to address shortfalls in staffing and to assist the Company with accounting and finance responsibilities, (2) increase the frequency of independent reconciliations of significant accounts which will mitigate the lack of segregation of duties until there are sufficient personnel.
Management, including our president and chief executive officer (who is acting as our principal executive officer) and our chief financial officer (who is acting as our principal financial officer and principle accounting officer), have discussed the material weakness noted above with our independent registered public accounting firm. Due to the nature of this material weakness, there is a more than remote likelihood that misstatements which could be material to the annual or interim financial statements could occur that would not be prevented or detected.
This annual report does not include an attestation report of our registered public accounting firm regarding internal control over financial reporting. Management's report was not subject to attestation by the our registered public accounting firm pursuant to temporary rules of the SEC that permit us to provide only management's report in this annual report.
Changes in Internal Control over Financial Reporting
There have been no changes in our internal controls over financial reporting that occurred during our year ended April 30, 2010 that have materially or are reasonably likely to materially affect, our internal controls over financial reporting.
|
ITEM 9B.
|
OTHER INFORMATION
|
None
52
PART III
|
ITEM 10.
|
DIRECTORS, EXECUTIVE OFFICERS AND CORPORATE GOVERNANCE
|
All of the directors of our company hold office until the next annual meeting of the stockholders or until their successors have been elected and qualified. Our officers are appointed by our board of directors and hold office until their death, resignation or removal from office. Our directors and executive officers, their ages, positions held, and duration as such, are as follows:
|
Name
|
Position Held
with the Company
|
Age
|
Date First Elected or Appointed
|
|
Robert G Carrington
|
Chief Executive Officer, President and Director
|
65
|
February 4, 2010
|
|
David J. Salari
|
Director
|
53
|
January 30, 2006
|
|
Paul Wang
|
Independent Director
|
64
|
March 11, 2010
|
|
Dr. Michael Powell
|
Independent Director
|
56
|
May 24, 2010
|
|
Daniel J. Forbush
|
Chief Financial Officer and Director
|
57
|
March 23, 2007
|
Business Experience
The following is a brief account of the education and business experience of each director and executive officer during at least the past five years, indicating each person's principal occupation during the period, and the name and principal business of the organization by which he was employed.
Robert G. Carrington –Principal Executive Officer, President and Director
During his career, Mr. Carrington has worked throughout North, Central and South America, Australia, the Caribbean Basin and Fiji. He began his career as an underground mine geologist at the Independence Mine in the Battle Mountain District of Nevada and was later Chief Geologist at the New Savage Mine in Virginia City, Nevada, a combined underground and open pit mining and milling operation. More recently, he was actively involved in the definition, design, permitting and operation of the Lucerne (1993) and the Billie the Kid (2003) open pit – heap leach gold - silver mines near Virginia City, Nevada and was a consultant to Santa Fe Minerals Co. during the discovery and delineation of the Rabbit Creek Mine, now the Twin Creeks Mine operated by Newmont Gold.
53
Mr. Carrington has held executive positions in many public and private companies during his career. Most recently he was CEO and Director of Gold Canyon Resources Inc. He currently is President and Director of Colombian Mines Corporation a TSX.V listed junior company active in Colombia, and until becoming President and a Director of General Metals, served our Advisory Board. Mr. Carrington is a principal of Gold Range Company LLC, a Nevada domiciled limited liability company and which is the vendor of, and owns royalties on the Company's Independence Property in Nevada.
Mr. Carrington is a principal of Gold Range Company, which own royalties on the Company’s Independence Property in Nevada.
David J. Salari, P.Eng – Director
Since 2004, Mr. Salari is the President of D.E.N.M. Engineering, a company engaged in the engineering, design and installation of mineral processing equipment and systems and a director of our company. Mr. Salari has served as a director of General Gold Corporation since November 17, 2004. Mr. Salari served as Chief Operating Officer of the company from 2006 through March 17, 2009. Mr. Salari is a Professional Engineer who over the past 20 years, has been involved in the design, supply, and commissioning of mining and mineral processing systems throughout the world for gold and silver, base metals, and industrial minerals.
From 1986 to 2004 Mr. Salari was the Vice President of MPE International Inc. where he managed the engineering and design of metallurgical processing equipment for precious, base, and industrial minerals. From 1980 to 1986 Mr. Salari worked with Placer Development Ltd. in various metallurgist and engineering capacities.
More recently, he spearheaded as Process Manager the construction and start-up of a 4000 TPD heap leach operation at the Plum Mine in the Comstock Lode region of Nevada. His duties included heap pad construction, recovery plant, and dealing with The Nevada Division of Environmental Protection in permit related issues. Mr. Salari is a graduate of the University of Toronto (1980) with a BASC degree in Metallurgical Engineering.
Paul Wang, MBA –Director
Paul Wang is a Private Investor who was recently Senior Vice President and Limited Partner of a Private Equity Advisory firm APL Ltd., NV. He also was in Iraq as an advisor for the Multi-National Corps-Iraq as a subject matter expert on banking and financial institutions, and coordinated and evaluated Central Bank of Iraq and US Department of State programs with the Iraqi public and private sectors. He has over 15 years experience as a senior management consultant advising companies and private and institutional investors on acquisitions and complex transactions in the United States, Canada, the United Kingdom, Switzerland, and the Middle East. As VP Finance and Treasurer of United Mining Corp. NV, he acquired gold and silver mining properties in the USA and assisted in taking that company public.
54
Mr. Wang was a Senior Planner at W.R. Grace & Company, NYC evaluating natural resource acquisitions, expansions and divestitures; Project Finance Advisor with Chase Manhattan Bank, NYC (JP Morgan Chase & Co.) arranging project financing for natural resource projects; Investment Advisor with Bankers Trust Company, NYC (Deutsche Bank), directing ExIm Bank export financing and Bank strategy for Europe.
Dr. Michael Powell –Director
Dr. Powell is a venture capitalist and General Partner at Sofinnova Ventures, a venture capital firm with approximately $1 billion under management, and offices in San Francisco, Menlo Park, San Diego and Tokyo. Mike Powell, Ph.D., has more than 25 years of pharmaceutical development experience, and he has focused interest in clinical-stage product companies. He joined Sofinnova Ventures as a General Partner in 1997. Prior to becoming a venture capitalist, Mike worked on 20 clinical products and authored almost 100 papers and books, including an 1,100-page treatise on vaccine design. Prior to Sofinnova, Dr. Powell held several industry positions, including Group Head of Drug Delivery at Genentech (1990-97), Director of Product Development at Cytel (1987-90), and Senior Scientist at Syntex Research (1984-87).
He received his Ph.D. in Physical Chemistry from the University of Toronto in 1981, and completed his post-doctorate work in Bioorganic Chemistry at the University of California, where he was subsequently a faculty member (1981-84).
Daniel J. Forbush, CPA, MBA – Chief Financial Officer and Director
Daniel J. Forbush, a Certified Public Accountant brings over 25 year of mining industry experience. Mr. Forbush’s diverse background in financial management includes positions at such Fortune 500 firms as Glamis Gold, Ltd., AMOCO, TENNECO and Arthur Andersen & Company. Beginning in 1999, Mr. Forbush focused on start-up opportunities including the building of a public accounting firm (Forbush and Associates) since November 2000 and business consulting firm (Core Business Builders Inc.) since January of 2004, and has functioned as Chief Financial Officer and Treasurer for a $25 million residential development and building contractor and a number of other smaller enterprises. He was initially recruited as Controller for Glamis Gold, Inc., the U.S. operating entity of Glamis Gold, Ltd. serving therein from 1988 to 1997 and Chief Financial Officer and Treasurer from 1997 to 1999, for Glamis Gold, Ltd., directing all aspects of financial, administrative and operations management for this $200MM NYSE-listed, multi-national corporation. Prior experience includes Corporate Director of Managerial Accounting, Echo Bay Mines, Ltd., 1986-1987. Nevada Operations Controller for Tenneco Minerals prior to its acquisition by Echo Bay Mines; General Accounting Supervisor for AMOCO; Assistant Controller for Cyprus Industrial Minerals Company; and, Senior Auditor for Arthur Andersen & Company.
Family Relationships
There are no family relationships among our directors or officers.
Involvement in Certain Legal Proceedings
55
Our directors, executive officers and control persons have not been involved in any of the following events during the past five years:
1. any bankruptcy petition filed by or against any business of which such person was a general partner or executive officer either at the time of the bankruptcy or within two years prior to that time;
2. any conviction in a criminal proceeding or being subject to a pending criminal proceeding (excluding traffic violations and other minor offences);
3. being subject to any order, judgment, or decree, not subsequently reversed, suspended or vacated, of any court of competent jurisdiction, permanently or temporarily enjoining, barring, suspending or otherwise limiting his involvement in any type of business, securities or banking activities; or
4. being found by a court of competent jurisdiction (in a civil action), the Commission or the Commodity Futures Trading Commission to have violated a federal or state securities or commodities law, and the judgment has not been reversed, suspended, or vacated.
Section 16(a) Beneficial Ownership Compliance
Section 16(a) of the Securities Exchange Act requires our executive officers and directors, and persons who own more than 10% of our common stock, to file reports regarding ownership of, and transactions in, our securities with the Securities and Exchange Commission and to provide us with copies of those filings. Based solely on our review of the copies of such forms received by us, or written representations from certain reporting persons, we believe that during the year ended April 30, 2010, all filing requirements applicable to its officers, directors and greater than 10% percent beneficial owners were complied with, with the exception of the following:
|
Name
|
Number of Late Reports
|
Number of Transactions Not
Reported on a Timely Basis
|
Failure to File
Requested Forms
|
|
Robert Carrington
|
Nil
|
Nil
|
Nil
|
|
David Salari
|
Nil
|
Nil
|
Nil
|
|
Paul Wang
|
Nil
|
Nil
|
Nil
|
|
Dr. Mike Powell
|
Nil
|
Nil
|
Nil
|
|
Daniel Forbush
|
Nil
|
Nil
|
Nil
|
56
Audit Committee and Audit Committee Financial Expert
Board and Committee Meetings
Our board of directors held 6 formal meetings during the year ended April 30, 2010. All other proceedings of the board of directors were conducted by resolutions consented to in writing by all the directors and filed with the minutes of the proceedings of the directors. Such resolutions consented to in writing by the directors entitled to vote on that resolution at a meeting of the directors are, according to the Delaware Corporate Law and our By-laws, as valid and effective as if they had been passed at a meeting of the directors duly called and held.
For the year ended April 30, 2010 our only standing committee of the board of directors was our audit committee.
Audit Committee
Currently our audit committee consists of Paul Wang, Dr. Mike Powell and David Salari. The function of the audit committee is to meet with our independent auditors at least annually to review, upon completion of the annual audit, financial results for the year, as reported in our financial statements; recommend to the Board the independent auditors to be retained; review the engagement of the independent auditors, including the scope, extent and procedures of the audit and the compensation to be paid therefore; assist and interact with the independent auditors in order that they may carry out their duties in the most efficient and cost effective manner; and review and approve all professional services provided to us by the independent auditors and considers the possible effect of such services on the independence of the auditors.
During fiscal 2009, there were no meetings held by the audit committee. The business of the audit committee was conducted by resolutions consented to in writing by all the members and filed with the minutes of the proceedings of the audit committee.
Audit Committee Financial Expert
Our board of directors has determined that Paul Wang of its audit committee qualifies as an "audit committee financial expert" as defined in Item 407(d)(5)(ii) of Regulation S-K, and is "independent" as the term is used in Item 7(d)(3)(iv) of Schedule 14A under the Securities Exchange Act of 1934, as amended.
57
Director Independence
We currently act with five (5) directors, consisting of Robert G. Carrington, David Salari, Paul Wang, Dr. Mike Powell and Daniel Forbush. We have determined that Paul Wang and Dr. Mike Powell qualify as "independent" as the term is used in Item 7(d)(3)(iv)(B) of Schedule 14A under the Securities Exchange Act of 1934, as amended, and as defined by Rule 4200(a)(15) of the NASDAQ Marketplace Rules.
Code of Ethics
Effective August 10, 2006, our company's board of directors adopted a Code of Business Conduct and Ethics that applies to, among other persons, our company's President, Secretary, Treasurer, Chief Executive Officer, Chief Financial Officer and Chief Operating Officer (being our principal executive officers and principal accounting officers), as well as our independent directors and other persons performing similar functions. As adopted, our Code of Business Conduct and Ethics sets forth written standards that are designed to deter wrongdoing and to promote:
|
1.
|
honest and ethical conduct, including the ethical handling of actual or apparent conflicts of interest between personal and professional relationships;
|
|
2.
|
full, fair, accurate, timely, and understandable disclosure in reports and documents that we file with, or submit to, the Securities and Exchange Commission and in other public communications made by us;
|
|
3.
|
compliance with applicable governmental laws, rules and regulations;
|
|
4.
|
the prompt internal reporting of violations of the Code of Business Conduct and Ethics to an appropriate person or persons identified in the Code of Business Conduct and Ethics; and
|
|
5.
|
accountability for adherence to the Code of Business Conduct and Ethics.
|
Our Code of Business Conduct and Ethics requires, among other things, that all of our company's senior officers commit to timely, accurate and consistent disclosure of information; that they maintain confidential information; and that they act with honesty and integrity.
In addition, our Code of Business Conduct and Ethics emphasizes that all employees, and particularly senior officers, have a responsibility for maintaining financial integrity within our company, consistent with generally accepted accounting principles, and federal and state securities laws. Any senior officer who becomes aware of any incidents involving financial or accounting manipulation or other irregularities, whether by witnessing the incident or being told of it, must report it to our company. Any failure to report such inappropriate or irregular conduct of others is to be treated as a severe disciplinary matter. It is against our company policy to retaliate against any individual who reports in good faith the violation or potential violation of our company's Code of Business Conduct and Ethics by another.
58
Procedure for Submitting Shareholder Proposals
We encourage shareholders to submit proposals, questions or concerns to us by writing to our President or any member of our Board of Directors. All written communications with Board members are treated as confidential. Instructions and contact our President and/or our Board of Directors at our executive offices. Once a proposal, question or concern is received by our President or a Board member, the communication is reviewed and addressed accordingly.
Procedure for Submitting Shareholder Proposals Related to Nominee as Director
See “Procedures for Submitting Shareholder Proposals” above.
Our Code of Business Conduct and Ethics as filed with the Securities and Exchange Commission is incorporated by reference as Exhibit 14.1 to this annual report. We will provide a copy of the Code of Business Conduct and Ethics to any person without charge, upon request. Requests can be sent to: General Metals Corporation, 615 Sierra Rose Drive, Suite 1, Reno, NV 89511.
|
ITEM 11.
|
EXECUTIVE COMPENSATION
|
The particulars of the compensation paid to the following persons:
|
|
our principal executive officer;
|
|
|
each of our two most highly compensated executive officers who were serving as executive officers at the end of the years ended April 30, 2010 and 2009; and
|
|
|
up to two additional individuals for whom disclosure would have been provided under (b) but for the fact that the individual was not serving as our executive officer at the end of the years ended April 30, 2010 and 2009,
|
who we will collectively refer to as the named executive officers of our company, are set out in the following summary compensation table, except that no disclosure is provided for any named executive officer, other than our principal executive officers, whose total compensation did not exceed $100,000 for the respective fiscal year:
|
SUMMARY COMPENSATION TABLE
|
|||||||||
|
Name
and Principal Position
|
Year
|
Salary
($)
|
Bonus
($)
|
Stock Awards
($)
|
Option Awards
($)
|
Non-Equity Incentive Plan Compensation
($)
|
Change in Pension
Value and Nonqualified Deferred Compensation Earnings
($)
|
All
Other Compensation
($)(1)
|
Total
($)
|
|
Stephen Parent, Former President, CEO and Director
|
2010
2009
|
108,000
144,000
|
Nil
Nil
|
Nil
100,500
|
Nil
Nil
|
Nil
Nil
|
Nil
Nil
|
Nil
Nil
|
108,000
244,500
|
|
Robert G. Carrington, Former President, CEO and Director
|
2010
2009
|
Nil
Nil
|
Nil
Nil
|
Nil
Nil
|
Nil
Nil
|
Nil
Nil
|
Nil
Nil
|
Nil
Nil
|
Nil
Nil
|
|
Daniel Forbush
CFO and Director
|
2010
2009
|
120,000
108,000
|
Nil
Nil
|
Nil
100,500
|
Nil
Nil
|
Nil
Nil
|
Nil
Nil
|
Nil
Nil
|
120,000
208,500
|
|
(1)
|
The value of perquisites and other personal benefits, securities and property for the officers that do not exceed the lesser of $10,000 or 10% of the total of the annual salary and bonus and is not reported herein.
|
59
COMPENSATION PLANS
As of April 30, 2010, we did not have any compensation plans in place. However, we may issue stock options to our directors, officers and employees in the future, upon adoption of a stock option plan.
Stock Options/SAR Grants
During the periods ended April 30, 2010 and 2009, we did not grant any stock options to our executive officers.
Aggregated Option Exercises in Last Fiscal Year and Fiscal Year-End Values
There were no options exercised during our fiscal year ended April 30, 2010 or April 30, 2009 by any officer or director of our company.
Outstanding Equity Awards at Fiscal Year End
No equity awards were outstanding as of the year ended April 30, 2010.
Compensation of Directors
We reimburse our directors for expenses incurred in connection with attending board meetings. Beginning June 1, 2007, the non-employee directors receive $1,000 per month for their service on the Board of Directors. The Directors also receive Stock Incentive Grants from time to time as authorized by the Board. Our board of directors may award special remuneration to any director undertaking any special services on our behalf other than services ordinarily required of a director.
The following table sets forth a summary of the compensation paid to our non-employee directors in 2010:
|
DIRECTOR COMPENSATION
|
|||||||
|
Name
|
Fees
Earned or
Paid in
Cash
($)
|
Stock
Awards
($)
|
Option
Awards
($)
|
Non-Equity
Incentive
Plan
Compensation
($)
|
Change in
Pension
Value and
Nonqualified
Deferred
Compensation
Earnings
($)
|
All
Other
Compensation
($)
|
Total
($)
|
|
David Salari
|
12,000
|
Nil
|
Nil
|
Nil
|
Nil
|
Nil
|
12,000
|
|
Paul Wang
|
1,000
|
Nil
|
Nil
|
Nil
|
Nil
|
Nil
|
1,000
|
|
Dr. Mike Powell
|
Nil
|
Nil
|
Nil
|
Nil
|
Nil
|
Nil
|
Nil
|
|
Larry Max Bigler
|
12,000
|
Nil
|
Nil
|
Nil
|
Nil
|
Nil
|
12,000
|
Employment Contracts and Termination of Employment and Change in Control Arrangements
We have not entered into any employment agreement or consulting agreement with our directors and executive officers.
There are no arrangements or plans in which we provide pension, retirement or similar benefits for directors or executive officers. Our directors and executive officers may receive stock options and stock grants at the discretion of our board of directors in the future. We do not have any bonus or profit sharing plans pursuant to which cash or non-cash compensation is or may be paid to our directors or executive officers, except that stock options or stock grants may be granted at the discretion of our board of directors.
We have no plans or arrangements with respect to remuneration received or that may be received by our executive officers to compensate such officers in the event of termination of employment (as a result of resignation, retirement, change of control) or a change of responsibilities following a change of control, where the value of such compensation exceeds $60,000 per executive officer.
60
|
ITEM 12.
|
SECURITY OWNERSHIP OF CERTAIN BENEFICIAL OWNERS AND MANAGEMENT AND RELATED STOCKHOLDER MATTERS
|
The following table sets forth, as of August 10, 2010, certain information with respect to the beneficial ownership of our common stock by each stockholder known by us to be the beneficial owner of more than 5% of our common stock and by each of our current directors and executive officers. Each person has sole voting and investment power with respect to the shares of common stock, except as otherwise indicated. Beneficial ownership consists of a direct interest in the shares of common stock, except as otherwise indicated.
|
Name and Address of Beneficial Owner
|
Amount and Nature of
Beneficial Ownership
|
Percentage
of Class(1)
|
|
David Salari
Oakville, Ontario
|
687,000
|
0.3%
|
|
Robert G. Carrington
Reno, Nevada
|
3,447,667
|
1.6%
|
|
Paul Wang
Reno, Nevada
|
Nil
|
Nil
|
|
Dr. Mike Powell
San Jose, California
|
Nil
|
Nil
|
|
Daniel J. Forbush
Reno, Nevada
|
7,450,000
|
3.3%
|
|
Stephen Parent
Scottsdale, Arizona
|
14,647,668
|
6.6%
|
|
Directors, Executive Officers and Beneficial Owners as a Group (6 persons)
|
26,232,335
|
11.8%
|
|
|
(1) Under Rule 13d-3, a beneficial owner of a security includes any person who, directly or indirectly, through any contract, arrangement, understanding, relationship, or otherwise has or shares: (i) voting power, which includes the power to vote, or to direct the voting of shares; and (ii) investment power, which includes the power to dispose or direct the disposition of shares. Certain shares may be deemed to be beneficially owned by more than one person (if, for example, persons share the power to vote or the power to dispose of the shares). In addition, shares are deemed to be beneficially owned by a person if the person has the right to acquire the shares (for example, upon exercise of an option) within 60 days of the date as of which the information is provided. In computing the percentage ownership of any person, the amount of shares outstanding is deemed to include the amount of shares beneficially owned by such person (and only such person) by reason of these acquisition rights. As a result, the percentage of outstanding shares of any person as shown in this table does not necessarily reflect the person’s actual ownership or voting power with respect to the number of shares of common stock actually outstanding on August 7, 2010. As of August 7, 2010, there were 219,821,625 shares of our company’s common stock issued and outstanding.
|
Changes in Control
We are unaware of any contract or other arrangement or provisions of our Articles or Bylaws the operation of which may at a subsequent date result in a change of control of our company. There are not any provisions in our Articles or Bylaws, the operation of which would delay, defer, or prevent a change in control of our company.
|
ITEM 13.
|
CERTAIN RELATIONSHIPS AND RELATED TRANSACTIONS, AND DIRECTOR INDEPENDENCE
|
Except as disclosed herein, there have been no transactions or proposed transactions in which the amount involved exceeds the lesser of $120,000 or one percent of the average of our total assets at year-end for the last three completed fiscal years in which any of our directors, executive officers or beneficial holders of more than 5% of the outstanding shares of our common stock, or any of their respective relatives, spouses, associates or affiliates, has had or will have any direct or material indirect interest.
The promoters of our company are our directors and officers.
Director Independence
We currently act with five directors, consisting of Robert G. Carrington, David Salari Paul Wang, Dr. Mike Powell and Daniel Forbush. We have determined that Paul Wang and Dr. Mike Powell are “independent directors” as defined in NASDAQ Marketplace Rule 4200(a)(15).
Corporate Governance
Currently our audit committee consists of Paul Wang, Dr. Mike Powell and David Salari. The function of the audit committee is to meet with our independent auditors at least annually to review, upon completion of the annual audit, financial results for the year, as reported in our financial statements; recommend to the Board the independent auditors to be retained; review the engagement of the independent auditors, including the scope, extent and procedures of the audit and the compensation to be paid therefore; assist and interact with the independent auditors in order that they may carry out their duties in the most efficient and cost effective manner.
During fiscal 2010, there were 5 meetings held by the audit committee.
61
|
ITEM 14.
|
PRINCIPAL ACCOUNTANTS FEES AND SERVICES
|
The aggregate fees billed for the most recently completed fiscal year ended April 30, 2010 and for fiscal year ended April 30, 2009 for professional services rendered by the principal accountant for the audit of our annual financial statements and review of the financial statements included in our quarterly reports on Form 10-Q and services that are normally provided by the accountant in connection with statutory and regulatory filings or engagements for these fiscal periods were as follows:
|
Year Ended April 30
|
||
|
2010 ($)
|
2009 ($)
|
|
|
Audit Fees
|
94,100
|
13,750
|
|
Audit Related Fees
|
Nil
|
Nil
|
|
Tax Fees
|
Nil
|
Nil
|
|
All Other Fees
|
Nil
|
Nil
|
|
Total
|
94,100
|
13,750
|
Our board of directors pre-approves all services provided by our independent auditors. All of the above services and fees were reviewed and approved by the board of directors either before or after the respective services were rendered.
Our board of directors has considered the nature and amount of fees billed by our independent auditors and believes that the provision of services for activities unrelated to the audit is compatible with maintaining our independent auditors’ independence.
62
PART IV
|
ITEM 15.
|
EXHIBITS, FINANCIAL STATEMENT SCHEDULES
|
Exhibits required by Item 601 of Regulation S-K
|
Exhibit Number
|
Description
|
|
|
(3)
|
Articles of Incorporation and By-laws
|
|
|
3.1
|
Certificate of Incorporation (incorporated by reference from our Registration Statement on Form 10-SB12G filed on August 24, 1999)
|
|
|
3.2
|
By-Laws (incorporated by reference from our Registration Statement on Form 10-SB12G filed on August 24, 1999)
|
|
|
3.3
|
Amendment to Certificate of Incorporation (incorporated by reference from our Annual Report on Form 10-KSB filed on August 15, 2006)
|
|
|
(10)
|
Material Contracts
|
|
|
10.1
|
Letter of Intent between General Gold Corporation and Gold Range, LLC dated November 14, 2004 (incorporated by reference from our Annual Report on Form 10-KSB filed on August 15, 2006)
|
|
|
10.2
|
Amendment to Letter of Intent between General Gold Corporation and Gold Range, LLC dated December 31, 2004 (incorporated by reference from our Annual Report on Form 10-KSB filed on August 15, 2006).
|
|
|
10.3
|
Assignment of Lease Agreement between General Gold Corporation and Gold Range Company, LLC dated April 29, 2005 (incorporated by reference from our Annual Report on Form 10-KSB filed on August 15, 2006).
|
|
|
10.4
|
Assignment of Lease and Consent Agreement between Independence Gold-Silver Mines Inc., Gold Range Company, LLC and General Gold Corporation dated June 29, 2005 (incorporated by reference from our Annual Report on Form 10-KSB filed on August 15, 2006).
|
|
|
10.5
|
Lease Agreement between Independence Gold-Silver Mines Inc. and Gold Range Company, LLC dated July 13, 2005 (incorporated by reference from our Annual Report on Form 10-KSB filed on August 15, 2006)
|
|
|
10.6
|
Share Purchase Agreement dated January 20, 2006 among General Gold Corporation, Recov Energy Corp. and the selling shareholders of General Gold Corporation (incorporated by reference from our Annual Report on Form 10-KSB filed on August 15, 2006).
|
|
|
10.7
|
Share Purchase Agreement dated March 15, 2007 between our company and Sanibel Investments Ltd. (incorporated by reference from our Current Report on Form 8-K filed on March 22, 2007).
|
|
|
10.8
|
Marketing Services Agreement effective July 15, 2008 with Wall Street Report Inc. (incorporated by reference from our Current Report on Form 8-K filed on September 5, 2008).
|
|
|
10.9
|
Mining Acquisition Agreement dated October 31, 2008 between our company and Sunergy Inc. (incorporated by reference from our Current Report on Form 8-K filed on December 2, 2008).
|
|
|
10.10
|
Amending Agreement to the Mining Acquisition Agreement dated December 5, 2008 between our company and Sunergy Inc. (incorporated by reference from our Current Report on Form 8-K filed on December 12, 2008).
|
|
|
10.11
|
Agreement dated February 10, 2009 between our company and Nevada Agency & Trust Company (incorporated by reference from our Current Report on Form 8-K filed on February 24, 2009).
|
|
|
10.12
|
Contract between our company and Stephen Tandon and Emanual Suchefort dated April 13, 2009 (incorporated by reference from our Current Report on Form 8-K filed on June 29, 2009).
|
|
|
(14)
|
Code of Ethics
|
|
|
14.1
|
Code of Ethics (incorporated by reference from our Annual Report on Form 10-KSB filed on August 15, 2006)
|
|
|
(21)
|
Subsidiaries
|
|
|
General Gold Corporation, a Nevada company
|
||
|
(31)
|
Section 302 Certification
|
|
|
Section 302 Certification of the Sarbanes-Oxley Act of 2002.
|
||
|
Section 302 Certification of the Sarbanes-Oxley Act of 2002.
|
||
|
(32)
|
Section 906 Certification
|
|
|
Section 906 Certification of the Sarbanes-Oxley Act of 2002
|
||
|
Section 906 Certification of the Sarbanes-Oxley Act of 2002
|
*Filed herewith.
63
SIGNATURES
In accordance with Section 13 or 15(d) of the Exchange Act of 1934, the registrant caused this report to be signed on its behalf by the undersigned, thereunto duly authorized.
|
GENERAL METALS CORPORATION
|
|||
|
Date: August 13, 2010
|
By:
|
/s/ Robert G. Carrington | |
|
Robert G. Carrington
|
|||
|
President, Chief Executive Officer and Director
(Principal Executive Officer)
|
|||
| Date: August 13, 2010 | /s/ Daniel J. Forbush | ||
| Daniel J. Forbush | |||
| Chief Financial Officer and Director
(Principal Financial Officer and Principal Accounting Officer)
|
|||
Pursuant to the requirements of the Securities Exchange Act of 1934, this report has been signed below by the following persons on behalf of the registrant and in the capacities and on the dates indicated.
|
Signature
|
Title
|
Date
|
| /s/ Robert G. Carrington |
President, Chief Executive Officer and Director
|
August 13, 2010
|
|
Robert G. Carrington
|
||
| /s/ Daniel J. Forbush |
Chief Financial Officer and Director
|
August 13, 2010
|
|
Daniel J. Forbush
|
||
| /s/ Paul Wang |
Director
|
August 13, 2010
|
|
Paul Wang
|
||
| /s/ Dr. Mike Powell |
Director
|
August 13, 2010
|
|
Dr. Mike Powell
|
||
| /s/ David Salari |
Director
|
August 13, 2010
|
|
David Salari
|
||
64