Attached files
| file | filename |
|---|---|
| 8-K - FORM 8-K - VALIDUS HOLDINGS LTD | y86038e8vk.htm |
Exhibit
99.1

| SECOND QUARTER 2010 Investor Presentation |
| Cautionary Note Regarding Forward-looking Statements This presentation may include forward-looking statements, both with respect to us and our industry, that reflect our current views with respect to future events and financial performance. Statements that include the words "expect," "intend," "plan," "believe," "project," "anticipate," "will," "may" and similar statements of a future or forward-looking nature identify forward-looking statements. All forward-looking statements address matters that involve risks and uncertainties. Accordingly, there are or will be important factors that could cause actual results to differ materially from those indicated in such statements and, additionally, you should not place undue reliance on any such statements. We believe that these factors include, but are not limited to, the following: 1) unpredictability and severity of catastrophic events; 2) rating agency actions; 3) adequacy of Validus' risk management and loss limitation methods; 4) cyclicality of demand and pricing in the insurance and reinsurance markets; 5) Validus' limited operating history; 6) Validus' ability to implement its business strategy during "soft" as well as "hard" markets; 7) adequacy of Validus' loss reserves; 8) continued availability of capital and financing; 9) retention of key personnel; 10) competition; 11) potential loss of business from one or more major insurance or reinsurance brokers; 12) Validus' ability to implement, successfully and on a timely basis, complex infrastructure, distribution capabilities, systems, procedures and internal controls, and to develop accurate actuarial data to support the business and regulatory and reporting requirements; 13) general economic and market conditions (including inflation, volatility in the credit and capital markets, interest rates and foreign currency exchange rates); 14) the integration of businesses Validus may acquire or new business ventures Validus may start; 15) the effect on Validus' investment portfolios of changing financial market conditions including inflation, interest rates, liquidity and other factors; 16) acts of terrorism or outbreak of war; and 17) availability of reinsurance and retrocessional coverage, as well as management's response to any of the aforementioned factors. The foregoing review of important factors should not be construed as exhaustive and should be read in conjunction with the other cautionary statements that are included herein and elsewhere, including the Risk Factors included in our most recent reports on Form 10-K and Form 10-Q and other documents on file with the Securities and Exchange Commission. Any forward-looking statements made in this presentation are qualified by these cautionary statements, and there can be no assurance that the actual results or developments anticipated by us will be realized or, even if substantially realized, that they will have the expected consequences to, or effects on, us or our business or operations. We undertake no obligation to update publicly or revise any forward-looking statement, whether as a result of new information, future developments or otherwise. 2 INVESTOR PRESENTATION SECOND QUARTER 2010 |
| Note on Non-GAAP Financial Measures In presenting the Company's results herein, management has included and discussed certain schedules containing underwriting income, net operating income (loss), annualized return on average equity and diluted book value per common share that are not calculated under standards or rules that comprise U.S. GAAP. Such measures are referred to as non-GAAP. Non-GAAP measures may be defined or calculated differently by other companies. We believe that these measures are important to investors and other interested parties. These measures should not be viewed as a substitute for those determined in accordance with U.S. GAAP. The underwriting results of an insurance or reinsurance company are often measured by reference to its underwriting income because underwriting income indicates the performance of the company's core underwriting function. Underwriting income is reconciled to net income by the addition or subtraction of net investment income (loss), finance expenses, fair value of warrants issued, transaction expenses, net realized gains (losses) on investments, net unrealized gains (losses) on investments and foreign exchange gains (losses). Net operating income is calculated based on net income (loss) excluding net realized gains (losses), net unrealized gains (losses) on investments, gains (losses) arising from translation of non-US$ denominated balances and non-recurring items. Net income is the most directly comparable GAAP measure. Net operating income focuses on the underlying fundamentals of our operations without the influence of realized gains (losses) from the sale of investments, net unrealized gains on investments, translation of non-US$ currencies and non-recurring items. Realized gains (losses) from the sale of investments are driven by the timing of the disposition of investments, not by our operating performance. Gains (losses) arising from translation of non-US$ denominated balances are unrelated to our underlying business. Diluted book value per share is calculated based on total shareholders' equity plus the assumed proceeds from the exercise of outstanding stock options and warrants, divided by the sum of unvested restricted shares, stock options, warrants and share equivalents outstanding (assuming their exercise). Reconciliations to the most comparable GAAP measure for both net operating income and diluted book value per share can be found at the end of this presentation. 3 INVESTOR PRESENTATION SECOND QUARTER 2010 |
| Selected Market Information 4 Exchange / Ticker: NYSE / "VR" Share Price (June 30, 2010): $24.42 Primary Shares Outstanding: 111,407,993 Primary Market Capitalization: $2.72 billion Annual Dividend/Yield: $0.88 per share (3.6%) Analyst Coverage: Matt Carletti, JMP Securities Jay Cohen, Bank of America Merrill Lynch Dean Evans, Keefe, Bruyette & Woods Julia Ferguson, Dowling & Partners Matt Heimermann, J.P. Morgan Amit Kumar, Macquarie Brian Meredith, UBS Chris Neczypor, Goldman Sachs Michael Paisan, Stifel Nicolaus Josh Shanker, Deutsche Bank INVESTOR PRESENTATION SECOND QUARTER 2010 |
| Validus Overview Focus on short-tail classes of insurance and reinsurance Business mix balanced between insurance and reinsurance Leadership position in property catastrophe reinsurance Flexible and efficient operating platform Transparent risk disclosure Active capital management 5 INVESTOR PRESENTATION SECOND QUARTER 2010 |
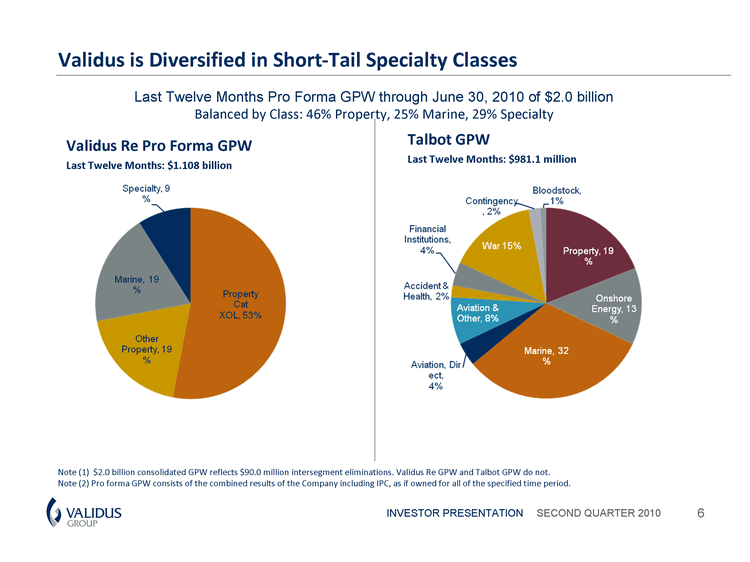
| 6 Validus is Diversified in Short-Tail Specialty Classes Talbot GPW Last Twelve Months: $981.1 million INVESTOR PRESENTATION SECOND QUARTER 2010 Last Twelve Months Pro Forma GPW through June 30, 2010 of $2.0 billion Balanced by Class: 46% Property, 25% Marine, 29% Specialty Validus Re Pro Forma GPW Last Twelve Months: $1.108 billion Note (1) $2.0 billion consolidated GPW reflects $90.0 million intersegment eliminations. Validus Re GPW and Talbot GPW do not. Note (2) Pro forma GPW consists of the combined results of the Company including IPC, as if owned for all of the specified time period. |
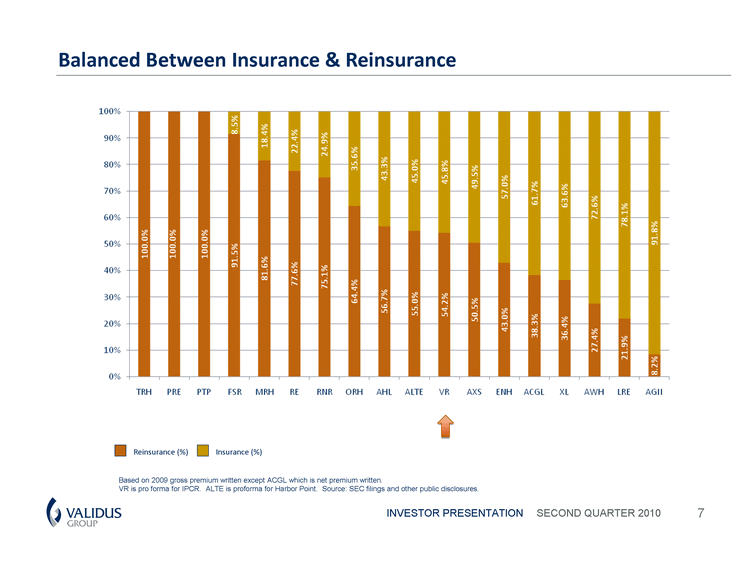
| Balanced Between Insurance & Reinsurance 7 INVESTOR PRESENTATION SECOND QUARTER 2010 Reinsurance (%) Insurance (%) Based on 2009 gross premium written except ACGL which is net premium written. VR is pro forma for IPCR. ALTE is proforma for Harbor Point. Source: SEC filings and other public disclosures. |
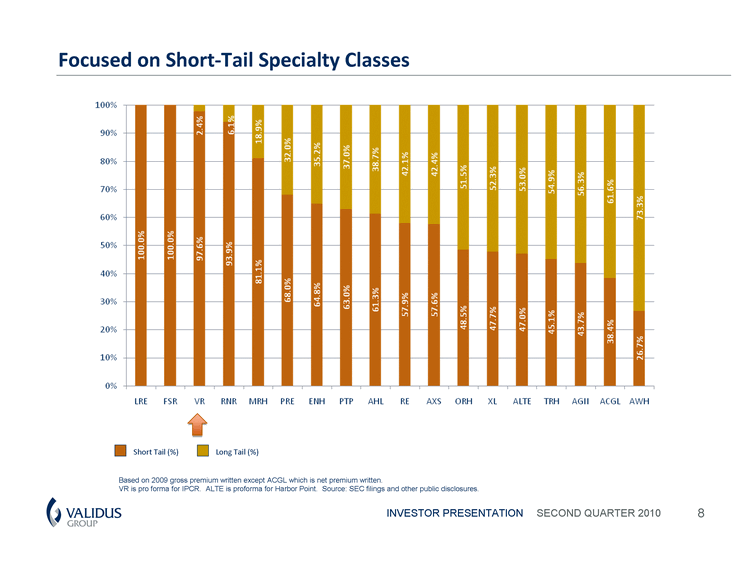
| Focused on Short-Tail Specialty Classes 8 INVESTOR PRESENTATION SECOND QUARTER 2010 Short Tail (%) Long Tail (%) Based on 2009 gross premium written except ACGL which is net premium written. VR is pro forma for IPCR. ALTE is proforma for Harbor Point. Source: SEC filings and other public disclosures. |
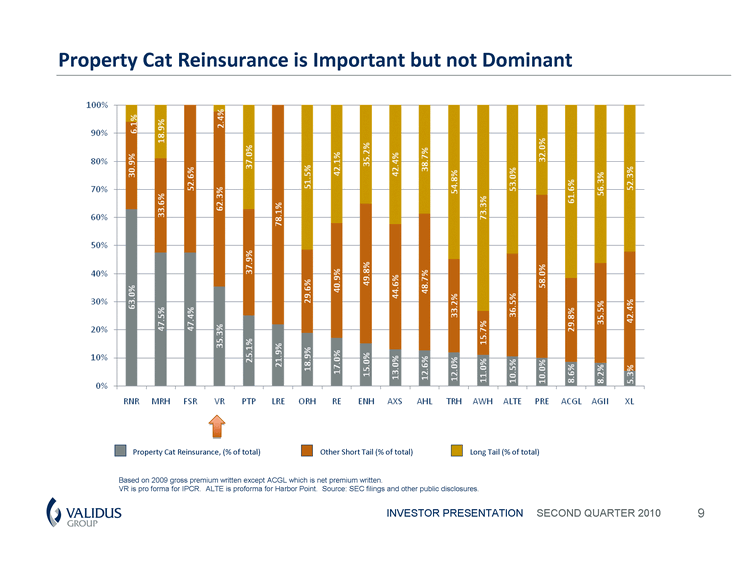
| Property Cat Reinsurance is Important but not Dominant 9 INVESTOR PRESENTATION SECOND QUARTER 2010 Property Cat Reinsurance, (% of total) Other Short Tail (% of total) Long Tail (% of total) Based on 2009 gross premium written except ACGL which is net premium written. VR is pro forma for IPCR. ALTE is proforma for Harbor Point. Source: SEC filings and other public disclosures. |
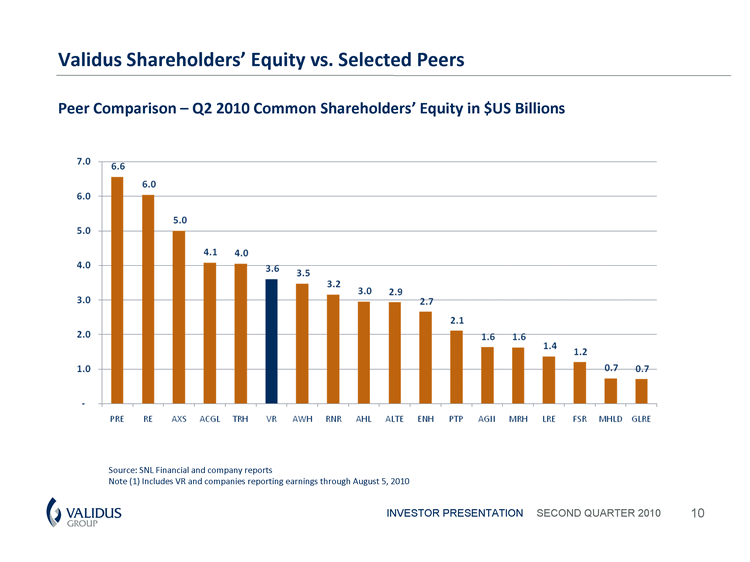
| Validus Shareholders' Equity vs. Selected Peers Peer Comparison - Q2 2010 Common Shareholders' Equity in $US Billions 10 INVESTOR PRESENTATION SECOND QUARTER 2010 Source: SNL Financial and company reports Note (1) Includes VR and companies reporting earnings through August 5, 2010 |
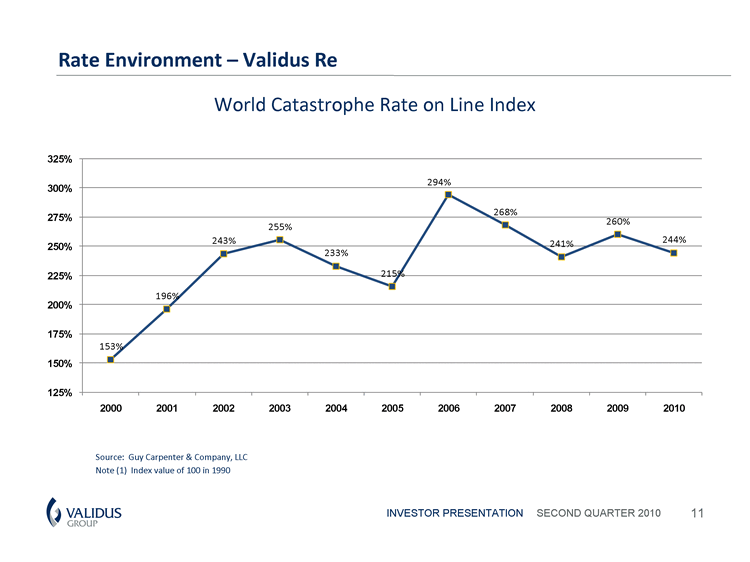
| Rate Environment - Validus Re 11 INVESTOR PRESENTATION SECOND QUARTER 2010 Source: Guy Carpenter & Company, LLC Note (1) Index value of 100 in 1990 World Catastrophe Rate on Line Index |
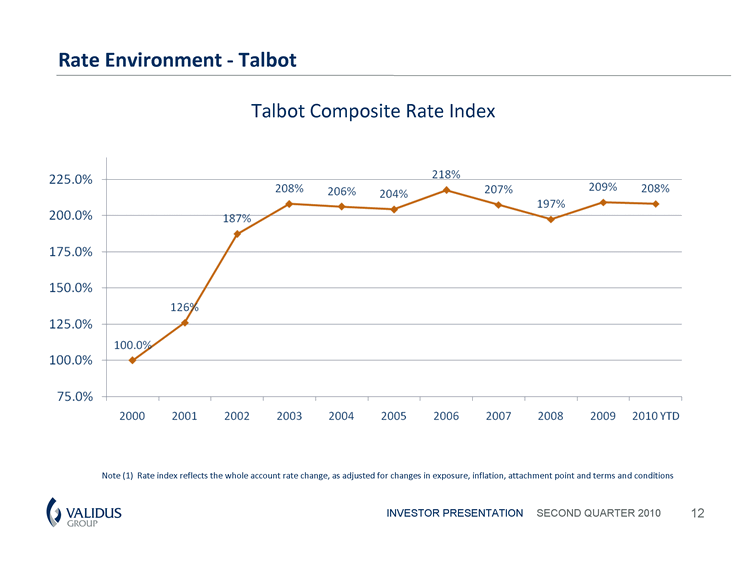
| Rate Environment - Talbot 12 INVESTOR PRESENTATION SECOND QUARTER 2010 Talbot Composite Rate Index Note (1) Rate index reflects the whole account rate change, as adjusted for changes in exposure, inflation, attachment point and terms and conditions |
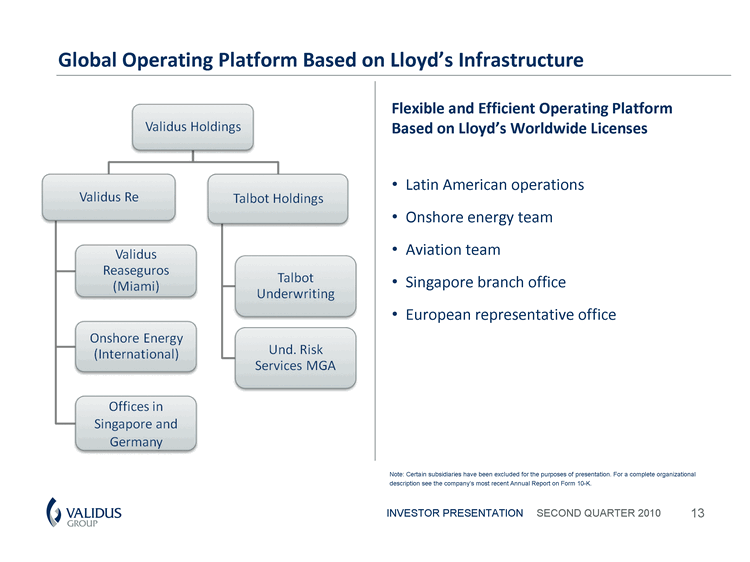
| Global Operating Platform Based on Lloyd's Infrastructure Flexible and Efficient Operating Platform Based on Lloyd's Worldwide Licenses Latin American operations Onshore energy team Aviation team Singapore branch office European representative office 13 INVESTOR PRESENTATION SECOND QUARTER 2010 Note: Certain subsidiaries have been excluded for the purposes of presentation. For a complete organizational description see the company's most recent Annual Report on Form 10-K. |
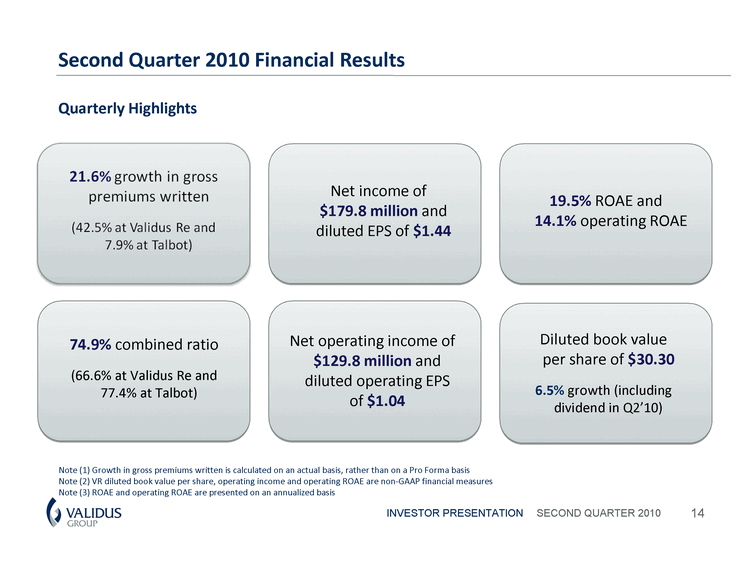
| Second Quarter 2010 Financial Results Quarterly Highlights 14 INVESTOR PRESENTATION SECOND QUARTER 2010 19.5% ROAE and 14.1% operating ROAE Note (1) Growth in gross premiums written is calculated on an actual basis, rather than on a Pro Forma basis Note (2) VR diluted book value per share, operating income and operating ROAE are non-GAAP financial measures Note (3) ROAE and operating ROAE are presented on an annualized basis 74.9% combined ratio (66.6% at Validus Re and 77.4% at Talbot) Net income of $179.8 million and diluted EPS of $1.44 Net operating income of $129.8 million and diluted operating EPS of $1.04 Diluted book value per share of $30.30 6.5% growth (including dividend in Q2'10) |
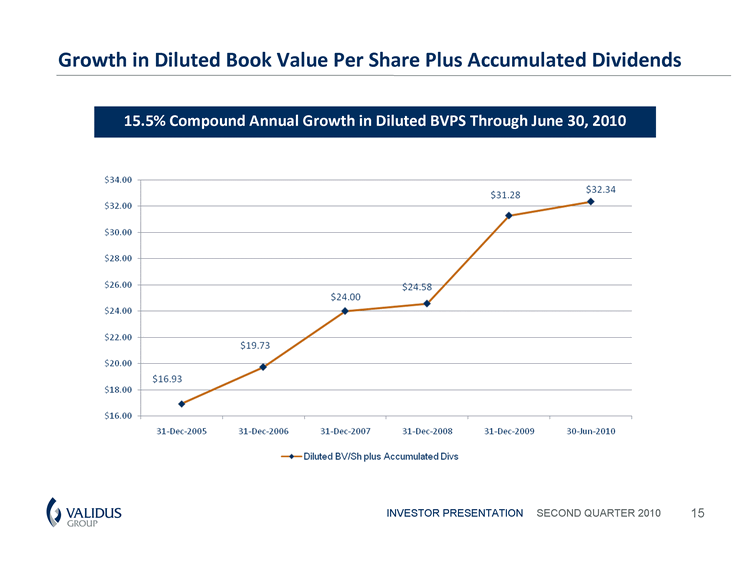
| Growth in Diluted Book Value Per Share Plus Accumulated Dividends 15.5% Compound Annual Growth in Diluted BVPS Through June 30, 2010 15 INVESTOR PRESENTATION SECOND QUARTER 2010 |
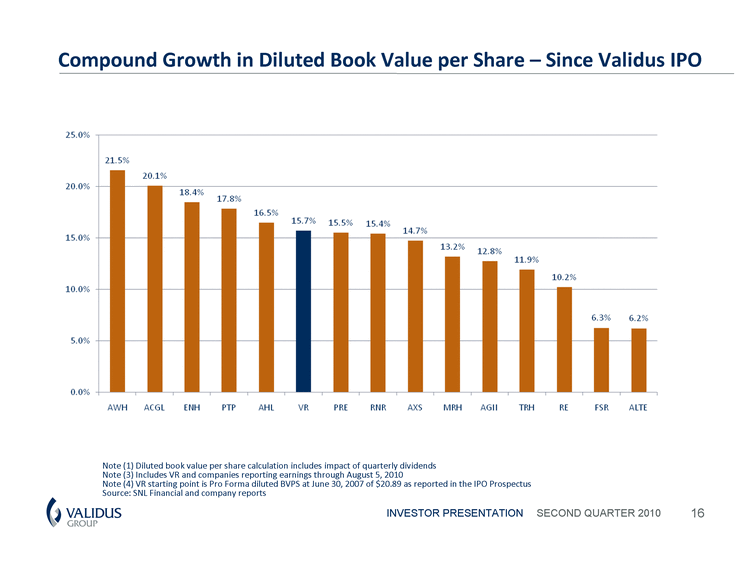
| Compound Growth in Diluted Book Value per Share - Since Validus IPO 16 INVESTOR PRESENTATION SECOND QUARTER 2010 Note (1) Diluted book value per share calculation includes impact of quarterly dividends Note (3) Includes VR and companies reporting earnings through August 5, 2010 Note (4) VR starting point is Pro Forma diluted BVPS at June 30, 2007 of $20.89 as reported in the IPO Prospectus Source: SNL Financial and company reports |
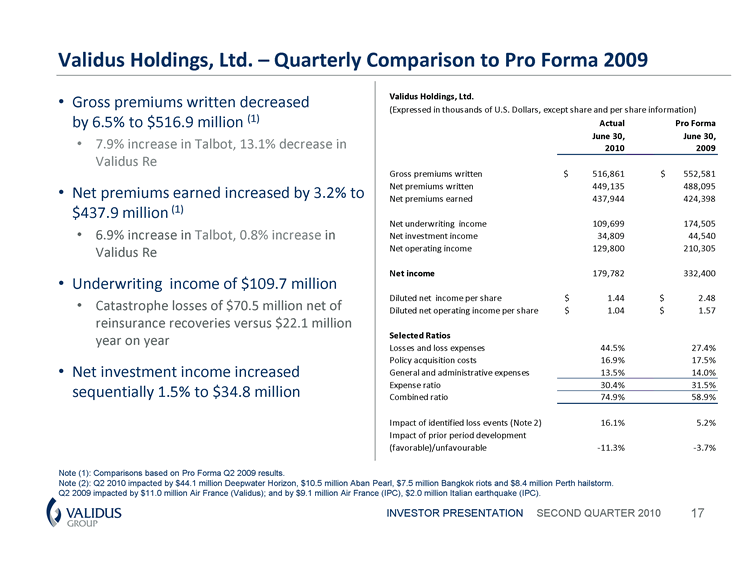
| Validus Holdings, Ltd. - Quarterly Comparison to Pro Forma 2009 Gross premiums written decreased by 6.5% to $516.9 million (1) 7.9% increase in Talbot, 13.1% decrease in Validus Re Net premiums earned increased by 3.2% to $437.9 million (1) 6.9% increase in Talbot, 0.8% increase in Validus Re Underwriting income of $109.7 million Catastrophe losses of $70.5 million net of reinsurance recoveries versus $22.1 million year on year Net investment income increased sequentially 1.5% to $34.8 million 17 INVESTOR PRESENTATION SECOND QUARTER 2010 Note (1): Comparisons based on Pro Forma Q2 2009 results. Note (2): Q2 2010 impacted by $44.1 million Deepwater Horizon, $10.5 million Aban Pearl, $7.5 million Bangkok riots and $8.4 million Perth hailstorm. Q2 2009 impacted by $11.0 million Air France (Validus); and by $9.1 million Air France (IPC), $2.0 million Italian earthquake (IPC). |
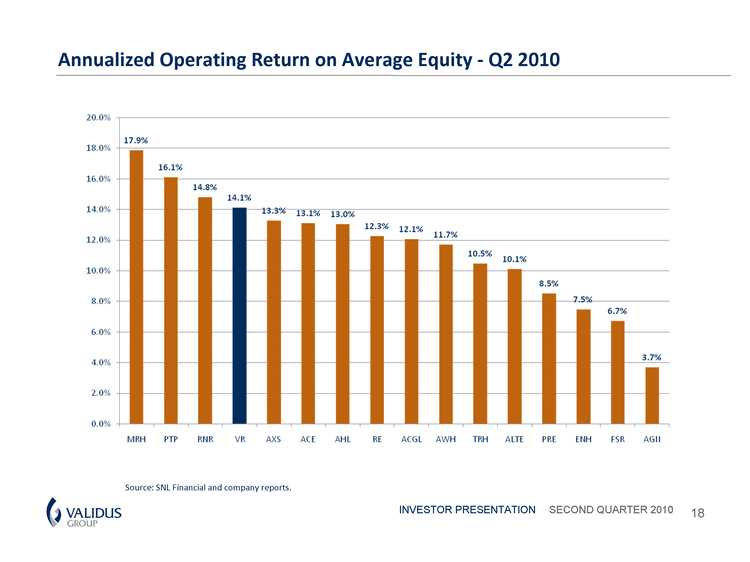
| Annualized Operating Return on Average Equity - Q2 2010 18 Source: SNL Financial and company reports. INVESTOR PRESENTATION SECOND QUARTER 2010 |
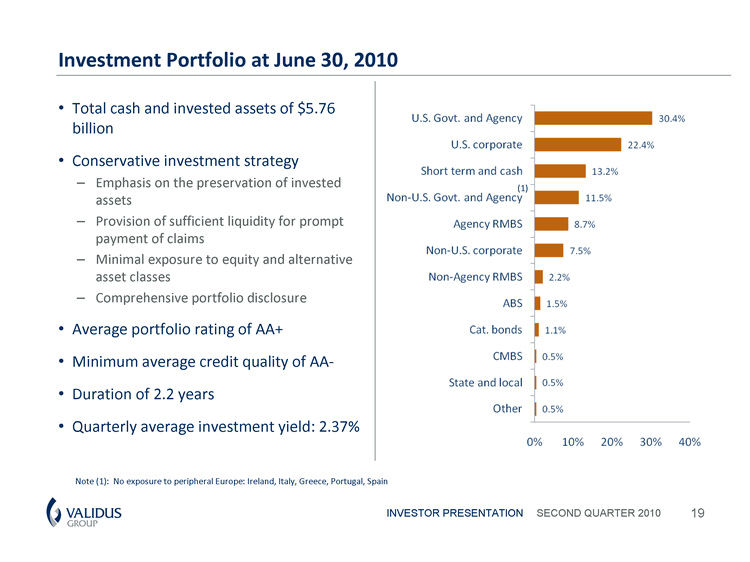
| Investment Portfolio at June 30, 2010 Total cash and invested assets of $5.76 billion Conservative investment strategy Emphasis on the preservation of invested assets Provision of sufficient liquidity for prompt payment of claims Minimal exposure to equity and alternative asset classes Comprehensive portfolio disclosure Average portfolio rating of AA+ Minimum average credit quality of AA- Duration of 2.2 years Quarterly average investment yield: 2.37% 19 INVESTOR PRESENTATION SECOND QUARTER 2010 Note (1): No exposure to peripheral Europe: Ireland, Italy, Greece, Portugal, Spain (1) |
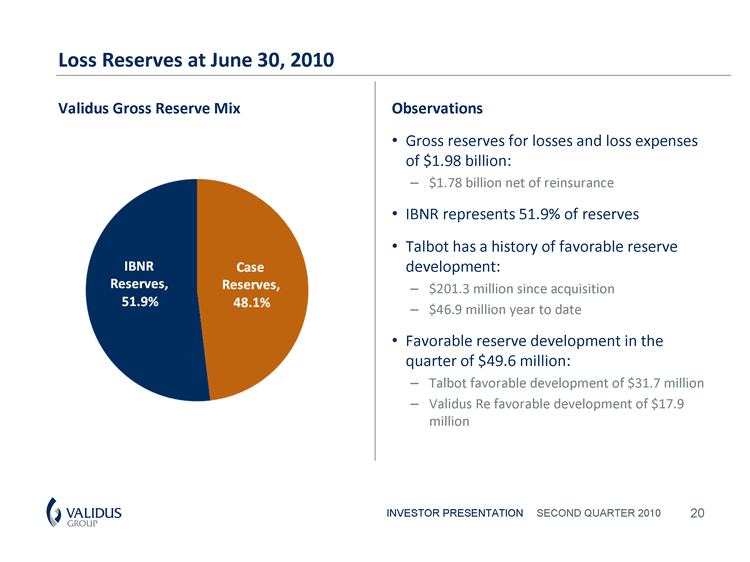
| Loss Reserves at June 30, 2010 Validus Gross Reserve Mix Observations Gross reserves for losses and loss expenses of $1.98 billion: $1.78 billion net of reinsurance IBNR represents 51.9% of reserves Talbot has a history of favorable reserve development: $201.3 million since acquisition $46.9 million year to date Favorable reserve development in the quarter of $49.6 million: Talbot favorable development of $31.7 million Validus Re favorable development of $17.9 million 20 INVESTOR PRESENTATION SECOND QUARTER 2010 |
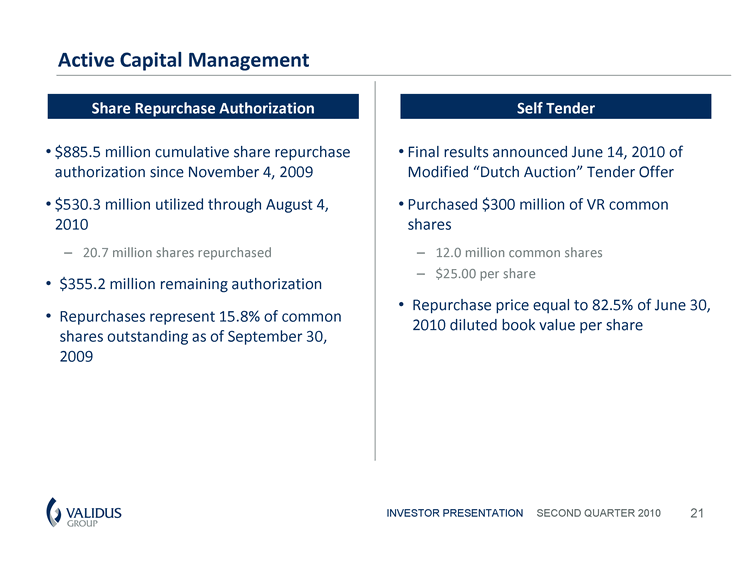
| 21 INVESTOR PRESENTATION SECOND QUARTER 2010 Active Capital Management Self Tender Share Repurchase Authorization $885.5 million cumulative share repurchase authorization since November 4, 2009 $530.3 million utilized through August 4, 2010 20.7 million shares repurchased $355.2 million remaining authorization Repurchases represent 15.8% of common shares outstanding as of September 30, 2009 Final results announced June 14, 2010 of Modified "Dutch Auction" Tender Offer Purchased $300 million of VR common shares 12.0 million common shares $25.00 per share Repurchase price equal to 82.5% of June 30, 2010 diluted book value per share |
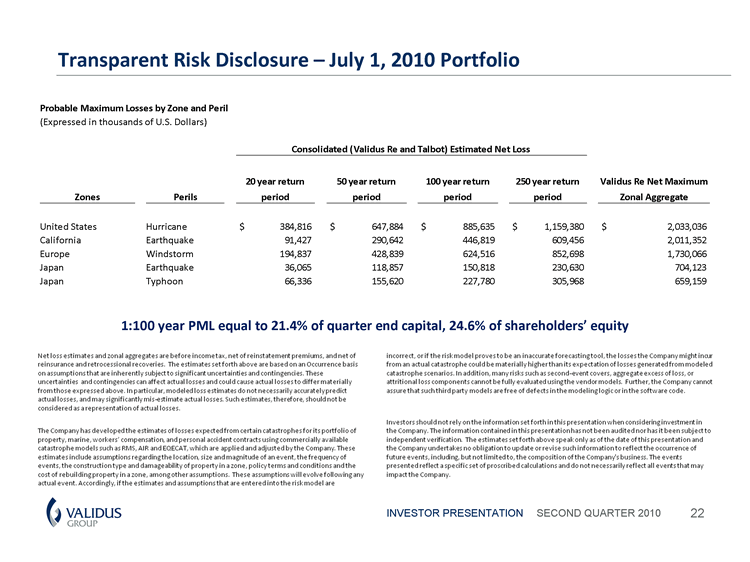
| Transparent Risk Disclosure - July 1, 2010 Portfolio 22 INVESTOR PRESENTATION SECOND QUARTER 2010 1:100 year PML equal to 21.4% of quarter end capital, 24.6% of shareholders' equity |
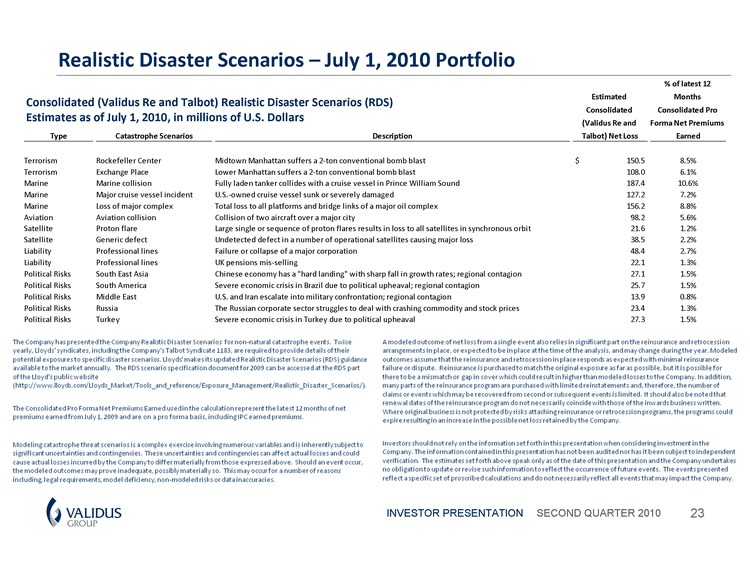
| Realistic Disaster Scenarios - July 1, 2010 Portfolio 23 INVESTOR PRESENTATION SECOND QUARTER 2010 Consolidated (Validus Re and Talbot) Realistic Disaster Scenarios (RDS) Estimates as of July 1, 2010, in millions of U.S. Dollars |

| SECOND QUARTER 2010 APPENDIX Investor Presentation |
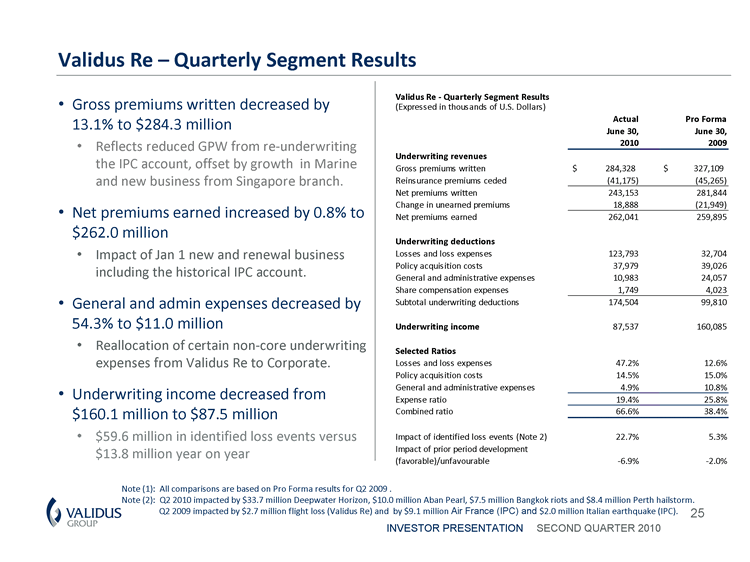
| Validus Re - Quarterly Segment Results Gross premiums written decreased by 13.1% to $284.3 million Reflects reduced GPW from re-underwriting the IPC account, offset by growth in Marine and new business from Singapore branch. Net premiums earned increased by 0.8% to $262.0 million Impact of Jan 1 new and renewal business including the historical IPC account. General and admin expenses decreased by 54.3% to $11.0 million Reallocation of certain non-core underwriting expenses from Validus Re to Corporate. Underwriting income decreased from $160.1 million to $87.5 million $59.6 million in identified loss events versus $13.8 million year on year 25 INVESTOR PRESENTATION SECOND QUARTER 2010 Note (1): All comparisons are based on Pro Forma results for Q2 2009 . Note (2): Q2 2010 impacted by $33.7 million Deepwater Horizon, $10.0 million Aban Pearl, $7.5 million Bangkok riots and $8.4 million Perth hailstorm. Q2 2009 impacted by $2.7 million flight loss (Validus Re) and by $9.1 million Air France (IPC) and $2.0 million Italian earthquake (IPC). |
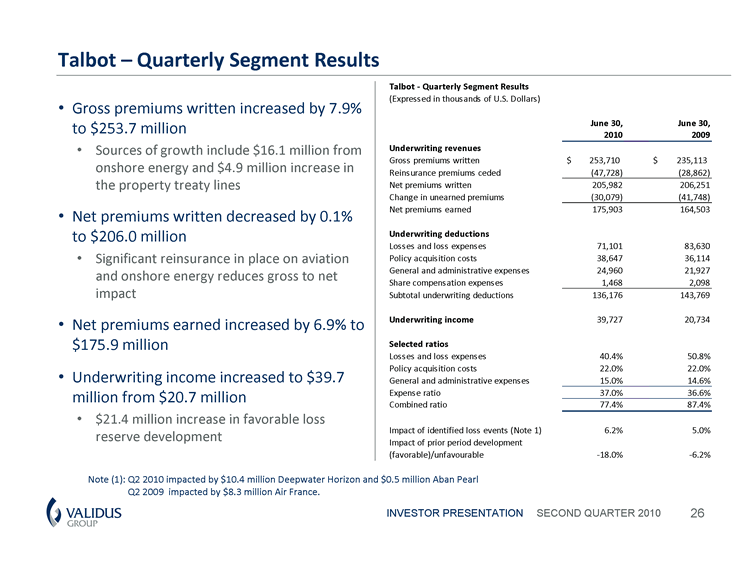
| Talbot - Quarterly Segment Results Gross premiums written increased by 7.9% to $253.7 million Sources of growth include $16.1 million from onshore energy and $4.9 million increase in the property treaty lines Net premiums written decreased by 0.1% to $206.0 million Significant reinsurance in place on aviation and onshore energy reduces gross to net impact Net premiums earned increased by 6.9% to $175.9 million Underwriting income increased to $39.7 million from $20.7 million $21.4 million increase in favorable loss reserve development 26 INVESTOR PRESENTATION SECOND QUARTER 2010 Note (1): Q2 2010 impacted by $10.4 million Deepwater Horizon and $0.5 million Aban Pearl Q2 2009 impacted by $8.3 million Air France. |
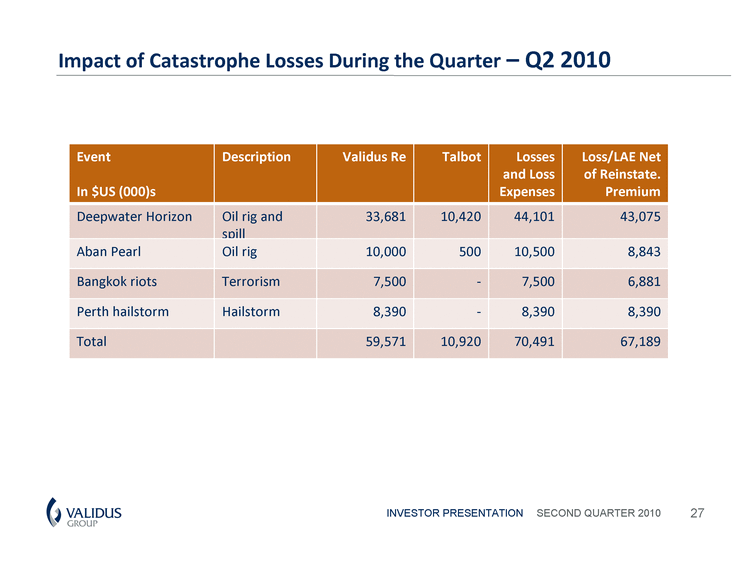
| Impact of Catastrophe Losses During the Quarter - Q2 2010 27 INVESTOR PRESENTATION SECOND QUARTER 2010 Event In $US (000)s Description Validus Re Talbot Losses and Loss Expenses Loss/LAE Net of Reinstate. Premium Deepwater Horizon Oil rig and spill 33,681 10,420 44,101 43,075 Aban Pearl Oil rig 10,000 500 10,500 8,843 Bangkok riots Terrorism 7,500 - 7,500 6,881 Perth hailstorm Hailstorm 8,390 - 8,390 8,390 Total 59,571 10,920 70,491 67,189 |
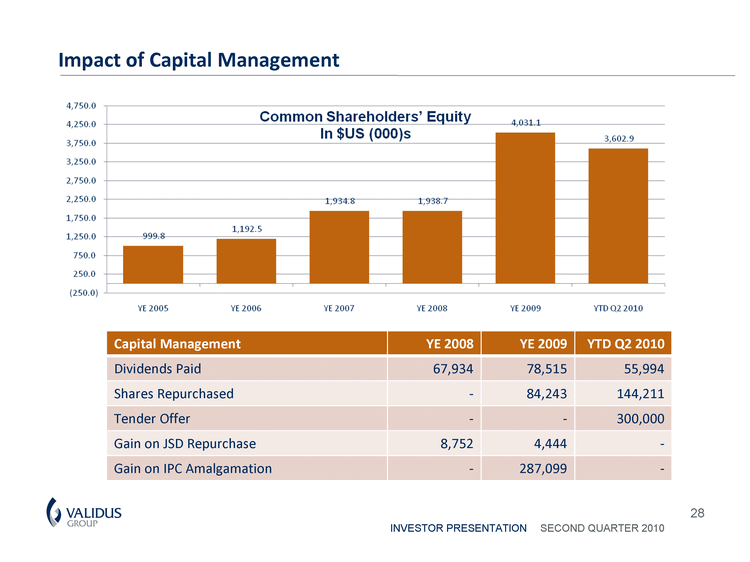
| Impact of Capital Management 28 INVESTOR PRESENTATION SECOND QUARTER 2010 Capital Management YE 2008 YE 2009 YTD Q2 2010 Dividends Paid 67,934 78,515 55,994 Shares Repurchased - 84,243 144,211 Tender Offer - - 300,000 Gain on JSD Repurchase 8,752 4,444 - Gain on IPC Amalgamation - 287,099 - |
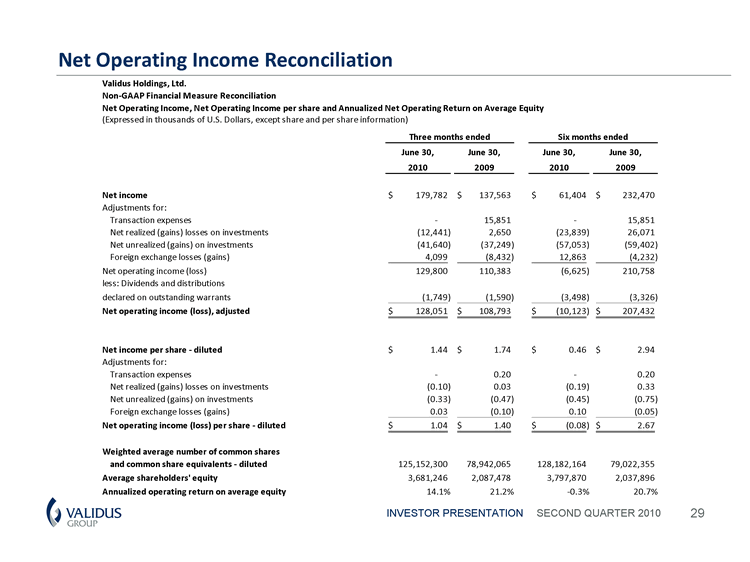
| Net Operating Income Reconciliation 29 INVESTOR PRESENTATION SECOND QUARTER 2010 |
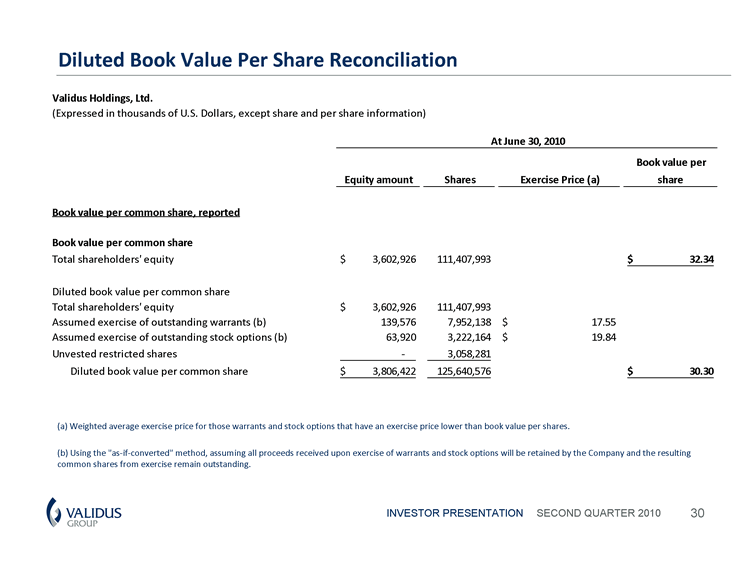
| Diluted Book Value Per Share Reconciliation 30 INVESTOR PRESENTATION SECOND QUARTER 2010 (a) Weighted average exercise price for those warrants and stock options that have an exercise price lower than book value per shares. (b) Using the "as-if-converted" method, assuming all proceeds received upon exercise of warrants and stock options will be retained by the Company and the resulting common shares from exercise remain outstanding. |
