Attached files
| file | filename |
|---|---|
| 8-K - FORM 8-K - PEABODY ENERGY CORP | c59609e8vk.htm |
Exhibit 99.1

| 1 Jefferies 6th Annual Global Industrial and A&D Conference August 10, 2010 Christina A. Morrow Vice President Investor Relations |
| 2 Statement on Forward-Looking Information Some of the following information contains forward-looking statements within the meaning of Section 27A of the Securities Act of 1933 and Section 21E of the Securities Exchange Act of 1934, as amended, and is intended to come within the safe-harbor protection provided by those sections. Our forward-looking statements are based on numerous assumptions that the company believes are reasonable, but they are open to a wide range of uncertainties and business risks that may cause actual results to differ materially from expectations as of July 20, 2010. These factors are difficult to accurately predict and may be beyond the company's control. The company does not undertake to update its forward-looking statements. Factors that could affect the company's results include, but are not limited to: demand for coal in United States and international power generation and steel production markets; price volatility and demand, particularly in higher-margin products and in our trading and brokerage businesses; reductions and/or deferrals of purchases by major customers and ability to renew sales contracts; credit and performance risks associated with customers, suppliers, trading, banks and other financial counterparties; geologic, equipment, permitting and operational risks related to mining; transportation availability, performance and costs; availability, timing of delivery and costs of key supplies, capital equipment or commodities such as diesel fuel, steel, explosives and tires; impact of weather on demand, production and transportation; successful implementation of business strategies, including our Btu Conversion and generation development initiatives; negotiation of labor contracts, employee relations and workforce availability; changes in postretirement benefit and pension obligations and funding requirements; replacement and development of coal reserves; access to capital and credit markets and availability and costs of credit, margin capacity, surety bonds, letters of credit, and insurance; effects of changes in interest rates and currency exchange rates (primarily the Australian dollar); effects of acquisitions or divestitures; economic strength and political stability of countries in which we have operations or serve customers; legislation, regulations and court decisions or other government actions, including new environmental requirements affecting the use of coal; litigation, including claims not yet asserted; and other risks detailed in the company's reports filed with the Securities and Exchange Commission (SEC). The use of "Peabody," "the company," and "our" relate to Peabody, its subsidiaries and majority-owned affiliates. EBITDA or Adjusted EBITDA is defined as income from continuing operations before deducting net interest expense, income taxes, asset retirement obligation expense, and depreciation, depletion and amortization. EBITDA, which is not calculated identically by all companies, is not a substitute for operating income, net income or cash flow as determined in accordance with United States generally accepted accounting principles. Management uses EBITDA as a key measure of operating performance and also believes it is a useful indicator of the company's ability to meet debt service and capital expenditure requirements. 07/20/10 |
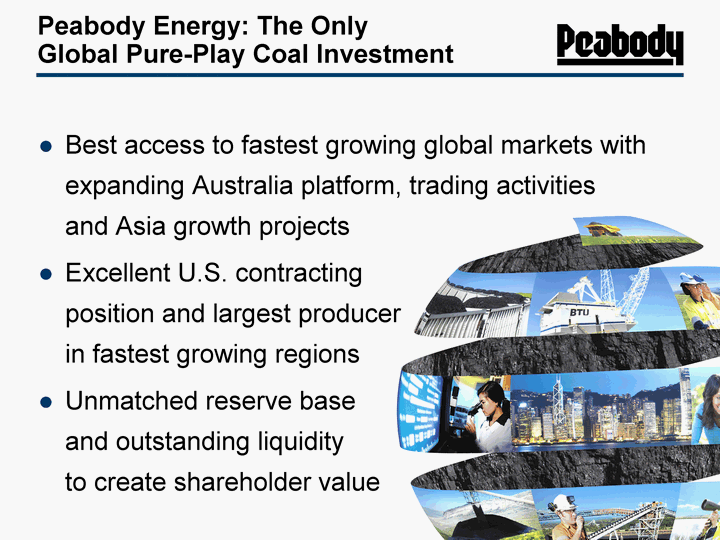
| 3 Peabody Energy: The Only Global Pure-Play Coal Investment Best access to fastest growing global markets with expanding Australia platform, trading activities and Asia growth projects Excellent U.S. contracting position and largest producer in fastest growing regions Unmatched reserve base and outstanding liquidity to create shareholder value |
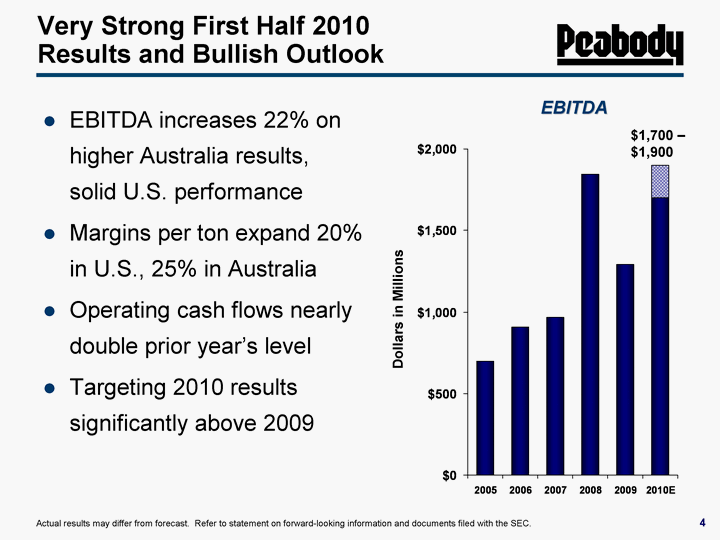
| 4 Very Strong First Half 2010 Results and Bullish Outlook EBITDA increases 22% on higher Australia results, solid U.S. performance Margins per ton expand 20% in U.S., 25% in Australia Operating cash flows nearly double prior year's level Targeting 2010 results significantly above 2009 2005 2006 2007 2008 2009 2010E 696.4 909.7 969.7 1846.9 1290.1 1700 200 EBITDA $1,700 - $1,900 Dollars in Millions Actual results may differ from forecast. Refer to statement on forward-looking information and documents filed with the SEC. |

| Peabody Capitalizing on Outstanding Asia-Pacific Demand |
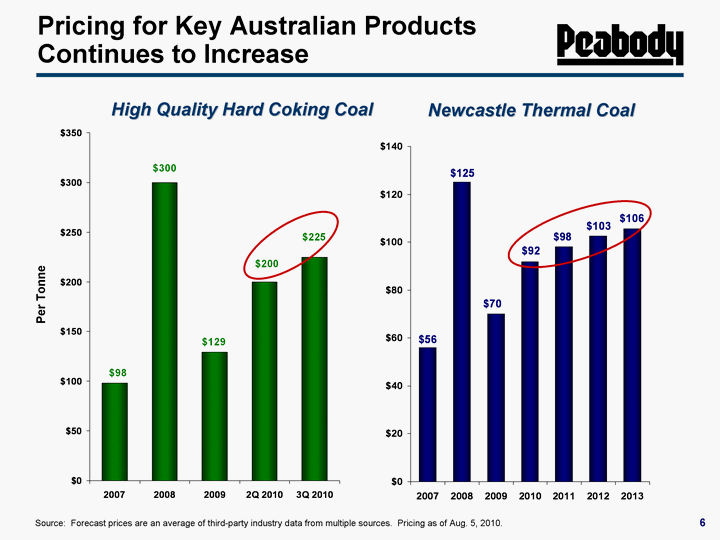
| 6 2007 2008 2009 2Q 2010 3Q 2010 98 300 129 200 225 2007 2008 2009 2010 2011 2012 2013 56 125 70 91.82 98.07 102.65 105.7 Newcastle Thermal Coal Source: Forecast prices are an average of third-party industry data from multiple sources. Pricing as of Aug. 5, 2010. High Quality Hard Coking Coal Per Tonne Pricing for Key Australian Products Continues to Increase |
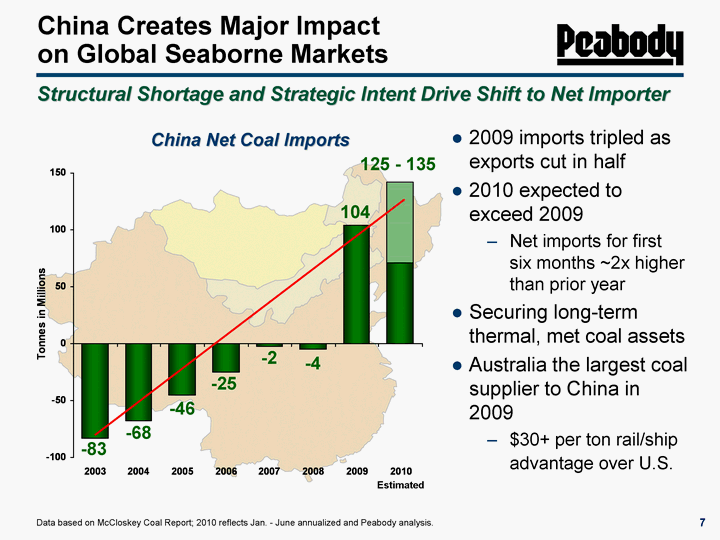
| 7 2003 2004 2005 2006 2007 2008 2009 2010 Annual. Imports -83.124 -67.963 -45.548 -24.988 -2.087 -4.449 104.196 71 71 China Creates Major Impact on Global Seaborne Markets Structural Shortage and Strategic Intent Drive Shift to Net Importer Data based on McCloskey Coal Report; 2010 reflects Jan. - June annualized and Peabody analysis. China Net Coal Imports Estimated 125 - 135 -83 -68 -46 -25 -4 -2 104 2009 imports tripled as exports cut in half 2010 expected to exceed 2009 Net imports for first six months ~2x higher than prior year Securing long-term thermal, met coal assets Australia the largest coal supplier to China in 2009 $30+ per ton rail/ship advantage over U.S. |
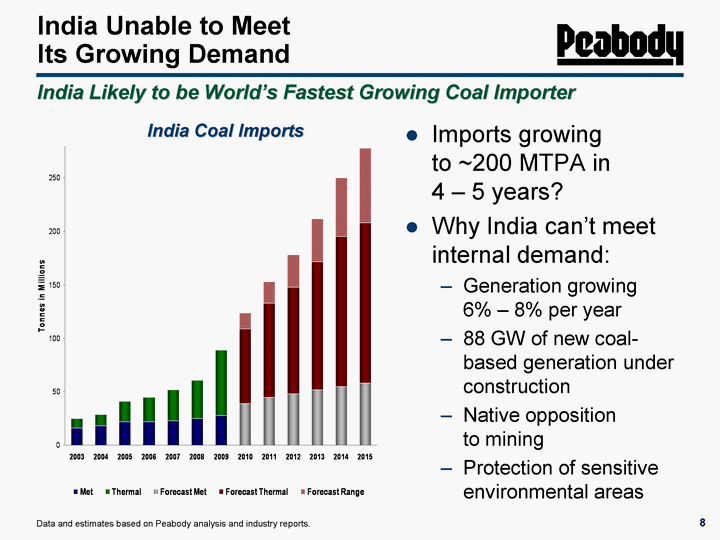
| 8 8 India Unable to Meet Its Growing Demand Data and estimates based on Peabody analysis and industry reports. India Coal Imports Imports growing to ~200 MTPA in 4 - 5 years? Why India can't meet internal demand: Generation growing 6% - 8% per year 88 GW of new coal- based generation under construction Native opposition to mining Protection of sensitive environmental areas India Likely to be World's Fastest Growing Coal Importer |
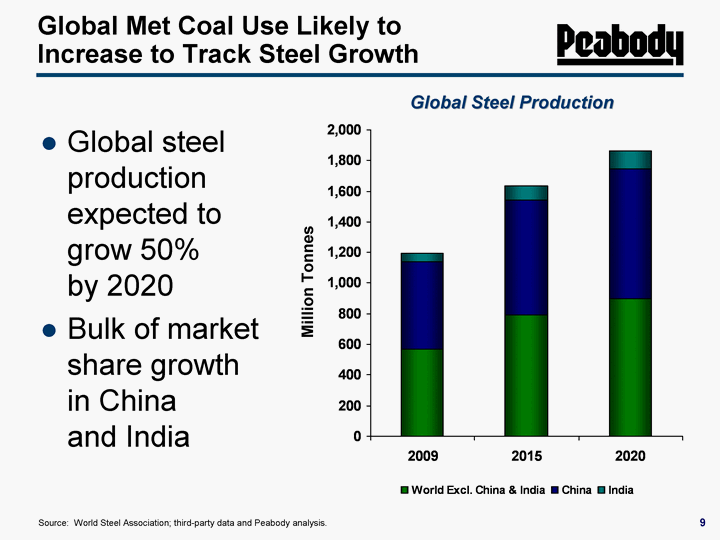
| 9 Global Met Coal Use Likely to Increase to Track Steel Growth ROW 306 China 612 Global Steel Production Source: World Steel Association; third-party data and Peabody analysis. Global steel production expected to grow 50% by 2020 Bulk of market share growth in China and India 2009 2015 2020 World Excl. China & India 572 793 897 China 566 748 850 India 56 94 115 Million Tonnes |
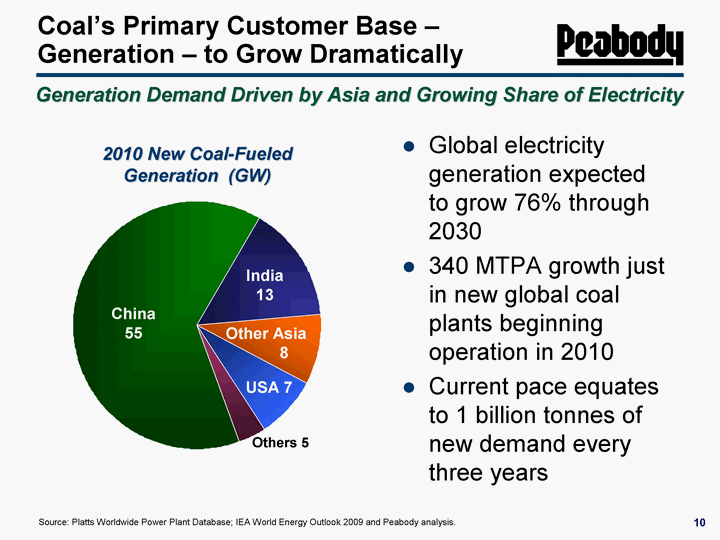
| 10 China India Other Asia USA Others 55 13 8 7 3 Coal's Primary Customer Base - Generation - to Grow Dramatically Source: Platts Worldwide Power Plant Database; IEA World Energy Outlook 2009 and Peabody analysis. Generation Demand Driven by Asia and Growing Share of Electricity 2010 New Coal-Fueled Generation (GW) China 55 India 13 Other Asia 8 USA 7 Others 5 Global electricity generation expected to grow 76% through 2030 340 MTPA growth just in new global coal plants beginning operation in 2010 Current pace equates to 1 billion tonnes of new demand every three years |
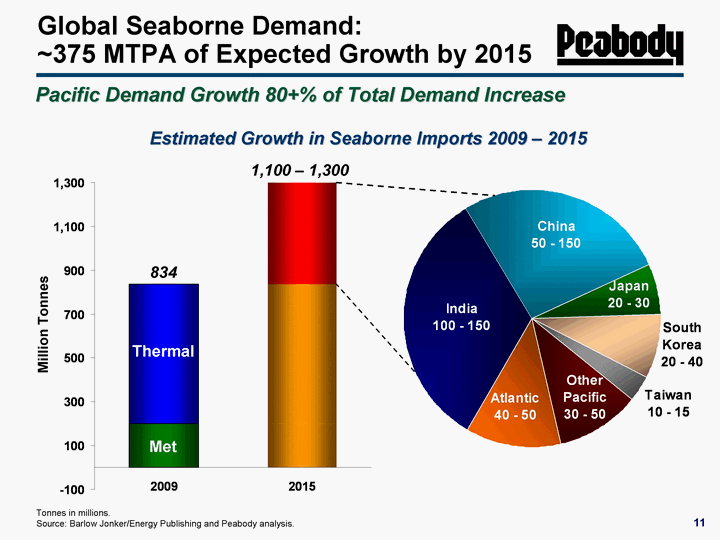
| 11 Global Seaborne Demand: ~375 MTPA of Expected Growth by 2015 Tonnes in millions. Source: Barlow Jonker/Energy Publishing and Peabody analysis. Estimated Growth in Seaborne Imports 2009 - 2015 India China Japan South Korea Taiwan Other Pacific Atlantic 125 100 25 30 12.5 40 45 Pacific Demand Growth 80+% of Total Demand Increase Million Tonnes 834 1,100 - 1,300 Met Thermal |
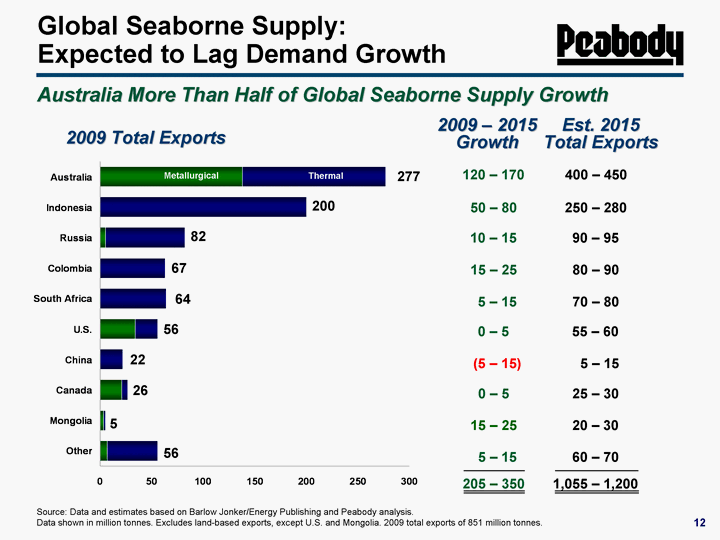
| 12 Global Seaborne Supply: Expected to Lag Demand Growth Source: Data and estimates based on Barlow Jonker/Energy Publishing and Peabody analysis. Data shown in million tonnes. Excludes land-based exports, except U.S. and Mongolia. 2009 total exports of 851 million tonnes. Australia More Than Half of Global Seaborne Supply Growth 2009 - 2015 Growth 120 - 170 50 - 80 10 - 15 15 - 25 5 - 15 0 - 5 (5 - 15) 0 - 5 15 - 25 205 - 350 5 - 15 Est. 2015 Total Exports 400 - 450 250 - 280 90 - 95 80 - 90 70 - 80 55 - 60 5 - 15 25 - 30 20 - 30 60 - 70 1,055 - 1,200 2009 Total Exports Metallurgical Thermal 277 200 82 67 64 56 22 26 5 56 |
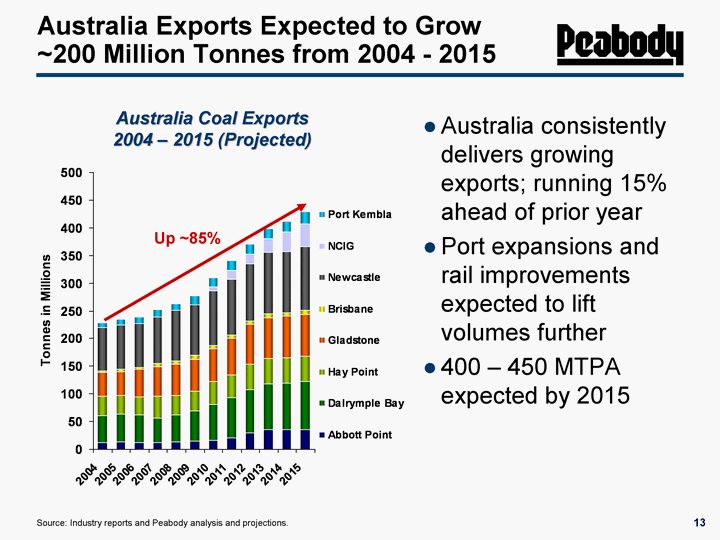
| 13 2004 2005 2006 2007 2008 2009 2010 2011 2012 2013 2014 2015 Abbott Point 12.533 12.971 11.207 11.756 13.685 15.242 16 20 30 35 35 35 Dalrymple Bay 47.291 50.659 50.946 44.787 47.983 54.225 65 73 78 83 85 88 Hay Point 36.193 33.517 32.152 39.068 35.972 35.008 41 41 45 45 45 45 Gladstone 42.715 42.824 49.75 53.382 56.075 58.017 59 66 72 75 75 76 Brisbane 2.944 4.247 3.952 5.263 5.322 6.429 7 7 7 7 7 7 Newcastle 77.811 80.327 79.805 84.796 91.437 92.81 98 100 103 110 110 115 NCIG 8 16 17 25 35 41 Port Kembla 8.931 10.087 11.184 12.924 11.715 15.013 16 18 18 18 20 22 Australia Coal Exports 2004 - 2015 (Projected) Australia Exports Expected to Grow ~200 Million Tonnes from 2004 - 2015 Source: Industry reports and Peabody analysis and projections. Metallurgical Thermal Australia consistently delivers growing exports; running 15% ahead of prior year Port expansions and rail improvements expected to lift volumes further 400 - 450 MTPA expected by 2015 Up ~85% |
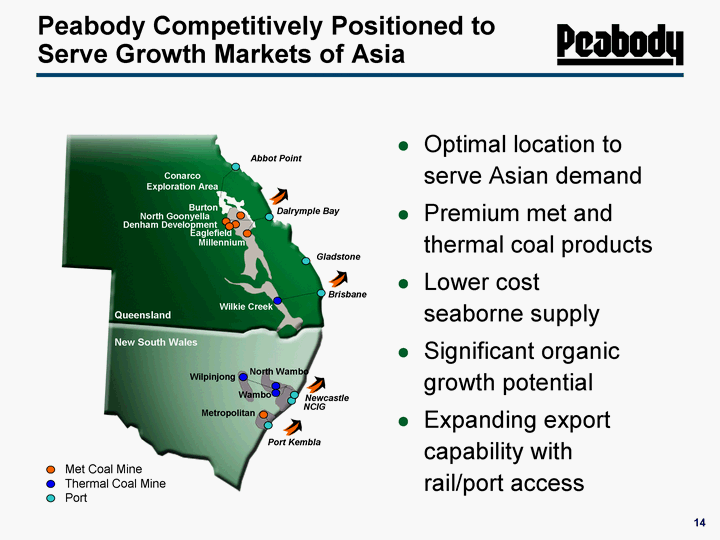
| Burton North Goonyella Eaglefield Millennium Metropolitan Dalrymple Bay Abbot Point Port Kembla Queensland New South Wales Conarco Exploration Area Wilkie Creek Brisbane Wilpinjong North Wambo Wambo NCIG Newcastle Gladstone Met Coal Mine Thermal Coal Mine Port Denham Development Optimal location to serve Asian demand Premium met and thermal coal products Lower cost seaborne supply Significant organic growth potential Expanding export capability with rail/port access Peabody Competitively Positioned to Serve Growth Markets of Asia |
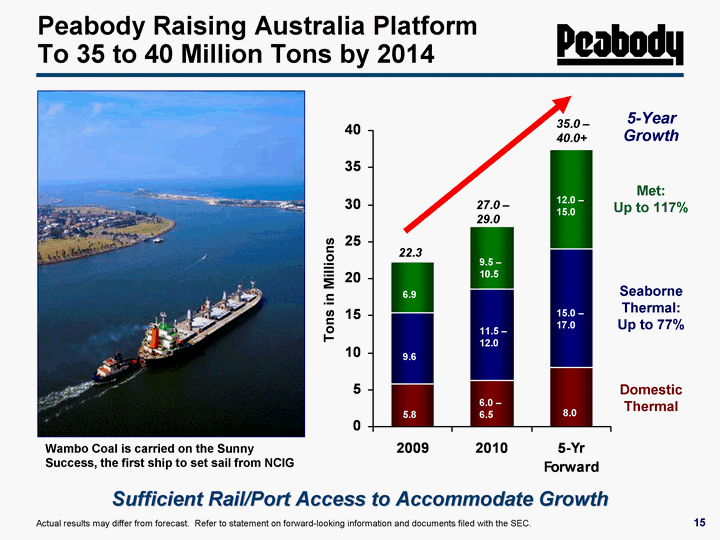
| 15 2009 2010 5-Yr Forward Domestic Thermal 5.8 6.25 8 Seaborne Thermal 9.6 12.25 16 Seaborne Met 6.9 8.5 13.5 1.5 2.5 2.5 6.0 - 6.5 11.5 - 12.0 9.5 - 10.5 8.0 15.0 - 17.0 12.0 - 15.0 27.0 - 29.0 35.0 - 40.0+ Peabody Raising Australia Platform To 35 to 40 Million Tons by 2014 Met: Up to 117% Seaborne Thermal: Up to 77% 5-Year Growth Tons in Millions Actual results may differ from forecast. Refer to statement on forward-looking information and documents filed with the SEC. Domestic Thermal 6.9 9.6 5.8 22.3 Wambo Coal is carried on the Sunny Success, the first ship to set sail from NCIG Sufficient Rail/Port Access to Accommodate Growth |
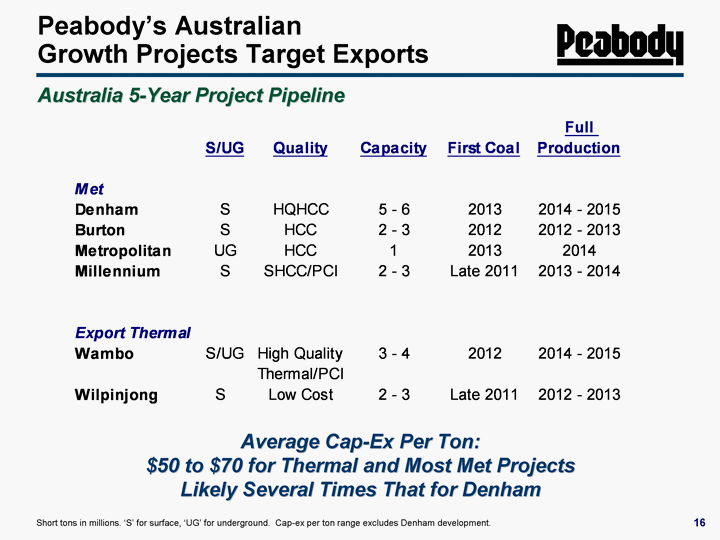
| 16 Australia 5-Year Project Pipeline Peabody's Australian Growth Projects Target Exports Short tons in millions. 'S' for surface, 'UG' for underground. Cap-ex per ton range excludes Denham development. Average Cap-Ex Per Ton: $50 to $70 for Thermal and Most Met Projects Likely Several Times That for Denham |
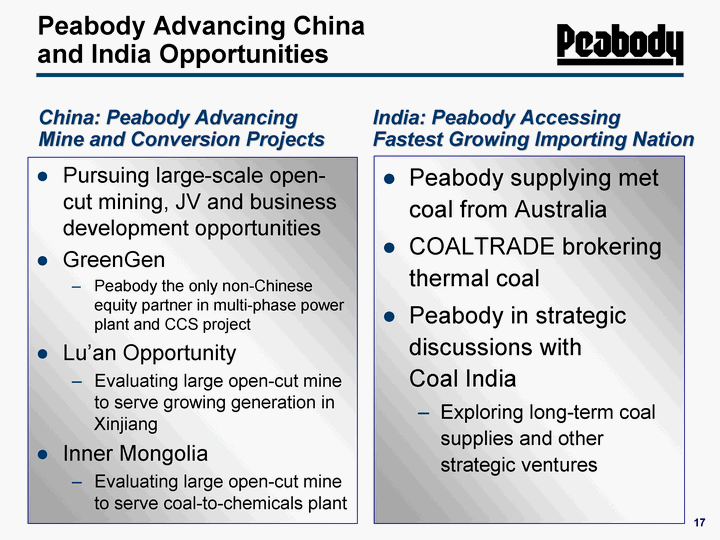
| 17 Peabody Advancing China and India Opportunities Long-term met customer from Australia COALTRADE brokering thermal coal Peabody selected as strategic partner by Coal India Discussions ongoing re: long-term coal supplies or other strategic ventures India: Peabody Accessing Fastest Growing Importing Nation China: Peabody Advancing Mine and Conversion Projects Long-term met customer from Australia COALTRADE brokering thermal coal Peabody selected as strategic partner by Coal India Discussions ongoing re: long-term coal supplies or other strategic ventures Peabody supplying met coal from Australia COALTRADE brokering thermal coal Peabody in strategic discussions with Coal India Exploring long-term coal supplies and other strategic ventures Pursuing large-scale open- cut mining, JV and business development opportunities GreenGen Peabody the only non-Chinese equity partner in multi-phase power plant and CCS project Lu'an Opportunity Evaluating large open-cut mine to serve growing generation in Xinjiang Inner Mongolia Evaluating large open-cut mine to serve coal-to-chemicals plant |
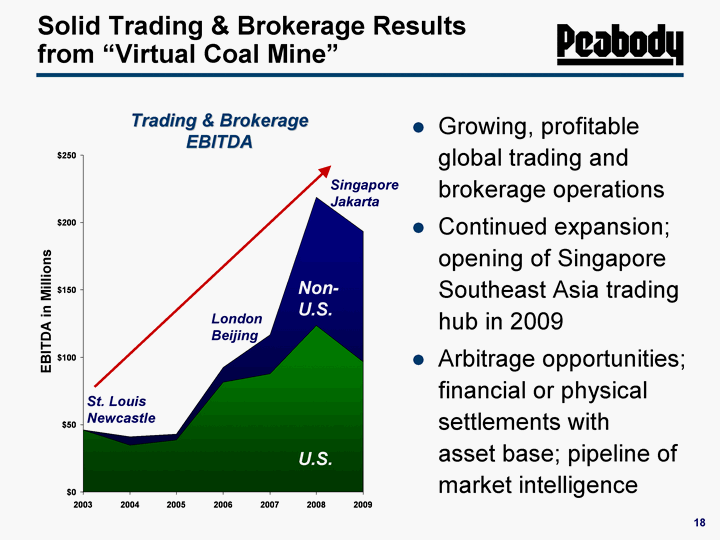
| 18 Solid Trading & Brokerage Results from "Virtual Coal Mine" Growing, profitable global trading and brokerage operations Continued expansion; opening of Singapore Southeast Asia trading hub in 2009 Arbitrage opportunities; financial or physical settlements with asset base; pipeline of market intelligence 2003 2004 2005 2006 2007 2008 2009 Domestic EBITDA 45.828 34.781 38.745 81.604 87.781 123.683 96.7 International EBITDA 0 6.258 4.313 11 28.819 95.217 96.7 EBITDA in Millions St. Louis Newcastle London Beijing Singapore Jakarta Trading & Brokerage EBITDA Non- U.S. U.S. |
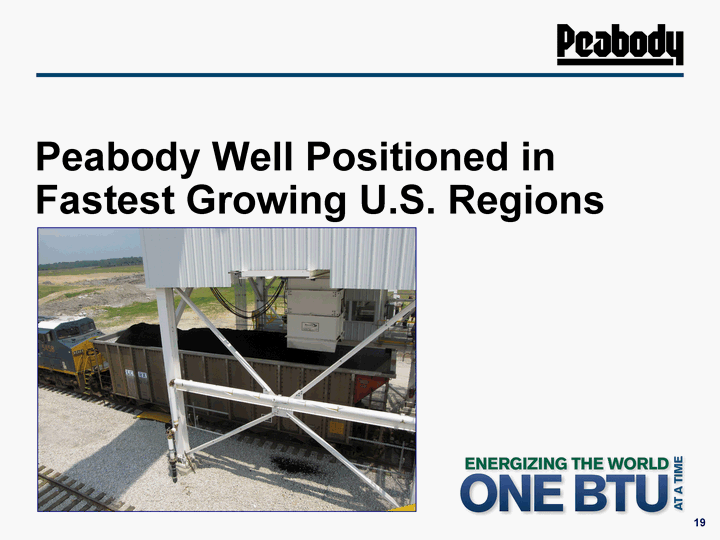
| 19 Peabody Well Positioned in Fastest Growing U.S. Regions |
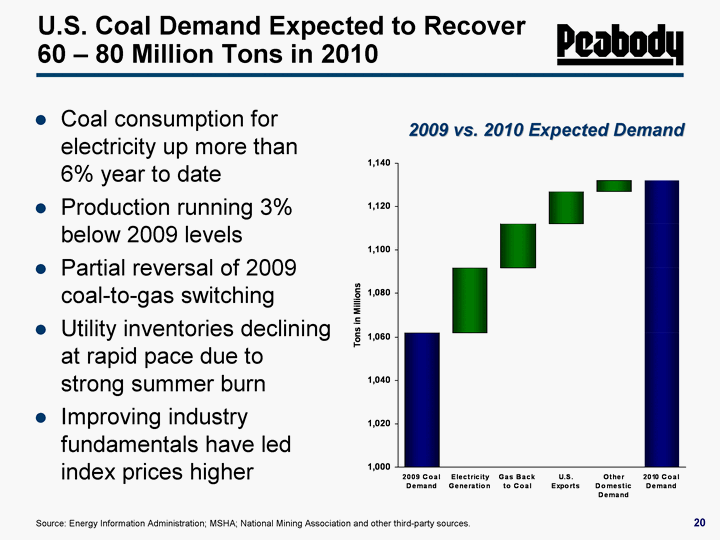
| U.S. Coal Demand Expected to Recover 60 - 80 Million Tons in 2010 Source: Energy Information Administration; MSHA; National Mining Association and other third-party sources. 2009 vs. 2010 Expected Demand Coal consumption for electricity up more than 6% year to date Production running 3% below 2009 levels Partial reversal of 2009 coal-to-gas switching Utility inventories declining at rapid pace due to strong summer burn Improving industry fundamentals have led index prices higher 2009 Coal Demand Electricity Generation Gas Back to Coal U.S. Exports Other Domestic Demand 2010 Coal Demand 1062 1062 1062 1062 1062 1062 30 30 30 30 30 30 20 20 20 20 20 20 15 15 15 15 15 15 5 5 5 5 5 5 |
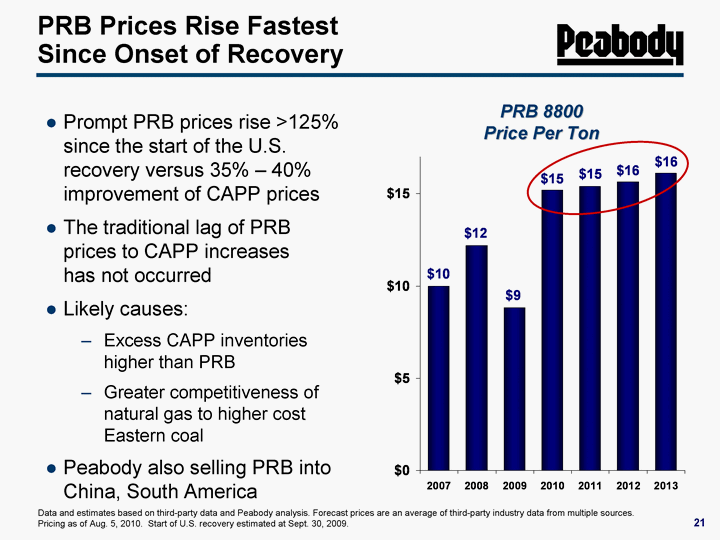
| 21 PRB Prices Rise Fastest Since Onset of Recovery Data and estimates based on third-party data and Peabody analysis. Forecast prices are an average of third-party industry data from multiple sources. Pricing as of Aug. 5, 2010. Start of U.S. recovery estimated at Sept. 30, 2009. PRB 8800 Price Per Ton Prompt PRB prices rise >125% since the start of the U.S. recovery versus 35% - 40% improvement of CAPP prices The traditional lag of PRB prices to CAPP increases has not occurred Likely causes: Excess CAPP inventories higher than PRB Greater competitiveness of natural gas to higher cost Eastern coal Peabody also selling PRB into China, South America 2007 2008 2009 2010 2011 2012 2013 9.99 12.2 8.83 15.2 15.4 15.64 16.12 |
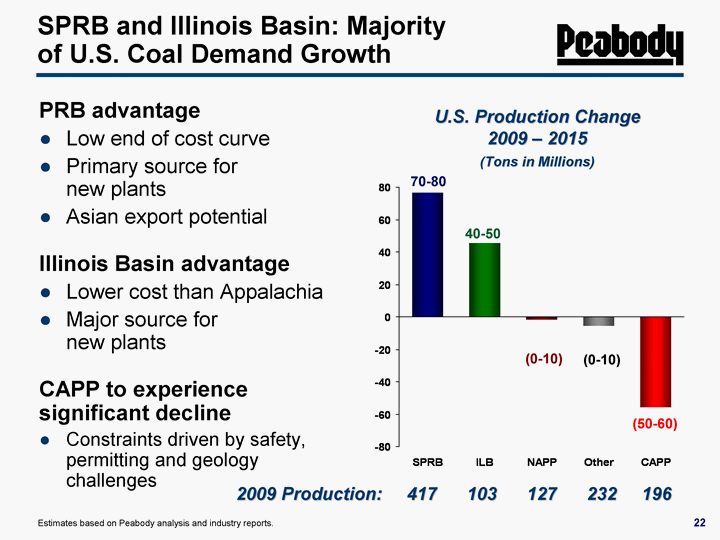
| 22 SPRB and Illinois Basin: Majority of U.S. Coal Demand Growth PRB advantage Low end of cost curve Primary source for new plants Asian export potential Illinois Basin advantage Lower cost than Appalachia Major source for new plants CAPP to experience significant decline Constraints driven by safety, permitting and geology challenges SPRB ILB NAPP Other CAPP 2009 77 46 -2 -6 -56 U.S. Production Change 2009 - 2015 (Tons in Millions) 70-80 40-50 (0-10) (0-10) (50-60) Estimates based on Peabody analysis and industry reports. 2009 Production: 417 103 127 232 196 |
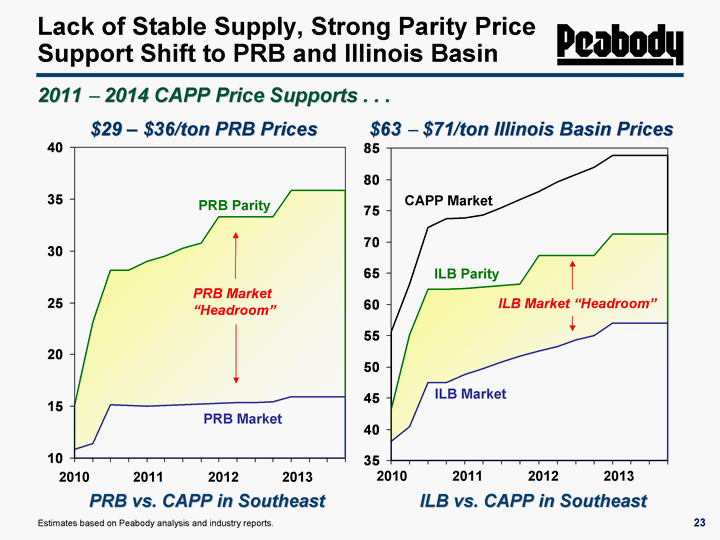
| 23 2 Lack of Stable Supply, Strong Parity Price Support Shift to PRB and Illinois Basin 2011 ? 2014 CAPP Price Supports . . . $29 - $36/ton PRB Prices $63 ? $71/ton Illinois Basin Prices 55.6 63.28 72.25 73.65 73.85 74.35 75.5 76.8 78.1 79.55 80.8 82 83.86 83.86 83.86 83.86 43.0600000000049 55.16 62.44 62.44 62.5 62.75 63 63.25 67.81 67.81 67.81 67.81 71.29 71.29 71.29 71.29 38.07 40.45 47.5 47.5 48.75 49.75 50.75 51.75 52.5 53.25 54.25 55 57 57 57 57 2013 2012 2011 2010 15.07 23.12 28.11 28.11 29 29.5 30.25 30.75 33.32 33.32 33.32 33.32 35.84 35.84 35.84 35.84 10.8710025396838 11.4300000000013 15.15 15.05 15 15.05 15.15 15.2 15.3 15.35 15.4 15.45 15.9 15.9 15.9 15.9 2010 2013 2011 2012 ILB vs. CAPP in Southeast PRB vs. CAPP in Southeast ILB Market "Headroom" PRB Market "Headroom" ILB Parity ILB Market CAPP Market PRB Parity PRB Market Estimates based on Peabody analysis and industry reports. |
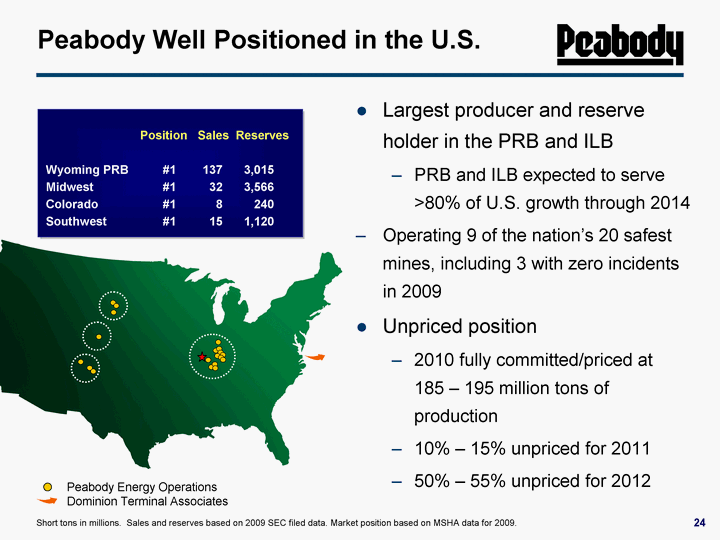
| 24 Peabody Well Positioned in the U.S. Largest producer and reserve holder in the PRB and ILB PRB and ILB expected to serve >80% of U.S. growth through 2014 Operating 9 of the nation's 20 safest mines, including 3 with zero incidents in 2009 Unpriced position 2010 fully committed/priced at 185 - 195 million tons of production 10% - 15% unpriced for 2011 50% - 55% unpriced for 2012 Short tons in millions. Sales and reserves based on 2009 SEC filed data. Market position based on MSHA data for 2009. Peabody Energy Operations Dominion Terminal Associates Position Sales Reserves Wyoming PRB #1 137 3,015 Midwest #1 32 3,566 Colorado #1 8 240 Southwest #1 15 1,120 |
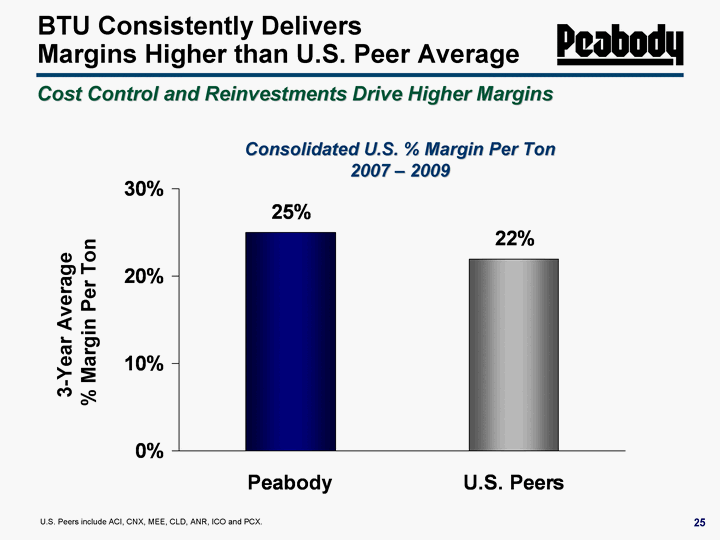
| 25 BTU Consistently Delivers Margins Higher than U.S. Peer Average U.S. Peers include ACI, CNX, MEE, CLD, ANR, ICO and PCX. Cost Control and Reinvestments Drive Higher Margins Consolidated U.S. % Margin Per Ton 2007 - 2009 Peabody U.S. Peers 0.25 0.22 3-Year Average % Margin Per Ton |

| 26 Peabody's Shareholder Value Upside |
| 27 27 BTU: Significant Upside to Shareholder Value BTU's longstanding EV/EBITDA multiple and premium have contracted, providing significant upside when markets correct Valuation ignores ongoing supercycle and prices BTU at late-cycle multiples BTU's Australia assets alone exceed company's market cap based on precedent transactions BTU a Bargain Based on Many Metrics BTU Has Substantial Valuation Upside From Both Rising Earnings and Multiples |
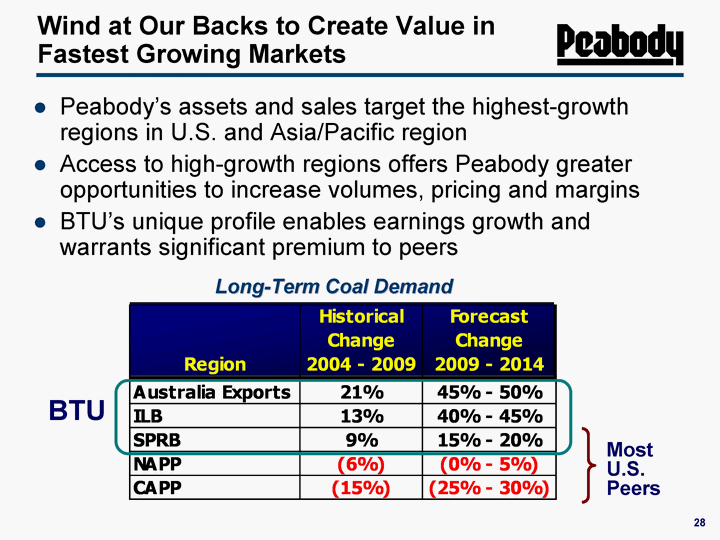
| 28 Peabody's assets and sales target the highest-growth regions in U.S. and Asia/Pacific region Access to high-growth regions offers Peabody greater opportunities to increase volumes, pricing and margins BTU's unique profile enables earnings growth and warrants significant premium to peers Wind at Our Backs to Create Value in Fastest Growing Markets Long-Term Coal Demand BTU Most U.S. Peers |

| 29 Jefferies 6th Annual Global Industrial and A&D Conference August 10, 2010 Christina A. Morrow Vice President Investor Relations |
