Attached files
| file | filename |
|---|---|
| 8-K - FORM 8-K - TRINITY INDUSTRIES INC | d75119e8vk.htm |
Exhibit 99.1

| Trinity Industries, Inc. August 2010 |
| 2 Forward Looking Statements This presentation contains "forward looking statements" as defined by the Private Securities Litigation Reform Act of 1995 and includes statements as to expectations, beliefs and future financial performance, or assumptions underlying or concerning matters herein. These statements that are not historical facts are forward looking. Readers are directed to Trinity's Form 10-K and other SEC filings for a description of certain of the business issues and risks, a change in any of which could cause actual results or outcomes to differ materially from those expressed in the forward looking statements. Any forward looking statement speaks only as of the date on which such statement is made. Trinity undertakes no obligation to update any forward looking statement or statements to reflect events or circumstances after the date on which such statement is made. |
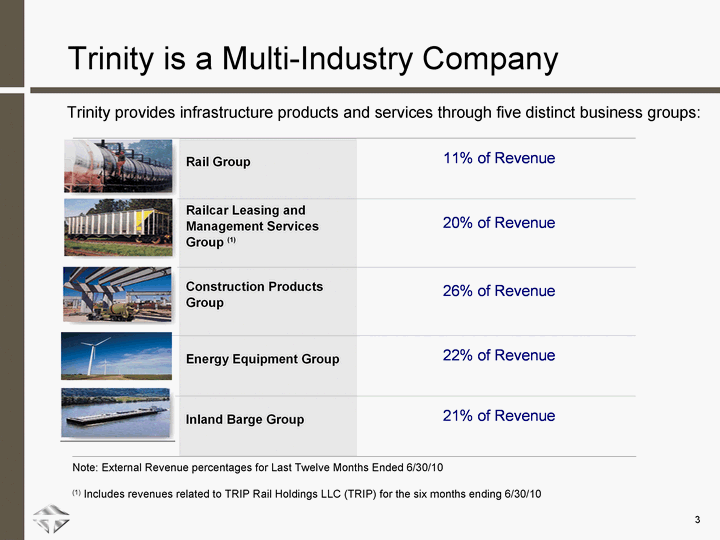
| 3 Trinity is a Multi-Industry Company Trinity is a Multi-Industry Company Trinity provides infrastructure products and services through five distinct business groups: Note: External Revenue percentages for Last Twelve Months Ended 6/30/10 (1) Includes revenues related to TRIP Rail Holdings LLC (TRIP) for the six months ending 6/30/10 |
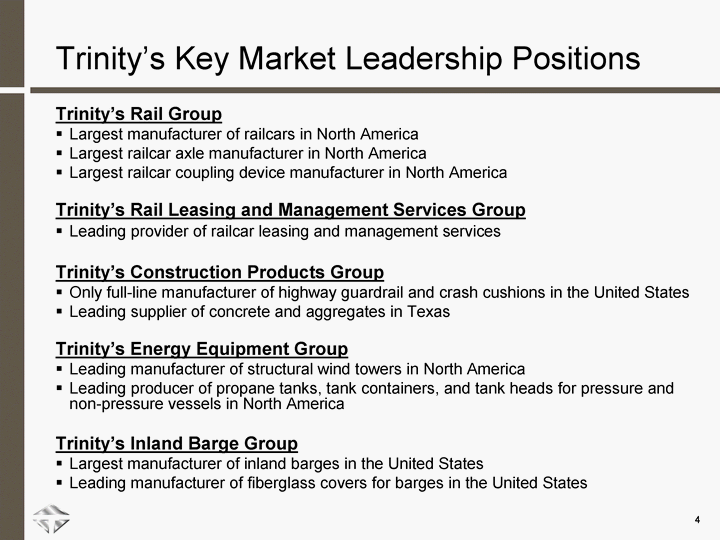
| 4 Trinity's Key Market Leadership Positions Trinity's Rail Group Largest manufacturer of railcars in North America Largest railcar axle manufacturer in North America Largest railcar coupling device manufacturer in North America Trinity's Rail Leasing and Management Services Group Leading provider of railcar leasing and management services Trinity's Construction Products Group Only full-line manufacturer of highway guardrail and crash cushions in the United States Leading supplier of concrete and aggregates in Texas Trinity's Energy Equipment Group Leading manufacturer of structural wind towers in North America Leading producer of propane tanks, tank containers, and tank heads for pressure and non-pressure vessels in North America Trinity's Inland Barge Group Largest manufacturer of inland barges in the United States Leading manufacturer of fiberglass covers for barges in the United States |
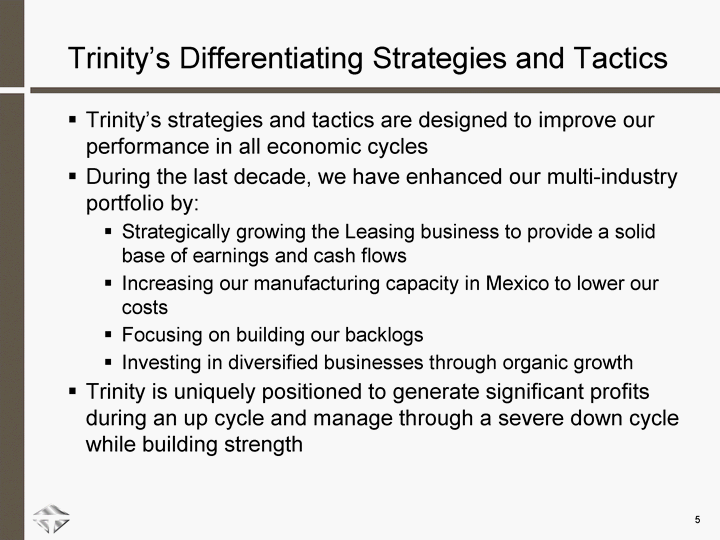
| 5 Trinity's Differentiating Strategies and Tactics Trinity's strategies and tactics are designed to improve our performance in all economic cycles During the last decade, we have enhanced our multi-industry portfolio by: Strategically growing the Leasing business to provide a solid base of earnings and cash flows Increasing our manufacturing capacity in Mexico to lower our costs Focusing on building our backlogs Investing in diversified businesses through organic growth Trinity is uniquely positioned to generate significant profits during an up cycle and manage through a severe down cycle while building strength |
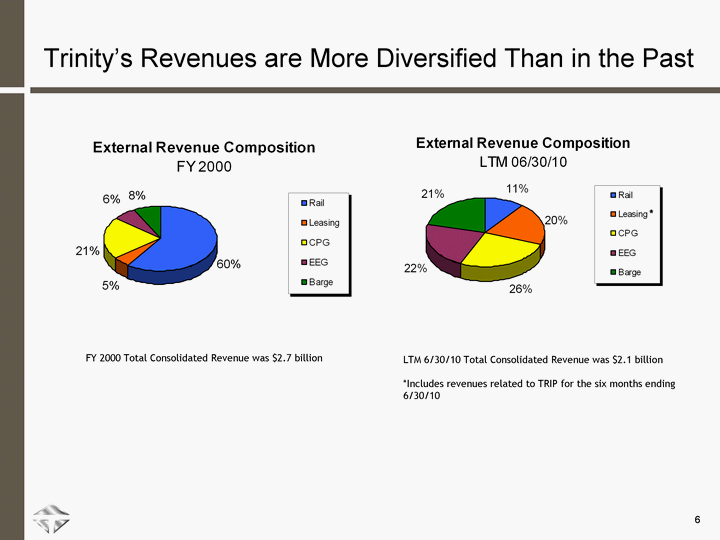
| 6 Trinity's Revenues are More Diversified Than in the Past LTM 6/30/10 Total Consolidated Revenue was $2.1 billion *Includes revenues related to TRIP for the six months ending 6/30/10 FY 2000 Total Consolidated Revenue was $2.7 billion * |
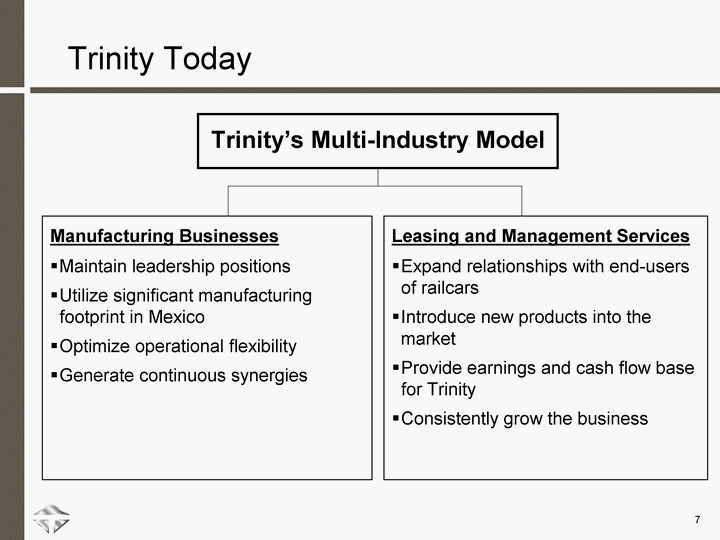
| 7 Trinity Today Leasing and Management Services Expand relationships with end-users of railcars Introduce new products into the market Provide earnings and cash flow base for Trinity Consistently grow the business Manufacturing Businesses Maintain leadership positions Utilize significant manufacturing footprint in Mexico Optimize operational flexibility Generate continuous synergies Trinity's Multi-Industry Model |
| 8 Trinity Has Navigated Through Economic Cycles Trinity's businesses have gone through multiple economic cycles Our seasoned management knows how to assess the market, proactively plan for cycles and then react to changes in economic conditions We have a performance driven culture that thrives on managing in various operating environments We maintain a solid balance sheet to take advantage of investment opportunities, such as undervalued acquisitions or organic growth Trinity has staying power and has always built strength during a down cycle and emerged with more opportunity for growth than when the cycle began |
| 9 Trinity is Well Positioned for All Economic Cycles Trinity had strong momentum as the positive economic cycle came to an end Trinity had significant backlogs as we entered the economic downturn They have enabled normal operating conditions and the opportunity to proactively plan our production Trinity's manufacturing flexibility, combined with our broad product offering allows us to pursue a wide range of orders Trinity has a cost-effective manufacturing footprint in the Southern United States and Mexico across product lines Trinity's continuous synergies across business lines provide unique opportunities Trinity's lease fleet of 50,970 railcars (excluding TRIP) provides a strong strategic connection to our customers, as well as a long-term stream of profits and cash flows Trinity is in a strong liquidity position with a solid balance sheet and available lines of credit |

| 10 Trinity's Manufacturing Flexibility is a Differentiator Trinity's Manufacturing Flexibility is a Differentiator Trinity's Manufacturing Flexibility is a Differentiator Trinity's Manufacturing Flexibility is a Differentiator Trinity's manufacturing flexibility enhances our opportunistic approach We quickly respond to market changes and customer needs Our resources are directed toward highest and best use Manufacturing flexibility across business lines Manufacturing flexibility across broad product lines |
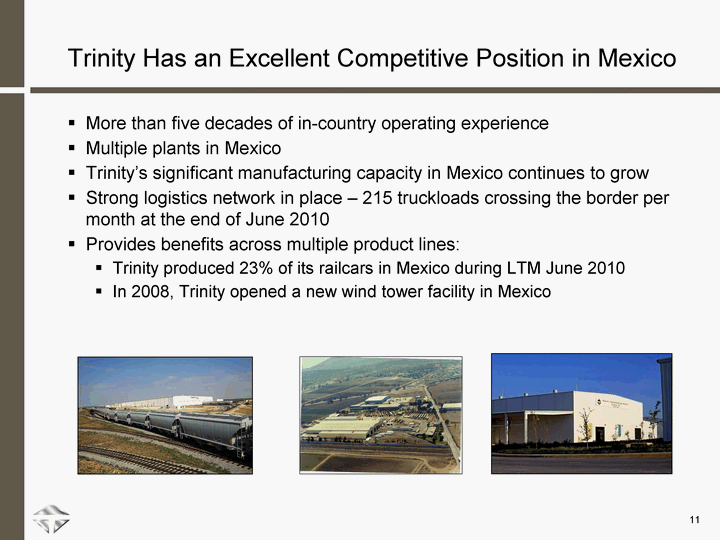
| 11 Trinity Has an Excellent Competitive Position in Mexico Trinity Has an Excellent Competitive Position in Mexico More than five decades of in-country operating experience Multiple plants in Mexico Trinity's significant manufacturing capacity in Mexico continues to grow Strong logistics network in place - 215 truckloads crossing the border per month at the end of June 2010 Provides benefits across multiple product lines: Trinity produced 23% of its railcars in Mexico during LTM June 2010 In 2008, Trinity opened a new wind tower facility in Mexico MSPhotoEd.3 MSPhotoEd.3 MSPhotoEd.3 MSPhotoEd.3 MSPhotoEd.3 MSPhotoEd.3 MSPhotoEd.3 MSPhotoEd.3 |
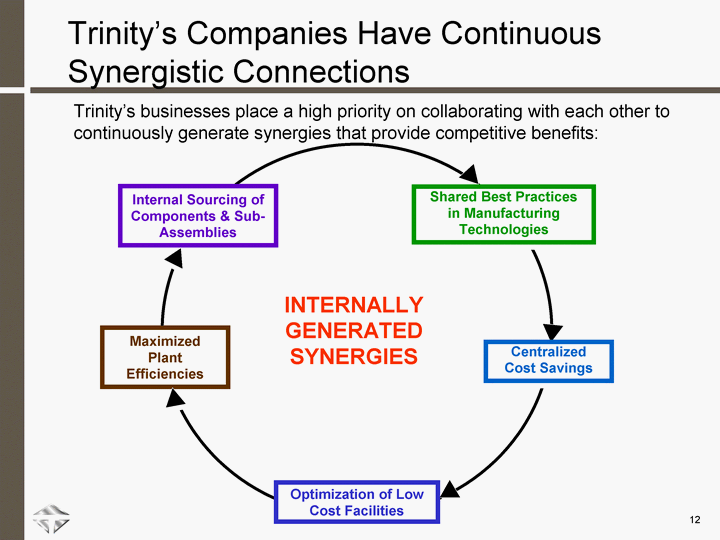
| 12 Trinity's Companies Have Continuous Synergistic Connections Trinity's businesses place a high priority on collaborating with each other to continuously generate synergies that provide competitive benefits: Maximized Plant Efficiencies Internal Sourcing of Components & Sub- Assemblies INTERNALLY GENERATED SYNERGIES Centralized Cost Savings Optimization of Low Cost Facilities Shared Best Practices in Manufacturing Technologies |
| 13 Trinity's Railcar Leasing Company Provides Stability Trinity Industries Leasing Company's (TILC) growth over the last decade has established a predictable revenue and earnings base TILC continues to provide strategic benefits to our manufacturing businesses in addition to its strong financial performance We have been highly successful in renewing or remarketing cars in our fleet Utilization of the TILC lease fleet was 98.7% at June 30, 2010 Utilization of the TRIP lease fleet was 99.5% at June 30, 2010 There is a high probability that a large portion of new railcar orders will be for leases and we are positioned to take advantage of that trend Trinity plans to continue its TILC lease fleet growth In 2010, we expect to add $200 - $225 million (net) of railcars to our lease fleet |
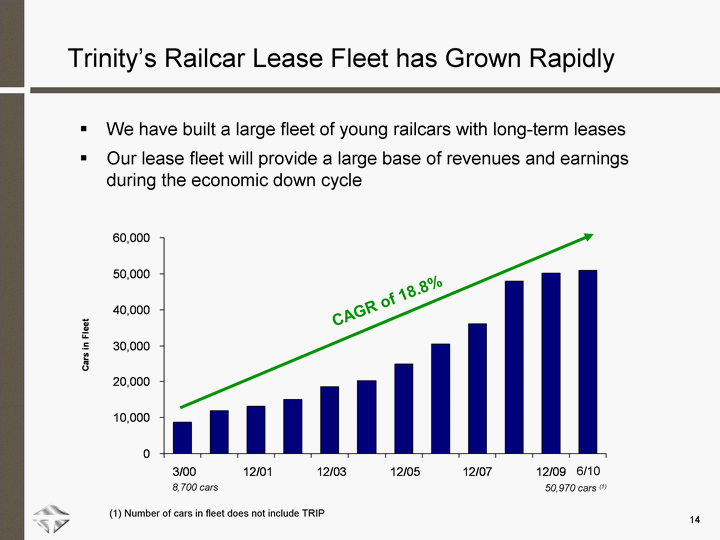
| 14 Trinity's Railcar Lease Fleet has Grown Rapidly 3/00 3/01 12/01 12/02 12/03 12/04 12/05 12/06 12/07 12/08 12/09 6/10 2003 8684 11830 13280 15098 18599 20313 24877 30553 36090 47850 50090 50970 CAGR of 18.8% 8,700 cars 50,970 cars (1) We have built a large fleet of young railcars with long-term leases Our lease fleet will provide a large base of revenues and earnings during the economic down cycle Fleet numbers include the (1) Number of cars in fleet does not include TRIP 3/10 6/10 |
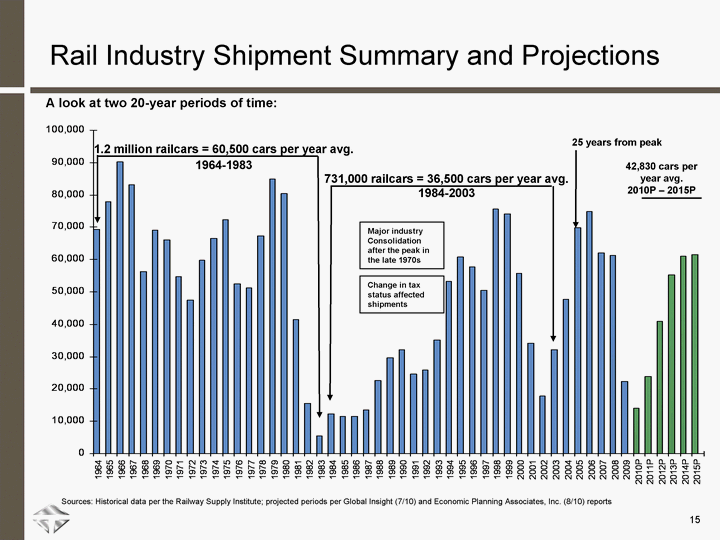
| 15 Industry Shipments 1956 67080 1957 99590 1958 42760 1959 37819 1960 57047 1961 31720 1962 36554 1963 44960 1964 69330 1965 77828 1966 90104 1967 83095 1968 56232 1969 69028 1970 65970 1971 54696 1972 47460 1973 59875 1974 66563 1975 72337 1976 52504 1977 51142 1978 67286 1979 84869 1980 80470 1981 41435 1982 15515 1983 5570 1984 12376 1985 11674 1986 11508 1987 13645 1988 22524 1989 29617 1990 32063 1991 24674 1992 25761 1993 35239 1994 53281 1995 60853 1996 57877 1997 50396 1998 75685 1999 74223 2000 55791 2001 34260 2002 17714 2003 32184 2004 47801 2005 69759 2006 74943 2007 62185 2008 61220 2009 22308 2010P 14146 2011P 23814 2012P 41016 2013P 55288 2014P 61170 2015P 61568 1.2 million railcars = 60,500 cars per year avg. 1964-1983 731,000 railcars = 36,500 cars per year avg. 1984-2003 Rail Industry Shipment Summary and Projections Sources: Historical data per the Railway Supply Institute; projected periods per Global Insight (7/10) and Economic Planning Associates, Inc. (8/10) reports 25 years from peak 42,830 cars per year avg. 2010P - 2015P A look at two 20-year periods of time: Major industry Consolidation after the peak in the late 1970s Change in tax status affected shipments |

| 16 Trinity's Liquidity Position is Strong As of June 30th, 2010: Unrestricted Cash and Short-term Marketable Securities of $435.3 million Corporate Revolver availability of $339.3 million TILC Leasing Warehouse availability of $337.7 million Total available liquidity of approximately $1.1 billion Corporate Revolver $425 million facility Matures October, 2012 No borrowings at 06/30/10 $85.7 million in Letters of Credit TILC Leasing Warehouse Facility $475 million facility Matures February, 2011 |
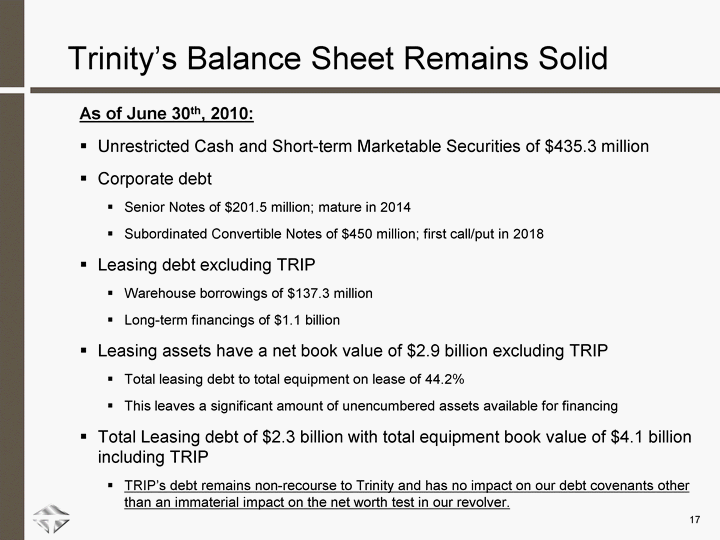
| 17 Trinity's Balance Sheet Remains Solid As of June 30th, 2010: Unrestricted Cash and Short-term Marketable Securities of $435.3 million Corporate debt Senior Notes of $201.5 million; mature in 2014 Subordinated Convertible Notes of $450 million; first call/put in 2018 Leasing debt excluding TRIP Warehouse borrowings of $137.3 million Long-term financings of $1.1 billion Leasing assets have a net book value of $2.9 billion excluding TRIP Total leasing debt to total equipment on lease of 44.2% This leaves a significant amount of unencumbered assets available for financing Total Leasing debt of $2.3 billion with total equipment book value of $4.1 billion including TRIP TRIP's debt remains non-recourse to Trinity and has no impact on our debt covenants other than an immaterial impact on the net worth test in our revolver. |
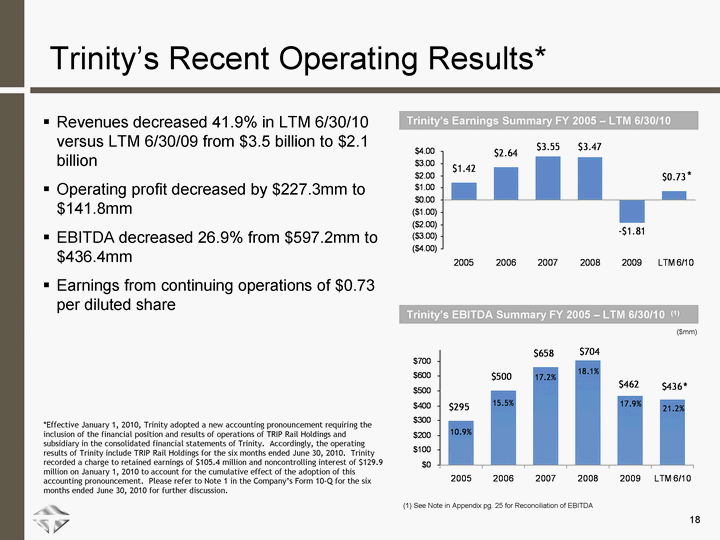
| 18 Trinity's Recent Operating Results* Trinity's Earnings Summary FY 2005 - LTM 6/30/10 Earnings Column 12 Column 13 Column 14 Column 15 Column 16 2003 -0.06 2004 -0.25 2005 1.42 2006 2.64 2007 3.55 2008 3.47 2009 -1.81 LTM 6/10 0.73 Revenues decreased 41.9% in LTM 6/30/10 versus LTM 6/30/09 from $3.5 billion to $2.1 billion Operating profit decreased by $227.3mm to $141.8mm EBITDA decreased 26.9% from $597.2mm to $436.4mm Earnings from continuing operations of $0.73 per diluted share Trinity's EBITDA Summary FY 2005 - LTM 6/30/10 (1) (1) See Note in Appendix pg. 25 for Reconciliation of EBITDA ($mm) EBITDA Margin Line 3 Revenue EBITDA Stack 2 Stack 3 Stack 4 Stack 5 Stack 6 Stack 7 Stack 8 Stack 9 Stack 10 Stack 11 Stack 12 Stack 13 Stack 14 Stack 15 Stack 16 2002 0.07368587 1268.9 93.504 50 2003 0.080165092 1259.9 101 125 2004 0.05 1965 98.3 200 2005 0.108609809 2709.7 294.5 275 2006 0.1553947 3218.9 500.2 350 2007 0.1718 3832.8 658.3 2008 0.1812 3903.2 703.5 2009 0.179 462 LTM 6/10 0.212 436.4 * * *Effective January 1, 2010, Trinity adopted a new accounting pronouncement requiring the inclusion of the financial position and results of operations of TRIP Rail Holdings and subsidiary in the consolidated financial statements of Trinity. Accordingly, the operating results of Trinity include TRIP Rail Holdings for the six months ended June 30, 2010. Trinity recorded a charge to retained earnings of $105.4 million and noncontrolling interest of $129.9 million on January 1, 2010 to account for the cumulative effect of the adoption of this accounting pronouncement. Please refer to Note 1 in the Company's Form 10-Q for the six months ended June 30, 2010 for further discussion. |

| Appendix: Operating Business Summaries |
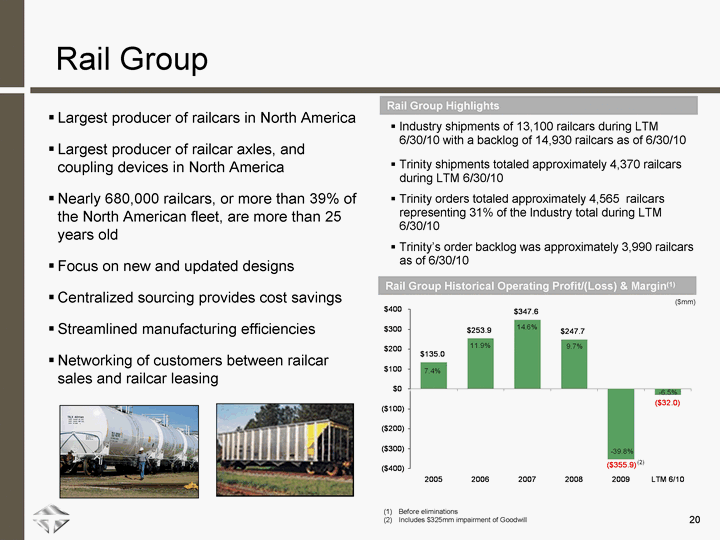
| 20 Industry shipments of 13,100 railcars during LTM 6/30/10 with a backlog of 14,930 railcars as of 6/30/10 Trinity shipments totaled approximately 4,370 railcars during LTM 6/30/10 Trinity orders totaled approximately 4,565 railcars representing 31% of the Industry total during LTM 6/30/10 Trinity's order backlog was approximately 3,990 railcars as of 6/30/10 Revenue Operating Profit OP Margin Column 6 Column 7 Column 8 Column 9 Column 10 Column 11 Column 12 Column 13 Column 14 Column 15 Column 16 2003 595 -2.2 -0.0037 2004 1066.7 -20.4 -0.0191 2005 1816.3 135 0.0743 2006 2142.6 253.9 0.1185 2007 2381.5 347.6 0.146 2008 2372 247.7 0.097 2009 -355.9 -0.398 LTM 6/10 -32 -0.065 Rail Group Largest producer of railcars in North America Largest producer of railcar axles, and coupling devices in North America Nearly 680,000 railcars, or more than 39% of the North American fleet, are more than 25 years old Focus on new and updated designs Centralized sourcing provides cost savings Streamlined manufacturing efficiencies Networking of customers between railcar sales and railcar leasing Rail Group Highlights Rail Group Historical Operating Profit/(Loss) & Margin(1) Before eliminations Includes $325mm impairment of Goodwill ($mm) ($mm) ($mm) (2) |
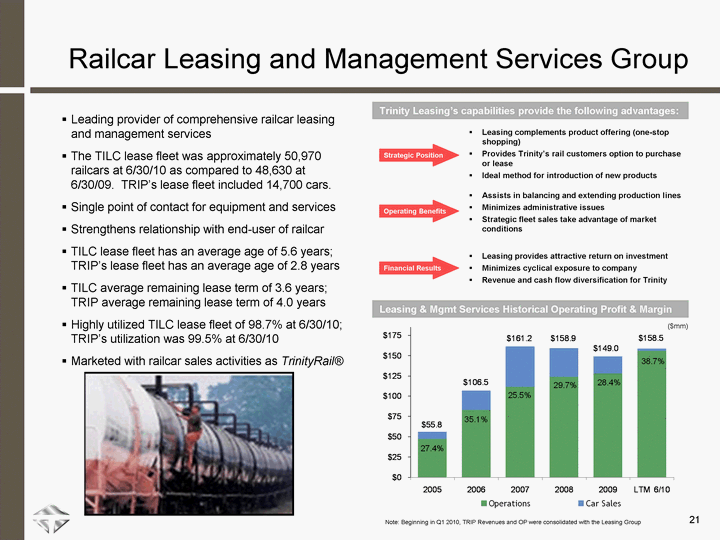
| 21 Railcar Leasing and Management Services Group Leading provider of comprehensive railcar leasing and management services The TILC lease fleet was approximately 50,970 railcars at 6/30/10 as compared to 48,630 at 6/30/09. TRIP's lease fleet included 14,700 cars. Single point of contact for equipment and services Strengthens relationship with end-user of railcar TILC lease fleet has an average age of 5.6 years; TRIP's lease fleet has an average age of 2.8 years TILC average remaining lease term of 3.6 years; TRIP average remaining lease term of 4.0 years Highly utilized TILC lease fleet of 98.7% at 6/30/10; TRIP's utilization was 99.5% at 6/30/10 Marketed with railcar sales activities as TrinityRail(r) Trinity Leasing's capabilities provide the following advantages: Strategic Position Operating Benefits Financial Results Leasing complements product offering (one-stop shopping) Provides Trinity's rail customers option to purchase or lease Ideal method for introduction of new products Assists in balancing and extending production lines Minimizes administrative issues Strategic fleet sales take advantage of market conditions Leasing provides attractive return on investment Minimizes cyclical exposure to company Revenue and cash flow diversification for Trinity Leasing & Mgmt Services Historical Operating Profit & Margin ($mm) ($mm) Note: Beginning in Q1 2010, TRIP Revenues and OP were consolidated with the Leasing Group Operations Car Sales OP % Column 4 Column 5 Column 6 Column 7 Column 8 Column 9 Column 10 Column 11 Column 12 Column 13 Column 14 Column 15 Column 16 2002 114.7 31.3 0.273 2003 153.8 41 0.267 2004 181 42 0.232 2005 47.4 8.4 0.274 2006 83.2 23.3 0.351 2007 112 49.2 0.2552 2008 124.2 34.7 0.297 2009 128.5 20.5 0.284 LTM 6/10 156.1 2.4 0.387 |
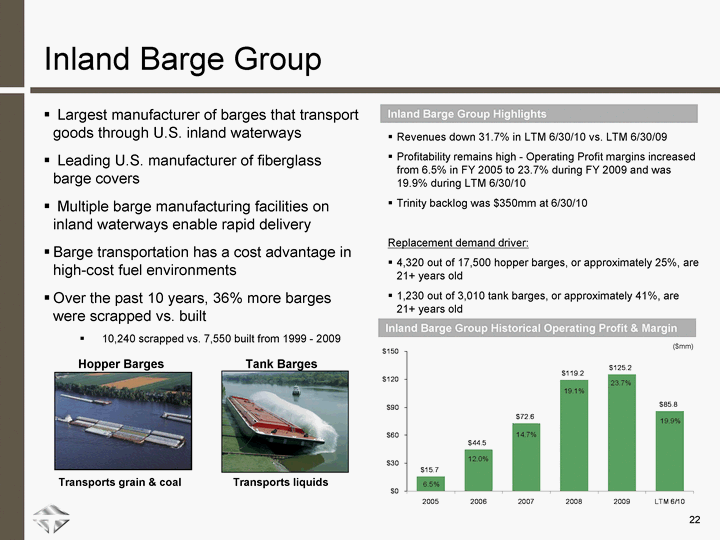
| 22 Revenue Operating profit Column 3 Column 4 Column 5 Column 6 Column 7 Column 8 Column 9 Column 10 Column 11 Column 12 Column 13 Column 14 Column 15 Column 16 2002 211.7 4.7 0.0222 2003 170.6 -4.7 -0.0275 2004 210.4 -14.8 -0.0703 2005 240.7 15.7 0.0652 2006 371.2 44.5 0.1199 2007 493.2 72.6 0.1472 2008 552.7 119.2 0.191 2009 125.2 0.237 LTM 6/10 85.8 0.199 Revenues down 31.7% in LTM 6/30/10 vs. LTM 6/30/09 Profitability remains high - Operating Profit margins increased from 6.5% in FY 2005 to 23.7% during FY 2009 and was 19.9% during LTM 6/30/10 Trinity backlog was $350mm at 6/30/10 Replacement demand driver: 4,320 out of 17,500 hopper barges, or approximately 25%, are 21+ years old 1,230 out of 3,010 tank barges, or approximately 41%, are 21+ years old Inland Barge Group Inland Barge Group Highlights Inland Barge Group Historical Operating Profit & Margin Tank Barges Hopper Barges Transports grain & coal Transports liquids ($mm) Largest manufacturer of barges that transport goods through U.S. inland waterways Leading U.S. manufacturer of fiberglass barge covers Multiple barge manufacturing facilities on inland waterways enable rapid delivery Barge transportation has a cost advantage in high-cost fuel environments Over the past 10 years, 36% more barges were scrapped vs. built 10,240 scrapped vs. 7,550 built from 1999 - 2009 |
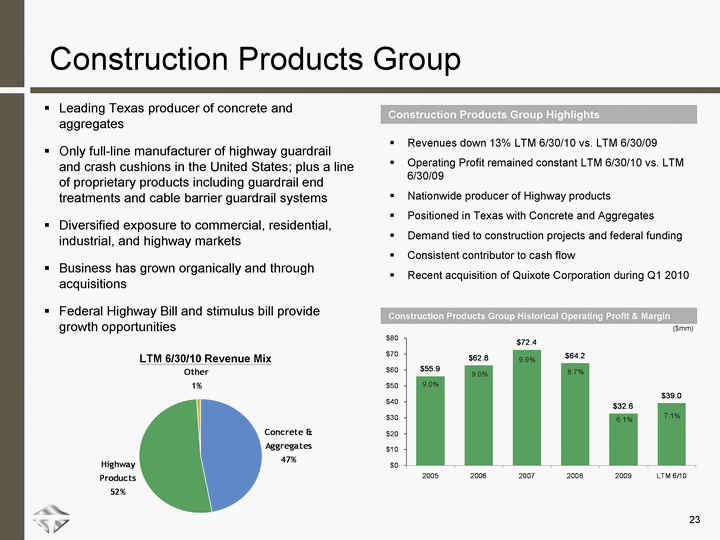
| 23 Revenues OP OP% Column 4 Column 5 Column 6 Column 7 Column 8 Column 9 Column 10 Column 11 Column 12 Column 13 Column 14 Column 15 Column 16 2002 463.9 44.8 0.097 2003 457.4 37.5 0.082 2004 535.5 35.1 0.066 2005 621.6 55.9 0.09 2006 695.3 62.8 0.09 2007 733 72.4 0.099 2008 761 64.2 0.087 2009 32.6 0.061 LTM 6/10 39 0.071 Revenues down 13% LTM 6/30/10 vs. LTM 6/30/09 Operating Profit remained constant LTM 6/30/10 vs. LTM 6/30/09 Nationwide producer of Highway products Positioned in Texas with Concrete and Aggregates Demand tied to construction projects and federal funding Consistent contributor to cash flow Recent acquisition of Quixote Corporation during Q1 2010 Construction Products Group Leading Texas producer of concrete and aggregates Only full-line manufacturer of highway guardrail and crash cushions in the United States; plus a line of proprietary products including guardrail end treatments and cable barrier guardrail systems Diversified exposure to commercial, residential, industrial, and highway markets Business has grown organically and through acquisitions Federal Highway Bill and stimulus bill provide growth opportunities Construction Products Group Highlights Construction Products Group Historical Operating Profit & Margin Concrete & Aggregates 47 Highway Products 52 Other 1 All other Slice 7 Slice 8 Slice 9 Slice 10 Slice 11 Slice 12 Slice 13 Slice 14 Slice 15 Slice 16 LTM 6/30/10 Revenue Mix ($mm) |
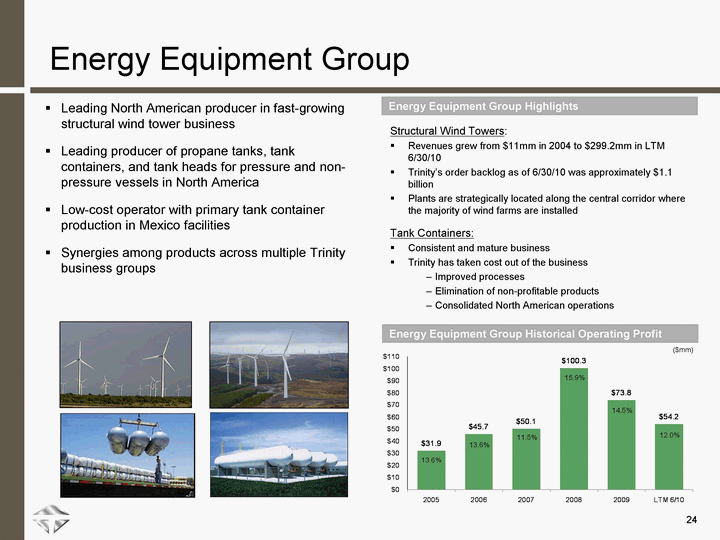
| 24 Revenue OP OP% Column 5 Column 6 Column 7 Column 8 Column 9 Column 10 Column 11 Column 12 Column 13 Column 14 Column 15 Column 16 2002 149.4 0.6 0.004 2003 124.3 10.9 0.088 2004 152.1 15.3 0.101 2005 234.8 31.9 0.136 2006 336.5 45.7 0.136 2007 433.9 50.1 0.115 2008 530 100.3 0.159 2009 73.8 0.145 LTM 6/10 54.2 0.12 Structural Wind Towers: Revenues grew from $11mm in 2004 to $299.2mm in LTM 6/30/10 Trinity's order backlog as of 6/30/10 was approximately $1.1 billion Plants are strategically located along the central corridor where the majority of wind farms are installed Tank Containers: Consistent and mature business Trinity has taken cost out of the business Improved processes Elimination of non-profitable products Consolidated North American operations Energy Equipment Group Leading North American producer in fast-growing structural wind tower business Leading producer of propane tanks, tank containers, and tank heads for pressure and non- pressure vessels in North America Low-cost operator with primary tank container production in Mexico facilities Synergies among products across multiple Trinity business groups Energy Equipment Group Highlights Energy Equipment Group Historical Operating Profit Energy Equipment Group Historical Operating Profit ($mm) |
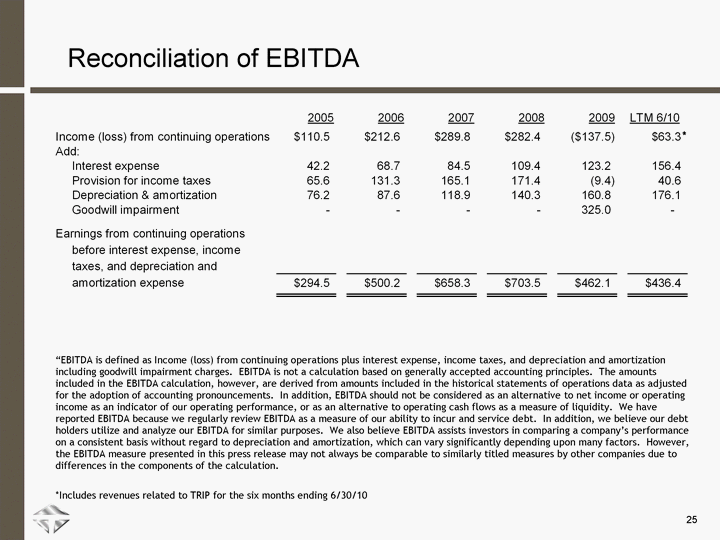
| Reconciliation of EBITDA "EBITDA is defined as Income (loss) from continuing operations plus interest expense, income taxes, and depreciation and amortization including goodwill impairment charges. EBITDA is not a calculation based on generally accepted accounting principles. The amounts included in the EBITDA calculation, however, are derived from amounts included in the historical statements of operations data as adjusted for the adoption of accounting pronouncements. In addition, EBITDA should not be considered as an alternative to net income or operating income as an indicator of our operating performance, or as an alternative to operating cash flows as a measure of liquidity. We have reported EBITDA because we regularly review EBITDA as a measure of our ability to incur and service debt. In addition, we believe our debt holders utilize and analyze our EBITDA for similar purposes. We also believe EBITDA assists investors in comparing a company's performance on a consistent basis without regard to depreciation and amortization, which can vary significantly depending upon many factors. However, the EBITDA measure presented in this press release may not always be comparable to similarly titled measures by other companies due to differences in the components of the calculation. *Includes revenues related to TRIP for the six months ending 6/30/10 25 * |