Attached files
| file | filename |
|---|---|
| 8-K - FORM 8-K - GLG Partners, Inc. | y86018e8vk.htm |
| EX-99.1 - EX-99.1 - GLG Partners, Inc. | y86018exv99w1.htm |
Exhibit 99.2
| GLG Partners, Inc. SECOND QUARTER 2010 UPDATE August 9, 2010 Exhibit 99.2 |
| FORWARD-LOOKING STATEMENTS This presentation contains statements relating to future results (including certain projections and business trends) of GLG Partners, Inc. ("GLG") that are forward-looking statements. Actual results may differ materially from those projected as a result of certain risks and uncertainties. These risks and uncertainties include, but are not limited to: the volatility in the financial markets; GLG's financial performance; market conditions for the investment funds and accounts GLG manages ("GLG Funds"); performance of GLG Funds, the related performance fees and the associated impacts on revenues, net income, cash flows and fund inflows/outflows; the impact of net inflows on GLG's mix of assets under management and the associated impacts on revenues; the cost of retaining GLG's key investment and other personnel or the loss of such key personnel; risks associated with the expansion of GLG's business in size and geographically; operational risk, including counterparty risk; satisfaction of the conditions of the pending acquisition transaction with Man Group plc, including the approval of a majority of unaffiliated stockholders; the costs and expenses associated with the pending acquisition transaction; contractual restrictions on the conduct of GLG's business included in the merger agreement; the potential loss of key personnel, disruption of its business and operations or any impact on GLG's relationships with third parties as a result of the pending acquisition transaction; any delay in consummating the proposed acquisition transaction or the failure to consummate the transaction; and the outcome of, or expenses associated with, any litigation which may arise in connection with the pending acquisition transaction, including the purported class action civil suits filed in Delaware Chancery Court and New York Supreme Court; litigation and regulatory enforcement risks, including the diversion of management time and attention and the additional costs and demands on GLG's resources; risks associated with the use of leverage, investment in derivatives, availability of credit, interest rates and currency fluctuations, as well as other risks and uncertainties, including those set forth in GLG's filings with the Securities and Exchange Commission. These forward-looking statements are made only as of the date hereof, and GLG undertakes no obligation to update or revise the forward-looking statements, whether as a result of new information, future events or otherwise, except as required by law. Nothing in this presentation should be construed as or is intended to be a solicitation for or an offer to provide investment advisory services. This presentation shall not constitute an offer to sell or the solicitation of an offer to buy any securities, nor shall there be any offer or sale of securities in any jurisdiction in which such offer, solicitation or sale would be unlawful. Available Information GLG maintains an Investor Relations website at www.glgpartners.com and routinely posts important information on its website for investors. GLG uses its website as a means of disclosing material non-public information and for complying with its disclosure obligations under Regulation FD promulgated by the SEC. These disclosures will be included on GLG's website under the section "Investor Relations ^ Overview". Accordingly, investors should monitor this portion of GLG's website, in addition to following its press releases, SEC filings and public conference calls and webcasts. |
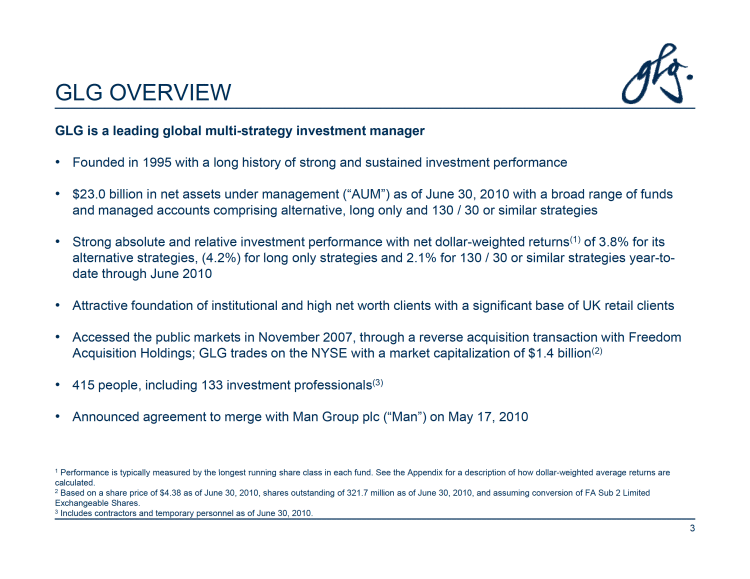
| GLG OVERVIEW GLG is a leading global multi-strategy investment manager • Founded in 1995 with a long history of strong and sustained investment performance • $23.0 billion in net assets under management (“AUM”) as of June 30, 2010 with a broad range of funds and managed accounts comprising alternative, long only and 130 / 30 or similar strategies • Strong absolute and relative investment performance with net dollar-weighted returns(1) of 3.8% for its alternative strategies, (4.2%) for long only strategies and 2.1% for 130 / 30 or similar strategies year-to-date through June 2010 • Attractive foundation of institutional and high net worth clients with a significant base of UK retail clients • Accessed the public markets in November 2007, through a reverse acquisition transaction with Freedom Acquisition Holdings; GLG trades on the NYSE with a market capitalization of $1.4 billion(2) • 415 people, including 133 investment professionals(3) • Announced agreement to merge with Man Group plc (“Man”) on May 17, 2010 1 Performance is typically measured by the longest running share class in each fund. See the Appendix for a description of how dollar-weighted average returns are calculated. 2 Based on a share price of $4.38 as of June 30, 2010, shares outstanding of 321.7 million as of June 30, 2010, and assuming conversion of FA Sub 2 Limited Exchangeable Shares. 3 Includes contractors and temporary personnel as of June 30, 2010. 3 |
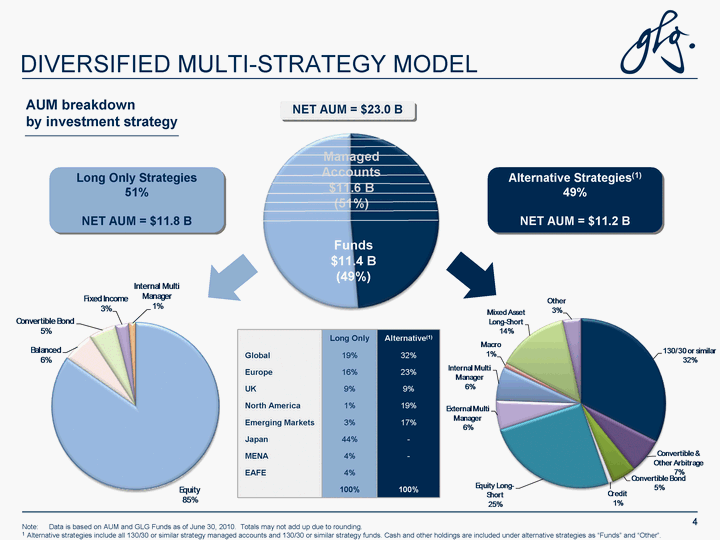
| DIVERSIFIED MULTI-STRATEGY MODEL AUM breakdown by investment strategy Managed Accounts $11.6 B (51%) Note: Data is based on AUM and GLG Funds as of June 30, 2010. Totals may not add up due to rounding. 1 Alternative strategies include all 130/30 or similar strategy managed accounts and 130/30 or similar strategy funds. Cash and other holdings are included under alternative strategies as "Funds" and "Other". Long Only Alternative(1) Global 19% 32% Europe 16% 23% UK 9% 9% North America 1% 19% Emerging Markets 3% 17% Japan 44% - MENA 4% - EAFE 4% 100% 100% 4 Funds $11.4 B (49%) Long Only Strategies 51% NET AUM = $11.8 B NET AUM = $23.0 B Alternative Strategies(1) 49% NET AUM = $11.2 B |
| DIFFERENTIATED INVESTMENT APPROACH AND INFRASTRUCTURE Heavy emphasis on fundamental research, tactical trading and a vast network of top industry analysts. The scale of GLG drives significant access. Investment professionals work on large open research / trading floors. Investment strategies have dedicated investment and risk professionals. Culture, compensation and physical layout are designed to facilitate real time information flow and collaboration. Senior Management Advisory Group comprised of senior GLG professionals was created in October 2008 and advises the firm on strategic direction and the delivery of best of breed performance for its investors and operations. Risk and controls infrastructure is tailored at the fund level (limits for net and gross exposure, position concentrations, VAR), monitored by distinct risk managers and reviewed at the firm level by the Risk Committee, Head of Risk and Co-CEO Emmanuel Roman. Independent administrators and custodians, multiple prime brokers and first class customer statements complemented by regulatory oversight from the FSA and the SEC. 5 |
| ATTRACTIVE PLATFORM FOR WORLD CLASS INSTITUTIONS Superior client focus through dedicated client services team with direct access to the investment management and risk teams and customized, real time client reporting Significant number of clients invested in multiple GLG funds Significant portion of AUM from long-standing clients: Significant number of high net worth private client AUM dates back to near inception of GLG Material institutional clients were introduced when first funds were launched in 1997 6 |
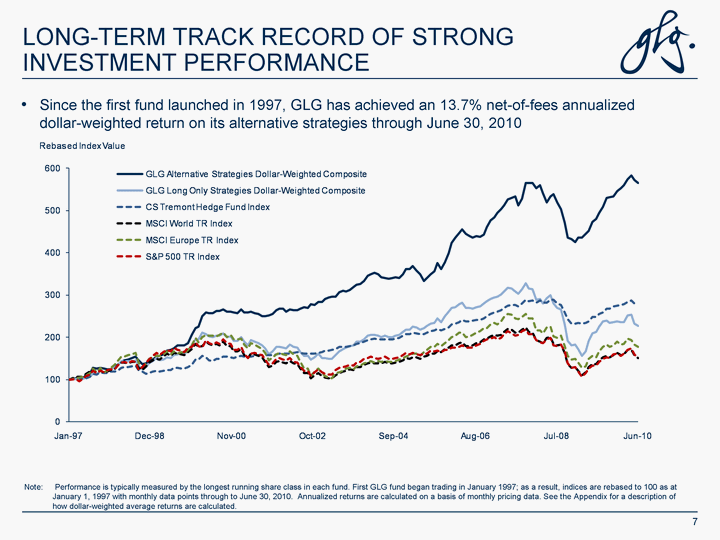
| LONG-TERM TRACK RECORD OF STRONG INVESTMENT PERFORMANCE Since the first fund launched in 1997, GLG has achieved an 13.7% net-of-fees annualized dollar-weighted return on its alternative strategies through June 30, 2010 7 Note: Performance is typically measured by the longest running share class in each fund. First GLG fund began trading in January 1997; as a result, indices are rebased to 100 as at January 1, 1997 with monthly data points through to June 30, 2010. Annualized returns are calculated on a basis of monthly pricing data. See the Appendix for a description of how dollar-weighted average returns are calculated. |
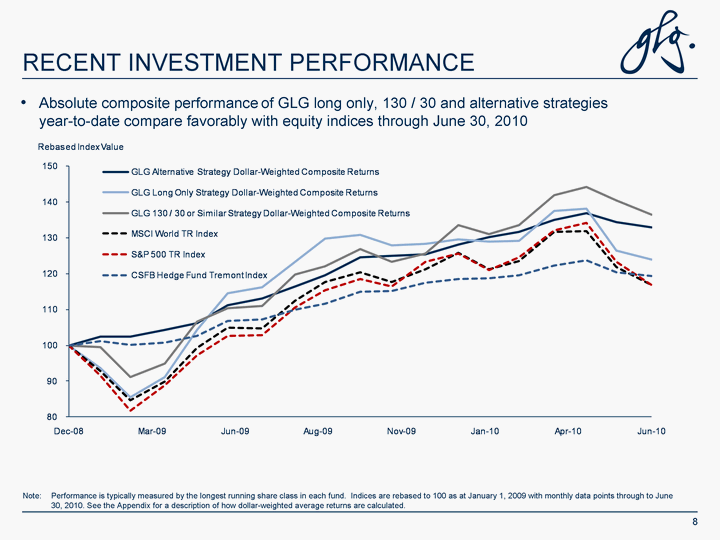
| RECENT INVESTMENT PERFORMANCE Absolute composite performance of GLG long only, 130 / 30 and alternative strategies year-to-date compare favorably with equity indices through June 30, 2010 8 Note: Performance is typically measured by the longest running share class in each fund. Indices are rebased to 100 as at January 1, 2009 with monthly data points through to June 30, 2010. See the Appendix for a description of how dollar-weighted average returns are calculated. |
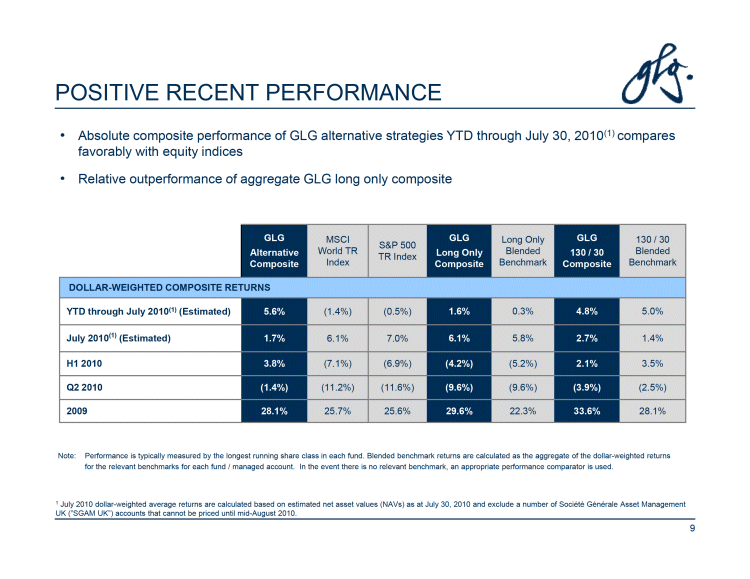
| POSITIVE RECENT PERFORMANCE • Absolute composite performance of GLG alternative strategies YTD through July 30, 2010(1) compares favorably with equity indices • Relative outperformance of aggregate GLG long only composite GLG MSCI GLG Long Only GLG 130 / 30 S&P 500 Alternative World TR Long Only Blended 130 / 30 Blended TR Index Composite Index Composite Benchmark Composite Benchmark DOLLAR-WEIGHTED COMPOSITE RETURNS YTD through July 2010(1) (Estimated) 5.6% (1.4%) (0.5%) 1.6% 0.3% 4.8% 5.0% July 2010(1) (Estimated) 1.7% 6.1% 7.0% 6.1% 5.8% 2.7% 1.4% H1 2010 3.8% (7.1%) (6.9%) (4.2%) (5.2%) 2.1% 3.5% Q2 2010 (1.4%) (11.2%) (11.6%) (9.6%) (9.6%) (3.9%) (2.5%) 2009 28.1% 25.7% 25.6% 29.6% 22.3% 33.6% 28.1% Note: Performance is typically measured by the longest running share class in each fund. Blended benchmark returns are calculated as the aggregate of the dollar-weighted returns for the relevant benchmarks for each fund / managed account. In the event there is no relevant benchmark, an appropriate performance comparator is used. 1 July 2010 dollar-weighted average returns are calculated based on estimated net asset values (NAVs) as at July 30, 2010 and exclude a number of Société Générale Asset Management UK (”SGAM UK”) accounts that cannot be priced until mid-August 2010. 9 |
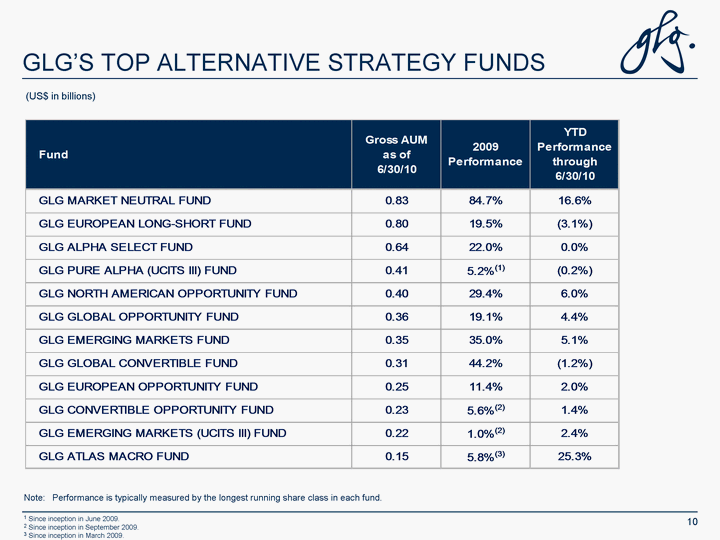
| GLG'S TOP ALTERNATIVE STRATEGY FUNDS Note: Performance is typically measured by the longest running share class in each fund. 1 Since inception in June 2009. 2 Since inception in September 2009. 3 Since inception in March 2009. 10 (US$ in billions) |
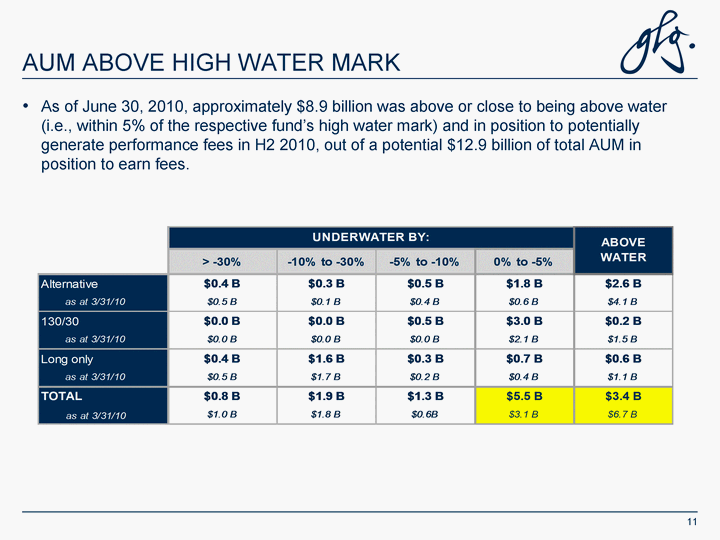
| AUM ABOVE HIGH WATER MARK As of June 30, 2010, approximately $8.9 billion was above or close to being above water (i.e., within 5% of the respective fund's high water mark) and in position to potentially generate performance fees in H2 2010, out of a potential $12.9 billion of total AUM in position to earn fees. 11 |
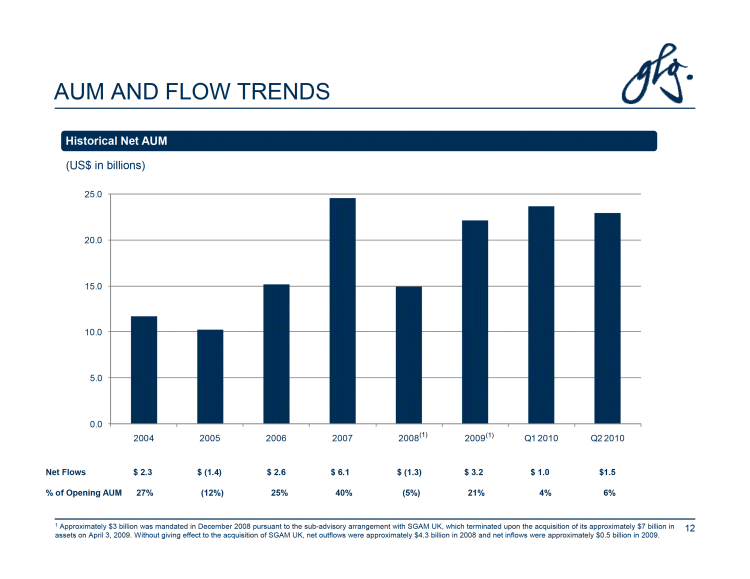
| AUM AND FLOW TRENDS Historical Net AUM (US$ in billions) 25.0 20.0 15.0 10.0 5.0 0.0 2004 2005 2006 2007 2008(1) 2009(1) Q1 2010 Q2 2010 Net Flows $2.3 $ (1.4) $2.6 $6.1 $ (1.3) $3.2 $1.0 $1.5% of Opening AUM 27% (12%) 25% 40% (5%) 21% 4% 6% 1 Approximately $3 billion was mandated in December 2008 pursuant to the sub-advisory arrangement with SGAM UK, which terminated upon the acquisition of its approximately $7 billion in 12 assets on April 3, 2009. Without giving effect to the acquisition of SGAM UK, net outflows were approximately $4.3 billion in 2008 and net inflows were approximately $0.5 billion in 2009. |
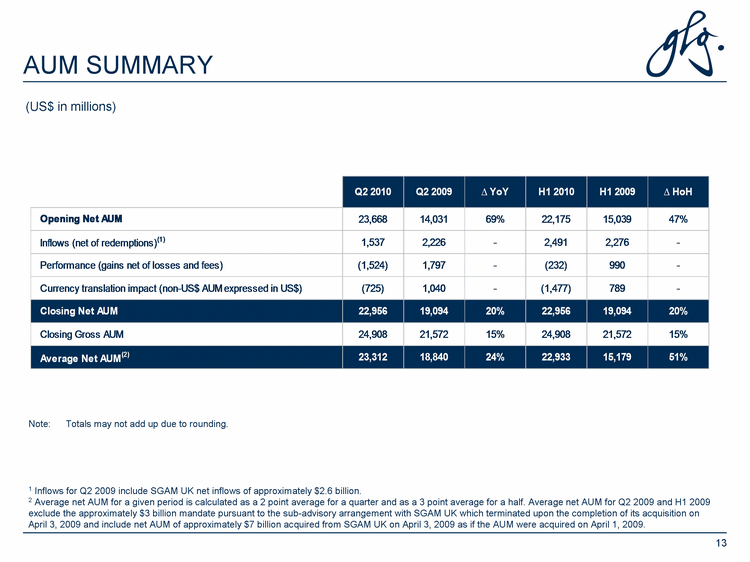
| AUM SUMMARY Note: Totals may not add up due to rounding. 1 Inflows for Q2 2009 include SGAM UK net inflows of approximately $2.6 billion. 2 Average net AUM for a given period is calculated as a 2 point average for a quarter and as a 3 point average for a half. Average net AUM for Q2 2009 and H1 2009 exclude the approximately $3 billion mandate pursuant to the sub-advisory arrangement with SGAM UK which terminated upon the completion of its acquisition on April 3, 2009 and include net AUM of approximately $7 billion acquired from SGAM UK on April 3, 2009 as if the AUM were acquired on April 1, 2009. 13 (US$ in millions) |

| COMPOSITION OF ASSETS UNDER MANAGEMENT 14 Note: Totals may not add up due to rounding. 1 Alternative strategy gross AUM includes all alternative strategy funds, all 130/30 strategy funds, all managed accounts managed in accordance with alternative and 130/30 strategies, and cash and other holdings. 2 Long only strategy gross AUM includes all long only funds and managed accounts managed in accordance with a long only strategy. 3 Quarterly average net AUM for a given period is calculated as a 2 point (quarter open and close) average. Q2 2009 average net AUM excludes the approximately $3 billion of AUM mandated in December 2008 pursuant to a sub-advisory arrangement with SGAM UK which terminated upon the acquisition of SGAM UK on April 3, 2009 and includes net AUM of approximately $7 billion acquired with SGAM UK on April 3, 2009 as if the AUM were acquired on April 1, 2009. 4 Inflows for Q2 2009 include SGAM UK net inflows of approximately $2.6 billion. |
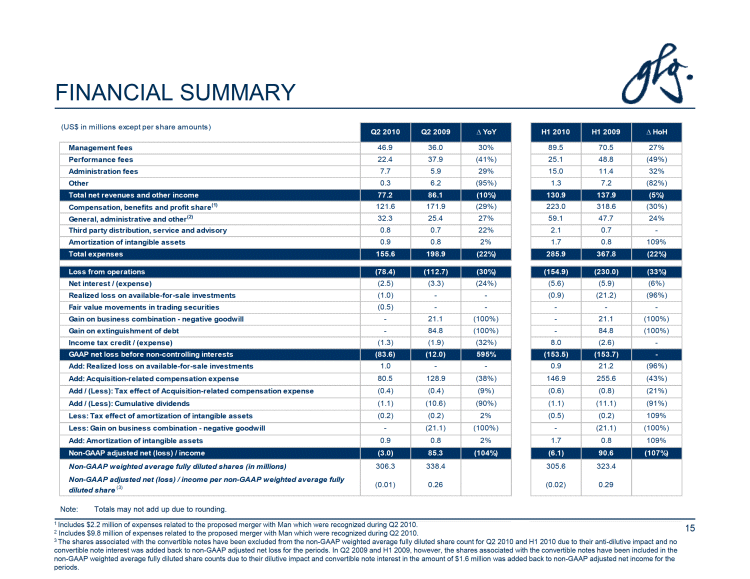
| FINANCIAL SUMMARY (US$ in millions except per share amounts) Q2 2010 Q2 2009 YoY H1 2010 H1 2009 HoH Management fees 46.9 36.0 30% 89.5 70.5 27% Performance fees 22.4 37.9 (41%) 25.1 48.8 (49%) Administration fees 7.7 5.9 29% 15.0 11.4 32% Other 0.3 6.2 (95%) 1.3 7.2 (82%) Total net revenues and other income 77.2 86.1 (10%) 130.9 137.9 (5%) Compensation, benefits and profit share(1) 121.6 171.9 (29%) 223.0 318.6 (30%) General, administrative and other(2) 32.3 25.4 27% 59.1 47.7 24% Third party distribution, service and advisory 0.8 0.7 22% 2.1 0.7 -Amortization of intangible assets 0.9 0.8 2% 1.7 0.8 109% Total expenses 155.6 198.9 (22%) 285.9 367.8 (22%) Loss from operations (78.4) (112.7) (30%) (154.9) (230.0) (33%) Net interest / (expense) (2.5) (3.3) (24%) (5.6) (5.9) (6%) Realized loss on available-for-sale investments (1.0) — - (0.9) (21.2) (96%) Fair value movements in trading securities (0.5) — - — - -Gain on business combination — negative goodwill — 21.1 (100%) — 21.1 (100%) Gain on extinguishment of debt — 84.8 (100%) — 84.8 (100%) Income tax credit / (expense) (1.3) (1.9) (32%) 8.0 (2.6) -GAAP net loss before non-controlling interests (83.6) (12.0) 595% (153.5) (153.7) -Add: Realized loss on available-for-sale investments 1.0 — - 0.9 21.2 (96%) Add: Acquisition-related compensation expense 80.5 128.9 (38%) 146.9 255.6 (43%) Add / (Less): Tax effect of Acquisition-related compensation expense (0.4) (0.4) (9%) (0.6) (0.8) (21%) Add / (Less): Cumulative dividends (1.1) (10.6) (90%) (1.1) (11.1) (91%) Less: Tax effect of amortization of intangible assets (0.2) (0.2) 2% (0.5) (0.2) 109% Less: Gain on business combination — negative goodwill — (21.1) (100%) — (21.1) (100%) Add: Amortization of intangible assets 0.9 0.8 2% 1.7 0.8 109% Non-GAAP adjusted net (loss) / income (3.0) 85.3 (104%) (6.1) 90.6 (107%) Non-GAAP weighted average fully diluted shares (in millions) 306.3 338.4 305.6 323.4 Non-GAAP adjusted net (loss) / income per non-GAAP weighted average fully (0.01) 0.26 (0.02) 0.29 diluted share (3) Note: Totals may not add up due to rounding. 1 Includes $2.2 million of expenses related to the proposed merger with Man which were recognized during Q2 2010. 2 Includes $9.8 million of expenses related to the proposed merger with Man which were recognized during Q2 2010. 15 3 The shares associated with the convertible notes have been excluded from the non-GAAP weighted average fully diluted share count for Q2 2010 and H1 2010 due to their anti-dilutive impact and no convertible note interest was added back to non-GAAP adjusted net loss for the periods. In Q2 2009 and H1 2009, however, the shares associated with the convertible notes have been included in the non-GAAP weighted average fully diluted share counts due to their dilutive impact and convertible note interest in the amount of $1.6 million was added back to non-GAAP adjusted net income for the periods. |
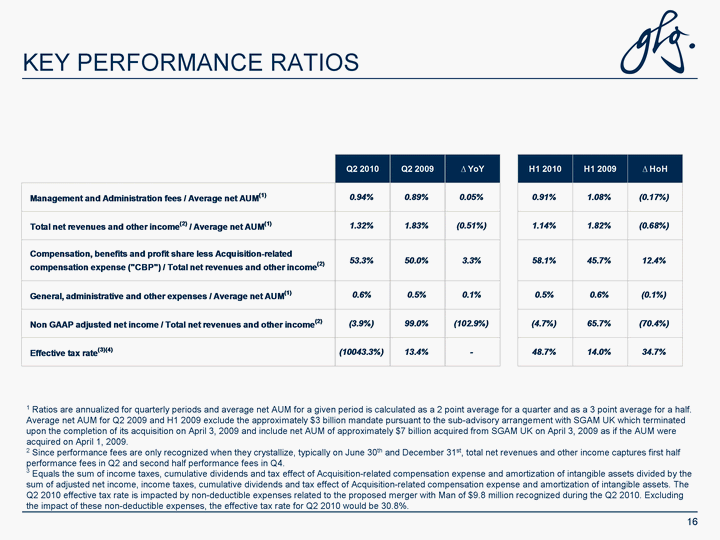
| KEY PERFORMANCE RATIOS 1 Ratios are annualized for quarterly periods and average net AUM for a given period is calculated as a 2 point average for a quarter and as a 3 point average for a half. Average net AUM for Q2 2009 and H1 2009 exclude the approximately $3 billion mandate pursuant to the sub-advisory arrangement with SGAM UK which terminated upon the completion of its acquisition on April 3, 2009 and include net AUM of approximately $7 billion acquired from SGAM UK on April 3, 2009 as if the AUM were acquired on April 1, 2009. 2 Since performance fees are only recognized when they crystallize, typically on June 30th and December 31st, total net revenues and other income captures first half performance fees in Q2 and second half performance fees in Q4. 3 Equals the sum of income taxes, cumulative dividends and tax effect of Acquisition-related compensation expense and amortization of intangible assets divided by the sum of adjusted net income, income taxes, cumulative dividends and tax effect of Acquisition-related compensation expense and amortization of intangible assets. The Q2 2010 effective tax rate is impacted by non-deductible expenses related to the proposed merger with Man of $9.8 million recognized during the Q2 2010. Excluding the impact of these non-deductible expenses, the effective tax rate for Q2 2010 would be 30.8%. 16 |
| CONCLUSION GLG is an attractive investment opportunity Leading investment manager Diversified multi-strategy business model Long-term track record of strong and sustained investment performance Rigorous risk management and controls Differentiated investment approach and dedicated investment professionals Attractive platform for world class institutions Committed to take advantage of attractive growth opportunities Prudent acquisition strategy Management depth, experience and commitment 17 |
| APPENDIX |
| HISTORY OF GLG GLG was founded by Noam Gottesman, Pierre Lagrange and Jonathan Green in 1995 as a division of Lehman Brothers Founders had worked together at Goldman Sachs Private Client Services since late 1980s GLG began to offer funds in early 1997 Became an independent business in 2000, with Lehman Brothers initially holding a 20% minority interest (currently 11%) Since 2000, GLG has made considerable investments developing a cohesive investment management team and robust platform GLG accessed the public markets through a reverse acquisition transaction with Freedom in November 2007 GLG acquired Societe Generale Asset Management UK, a UK-based long-only asset manager, in April 2009 19 |
| GLG alternative strategy dollar-weighted average returns are calculated as the composite performance of the alternative strategy funds listed below and funds that have closed, in addition to managed accounts managed in accordance with alternative strategies, weighted by the sum of month-end AUM and net inflows on the subsequent dealing day: For the month of July 2010, dollar-weighted average returns are based on estimated month-end NAVs of the funds listed above as at July 30, 2010. AUMs are estimated as at August 2, 2010. ALTERNATIVE STRATEGY DOLLAR-WEIGHTED AVERAGE RETURNS 20 |
| LONG ONLY STRATEGY DOLLAR-WEIGHTED AVERAGE RETURNS 21 GLG long only strategy dollar-weighted average returns are calculated as the composite performance of the long only strategy funds listed below and funds that have closed, in addition to managed accounts managed in accordance with a long only strategy (except those over which GLG does not exercise full control), weighted by the sum of month-end AUM and net inflows on the subsequent dealing day: For the month of July 2010, dollar-weighted average returns are based on final and estimated month- end NAVs of the funds listed above as at July 30, 2010. AUMs are estimated as at August 2, 2010. * Funds managed by a SGAM entity and sub-advised by GLG. |
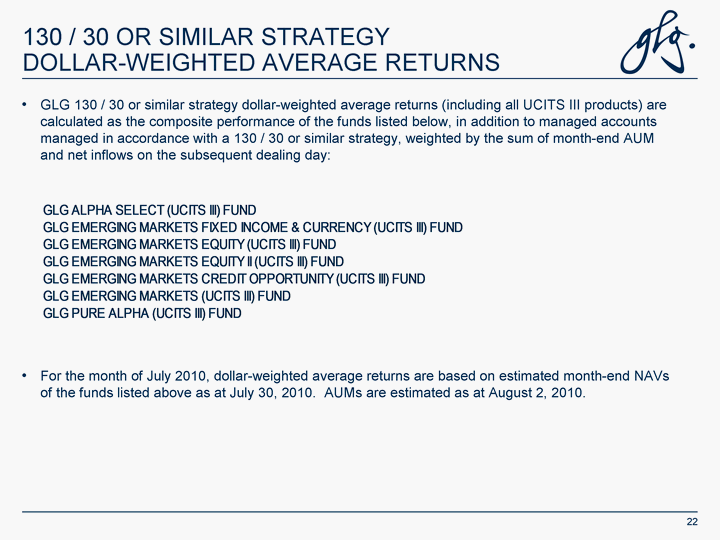
| GLG 130 / 30 or similar strategy dollar-weighted average returns (including all UCITS III products) are calculated as the composite performance of the funds listed below, in addition to managed accounts managed in accordance with a 130 / 30 or similar strategy, weighted by the sum of month-end AUM and net inflows on the subsequent dealing day: For the month of July 2010, dollar-weighted average returns are based on estimated month-end NAVs of the funds listed above as at July 30, 2010. AUMs are estimated as at August 2, 2010. 130 / 30 OR SIMILAR STRATEGY DOLLAR-WEIGHTED AVERAGE RETURNS 22 |
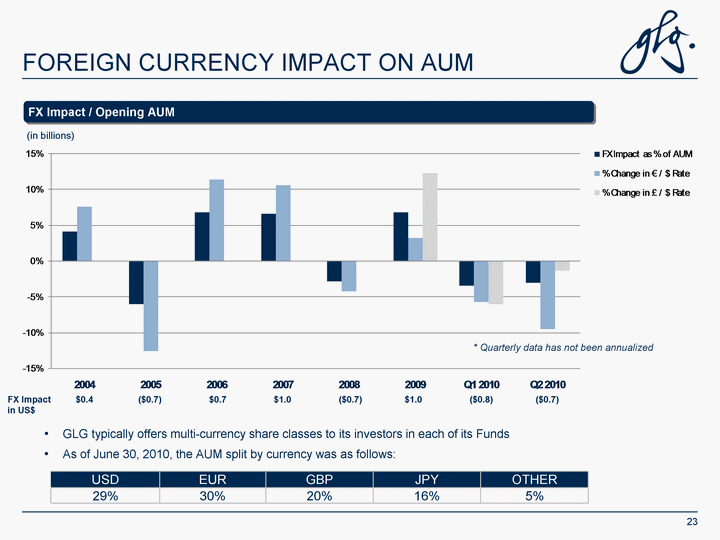
| FOREIGN CURRENCY IMPACT ON AUM GLG typically offers multi-currency share classes to its investors in each of its Funds As of June 30, 2010, the AUM split by currency was as follows: 23 * Quarterly data has not been annualized FX Impact / Opening AUM USD EUR GBP JPY OTHER 29% 30% 20% 16% 5% (in billions) FX Impact $0.4 ($0.7) $0.7 $1.0 ($0.7) $1.0 ($0.8) ($0.7) in US$ |
| TAXES • GLG expects its non-GAAP effective tax rate(1) (excluding one-time items) to be in the range of 20% to 25% over the next three years, but the “effective” tax rate will depend on a number of factors: • Jurisdictions in which GLG does business and the income taxes in those jurisdictions • Relative growth rates in earnings in the jurisdictions in which GLG does business • GLG’s low expected “effective” tax rate going forward is generally attributable to the income tax rates in the jurisdictions in which its entities do business; the type and relative amount of income earned by its entities in these jurisdictions; the timing and amount of repatriation of profits back to the United States in the form of dividends; and the asset basis step-up and associated 15-year goodwill amortization deduction for U.S. tax purposes (approximately $216 million per year) as a result of the reverse acquisition transaction. • Tax laws frequently change, sometimes with a retroactive effect. Until the legislation is finalized, it is often difficult to predict the impact of tax legislation on our financial results. No assurance can be given that tax law changes will not materially affect our financial position. GLG notes currently that: • The UK Government has announced that the main UK corporation tax rate will be reduced from 28% to 24% by April 1, 2014. • The UK legislation introducing a worldwide debt cap became law on July 21, 2009, effective January 1, 2010. This new legislation may restrict UK corporation tax deductions for financing costs based on the worldwide financing costs of the corporate group. • The U.S. Congress is considering changes to U.S. income tax laws which would increase the U.S. income tax rate imposed on “carried interest” earnings and would subject to U.S. corporate income tax certain publicly held private equity firms and hedge funds structured as partnerships (for U.S. federal income tax purposes). These changes would not apply to GLG because the company is already taxed in the United States as a U.S. corporation and earns fee income and does not receive a “carried interest”. • The Obama administration has made a number of proposals to change certain U.S. tax rules for U.S. corporations doing business outside the United States. The proposed changes would limit the ability of U.S. corporations to deduct expenses attributable to offshore earnings, modify the foreign tax credit rules and further restrict the ability of U.S. corporations to transfers fund between foreign subsidiaries without triggering U.S. income tax. The scope of these proposed changes, the form they will take if enacted, and their potential impact, is unclear. GLG is closely monitoring these proposals. 1 Effective tax rate is the sum of income taxes, cumulative dividends and tax effect of Acquisition-related compensation expense and amortization of intangible assets divided by the sum of adjusted net income, income taxes, cumulative dividends and tax effect of Acquisition- 24 related compensation expense and amortization of intangible assets. Cumulative dividends are distributions payable to the holders of exchangeable shares of FA Sub 2 Limited, a subsidiary of GLG Partners, Inc, in respect of our estimate of the net taxable income of FA Sub 2 Limited allocable to such holders multiplied by an assumed tax rate. The Q2 2010 effective tax rate is impacted by non-deductible expenses related to the proposed merger with Man of $9.8 million recognized during Q2 2010. Excluding the impact of these non-deductible expenses, the effective tax rate for Q2 2010 would be 30.8%. |
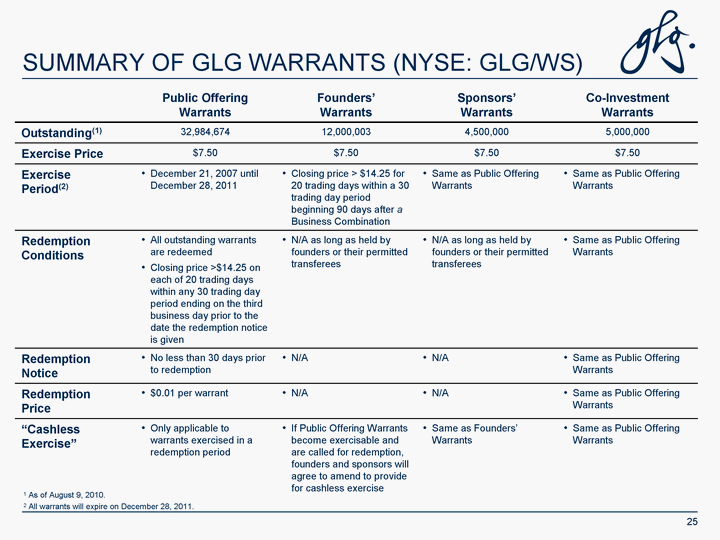
| SUMMARY OF GLG WARRANTS (NYSE: GLG/WS) Public Offering Warrants Founders' Warrants Sponsors' Warrants Co-Investment Warrants Outstanding(1) 32,984,674 12,000,003 4,500,000 5,000,000 Exercise Price $7.50 $7.50 $7.50 $7.50 Exercise Period(2) December 21, 2007 until December 28, 2011 Closing price > $14.25 for 20 trading days within a 30 trading day period beginning 90 days after a Business Combination Same as Public Offering Warrants Same as Public Offering Warrants Redemption Conditions All outstanding warrants are redeemed Closing price >$14.25 on each of 20 trading days within any 30 trading day period ending on the third business day prior to the date the redemption notice is given N/A as long as held by founders or their permitted transferees N/A as long as held by founders or their permitted transferees Same as Public Offering Warrants Redemption Notice No less than 30 days prior to redemption N/A N/A Same as Public Offering Warrants Redemption Price $0.01 per warrant N/A N/A Same as Public Offering Warrants "Cashless Exercise" Only applicable to warrants exercised in a redemption period If Public Offering Warrants become exercisable and are called for redemption, founders and sponsors will agree to amend to provide for cashless exercise Same as Founders' Warrants Same as Public Offering Warrants 25 1 As of August 9, 2010. 2 All warrants will expire on December 28, 2011. |
| SHARE / WARRANT REPURCHASE PROGRAM As of June 30, 2010, there were 262.8 million common shares, 58.9 million FA Sub 2 Limited Exchangeable Shares, convertible notes convertible into 61.4 million common shares, and 54.5 million warrants outstanding (251.1 million common shares, 58.9 million Exchangeable Shares, convertible notes convertible into 61.4 million common shares and 54.5 million warrants, respectively, at March 31, 2010 and 250.3 million common shares, 58.9 million Exchangeable Shares, convertible notes convertible into 61.4 million common shares and 54.5 million warrants, respectively, at June 30, 2009). Approximately 40,000 shares were repurchased and no warrants were repurchased or exercised during the second quarter of 2010. Since the inception of GLG's repurchase program in November 2007, GLG has repurchased a total of 14.3 million warrants for $82.9 million and 31.3 million shares for $76.9 million and 5.5 million warrants have been exercised at $7.50 per share for aggregate proceeds of $41.4 million. 26 |
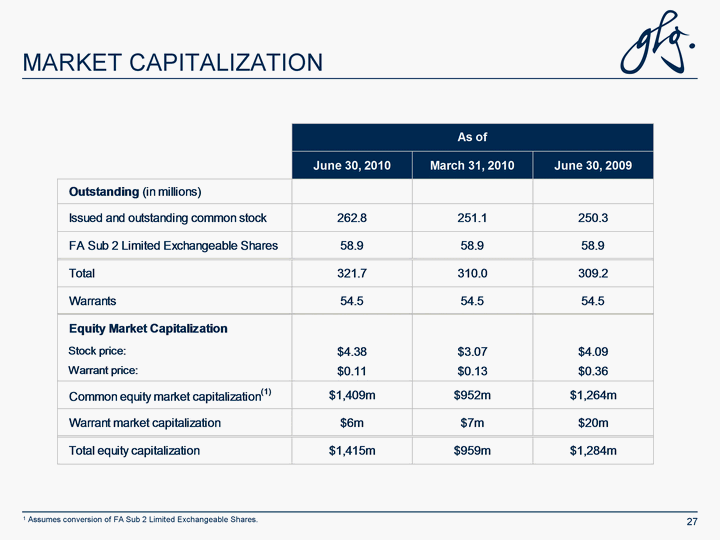
| MARKET CAPITALIZATION 1 Assumes conversion of FA Sub 2 Limited Exchangeable Shares. 27 |
| DESCRIPTION OF GROSS AND NET ASSETS UNDER MANAGEMENT GLG's funds make use of fund-in-fund reinvestment in the following ways: GLG's internal fund of fund ("FoF") products invest substantially all of their assets in GLG's single-manager alternative or long only strategy funds; GLG's external FoF products may invest a small proportion of their assets in other GLG external FoF products; GLG's single-manager alternative strategy funds may invest some proportion of their assets in other GLG single-manager alternative strategy funds; and GLG's long only strategy funds may invest some proportion of their assets in other GLG long only strategy funds. Gross AUM presentation includes assets invested from other GLG Funds Net AUM presentation is net of assets invested from other GLG Funds 28 |
| ACQUISITION-RELATED COMPENSATION EXPENSE Prior to the reverse acquisition transaction with Freedom in November 2007 ("the Acquisition"), GLG's compensation, benefits and profit share expense reflected compensation for employees and profit share for key personnel. Following the Acquisition, an additional set of charges referred to as Acquisition-related compensation expense, which were based on certain service conditions being met, was added to compensation, benefits and profit share expense in order to comply with GAAP. Acquisition-related compensation expense reflects the GAAP accounting for two primary items: 1) the Agreement Among Principals and Trustees: A retention-driven agreement that requires GLG's three principals and their related trusts to forfeit a formula-based percentage of their ownership interests in GLG to the remaining principals and their related trusts if one of them were to leave GLG during the five years following the Acquisition. 2) the broadening of key personnel and employee ownership in GLG: 15% of the total consideration paid for the GLG business in the Acquisition went to fully consolidated partnerships (Sage Summit LP and Lavender Heights Capital LP) (i.e., $150 million in cash and 33 million shares). The LPs of these entities are key personnel of GLG. Ten million shares issued in the Acquisition were allocated to awards for the benefit of employees, service providers and certain key personnel under the Restricted Stock Plan. Approximately 250,000 shares were allocated for the benefit of employees and certain key personnel under the 2007 Long-Term Incentive Plan at the closing of the Acquisition. 29 |

| THE AGREEMENT AMONG PRINCIPALS AND TRUSTEES The Agreement Among Principals and Trustees is a retention-driven agreement that requires GLG's three principals (Noam Gottesman, Pierre Lagrange and Emmanuel Roman) and their related trusts to forfeit a formula-based percentage of their ownership interests in GLG to the remaining principals and their related trusts if one of them were to leave GLG during the five years following the Acquisition. Although the principals and their related trusts have held their ownership interests since before the Acquisition and continue to own the shares in respect of the Acquisition, the agreement is accounted for under GAAP as if the principals gave all their interests back to GLG when the Acquisition took place in November 2007 and then earn the issued shares back (valued at the November 2, 2007 price of $13.70), subject to the following "vesting" schedule: 17.5% upon the consummation of the Acquisition, and 16.5% on each of the first through fifth anniversaries. The following schedule sets out the expenses for share amounts that have "vested" or will "vest" each year and are included in compensation, benefits and profit share expense: These expenses end in 2012(1) and are non-cash. Any forfeited shares will not return to nor benefit GLG. 30 1 Original vesting period lasting five years from November 2, 2007. |
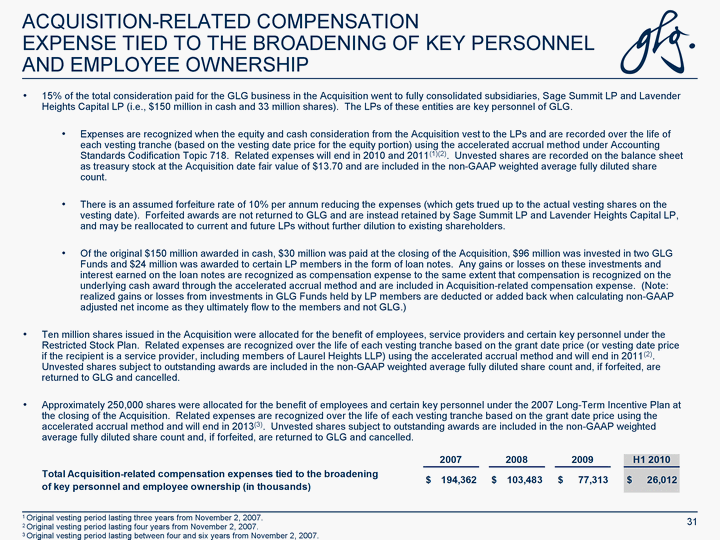
| 15% of the total consideration paid for the GLG business in the Acquisition went to fully consolidated subsidiaries, Sage Summit LP and Lavender Heights Capital LP (i.e., $150 million in cash and 33 million shares). The LPs of these entities are key personnel of GLG. Expenses are recognized when the equity and cash consideration from the Acquisition vest to the LPs and are recorded over the life of each vesting tranche (based on the vesting date price for the equity portion) using the accelerated accrual method under Accounting Standards Codification Topic 718. Related expenses will end in 2010 and 2011(1)(2). Unvested shares are recorded on the balance sheet as treasury stock at the Acquisition date fair value of $13.70 and are included in the non-GAAP weighted average fully diluted share count. There is an assumed forfeiture rate of 10% per annum reducing the expenses (which gets trued up to the actual vesting shares on the vesting date). Forfeited awards are not returned to GLG and are instead retained by Sage Summit LP and Lavender Heights Capital LP, and may be reallocated to current and future LPs without further dilution to existing shareholders. Of the original $150 million awarded in cash, $30 million was paid at the closing of the Acquisition, $96 million was invested in two GLG Funds and $24 million was awarded to certain LP members in the form of loan notes. Any gains or losses on these investments and interest earned on the loan notes are recognized as compensation expense to the same extent that compensation is recognized on the underlying cash award through the accelerated accrual method and are included in Acquisition-related compensation expense. (Note: realized gains or losses from investments in GLG Funds held by LP members are deducted or added back when calculating non-GAAP adjusted net income as they ultimately flow to the members and not GLG.) Ten million shares issued in the Acquisition were allocated for the benefit of employees, service providers and certain key personnel under the Restricted Stock Plan. Related expenses are recognized over the life of each vesting tranche based on the grant date price (or vesting date price if the recipient is a service provider, including members of Laurel Heights LLP) using the accelerated accrual method and will end in 2011(2). Unvested shares subject to outstanding awards are included in the non-GAAP weighted average fully diluted share count and, if forfeited, are returned to GLG and cancelled. Approximately 250,000 shares were allocated for the benefit of employees and certain key personnel under the 2007 Long-Term Incentive Plan at the closing of the Acquisition. Related expenses are recognized over the life of each vesting tranche based on the grant date price using the accelerated accrual method and will end in 2013(3). Unvested shares subject to outstanding awards are included in the non-GAAP weighted average fully diluted share count and, if forfeited, are returned to GLG and cancelled. ACQUISITION-RELATED COMPENSATION EXPENSE TIED TO THE BROADENING OF KEY PERSONNEL AND EMPLOYEE OWNERSHIP 1 Original vesting period lasting three years from November 2, 2007. 2 Original vesting period lasting four years from November 2, 2007. 3 Original vesting period lasting between four and six years from November 2, 2007. 31 |
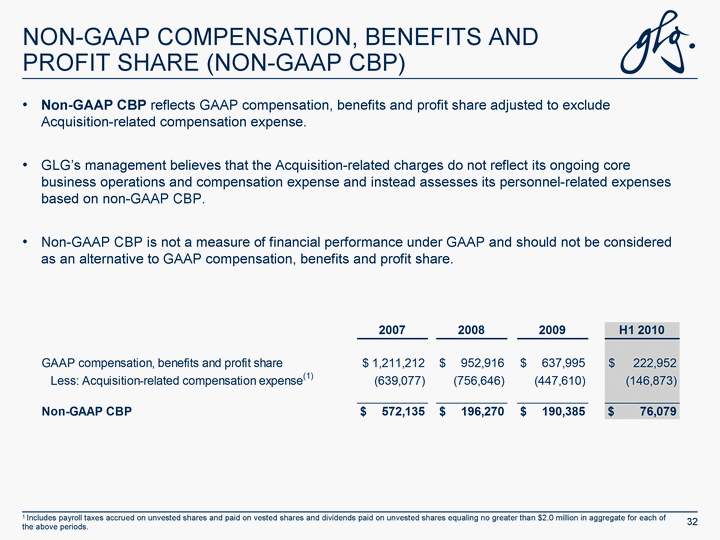
| NON-GAAP COMPENSATION, BENEFITS AND PROFIT SHARE (NON-GAAP CBP) Non-GAAP CBP reflects GAAP compensation, benefits and profit share adjusted to exclude Acquisition-related compensation expense. GLG's management believes that the Acquisition-related charges do not reflect its ongoing core business operations and compensation expense and instead assesses its personnel-related expenses based on non-GAAP CBP. Non-GAAP CBP is not a measure of financial performance under GAAP and should not be considered as an alternative to GAAP compensation, benefits and profit share. 32 1 Includes payroll taxes accrued on unvested shares and paid on vested shares and dividends paid on unvested shares equaling no greater than $2.0 million in aggregate for each of the above periods. |
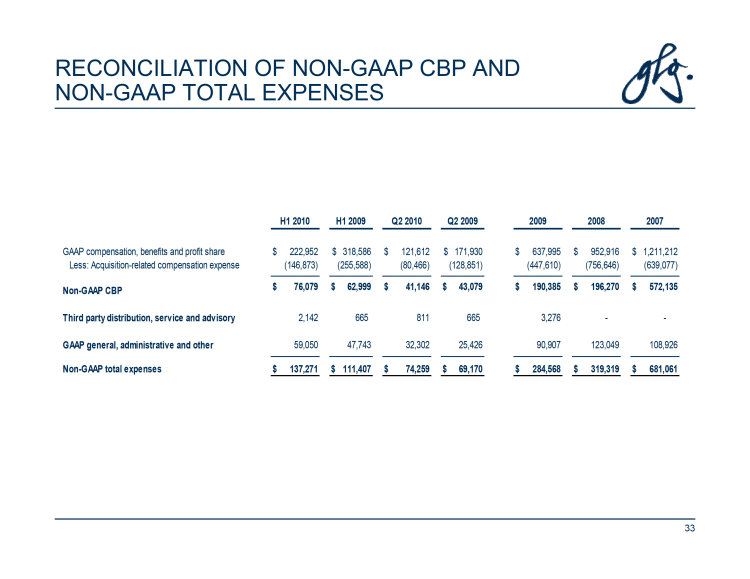
| RECONCILIATION OF NON-GAAP CBP AND NON-GAAP TOTAL EXPENSES H1 2010 H1 2009 Q2 2010 Q2 2009 2009 2008 2007 GAAP compensation, benefits and profit share $222,952 $318,586 $121,612 $171,930 $ 637,995 $952,916 $1,211,212 Less: Acquisition-related compensation expense (146,873) (255,588) (80,466) (128,851) (447,610) (756,646) (639,077) Non-GAAP CBP $76,079 $62,999 $41,146 $ 43,079 $190,385 $196,270 $572,135 Third party distribution, service and advisory 2,142 665 811 665 3,276 — -GAAP general, administrative and other 59,050 47,743 32,302 25,426 90,907 123,049 108,926 Non-GAAP total expenses $137,271 $111,407 $74,259 $69,170 $284,568 $319,319 $ 681,061 33 |

| ADJUSTED NET INCOME Non-GAAP Adjusted Net Income: GLG's management assesses the underlying performance of its business based on the measure "adjusted net income," which adjusts net loss before non-controlling interests for: (1) the Acquisition-related compensation expense; (2) to the extent that GLG records a tax benefit related to Acquisition- related compensation that is tax deductible for GAAP purposes, the impact of that tax benefit in calculating non- GAAP adjusted net income; (3) any gains or losses realized from investments in GLG Funds held by equity participation plan participants in connection with the Acquisition; (4) the cumulative dividends payable to the holders of exchangeable shares of its FA Sub 2 Limited subsidiary in respect of its estimate of the net taxable income of FA Sub 2 Limited allocable to such holders multiplied by an assumed tax rate; and (5) amortization of the intangible assets recognized in relation to the acquired management contracts of SGAM UK and its associated tax effect. The definition of non-GAAP adjusted net income was modified in the second quarter of 2009 to reflect certain additional adjustments arising from the SGAM UK acquisition, as these items are not factored into management's assessment of the underlying performance of GLG's business. A reconciliation of non-GAAP adjusted net income to GAAP net loss before non-controlling interests is provided in the Financial Summary on page 15. For periods in which the conversion of the convertible notes would be dilutive and the underlying shares are included in the non-GAAP weighted average fully diluted share count, GLG's management further adjusts the non-GAAP adjusted net income measure to add back the amount of the convertible note interest expense for the period for purposes of the non-GAAP adjusted net income per non-GAAP weighted average fully diluted share calculation. Adjusted net income is not a measure of financial performance under GAAP and should not be considered as an alternative to GAAP net loss as an indicator of GLG's operating performance or any other measures of performance derived in accordance with GAAP. 34 |
| DESCRIPTION OF NON-GAAP WEIGHTED AVERAGE FULLY DILUTED SHARE COUNT 35 Non-GAAP weighted average fully diluted shares: GLG's management assesses business performance per share based on the measure "non-GAAP weighted average fully diluted shares outstanding," which adjusts average fully diluted shares outstanding under GAAP for (1) the unvested shares issued pursuant to GLG's equity participation plan, which are recorded under GAAP as treasury shares, but upon which it will pay dividends to the extent it pays them on vested shares; (2) unvested shares awarded under GLG's 2007 Restricted Stock Plan and Long-Term Incentive Plans upon which it will pay dividends to the extent it pays them on vested shares; (3) the exchange of the FA Sub 2 Limited Exchangeable Shares; (4) the conversion of the convertible notes, if the conversion is dilutive; and (5) the number of shares issuable upon exercise of the warrants under the treasury stock method. |
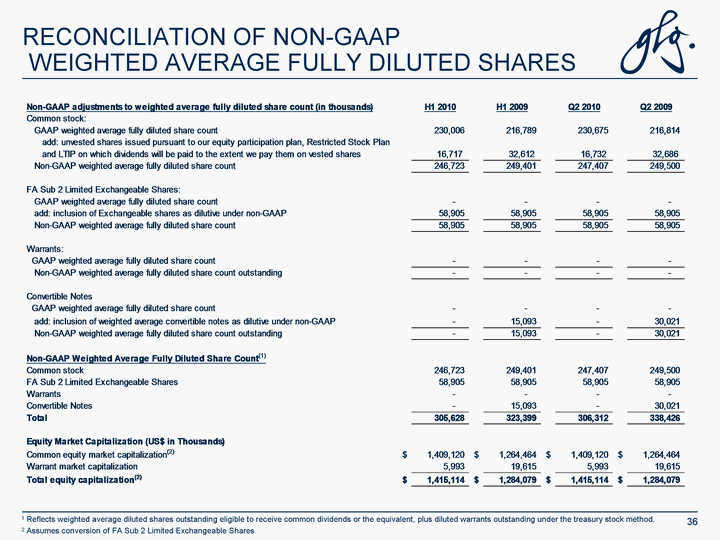
| RECONCILIATION OF NON-GAAP WEIGHTED AVERAGE FULLY DILUTED SHARES 36 1 Reflects weighted average diluted shares outstanding eligible to receive common dividends or the equivalent, plus diluted warrants outstanding under the treasury stock method. 2 Assumes conversion of FA Sub 2 Limited Exchangeable Shares |
