Attached files
| file | filename |
|---|---|
| 8-K - CURRENT REPORT - GENTIVA HEALTH SERVICES INC | d8k.htm |
Exhibit 99.1
FORWARD-LOOKING STATEMENTS
This exhibit contains “forward-looking statements” within the meaning of the Private Securities Litigation Reform Act of 1995 based on our current expectations, assumptions, and estimates about us and our industry. These forward-looking statements involve risks and uncertainties. Words such as “believe,” “anticipate,” “estimate,” “expect,” “intend,” “plan,” “will,” “may” and other similar expressions identify forward-looking statements. In addition, any statements that refer to expectations, projections or other characterizations of future events or circumstances are forward-looking statements. All statements other than statements of historical facts, including, among others, statements regarding our future financial position, business strategy, projected levels of growth, projected costs and projected financing needs, are forward-looking statements. These forward-looking statements are based on our current expectations, are not guarantees of future performance, are subject to a number of risks, uncertainties, assumptions and other factors, some of which are beyond our control, are difficult to predict and could cause actual results to differ materially from those anticipated in such forward-looking statements. Important factors that could cause actual results to differ materially from those in forward-looking statements include, but are not limited to:
| • | general economic and business conditions; |
| • | demographic changes; |
| • | changes in, or failure to comply with, existing governmental laws and regulations; |
| • | impact of recently passed healthcare reform legislation and its subsequent implementation through government regulations; |
| • | changes in Medicare, Medicaid and commercial payer reimbursement levels; |
| • | effects of competition in the markets in which the Company operates; |
| • | liability and other claims asserted against the Company; |
| • | ability to attract and retain qualified personnel; |
| • | availability and terms of capital; |
| • | loss of significant contracts or reduction in revenues associated with major payer sources; |
| • | ability of customers to pay for services; |
| • | business disruption due to natural disasters, pandemic outbreaks or terrorist acts; |
| • | ability to successfully integrate the operations of Odyssey HealthCare, Inc. and other acquisitions the Company may make and achieve expected synergies and operational efficiencies within expected time-frames; |
| • | effect on liquidity of the Company’s debt service requirements; |
| • | the amount of costs, fees, expenses and charges related to the transactions described in this exhibit; |
| • | changes in estimates and judgments associated with critical accounting policies and estimates; and |
| • | the other factors referenced in this exhibit, including, without limitation, under “Risk Factors” and those risk factors set forth in our Annual Report on Form 10-K, for the year ended January 3, 2010, as supplemented in our Quarterly Report on Form 10-Q for the quarter ended July 4, 2010. |
1
We believe these forward-looking statements are reasonable; however, you should not place undue reliance on any forward-looking statements, which are based on current expectations. If any of the foregoing risks or uncertainties materialize, or if any of our underlying assumptions are incorrect, our actual results may differ significantly from the results that we express or imply by any of our forward-looking statements. The forward-looking statements made in this exhibit relate only to events as of the date on which the statements are made. Because forward-looking statements are inherently subject to risks and uncertainties, some of which cannot be predicted or quantified, you should not rely upon forward-looking statements as predictions of future events. Except as required by applicable law, including the securities laws of the United States, and the rules and regulations of the SEC, we do not plan and assume no obligation to publicly update or revise any forward-looking statements contained herein after the date of this exhibit, whether as a result of any new information, future events or otherwise.
2
SUMMARY
Gentiva Health Services, Inc., a Delaware corporation (“Gentiva”), entered into an Agreement and Plan of Merger (the “Plan of Merger”), dated as of May 23, 2010, with GTO Acquisition Corp., a wholly-owned subsidiary of Gentiva (“Merger Sub”), and Odyssey HealthCare, Inc., a Delaware corporation (“Odyssey”). Upon the terms and subject to the conditions set forth in the Plan of Merger, Merger Sub will merge (the “Merger”) with and into Odyssey with Odyssey continuing as the surviving corporation and a wholly-owned subsidiary of Gentiva. Upon consummation of the Merger, each issued and outstanding share of Odyssey common stock will be exchanged for the right to receive $27.00 in cash, without interest.
Unless the context requires otherwise, references in this exhibit to “Gentiva,” the “Company,” “we,” “us,” and “our” prior to the consummation of the Merger refer to Gentiva and its consolidated subsidiaries, and, following the consummation of the Merger and the other transactions described herein, such references refer to Gentiva and its consolidated subsidiaries, including Odyssey and its consolidated subsidiaries. Unless otherwise stated herein, our pro forma financial information reflects the effects of the consummation of the transactions described under “The Proposed Odyssey Acquisition and Financing.”
Our Company
We are a leading provider of home health services throughout most of the United States, and we are a provider of hospice services in the southeastern United States. We conduct direct home nursing and therapy services operations through licensed and Medicare-certified agencies at approximately 340 locations in 39 states. We generate our revenues through reimbursement sources that include government programs, such as Medicare and Medicaid, and private sources, such as health insurance plans, managed care organizations, long term care insurance plans and personal funds.
Our home health services include skilled nursing; skilled rehabilitation services, including physical, occupational and speech therapy; and social work, nutrition, disease management education, home health aide and homemaker services. Our direct home nursing and therapy services operations also deliver services to our customers through focused specialty programs, which include Gentiva Orthopedics, Gentiva Safe Strides®, Gentiva Cardiopulmonary, Gentiva Senior Health and Gentiva Neurorehabilitation. Additionally, through our Rehab Without Walls® unit, we provide home and community-based neurorehabilitation therapies for patients with traumatic brain injury, cerebrovascular accident injury and acquired brain injury, as well as a number of other complex rehabilitation cases. We also provide consulting services to home health agencies, including operational support, billing and collection activities, and on-site agency support and consulting. Home health contributed 93% of our net revenues for the twelve-month period ended July 4, 2010.
Our hospice services programs provide healthcare services and products needed by terminally ill hospice patients and their families through the use of interdisciplinary teams. Depending on his or her needs, each hospice patient is assigned a team composed of a physician, nurse(s), home health aide(s), medical social
3
worker(s), chaplain, dietary counselor and bereavement coordinator, as well as other care professionals. We provide hospice services primarily in the patient’s home or other residence, such as an assisted living facility, a nursing home or a hospital. Hospice services represented 7% of our net revenues for the twelve-month period ended July 4, 2010.
On May 23, 2010, we entered into an agreement to acquire Odyssey HealthCare, Inc., a publicly-owned hospice company. Our acquisition of Odyssey will significantly expand the footprint of our hospice services. Like Gentiva’s hospice operations, Odyssey’s hospice service programs are designed to provide a wide range of care and services to terminally ill patients and their families, including palliative (or comfort) services, such as counseling and psychosocial services for terminally ill patients and their families. Odyssey has grown significantly since 2005, both organically and through acquisitions, and is now one of the largest providers of hospice care in the United States in terms of both average daily patient census and number of Medicare-certified hospice programs. Odyssey commenced operations in 1996 with a single hospice program, and, at June 30, 2010, it provided care through 90 Medicare-certified hospice programs in 30 states and achieved an average daily patient census of 12,493 for the twelve months ended June 30, 2010.
Hospice services are typically paid for through the Medicare hospice benefit, which covers virtually all expenses related to caregiving, medical equipment, supplies and drugs for Medicare beneficiaries who are hospice-appropriate and elect to receive hospice care. Services provided under the Medicare hospice program represented approximately 93% of Gentiva’s hospice revenues for the twelve months ended July 4, 2010 and 93% of Odyssey’s net patient service revenue for the twelve months ended June 30, 2010.
Upon consummation of the Merger, we will become the largest combined home health and hospice services provider in the United States based on revenue. For the twelve-month period ended July 4, 2010, pro forma for our acquisition of Odyssey and the other transactions described in “The Proposed Odyssey Acquisition and Financing,” we would have generated net revenues and Adjusted EBITDA of $1,882 million and $271 million, respectively. See “The Proposed Odyssey Acquisition and Financing” and “Unaudited Pro Forma Condensed Consolidated Financial Information.”
We believe our acquisition of Odyssey will:
| • | Complement our product portfolio by expanding our hospice footprint. The combination of Gentiva and Odyssey will form the largest combined home health and hospice services provider in the United States based on revenue. Although we currently provide hospice services, the acquisition of Odyssey will allow us to fully integrate hospice into our national home health footprint and offer our services across a broader continuum of care. |
| • | Realize revenue synergies by extending the services we offer our home health patients and leveraging referral sources cross our business lines. As the acuity level of many of our home health patients increase, they may ultimately choose hospice as their end-of-life care solution. By offering hospice services across our national footprint of home health offices, we anticipate that referral sources may be more likely to refer to us due to our ability to provide healthcare services across a broader continuum of care than most of our competitors. In addition, many general physicians, specialty physicians, and discharge planners that refer home health patients also refer potential hospice patients. Offering our services across a broader continuum of care will allow us to leverage our existing relationships with referral sources across both our home health and hospice businesses. |
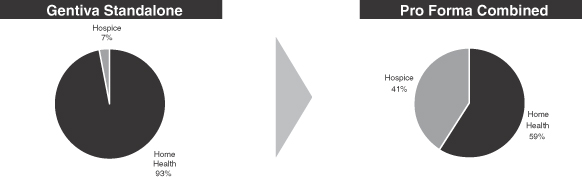
| • | Diversify our revenue sources across both the home health and hospice sectors. As illustrated in the charts below, on a standalone basis, our home health and hospice services constituted 93% and 7% of our net revenues for the twelve-month period ended July 4, 2010, respectively. Upon consummation of the proposed acquisition of Odyssey, home health services and hospice services will constitute 59% and |
4
| 41% of our pro forma net revenues, respectively, thereby reducing the impact of any potential Medicare reimbursement reductions to either sector. |
| • | Increase the geographical coverage of our hospice services. Our hospice segment has minimal geographic overlap with Odyssey’s operations, while our home health locations have a strategic geographic fit with Odyssey’s hospice locations. Increasing the geographic diversity of our services reduces our exposure to demographic changes in any one state or region and expands our base of referral sources. |
| • | Realize cost synergies by consolidating redundant corporate overhead and leveraging existing overhead. We believe we will be able to generate substantial cost savings by eliminating duplicative corporate overhead, back office and overlapping regional office functions. |
| • | Allow us to further capitalize on positive demographic trends across our two industries. Because hospice and home health services provide a more cost-effective form of treatment as compared to traditional facility-based care, we anticipate these services will continue to grow in importance as the healthcare industry evolves to meet the needs of the aging U.S. population. |
| • | Enhance our existing hospice business by leveraging Odyssey’s leading management team and systems. Odyssey’s proprietary IT systems and operational staff provide an ideal platform to integrate our existing hospice services and position our hospice service offerings for future growth. |
Our Strengths
Leading market positions in home health and hospice. Following our acquisition of Odyssey, we will be the largest combined home health and hospice services provider in the United States based on revenue. We will have broad geographic diversification with more than 400 combined locations in 41 states including 16 states that require a certificate of need (“CON”) to provide either or both home health and hospice services. We believe our significant scale, diverse healthcare service offerings and broad geographic coverage will provide us with a strong platform to drive profitable growth across diverse economic cycles and changing regulatory environments. Additionally, our leading presence in 16 CON states provides us with significant regulatory advantages over potential competitors seeking to enter those markets.
Diversified revenue sources across healthcare services, geography and patient population. Pro forma for the Transactions, our home health and hospice businesses would have accounted for 59% and 41% of our net revenue for the twelve-month period ended July 4, 2010, respectively. We expect that our diversified revenue sources will increase our revenue growth and stability by increasing our hospice business mix while decreasing our exposure to regulatory changes in either the home health or hospice sector. Additionally, our diversified
5
geographic base and national scale decrease our exposure to demographic changes in any one state and expands our base of referral sources. We also believe that our diversified geographic base creates future growth opportunities due to the fragmented nature of both the home health and hospice industries.
Proven ability to integrate acquisitions and extract synergies. We have a strong track record of successfully integrating acquisitions. Since the beginning of 2006, we have completed 14 acquisitions representing aggregate annualized revenues of approximately $400 million. Our acquisition of The Healthfield Group, Inc. (“Healthfield”) in 2006 for a purchase price of $466 million and our financial performance since closing that acquisition illustrate our ability to successfully integrate a transformational acquisition and achieve projected synergies. Since our acquisition of Healthfield in 2006, we have focused our business on servicing the geriatric population and leveraging our operating and corporate overhead. The successful integration of Healthfield and other acquisitions and our focus on improving operating results have contributed to an expansion of our Adjusted EBITDA margins from 4.1% in 2005 to 12.6% for twelve-month period ended July 4, 2010, and an increase in our cash flow from operations from $22 million in 2005 to $104 million for the twelve-month period ended July 4, 2010.
Differentiated specialty therapeutic offerings. We have developed several areas of specialized care to enhance and differentiate our service offerings from those of our home health and hospice competition. Our specialty programs in home health include orthopedics, Safe Strides®, cardiopulmonary, senior health and neurorehabilitation. Following our acquisition of Odyssey, our specialty programs in hospice will include CareBeyond® programs for cardio obstructive pulmonary disease, or COPD, dementia, congestive heart failure and cancer. Our home health specialty programs are generally focused on patients with chronic diseases who typically require extended or multiple therapies or other services. Using unique outcome measures from these programs, we are able to provide referral sources with information that allows us to treat patients who may otherwise not be considered for home health or hospice by their care provider or treat additional needs from this complex patient base.
Industry leading clinician retention and labor efficiency. We have been dedicated to growing and retaining our clinician base as illustrated by our net addition of approximately 700 clinicians in 2009 and our clinician turnover of approximately 21% in 2009, which we believe is among the lowest in the home health industry. We believe that our specialty programs and our compensation model attract and retain high quality nurses and therapists due to our dedication and commitment to quality patient care outcomes and the clinical protocols of our specialty programs. Additionally, our pay-per-visit compensation model both rewards clinician productivity and allows us to effectively manage our gross margins.
Well positioned to benefit from favorable industry and demographic dynamics. The aging U.S. population provides significant underlying demand for both home health and hospice services. Individuals aged 65 years and older are the fastest growing segment of the population with an estimated compound annual growth rate, or CAGR, of 3.1% over the next 10 years. The segment of the population aged 65 years and older accounts for approximately 69% of the home health population and represents 82% of the current hospice population. According to Centers for Medicare & Medicaid Services (“CMS”), the home healthcare industry is projected to grow 7.7% annually from 2009 to 2015, outpacing total annual healthcare spending growth projections of 6.4%. Additionally, hospice has become more readily accepted as a therapeutic choice for end-of-life care as illustrated by its historical Medicare expenditure growth CAGR of 18.4% from 2000 to 2008. Both hospice and home health are expected to increase in importance going forward due to their ability to reduce healthcare costs when compared to traditional facility-based treatments.
Proven ability to generate profitable growth and strong cash flows. We have consistently generated profitable growth as illustrated by our ability to grow our Adjusted EBITDA, excluding CareCentrix, from $80 million in 2007 to approximately $150 million for the twelve months ended July 4, 2010 during a difficult macroeconomic environment. We also generated strong cash flows during the same time period as illustrated by
6
our growth of cash flow from operations from $63 million in 2007 to approximately $104 million for the twelve months ended July 4, 2010. Additionally, our relatively low capital expenditure requirements facilitate significant free cash flow generation. We also have a proven track record of reducing our leverage through a combination of EBITDA growth and debt reduction as illustrated by the decrease in our ratio of total debt/Adjusted EBITDA from 4.2x at the end of fiscal year 2005 as adjusted for the acquisition of Healthfield in February 2006 to 1.5x as of July 4, 2010.
Experienced and committed management team. Our senior management team led by Chief Executive Officer, Tony Strange; Chief Financial Officer, Eric Slusser; General Counsel, John Camperlengo; and Senior Vice President, Chief Clinical Officer, Charlotte A. Weaver, has substantial experience in the home health and hospice industries with a combined tenure of more than 35 years. Our management team has a strong record of integrating acquisitions, pioneering our specialty therapeutic services and generating profitable growth and strong cash flows.
Our Strategy
Our mission is to provide industry leading, cost-effective home health and hospice services to the growing geriatric population in the United States. In addition, we strive to improve our market position and utilize our core strengths to improve patient outcomes, increase profitability and maximize cash flows. We intend to accomplish these objectives through the following actions:
Complete the successful integration of Odyssey. We are focused on providing the highest quality clinical care in home health and hospice services in the United States. Our acquisition of Odyssey continues our strategic focus on diversifying our home care business and extending our services across a broader continuum of care. We began our diversification efforts in 2006 with the acquisition of Healthfield, and our acquisition of Odyssey represents the next major building-block in our strategy of transforming Gentiva into a fully-integrated national health care service provider in both hospice and home health programs. As we focused on our core businesses of providing home health and hospice services, we have divested non-core assets, such as a controlling interest in CareCentrix in 2008, offices primarily specializing in pediatric services in 2009 and our home medical equipment and infusion therapy (“HME and IV”) businesses in 2010. We intend to continue to pursue a disciplined approach in making capital investments that generate a high return on investment.
Maximize full range of revenue and cost synergies from combined operations. We expect to extract significant cost and revenue synergies through the acquisition of Odyssey, and we anticipate that the strategic combination of home health and hospice services, coupled with strategic geographic overlap of our existing home health locations and Odyssey’s hospice locations, as well as limited overlap with our existing hospice locations, will allow us to offer a more diversified range of healthcare services to our broad geographic base of referral sources. We believe that we will be able to extract both cost and revenue synergies by:
| • | eliminating redundant corporate overhead and leverage existing overhead across a wider range of services; |
| • | selectively consolidating overlapping hospice locations; |
| • | cross-selling combined service offerings across referral sources in our enhanced national footprint; |
| • | continuing to diversify across home health and hospice services to best position us for profitable growth in any reimbursement environment; and |
| • | leveraging our size, scale and geographic reach to position us for market share expansion due to anticipated market consolidation. |
7
Continue to increase the breadth and penetration of specialty programs. We intend to continue to expand our specialty home health and hospice offerings and increase the penetration rate of those services across our existing customer base. In order to extend the reach and penetration rates of our specialty programs, we intend to both cross-sell our services to our existing referring physicians while also increasing the marketing of our services to both new discharge planners and physician specialists.
Capitalize on strong industry fundamentals. The home health and hospice industries have experienced strong growth over the past several years due to patients’ preference for receiving care at home and the lower cost of home health and hospice when compared to more traditional facilities-based settings. Both the patient and the Medicare system benefit when a patient can be cared for in his or her own home versus a more costly institutional setting. With the clinical and technological enhancements made over the past several years, home health care is able to deliver a wider range of services and increasingly sophisticated solutions to our patients in the home. According to CMS, the home health care industry, including hospice, is projected to grow 7.7% annually from 2009 to 2015, outpacing total annual healthcare spending growth projections of 6.4%. Individuals aged 65 years and older are the fastest growing segment of the U.S. population with an estimated CAGR of 3.0% over the next 10 years. Because of the aging U.S. population, we anticipate that the medical industry will continue to focus on treatment of patients in the later stages of life. This is expected to continue to drive growth in the use of home health and hospice services.
Deleverage balance sheet. Historically, we have generated strong and stable cash flows which have allowed us to fund our growth-related investments while maintaining reasonable leverage levels. Both the home health and hospice industry have low capital expenditure requirements, which have allowed us to generate strong cash flows. We have a strong historical track record of reducing leverage. As adjusted for the Healthfield acquisition in February 2006, our total debt/Adjusted EBITDA was 4.2x at the end of fiscal year 2005, but we successfully reduced our leverage ratio to 1.5x as of July 4, 2010 through EBITDA growth, free cash flow generation and divestitures of non-core assets. We grew our Adjusted EBITDA, excluding CareCentrix, from $80 million in 2007 to approximately $150 million for the twelve months ended July 4, 2010 while also increasing our cash flow from operations from $63 million in 2007 to approximately $104 million for the twelve months ended July 4, 2010. Pro forma for the Odyssey acquisition, Adjusted EBITDA would have been $271 million for the twelve-month period ended July 4, 2010. Following the Odyssey transaction, we plan to continue our strategy of utilizing cash flows from our combined operations to reduce our leverage and to fund any future organic growth initiatives.
Our Industries
Home Health
According to CMS, home health consists of medically necessary care ordered by a physician, including intermittent skilled nursing, skilled physical therapy, occupational therapy and/or speech-language therapy. Home health services are provided to patients recovering in their homes, often following care in hospitals, nursing homes or other post-acute care facilities. Patients requiring home health care include those who are disabled, frail and elderly, or chronically or terminally ill and in need of medical, nursing or therapeutic treatment and/or assistance with the essential activities of daily living. In order to be eligible for Medicare home health benefits, patients must require intermittent skilled care to treat their illness or injury and must be unable to leave their homes without a taxing effort. Services provided by home health agencies include skilled nursing, skilled physical, occupational and speech therapy, and antibiotic therapy, infusion and chemotherapy, pain management, medication management, skilled observation and assessment, parenteral and enteral nutrition, social work, patient education and training, and wound care.
There are several types of home care providers, including home health care agencies, home care aide organizations and hospices. Some of these providers are Medicare-certified and eligible to receive reimbursement for care and services provided to Medicare beneficiaries.
8
According to CMS, total national health expenditures on home healthcare were $72 billion in 2009, across all payor classes, and are forecasted to grow 7.7% annually from 2009 to 2015. With the aging U.S. population, driven by the baby-boomer generation, the demand and necessity for senior care and services is expected to increase dramatically. In 2009, the U.S. Census Bureau estimated there were 39.6 million people over the age of 65, which accounted for approximately 12.9% of the population. This number is expected to grow to 40.2 million people by 2010, and by 2020, it is estimated to reach 54.8 million people. The American Association of Homes and Services for the Aging (“AAHSA”) estimates that 69% of people over 65 will need some type of long-term care.
There is a significant cost advantage to utilizing home health services as compared to in-facility care. Home healthcare average cost per day is only 3% of the cost of a hospital ($50 vs. $1,479 according to CMS). Similarly, home healthcare cost per day is only 17% of the cost of a skilled nursing facility ($50 vs. $303 according to CMS).
The home health care industry is highly fragmented, with 90% of providers privately owned and 10% publicly owned based on revenue. While there are several large for-profit public companies in the home health industry, the bulk of the industry is made up of thousands of relatively small, regional and local providers. This represents significant potential for consolidation, which we believe would benefit us and other large providers in the industry.
Hospice
Hospice care agencies provide supportive and palliative care to people at the end-of-life. Hospice agencies focus on comfort and quality of life, rather than curative treatments. The first hospice provider in the United States, the Connecticut Hospice, began providing services in 1974.
Hospices rely on the combined knowledge and skill of an interdisciplinary team of professionals (e.g. physicians, nurses, medical social workers, therapists, counselors, home care aides and volunteers) to coordinate an individualized plan of care for each patient and family. Services, which are provided primarily in clients’ homes, include medical, emotional and spiritual care for terminally ill patients and their families. These are designed to bring comfort, peace and a sense of dignity at a very trying time. Hospice reaffirms the right of every patient and family to participate fully in the final stage of life.
The hospice industry has grown significantly over the last ten years due in part to the following key growth drivers:
| • | a growing appreciation for end-of-life services; |
| • | an aging U.S. population; |
| • | a better understanding of hospice services; |
| • | a growing, underserved market (one third of terminally ill patients who can benefit from hospice do so); |
| • | the cost-effectiveness of hospice services as compared to facility-based care, which helps decrease long-term healthcare costs; and |
| • | a reduction in Medicare costs through hospice use, averaging $2,309 per patient in the last year of life (according to CMS). |
9
We believe that the following trends in hospice utilization and the aging population are positive indicators for the hospice industry:
| • | Increase in Hospice Use: The number of Medicare beneficiaries electing hospice care has increased approximately 106% from 2000 to 2008, according to the Medicare Payment Advisory Commission’s (“MedPAC”) publication, “Report to Congress: Medicare Payment Policy — March 2010” or the March 2010 MedPAC Report. Medicare spending for hospice care has grown from approximately $2.9 billion in 2000 to approximately $11.2 billion in 2008. Hospice use has also increased considerably among Medicare patients with non-cancer diagnoses. According to the March 2010 MedPAC Report, patients with non-cancer diagnoses accounted for 69% of all hospice patients in 2008, up from 47% in 1998. |
| • | Length of Stay: After several consecutive years of increase in average length of stay, the average length of stay for hospice providers appears to have leveled off. According to the March 2010 MedPAC Report, the average length of stay for Medicare hospice beneficiaries was 83 days in 2008, an increase of 3 days from 2007. The average length of stay for 2008 and 2007 represents a significant increase over the average length of stay for 2000 of 54 days. |
| • | Similar to the home health industry, the hospice industry is highly fragmented. According to MedPAC, in 2008, there were 3,389 Medicare-certified hospice programs, an increase of 4.0% over 2007. Approximately 35% of existing hospice programs are not-for-profit programs. Many hospice programs are small and medium-sized programs, and approximately 13% of the market is held by Odyssey and Vitas, the two largest hospice providers based on revenue. Due to the fragmented nature of the markets and our size and scale, we believe that there will be consolidation opportunities in the hospice industry. |
Certain Information About Us
Gentiva Health Services, Inc. was incorporated under the laws of the State of Delaware on August 6, 1999. Our principal executive offices are located at 3350 Riverwood Parkway, Suite 1400, Atlanta, Georgia 30339-3314, and our telephone number is (770) 951-6450. We maintain a website at http://www.gentiva.com. Information contained or linked on our website is not a part of this exhibit.
10
The Proposed Odyssey Acquisition and Financing
On May 23, 2010, we entered into the Plan of Merger with Merger Sub and Odyssey. Upon the terms and subject to the conditions set forth in the Plan of Merger, Merger Sub will merge with and into Odyssey with Odyssey continuing as the surviving corporation and a wholly-owned subsidiary of Gentiva. Upon consummation of the Merger, each issued and outstanding share of Odyssey common stock will be exchanged for the right to receive $27.00 in cash, without interest.
Consummation of the Merger is subject to customary conditions, including adoption of the Plan of Merger by Odyssey’s stockholders, the absence of legal restraints and the receipt of requisite antitrust approval. Each party’s obligation to consummate the Merger is also subject to the accuracy of the representations and warranties of the other party (subject to certain exceptions) and the performance in all material respects of the other party’s covenants under the Plan of Merger.
The consummation of the Merger, our entering into a new $125 million revolving credit facility, our entering into an $800 million senior term loan facility, our issuance of $305 million aggregate principal amount of senior notes and the payment of the related fees and expenses, and the repayment upon consummation of the Merger of (x) all amounts outstanding under our existing senior credit facility and (y) all amounts outstanding under Odyssey’s existing senior credit facility are collectively referred to in this exhibit as the “Transactions.” For a more complete description of the Transactions, see “—Corporate Structure,” “The Proposed Odyssey Acquisition and Financing” and “Description of Other Indebtedness.”
The estimated sources and uses of funds for the Transactions, assuming the Transactions had closed on July 4, 2010, are shown in the table below. Actual amounts will vary from estimated amounts depending on several factors, including differences between estimated and actual fees and expenses and differences between our cash and cash equivalents balances at July 4, 2010 and at the closing of the Transactions.
| ($ in millions) Sources of Funds |
Uses of Funds | |||||||
| Cash and cash equivalents(1) |
$ | 295.4 | Merger consideration(4) |
$ | 963.5 | |||
| New revolving credit facility(2) |
— | Repayment of existing Gentiva senior credit facility(5) |
232.7 | |||||
| New senior secured term loan facility(3) |
800.0 | Repayment of existing Odyssey senior credit facility(6) |
112.7 | |||||
| New senior unsecured notes |
305.0 | Estimated fees and expenses(7) |
91.5 | |||||
| Total sources of funds |
$ | 1,400.4 | Total uses of funds |
$ | 1,400.4 | |||
| (1) | Reflects a portion of the cash and cash equivalents balances of Gentiva and Odyssey. |
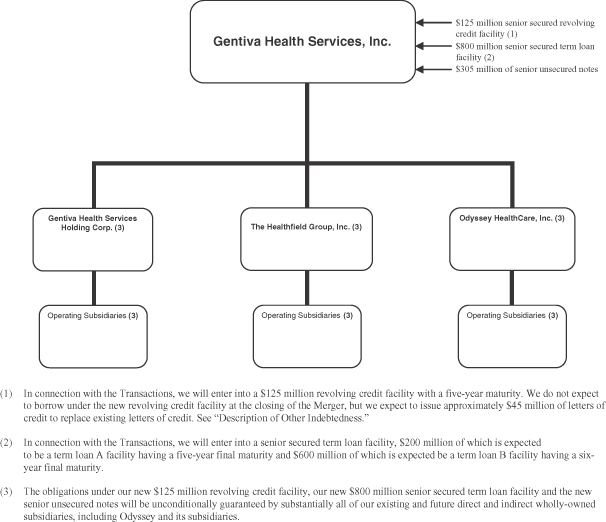
| (2) | In connection with the Merger, we will enter into a $125 million revolving credit facility with a five-year maturity. We do not expect to borrow under the new revolving credit facility at the closing of the Merger, but we expect to issue up to approximately $45.0 million of letters of credit to replace existing letters of credit. See “Description of Other Indebtedness.” |
| (3) | In connection with the Merger, we will enter into a senior secured term loan facility, $200 million of which is expected to be a term loan A facility having a five-year final maturity and $600 million of which is expected to be a term loan B facility having a six-year final maturity. The entire amount of the new senior term loan facility will be drawn at the closing of the Merger. See “Description of Other Indebtedness.” |
11
| (4) | Reflects amounts payable to holders of Odyssey common stock and to holders of options and restricted stock units granted under Odyssey’s compensation plans. |
| (5) | Reflects the face amount of Gentiva’s existing indebtedness, plus accrued interest. |
| (6) | Reflects the face amount of Odyssey’s existing indebtedness, plus accrued interest, together with the amount payable to terminate the related interest rate swaps. |
| (7) | Reflects our estimate of fees and expenses associated with the Transactions, including placement and other financing fees (including upfront fees and original issue discount on the credit facility, if any) and other transaction costs and professional fees. |
12
Corporate Structure
The following diagram illustrates our expected corporate structure immediately following consummation of the Transactions.
13
Summary Unaudited Pro Forma Condensed Consolidated Financial Data
The following table sets forth our summary unaudited pro forma condensed consolidated financial data at the dates and for the periods indicated. The summary unaudited pro forma statement of income, balance sheet and other financial data for the year ended January 3, 2010, the six months ended June 28, 2009 and July 4, 2010 and the twelve-month period ended July 4, 2010 give effect to the Transactions as if they had occurred on December 29, 2008 (the first day of fiscal 2009), and the summary unaudited pro forma condensed consolidated balance sheet data give effect to the Transactions as if they had occurred on July 4, 2010. The pro forma adjustments are based upon available information and certain assumptions that we believe are reasonable. The summary unaudited pro forma condensed consolidated financial data are for informational purposes only and do not purport to represent what our results of operations or financial position actually would have been if the Transactions had occurred at any date, and such data do not purport to project our financial position as of any date or our future results of operations for any future period.
We derived the summary unaudited pro forma condensed consolidated statement of income data for the twelve months ended July 4, 2010, by adding the summary unaudited pro forma condensed consolidated statement of income data for the year ended January 3, 2010 to the summary unaudited pro forma condensed consolidated statement of income data for the six months ended July 4, 2010 and subtracting the summary unaudited pro forma condensed consolidated statement of income data for the six months ended June 28, 2009. See “Unaudited Pro Forma Condensed Consolidated Financial Information” for a complete description of the adjustments and assumptions underlying these summary unaudited pro forma condensed consolidated financial data.
The unaudited pro forma condensed consolidated financial data should be read in conjunction with “The Proposed Odyssey Acquisition and Financing,” contained in this exhibit and the historical consolidated financial statements and related notes of Gentiva and Odyssey included in their respective most recently-filed Annual Reports on Form 10-K and Quarterly Reports on Form 10-Q.
| ($ in thousands) |
Year ended January 3, 2010 |
Six months ended June 28, 2009 |
Six months ended July 4, 2010 |
Twelve months ended July 4, 2010 |
||||||||||||
| Statement of Income Data: |
||||||||||||||||
| Net revenues |
$ | 1,838,898 | $ | 899,029 | $ | 941,953 | $ | 1,881,822 | ||||||||
| Cost of services sold |
950,304 | 465,924 | 470,272 | 954,652 | ||||||||||||
| Gross profit |
888,594 | 433,105 | 471,681 | 927,170 | ||||||||||||
| Selling, general and administrative expenses |
(713,348 | ) | (351,339 | ) | (373,114 | ) | (735,123 | ) | ||||||||
| Gain (loss) on sale of assets, net |
5,588 | 5,747 | 100 | (59 | ) | |||||||||||
| Interest income |
3,516 | 1,905 | 1,484 | 3,095 | ||||||||||||
| Interest expense and other |
(101,035 | ) | (51,383 | ) | (50,383 | ) | (100,035 | ) | ||||||||
| Income from continuing operations before income taxes and equity in net earnings of affiliate |
83,315 | 38,035 | 49,768 | 95,048 | ||||||||||||
| Income tax expense |
(31,013 | ) | (12,883 | ) | (19,818 | ) | (37,948 | ) | ||||||||
| Equity in net earnings of affiliate |
1,072 | 541 | 763 | 1,294 | ||||||||||||
| Income from continuing operations |
53,374 | 25,693 | 30,713 | 58,394 | ||||||||||||
| Income attributable to noncontrolling interests |
(613 | ) | (217 | ) | (482 | ) | (878 | ) | ||||||||
| Income from continuing operations attributable to Gentiva shareholders |
$ | 52,761 | $ | 25,476 | $ | 30,231 | $ | 57,516 | ||||||||
14
| ($ in thousands) |
Twelve months ended July 4, 2010 | ||
| Other Financial Data: |
|||
| EBITDA(1) |
$ | 222,270 | |
| Depreciation and amortization |
30,282 | ||
| Adjusted EBITDA(1) |
271,068 | ||
| Net cash interest expense(2) |
87,301 | ||
| Capital expenditures(3) |
20,002 | ||
| Ratio of Adjusted EBITDA to net cash interest expense |
3.1x | ||
| Ratio of total debt to Adjusted EBITDA |
4.1x | ||
| Balance Sheet Data (at period end): |
|||
| Cash and cash equivalents |
$ | 60,167 | |
| Accounts receivable |
271,525 | ||
| Working capital |
86,944 | ||
| Total assets |
2,124,580 | ||
| Total debt |
1,105,000 | ||
| Shareholders’ equity |
580,970 | ||
| (1) | EBITDA, a measure used by management to evaluate operating performance, is defined as income from continuing operations plus net interest expense, income tax expense, and depreciation and amortization, less equity in net earnings of affiliates. EBITDA is not a recognized term under GAAP and does not purport to be an alternative to income from continuing operations or net income as a measure of operating performance or cash flows from operating activities as a measure of liquidity. Additionally, EBITDA is not intended to be a measure of free cash flow available for management’s discretionary use, as it does not consider certain cash requirements such as interest payments, tax payments and debt service requirements. Our presentation of EBITDA has limitations as an analytical tool, and you should not consider it in isolation or as a substitute for analysis of our results as reported in accordance with GAAP. Management believes EBITDA is helpful in highlighting trends because EBITDA excludes items that are outside management’s immediate control and can differ significantly from company to company depending on long-term strategic decisions regarding capital structure, tax jurisdictions in which companies operate and capital investments. Management uses non-GAAP financial measures to supplement, and not as a substitute for, GAAP results to provide a more complete understanding of the factors and trends affecting the business. |
Adjusted EBITDA is defined as EBITDA as adjusted to exclude restructuring, legal settlement and merger and acquisition costs and other adjustments as set forth below. We believe that the inclusion of supplementary adjustments to EBITDA applied in presenting Adjusted EBITDA is appropriate to provide additional information to investors about certain material non-cash items, unusual items that we do not expect to continue at the same level in the future, net cost savings projected to be realized as a result of initiatives taken by management, and the Odyssey acquisition.
Because not all companies use identical calculations, our presentation of EBITDA and Adjusted EBITDA may not be comparable to other similarly titled measures of other companies, including those of Odyssey.
In addition, our pro forma Adjusted EBITDA should not be taken as representative of our future combined results of operations or financial position. See “Risk Factors—Risks Related to Our Business and Industry—We may not be able to achieve the benefits that we expect to realize as a result of the Merger or other future acquisitions. Failure to achieve such benefits could have an adverse effect on our financial condition and results of operations.”
15
The following table provides a reconciliation from our pro forma income from continuing operations, the most directly comparable GAAP measure, to pro forma EBITDA and pro forma Adjusted EBITDA (in thousands):
| Twelve Months Ended July 4, 2010 |
||||
| Pro forma Income from continuing operations |
$ | 58,394 | ||
| Less: Equity in net earnings of affiliates |
(1,294 | ) | ||
| Plus: Income tax expense |
37,948 | |||
| Pre-Tax Income |
95,048 | |||
| Plus: Net interest expense |
96,940 | |||
| Plus: Depreciation and amortization |
30,282 | |||
| Pro forma EBITDA |
222,270 | |||
| Plus: Net loss on sale of assets(a) |
59 | |||
| Plus: Stock-based compensation |
10,892 | |||
| Plus: Restructuring, legal settlement and merger and acquisition costs(b) |
18,856 | |||
| Plus: Cost savings(c) |
18,991 | |||
| Pro forma Adjusted EBITDA |
$ | 271,068 | ||
| (a) | Represents loss on disposal of Odyssey property and equipment ($413,000) offset by gain on sale of assets associated with two branch offices in upstate New York which provided home health services under the New York Medicaid programs and assets associated with a home health branch operation in Iowa ($354,000). |
| (b) | Restructuring, legal settlement and merger and acquisition costs are composed of the following: |
| Twelve Months Ended July 4, 2010 | |||
| Restructuring costs(i) |
$ | 2,246 | |
| Legal settlements(ii) |
13,693 | ||
| Costs relating to merger and acquisition activities(iii) |
2,917 | ||
| Total |
$ | 18,856 | |
| (i) | Represents costs associated primarily with the relocation our corporate headquarters from Melville, New York to Atlanta, Georgia. These costs relate primarily to severance costs in connection with the termination of personnel and facility lease and other costs. These costs also included a non-cash charge of approximately $0.6 million associated with the acceleration of compensation expense relating to future vesting of stock options under severance agreements for certain of our executive officers. |
| (ii) | Represents legal settlements consisting of (a) settlement costs and legal fees of $4.2 million related to a three-year old commercial contractual dispute involving our former subsidiary, CareCentrix, and (b) incremental charges of $9.5 million in connection with an agreement in principle, subject to final approvals, between the Company and the federal government to resolve the matters that were subject to a 2003 subpoena relating to the Company’s cost reports for the 1998 to 2000 periods. |
| (iii) | Represents merger and acquisition costs incurred in connection with the proposed Odyssey acquisition ($2.0 million) and various prior acquisitions ($0.9 million). These costs consisted of legal, accounting and other professional fees and expenses as well as costs of obtaining required regulatory approvals. |
16
| (c) | Expected cost savings by type are as follows: |
| Twelve Months Ended July 4, 2010 | |||
| Salaries, bonus and benefits (i) |
$ | 12,243 | |
| Legal and audit related fees (ii) |
2,400 | ||
| Dues and fees (iii) |
1,035 | ||
| Insurance (iv) |
739 | ||
| Lease (Dallas corporate center) (v) |
500 | ||
| Other (vi) |
2,074 | ||
| Total cost savings (vii) |
$ | 18,991 | |
| (i) | Represents the elimination of salaries, bonus and benefits of certain senior executives of Odyssey and certain administrative and back office employees who are in redundant positions with positions currently existing at Gentiva. These positions will be eliminated following the acquisition. |
| (ii) | Represents reduction in outsourced internal audit services, recurring audit fees and certain duplicate legal fees. |
| (iii) | Represents the elimination of fees paid to national hospice organizations for which Gentiva maintains membership, investor relations expenses and various other fees. |
| (iv) | Represents reduction in costs for duplicate insurance coverage paid by Odyssey that is currently maintained by Gentiva. |
| (v) | Represents savings resulting from consolidation of office space in Odyssey’s Dallas corporate center prior to the lease termination in July 2013. |
| (vi) | Represents the reduction of employee travel related expenses and other miscellaneous costs. |
| (vii) | Total cost savings does not include Odyssey’s stock-based compensation expense of approximately $6.0 million which is included in the stock-based compensation add-back set forth above. |
| (2) | Net cash interest expense is defined as net interest expense, adjusted for certain non-cash items. Cash interest expense is not a recognized term under GAAP and does not purport to be an alternative to interest expense as a measure of operating performance or to cash flows from operating activities as a measure of liquidity. We believe that the inclusion of cash interest expense is appropriate to provide additional information to investors about the Company’s liquidity. Pro forma net cash interest expense represents pro forma net interest expense, less amortization of deferred financing costs of $10.3 million. |
| (3) | Reflects capital expenditures for the twelve months ended July 4, 2010 of $14.9 million for Gentiva’s continuing operations and $5.1 million for Odyssey. |
17
Summary Historical Consolidated Financial Data of Gentiva Health Services, Inc.
The following table states our summary historical consolidated financial data, which, for the years ended December 30, 2007, December 28, 2008 and January 3, 2010, is derived from our audited consolidated financial statements and notes thereto, and, for the six months ended June 28, 2009 and July 4, 2010, is derived from our unaudited consolidated financial statements and notes thereto. The historical consolidated financial data for the twelve months ended July 4, 2010 is derived from both our audited consolidated financial statements and our unaudited consolidated financial statements and the respective notes thereto. The historical consolidated statement of income data, statement of cash flows data and balance sheet data for each fiscal year in the three-year period ended January 3, 2010 included in the following table have been derived from our audited consolidated financial statements. The summary historical consolidated financial data as of and for the six months ended June 28, 2009 and July 4, 2010 and the twelve months ended July 4, 2010 reflects all normal and recurring adjustments that, in the opinion of management, are necessary for a fair presentation of our results of operations and financial position. Results for the six months ended July 4, 2010 are not necessarily indicative of the results to be expected for the full year. The historical results indicated below and elsewhere in this exhibit are not necessarily indicative of our future performance. The following summary historical consolidated financial data should be read together with our consolidated financial statements and notes thereto as well as “Management’s Discussion and Analysis of Financial Condition and Results of Operations” contained in our Annual Report on Form 10-K for the year ended January 3, 2010 and our Quarterly Report on Form 10-Q for the quarter ended July 4, 2010.
18
| Fiscal Year Ended | Six Months Ended | Twelve Months Ended |
||||||||||||||||||||||
| ($ in thousands) |
December 30, 2007 |
December 28, 2008 |
January 3, 2010 |
June 28, 2009 (unaudited) |
July 4, 2010 (unaudited) |
July 4, 2010 (unaudited) |
||||||||||||||||||
| (52 weeks) | (52 weeks) | (53 weeks) | (53 weeks) | |||||||||||||||||||||
| Statement of Income Data: |
||||||||||||||||||||||||
| Net revenues |
$ | 1,171,349 | $ | 1,239,536 | $ | 1,152,460 | $ | 561,202 | $ | 594,230 | $ | 1,185,488 | ||||||||||||
| Cost of services |
671,154 | 682,024 | 553,530 | 268,025 | 275,839 | 561,344 | ||||||||||||||||||
| Gross profit |
500,195 | 557,512 | 598,930 | 293,177 | 318,391 | 624,144 | ||||||||||||||||||
| Selling, general and administrative expenses |
(422,526 | ) | (468,582 | ) | (490,866 | ) | (240,033 | ) | (264,771 | ) | (515,604 | ) | ||||||||||||
| Gain on sale of assets, net |
— | 107,933 | 5,998 | 5,747 | 103 | 354 | ||||||||||||||||||
| Interest income |
3,204 | 2,290 | 3,037 | 1,618 | 1,314 | 2,733 | ||||||||||||||||||
| Interest expense and other |
(27,285 | ) | (19,377 | ) | (9,211 | ) | (5,880 | ) | (3,514 | ) | (6,845 | ) | ||||||||||||
| Income from continuing operations before taxes and equity in net earnings of affiliate |
53,588 | 179,776 | 107,888 | 54,629 | 51,523 | 104,782 | ||||||||||||||||||
| Income tax expense |
(22,002 | ) | (28,295 | ) | (39,164 | ) | (19,634 | ) | (21,757 | ) | (41,287 | ) | ||||||||||||
| Equity in net earnings of affiliate |
— | (35 | ) | 1,072 | 541 | 763 | 1,294 | |||||||||||||||||
| Income from continuing operations |
31,586 | 151,446 | 69,796 | 35,536 | 30,529 | 64,789 | ||||||||||||||||||
| Discontinued operations, net of tax |
1,242 | 2,004 | (10,614 | ) | (419 | ) | (2,285 | ) | (12,480 | ) | ||||||||||||||
| Net income |
$ | 32,828 | $ | 153,450 | $ | 59,182 | $ | 35,117 | $ | 28,244 | $ | 52,309 | ||||||||||||
| Statement of Cash Flows Data: |
||||||||||||||||||||||||
| Cash flows provided by operating activities |
62,671 | 70,700 | 105,108 | 49,462 | 47,979 | 103,625 | ||||||||||||||||||
| Cash flows (used in) provided by investing activities |
(34,809 | ) | 38,684 | (17,232 | ) | (6,434 | ) | (5,317 | ) | (16,115 | ) | |||||||||||||
| Cash flows (used in) provided by financing activities |
(24,591 | ) | (54,350 | ) | (4,667 | ) | (12,759 | ) | (4,006 | ) | 4,086 | |||||||||||||
| Balance Sheet Data: |
||||||||||||||||||||||||
| Cash and cash equivalents |
14,167 | 69,201 | 152,410 | 99,470 | 191,066 | 191,066 | ||||||||||||||||||
| Working capital |
128,527 | 125,400 | 198,250 | 159,393 | 232,801 | 232,801 | ||||||||||||||||||
| Total assets |
882,233 | 973,497 | 1,067,935 | 1,007,564 | 1,098,731 | 1,098,731 | ||||||||||||||||||
| Total debt |
310,000 | 251,000 | 237,000 | 237,000 | 232,000 | 232,000 | ||||||||||||||||||
| Shareholders’ equity |
323,429 | 494,971 | 571,163 | 535,923 | 604,770 | 604,770 | ||||||||||||||||||
| Common shares outstanding |
28,046 | 28,864 | 29,470 | 29,011 | 29,754 | 29,754 | ||||||||||||||||||
| Other Financial Data: |
||||||||||||||||||||||||
| EBITDA(1) |
92,433 | 213,178 | 130,949 | 67,194 | 62,530 | 126,285 | ||||||||||||||||||
| Adjusted EBITDA(1) |
80,376 | 101,352 | 132,526 | 66,417 | 83,585 | 149,694 | ||||||||||||||||||
| Capital expenditures(2) |
18,841 | 18,880 | 19,034 | 9,736 | 5,613 | 14,911 | ||||||||||||||||||
| Depreciation and amortization(2) |
14,764 | 16,315 | 16,887 | 8,303 | 8,807 | 17,391 | ||||||||||||||||||
| Operating Data: |
||||||||||||||||||||||||
| Segment revenue |
||||||||||||||||||||||||
| Home Health |
||||||||||||||||||||||||
| Episodic |
$ | 578,515 | $ | 701,209 | $ | 861,776 | $ | 415,504 | $ | 457,229 | $ | 903,501 | ||||||||||||
| Other revenue |
247,812 | 245,436 | 216,350 | 109,837 | 96,475 | 202,988 | ||||||||||||||||||
| Total Home Health |
826,327 | 946,645 | 1,078,126 | 525,341 | 553,704 | 1,106,489 | ||||||||||||||||||
| Hospice |
57,837 | 61,857 | 74,334 | 35,861 | 40,526 | 78,999 | ||||||||||||||||||
| CareCentrix |
290,785 | 232,717 | — | — | — | — | ||||||||||||||||||
| Intersegment revenues |
(3,600 | ) | (1,683 | ) | — | — | — | — | ||||||||||||||||
| Total revenue |
$ | 1,171,349 | $ | 1,239,536 | $ | 1,152,460 | $ | 561,202 | $ | 594,230 | $ | 1,185,488 | ||||||||||||
| Number of episodes |
216,800 | 246,000 | 274,200 | 134,300 | 142,600 | 282,500 | ||||||||||||||||||
| Revenue per episode |
$ | 2,670 | $ | 2,860 | $ | 3,140 | $ | 3,090 | $ | 3,210 | $ | 3,200 | ||||||||||||
19
| (1) | EBITDA, a measure used by management to evaluate operating performance, is defined as net income excluding discontinued operations, net of tax, plus net interest expense, income tax expense, and depreciation and amortization, less equity in net earnings of affiliate. EBITDA is not a recognized term under GAAP and does not purport to be an alternative to income from continuing operations or net income as a measure of operating performance or cash flows from operating activities as a measure of liquidity. Additionally, EBITDA is not intended to be a measure of free cash flow available for management’s discretionary use, as it does not consider certain cash requirements such as interest payments, tax payments and debt service requirements. Our presentation of EBITDA has limitations as an analytical tool, and you should not consider it in isolation or as a substitute for analysis of our results as reported under GAAP. Management believes EBITDA is helpful in highlighting trends because EBITDA excludes items that are outside management’s immediate control and can differ significantly from company to company depending on long-term strategic decisions regarding capital structure, tax jurisdictions in which companies operate and capital investments. Management uses non-GAAP financial measures to supplement, and not as a substitute for, GAAP results to provide a more complete understanding of the factors and trends affecting the business. |
Adjusted EBITDA is defined as EBITDA further adjusted to exclude restructuring, legal settlement and merger and acquisition costs and other adjustments set forth below. We believe that the inclusion of supplementary adjustments to EBITDA applied in presenting Adjusted EBITDA is appropriate to provide additional information to investors about certain material non-cash items, unusual items that we do not expect to continue at the same level in the future, net cost savings projected to be realized as a result of initiatives taken by management, and the Odyssey acquisition.
Because not all companies use identical calculations, our presentation of EBITDA and Adjusted EBITDA may not be comparable to other similarly titled measures of other companies, including those of Odyssey.
The following table provides a reconciliation from our net income (as reported) to EBITDA and Adjusted EBITDA:
| Fiscal Year Ended | Six Months Ended | Twelve Months Ended |
||||||||||||||||||||||
| ($ in thousands) |
12/30/2007 | 12/28/2008 | 1/3/2010 | 6/28/2009 | 7/4/2010 | 7/4/2010 | ||||||||||||||||||
| Net Income |
$ | 32,828 | $ | 153,450 | $ | 59,182 | $ | 35,117 | $ | 28,244 | $ | 52,309 | ||||||||||||
| Plus: Discontinued operations, net of tax |
(1,242 | ) | (2,004 | ) | 10,614 | 419 | 2,285 | 12,480 | ||||||||||||||||
| Less: Equity in net earnings of affiliate |
— | 35 | (1,072 | ) | (541 | ) | (763 | ) | (1,294 | ) | ||||||||||||||
| Plus: Income tax expense |
22,002 | 28,295 | 39,164 | 19,634 | 21,757 | 41,287 | ||||||||||||||||||
| Pre-Tax Income |
53,588 | 179,776 | 107,888 | 54,629 | 51,523 | 104,782 | ||||||||||||||||||
| Plus: Net interest expense |
24,081 | 17,087 | 6,174 | 4,262 | 2,200 | 4,112 | ||||||||||||||||||
| Plus: Depreciation and amortization |
14,764 | 16,315 | 16,887 | 8,303 | 8,807 | 17,391 | ||||||||||||||||||
| EBITDA |
92,433 | 213,178 | 130,949 | 67,194 | 62,530 | 126,285 | ||||||||||||||||||
| Less: Gain on sale of assets, net(a) |
— | (107,933 | ) | (5,998 | ) | (5,747 | ) | (103 | ) | (354 | ) | |||||||||||||
| Plus: Stock-based compensation(b) |
6,812 | 5,757 | 5,182 | 3,466 | 3,191 | 4,907 | ||||||||||||||||||
| Plus: Special charges(c) |
2,433 | 2,702 | 2,393 | 1,504 | 17,967 | 18,856 | ||||||||||||||||||
| Adjusted EBITDA, including CareCentrix |
101,678 | 113,704 | 132,526 | 66,417 | 83,585 | 149,694 | ||||||||||||||||||
| Less: CareCentrix EBITDA(d) |
(21,302 | ) | (12,352 | ) | — | — | — | — | ||||||||||||||||
| Adjusted EBITDA, excluding CareCentrix |
$ | 80,376 | $ | 101,352 | $ | 132,526 | $ | 66,417 | $ | 83,585 | $ | 149,694 | ||||||||||||
20
| (a) | For fiscal 2008, gain on sale of assets reflects a pre-tax gain of approximately $107.9 million in connection with the disposition of 69% of its equity ownership interest in the Company’s CareCentrix ancillary care benefit management business. |
For the six months ended June 28, 2009 and fiscal 2009, the Company recorded a gain on sales of assets of $5.7 million and $6.0 million, respectively, related to (i) sale of assets and certain branch offices that specialized primarily in pediatric home care services ($5.7 million) and (ii) for the fiscal 2009 period, sale of assets associated with two branch offices in upstate New York providing home health service under New York Medicaid programs ($0.3 million).
For the six months and twelve months ended July 4, 2010, the Company recorded gains on sales of assets of $0.1 million and $0.4 million, respectively relating to (i) assets associated with a home health branch operation in Iowa ($0.1 million) and (ii) for the twelve month period, sale of assets associated with two branch offices in upstate New York providing home health service under New York Medicaid programs ($0.3 million).
| (b) | Represents historical non-cash compensation charges associated with equity based awards. |
| (c) | Selling, general and administrative expenses for fiscal 2007 and fiscal 2008 included special charges of $2.4 million and $2.7 million, respectively, in connection with integration activities relating to the Healthfield acquisition. Charges consisted primarily of severance costs and other costs related to back office and system integration as well as professional fees and other costs associated with the Company’s merger and acquisition activities. |
Selling, general and administrative expenses for the six months ended June 28, 2009 and fiscal 2009 included special charges of $1.5 million and $2.4 million, respectively, in connection with restructuring and integration activities, as well as professional fees and other costs associated with the Company’s merger and acquisition activities.
Selling, general and administrative expenses for the six months and twelve months ended July 4, 2010 included special charges of $18.0 million and $18.9 million, respectively. These charges included for both periods (a) legal settlements of $13.7 million consisting of (i) settlement costs and legal fees of $4.2 million related to a three-year old commercial contractual dispute involving the Company’s former subsidiary, CareCentrix and (ii) incremental charges of $9.5 million in connection with an agreement in principle, subject to final approvals, between the Company and the federal government to resolve matters which were subject to a 2003 subpoena relating to the Company’s cost reports for the 1998 to 2000 periods and (b) restructuring and merger and acquisition costs of $4.3 million and $5.2 million for the six month and twelve month periods ending July 4, 2010, respectively.
| (d) | Effective September 25, 2008, the Company completed the disposition of 69 percent of its equity ownership interest in the Company’s CareCentrix ancillary care benefit management business. For the third quarter and first nine months of 2008, the Company recorded a pre-tax gain of approximately $107.9 million, net of transaction-related costs of approximately $6.5 million, in connection with the sale. The Company’s fiscal 2008 results of operations include the CareCentrix operating results through September 24, 2008 and include the Company’s equity in the net earnings of CareCentrix Holdings for all subsequent periods. |
| (2) | Capital expenditures and depreciation and amortization expense exclude the following amounts of capital expenditures and depreciation and amortization expense related to the Company’s discontinued operations: |
| Fiscal Year Ended | Six Months Ended | Twelve Months Ended | ||||||||||||||||
| ($ in thousands) |
12/30/2007 | 12/28/2008 | 1/3/2010 | 6/28/2009 | 7/4/2010 | 7/4/2010 | ||||||||||||
| Capital expenditures |
$ | 5,223 | $ | 5,124 | $ | 5,823 | $ | 2,667 | $ | — | $ | 3,156 | ||||||
| Depreciation |
5,020 | 5,501 | 5,681 | 2,728 | — | 2,953 | ||||||||||||
| Amortization |
229 | 228 | 229 | 114 | — | 115 | ||||||||||||
| Total depreciation and amortization |
$ | 5,249 | $ | 5,729 | $ | 5,910 | $ | 2,842 | $ | — | $ | 3,068 | ||||||
There were no capital expenditures or depreciation and amortization expense for the first six months of 2010 as the assets were treated as held for sale as of January 3, 2010.
21
Summary Historical Consolidated Financial Data of Odyssey HealthCare, Inc.
The following table states summary historical consolidated financial data of Odyssey HealthCare, Inc., which, for the years ended December 31, 2009, 2008 and 2007, is derived from its audited consolidated financial statements and notes thereto, and, for the six months ended June 30, 2009 and 2010, is derived from its unaudited consolidated financial statements and notes thereto. The historical consolidated financial data for the twelve months ended June 30, 2010 is derived from both its audited consolidated financial statements and its unaudited consolidated financial statements and the respective notes thereto. The historical consolidated statement of income data, statement of cash flows data and balance sheet data for each fiscal year in the three-year year period ended December 31, 2009 included in the following table have been derived from Odyssey’s audited consolidated financial statements. The summary historical consolidated financial data as of and for the six months ended June 30, 2009 and 2010 and the twelve months ended June 30, 2010 reflects all normal and recurring adjustments that, in the opinion of Odyssey’s management, are necessary for a fair presentation of our results of operations and financial position. Results for the six months ended June 30, 2010 are not necessarily indicative of the results to be expected for the full year. The historical results indicated below and elsewhere in this exhibit are not necessarily indicative of Odyssey’s future performance. The following summary historical consolidated financial data should be read together with Odyssey’s consolidated financial statements and notes thereto as well as “Management’s Discussion and Analysis of Financial Condition and Results of Operations” contained in Odyssey’s Annual Report on Form 10-K for the year ended December 31, 2009 and Odyssey’s Quarterly Report on Form 10-Q for the quarter ended June 30, 2010.
22
| Year Ended | Six Months Ended | Twelve Months Ended |
||||||||||||||||||||||
| ($ in thousands) |
December 31, 2007 |
December 31, 2008 |
December 31, 2009 |
June 30, 2009 (unaudited) |
June 30, 2010 (unaudited) |
June 30, 2010 (unaudited) |
||||||||||||||||||
| Statement of Income Data: |
||||||||||||||||||||||||
| Net patient service revenue |
$ | 398,232 | $ | 616,050 | $ | 686,438 | $ | 337,827 | $ | 347,723 | $ | 696,334 | ||||||||||||
| Operating expenses: |
||||||||||||||||||||||||
| Direct hospice care |
233,664 | 361,445 | 396,774 | 197,899 | 194,433 | 393,308 | ||||||||||||||||||
| General and administrative |
131,788 | 199,292 | 199,069 | 100,577 | 99,518 | 198,010 | ||||||||||||||||||
| Provision for uncollectible accounts |
5,344 | 10,907 | 11,490 | 4,869 | 2,410 | 9,031 | ||||||||||||||||||
| Depreciation and amortization |
5,723 | 7,868 | 6,725 | 3,001 | 3,514 | 7,238 | ||||||||||||||||||
| Total operating expenses |
376,519 | 579,512 | 614,058 | 306,346 | 299,875 | 607,587 | ||||||||||||||||||
| Income from continuing operations before other income (expense) |
21,713 | 36,538 | 72,380 | 31,481 | 47,848 | 88,747 | ||||||||||||||||||
| Other income (expense): |
||||||||||||||||||||||||
| Interest income |
2,509 | 1,968 | 479 | 287 | 170 | 362 | ||||||||||||||||||
| Interest expense |
(208 | ) | (7,430 | ) | (6,574 | ) | (3,491 | ) | (2,872 | ) | (5,955 | ) | ||||||||||||
| Income from continuing operations before provision for income taxes |
24,014 | 31,076 | 66,285 | 28,277 | 45,146 | 83,154 | ||||||||||||||||||
| Provision for income taxes |
8,001 | 11,141 | 24,583 | 10,347 | 17,090 | 31,326 | ||||||||||||||||||
| Income from continuing operations |
16,013 | 19,935 | 41,702 | 17,930 | 28,056 | 51,828 | ||||||||||||||||||
| Loss from discontinued operations, net of income taxes |
(3,888 | ) | (5,252 | ) | (498 | ) | (475 | ) | (197 | ) | (220 | ) | ||||||||||||
| Net income |
12,125 | 14,683 | 41,204 | 17,455 | 27,859 | 51,608 | ||||||||||||||||||
| Less: net income attributable to noncontrolling interests |
14 | 257 | 613 | 217 | 482 | 878 | ||||||||||||||||||
| Net income attributable to Odyssey stockholders |
$ | 12,111 | $ | 14,426 | $ | 40,591 | $ | 17,238 | $ | 27,377 | $ | 50,730 | ||||||||||||
| Statement of Cash Flows Data: |
||||||||||||||||||||||||
| Cash flows provided by operating activities |
12,814 | 21,049 | 81,650 | 21,530 | 25,565 | 85,685 | ||||||||||||||||||
| Cash flows provided by investing activities |
4,391 | (97,187 | ) | (4,083 | ) | (3,556 | ) | 10,630 | 10,103 | |||||||||||||||
| Cash flows provided by financing activities |
(12,391 | ) | 119,795 | (4,978 | ) | (3,310 | ) | (326 | ) | (1,994 | ) | |||||||||||||
| Balance Sheet Data: |
||||||||||||||||||||||||
| Cash and cash equivalents |
12,386 | 56,043 | 128,632 | 70,707 | 164,501 | 164,501 | ||||||||||||||||||
| Working capital |
75,275 | 82,429 | 100,280 | 91,406 | 147,178 | 147,178 | ||||||||||||||||||
| Total assets |
275,209 | 460,951 | 503,004 | 468,927 | 520,775 | 520,775 | ||||||||||||||||||
| Total debt |
1 | 123,075 | 115,202 | 119,878 | 110,468 | 110,468 | ||||||||||||||||||
| Total Odyssey stockholders’ equity |
182,837 | 200,071 | 248,751 | 219,221 | 282,979 | 282,979 | ||||||||||||||||||
| Other Financial Data: |
||||||||||||||||||||||||
| EBITDA(1) |
27,436 | 44,406 | 79,105 | 34,482 | 51,362 | 95,985 | ||||||||||||||||||
| Adjusted EBITDA(1) |
39,040 | 56,823 | 84,598 | 36,937 | 54,722 | 102,383 | ||||||||||||||||||
| Capital expenditures, net |
9,628 | 4,428 | 6,638 | 3,351 | 1,804 | 5,091 | ||||||||||||||||||
| Depreciation and amortization |
5,723 | 7,868 | 6,725 | 3,001 | 3,514 | 7,238 | ||||||||||||||||||
| Operating Data (Unaudited): |
||||||||||||||||||||||||
| Number of Medicare-certified hospice programs(2) |
72 | 94 | 90 | 92 | 92 | 92 | ||||||||||||||||||
| Admissions(3) |
32,757 | 46,772 | 49,513 | 25,233 | 25,213 | 49,493 | ||||||||||||||||||
| Days of care(4) |
2,791,780 | 4,212,771 | 4,518,617 | 2,213,112 | 2,254,575 | 4,560,080 | ||||||||||||||||||
| Average daily census(5) |
7,649 | 11,510 | 12,380 | 12,227 | 12,456 | 12,493 | ||||||||||||||||||
23
| (1) | EBITDA, a measure used by management to evaluate operating performance, is defined as net income excluding discontinued operations, net of tax, plus net interest expense, provision for income taxes, and depreciation and amortization. EBITDA is not a recognized term under GAAP and does not purport to be an alternative to net income as a measure of operating performance or cash flows from operating activities as a measure of liquidity. Additionally, EBITDA is not intended to be a measure of free cash flow available for management’s discretionary use, as it does not consider certain cash requirements such as interest payments, tax payments and debt service requirements. Our presentation of EBITDA has limitations as an analytical tool, and you should not consider it in isolation or as a substitute for analysis of our results as reported under GAAP. Management believes EBITDA is helpful in highlighting trends because EBITDA excludes items that are outside management’s immediate control and can differ significantly from company to company depending on long-term strategic decisions regarding capital structure, tax jurisdictions in which companies operate and capital investments. Management uses non-GAAP financial measures to supplement, and not as a substitute for, GAAP results to provide a more complete understanding of the factors and trends affecting the business. |
Adjusted EBITDA is defined as EBITDA further adjusted to exclude special charges and other adjustments set forth below. We believe that the inclusion of supplementary adjustments to EBITDA applied in presenting Adjusted EBITDA is appropriate to provide additional information to investors about certain material non-cash items, unusual items that we do not expect to continue at the same level in the future and net cost savings projected to be realized as a result of initiatives taken by management.
Because not all companies use identical calculations, our presentation of EBITDA and Adjusted EBITDA may not be comparable to other similarly titled measures of other companies, including those of Gentiva.
| Six Months Ended | Twelve months ended | ||||||||||||||||||
| Year Ended | June 30, | June 30, | June 30, | ||||||||||||||||
| (in thousands) |
December 31, 2007 |
December 31, 2008 |
December 31, 2009 |
2009 (unaudited) |
2010 (unaudited) |
2010 (unaudited) | |||||||||||||
| Net income |
$ | 12,125 | $ | 14,683 | $ | 41,204 | $ | 17,455 | $ | 27,859 | $ | 51,608 | |||||||
| Plus: Discontinued operations, net of tax |
3,888 | 5,252 | 498 | 475 | 197 | 220 | |||||||||||||
| Plus: Provision for income taxes |
8,001 | 11,141 | 24,583 | 10,347 | 17,090 | 31,326 | |||||||||||||
| Pre-Tax Income |
24,014 | 31,076 | 66,285 | 28,277 | 45,146 | 83,154 | |||||||||||||
| Plus: Net interest expense |
(2,301 | ) | 5,462 | 6,095 | 3,204 | 2,702 | 5,593 | ||||||||||||
| Plus: Depreciation and amortization |
5,723 | 7,868 | 6,725 | 3,001 | 3,514 | 7,238 | |||||||||||||
| EBITDA |
27,436 | 44,406 | 79,105 | 34,482 | 51,362 | 95,985 | |||||||||||||
| Plus: Loss on disposal of assets (a) |
211 | 150 | 410 | — | 3 | 413 | |||||||||||||
| Plus: Stock-based compensation |
3,829 | 4,347 | 5,083 | 2,455 | 3,357 | 5,985 | |||||||||||||
| Plus: Special charges (b) |
7,564 | 7,920 | — | — | — | — | |||||||||||||
| Adjusted EBITDA |
$ | 39,040 | $ | 56,823 | $ | 84,598 | $ | 36,937 | $ | 54,722 | $ | 102,383 | |||||||
| (a) | Represents the write-off of various property and equipment. |
| (b) | Represents excess facility lease costs, costs relating to Certificates of Need, severance costs and training and system conversion costs in 2007. Represents wind-down of VistaCare’s corporate office and integration of VistaCare’s operation ($5.7 million) and other nonrecurring expenses ($2.2 million) in 2008. |
| (2) | Number of Medicare-certified hospice programs at end of the respective year. |
| (3) | Represents the total number of patients admitted into Odyssey’s hospice programs during the period. |
| (4) | Represents the total days of care provided to Odyssey’s patients during the period. |
| (5) | Represents the average number of patients for whom Odyssey provided hospice care each day during the period and is computed by dividing days of care by the number of days during the period. |
24
RISK FACTORS
Risks Related to Our Business and Industry
We may not be able to successfully integrate Odyssey and other businesses that we may acquire in the future with Gentiva.
Our ability to successfully implement our business plan and achieve targeted financial results is dependent on our ability to successfully integrate Odyssey and other businesses that we may acquire in the future with Gentiva. The process of integrating Odyssey, or any other acquired businesses, involves risks. These risks include, but are not limited to:
| • | demands on management related to the significant increase in the size of our business; |
| • | diversion of management’s attention from the management of daily operations; |
25
| • | difficulties in the assimilation of different corporate cultures and business practices; |
| • | difficulties in conforming the acquired company’s accounting policies to ours; |
| • | retaining employees that may be vital to the integration of departments, information technology systems, including accounting systems, technologies, books and records, and procedures, and maintaining uniform standards, such as internal accounting controls, procedures, and policies; and |
| • | costs and expenses associated with any undisclosed or potential liabilities. |
Failure to successfully integrate Odyssey, or any other acquired businesses, may result in reduced levels of revenue, earnings, or operating efficiency than might have been achieved if we had not acquired such businesses.
In addition, the Merger will result, and any future acquisitions could result, in the incurrence of additional debt and related interest expense, contingent liabilities, and amortization expenses related to intangible assets, which could have a material adverse effect on our financial condition, operating results, and cash flow.
We may not be able to achieve the benefits that we expect to realize as a result of the Merger or other future acquisitions. Failure to achieve such benefits could have an adverse effect on our financial condition and results of operations.
We may not be able to realize anticipated cost savings, revenue enhancements, or other synergies from the Merger or other future acquisitions, either in the amount or within the time frame that we expect. In addition, the costs of achieving these benefits may be higher than, and the timing may differ from, what we expect. Our ability to realize anticipated cost savings, synergies, and revenue enhancements may be affected by a number of factors, including, but not limited to, the following:
| • | the use of more cash or other financial resources on integration and implementation activities than we expect; |
| • | increases in other expenses unrelated to the acquisition, which may offset the cost savings and other synergies from the acquisition; |
| • | our ability to eliminate duplicative back office overhead and redundant selling, general, and administrative functions; and |
| • | our ability to avoid labor disruptions in connection with any integration, particularly in connection with any headcount reduction. |
Specifically, while we expect the acquisition of Odyssey to create significant opportunities to reduce our combined operating costs, these cost savings reflect estimates and assumptions made by our management, and it is possible that our actual results will not reflect these estimates and assumptions within our anticipated timeframe or at all.
If we fail to realize anticipated cost savings, synergies, or revenue enhancements, our financial results may be adversely affected, and we may not generate the cash flow from operations that we anticipate. See note 1(c) under the caption “Summary Unaudited Pro Forma Condensed Consolidated Financial Data.”
Our growth strategy may not be successful.
The future growth of our business and our future financial performance will depend on, among other things, our ability to increase our revenue base through a combination of internal growth and strategic ventures, including acquisitions. Future revenue growth cannot be assured, as it is subject to various risk factors, including:
| • | our ability to achieve anticipated operational benefits, including leveraging referral sources; |
| • | the effects of competition; |
26
| • | pending initiatives concerning the levels of Medicare, Medicaid and private health insurance reimbursement and uncertainty concerning reimbursements in the future; |
| • | our ability to generate new and retain existing contracts with major payer sources; |
| • | our ability to attract and retain qualified personnel, especially in a business environment experiencing a shortage of clinical professionals; |
| • | our ability to identify, negotiate and consummate desirable acquisition opportunities on reasonable terms; |
| • | our ability to integrate effectively and retain the business acquired by us through acquisitions we have made or may make; and |
| • | the requirement for obtaining certificates of need. |
An element of our growth strategy is expansion of our business by developing new hospice programs in new markets and growth in our existing markets. This aspect of our growth strategy may not be successful, which could adversely impact our growth and profitability. We cannot assure you that we will be able to:
| • | identify markets that meet our selection criteria for new hospice programs; |
| • | hire and retain a qualified management team to operate each of our new hospice programs; |
| • | manage a large and geographically diverse group of hospice programs; |
| • | become Medicare and Medicaid certified in new markets; |
| • | generate sufficient hospice admissions in new markets to operate profitably in these new markets; or |
| • | compete effectively with existing programs in new markets. |
According to MedPAC, an estimated 35% of hospice programs in the United States are not-for-profit programs. Accordingly, it is likely that a number of acquisition opportunities may involve hospices operated by not-for-profit entities. In recent years, several states have increased review and oversight of transactions involving the sale of healthcare facilities and businesses by not-for-profit entities. Although the level of review varies from state to state, the current trend is to provide for increased governmental review, and in some cases approval, of transactions in which a not-for-profit entity sells a healthcare facility or business. This increased scrutiny may increase the difficulty in completing, or prevent the completion of acquisitions in some states in the future.
Competition among home healthcare and hospice companies is intense.
The home health and hospice services industry is highly competitive. We compete with a variety of other companies in providing home health services and hospice services, some of which may have greater financial and other resources and may be more established in their respective communities. Competing companies may offer newer or different services from those offered by us and may thereby attract customers who are presently receiving our home health or hospice services.
Hospice care in the United States is highly competitive. In many areas in which our hospice programs are located, we compete with a large number of organizations, including:
| • | community-based hospice providers; |
| • | national and regional companies; |
| • | hospital-based hospice and palliative care programs; |
| • | nursing homes; and |
| • | home health agencies. |
27
Some of our current and potential competitors have or may obtain significantly greater financial and marketing resources than us. Various healthcare companies have diversified into the hospice market. For example, a few large healthcare providers, including Golden Living (formerly Beverly Enterprises, Inc.) and Manor Care, Inc., have entered the hospice business directly or through affiliates. Relatively few barriers to entry exist in our local markets. Accordingly, other companies, including hospitals and other healthcare organizations that are not currently providing hospice care, may expand their services to include hospice care or similar services. We may encounter increased competition in the future that could negatively impact patient referrals to us, limit our ability to maintain or increase our market position and adversely affect our profitability.
If we are unable to maintain relationships with existing patient referral sources or to establish new referral sources, our growth and profitability could be adversely affected.
Our success is heavily dependent on referrals from physicians, nursing homes, assisted living facilities, adult care centers, hospitals, managed care companies, insurance companies and other patient referral sources in the communities that our home health and hospice locations serve, as well as on our ability to maintain good relations with these referral sources. Our referral sources are not contractually obligated to refer home health or hospice patients to us and may refer their patients to other home health or hospice care providers, or not at all. Our growth and profitability depends significantly on our ability to provide good patient and family care, to establish and maintain close working relationships with these patient referral sources and to increase awareness and acceptance of hospice care by our referral sources and their patients. We cannot assure you that we will be able to maintain our existing referral source relationships or that we will be able to develop and maintain new relationships in existing or new markets. Our loss of existing relationships or our failure to develop new relationships could adversely affect our ability to expand our operations and operate profitably. Moreover, we cannot assure you that awareness or acceptance of hospice care will increase.
Many states have certificate of need laws or other regulatory provisions that may adversely impact our ability to expand into new markets and thereby limit our ability to grow and to increase our net patient service revenue.
Many states have enacted certificate of need laws that require prior state approval to open new healthcare facilities or expand services at existing facilities. Those laws require some form of state agency review or approval before a hospice may add new services or undertake significant capital expenditures. New York has additional barriers to entry. New York places restrictions on the corporate ownership of hospices. Accordingly, our ability to operate in New York is restricted. These laws could adversely affect our ability to expand into new markets and to expand our services and facilities in existing markets.
The cost of healthcare is funded substantially by government and private insurance programs. If this funding is reduced or becomes limited or unavailable to our customers, our business may be adversely impacted.
Third-party payers include Medicare, Medicaid and private health insurance providers. Third-party payers are increasingly challenging prices charged for healthcare services. We cannot assure you that our services will be considered cost-effective by third-party payers, that reimbursement will be available or that payer reimbursement policies will not have a material adverse effect on our ability to sell our services on a profitable basis, if at all. We cannot control reimbursement rates, including Medicare market basket or other rate adjustments. On March 23, 2010, the President signed into law the Patient Protection and Affordable Care Act, and, on March 30, 2010, the President signed into law the Health Care and Education Reconciliation Act of 2010 (collectively the “Health Care Reform Act”). The Health Care Reform Act mandates important changes to reimbursement for home health and hospice, including reductions in reimbursement levels. On July 23, 2010, CMS published its proposed Home Health Prospective Payment System update for Calendar Year 2011 (“Proposed 2011 Home Health Rule”). CMS proposes an overall reduction in home health payments of 4.75%, which includes a reduction for each 60-day episode and the conversion factor for non-routine medical supplies of 3.79%, which is also proposed for 2012. There can be no assurance these proposed changes will not adversely affect the Company.
28
Possible changes in the case-mix of patients, as well as payer mix and payment methodologies, may have a material adverse effect on our profitability.
The sources and amounts of our patient revenues will be determined by a number of factors, including the mix of patients and the rates of reimbursement among payers. Changes in the case-mix of the patients as well as payer mix among private pay, Medicare and Medicaid may significantly affect our profitability. In particular, any significant increase in our Medicaid population or decrease in Medicaid payments could have a material adverse effect on our financial position, results of operations and cash flow, especially if states operating these programs continue to limit, or more aggressively seek limits on, reimbursement rates or service levels.
Further consolidation of managed care organizations and other third-party payers may adversely affect our profits.
Managed care organizations and other third-party payers have continued to consolidate in order to enhance their ability to influence the delivery of healthcare services. Consequently, the healthcare needs of a large percentage of the United States population are increasingly served by a smaller number of managed care organizations. These organizations generally enter into service agreements with a limited number of providers for needed services. To the extent that such organizations terminate us as a preferred provider and/or engage our competitors as preferred or exclusive providers, our business could be adversely affected. In addition, private payers, including managed care payers, could seek to negotiate additional discounted fee structures or the assumption by healthcare providers of all or a portion of the financial risk through prepaid capitation arrangements, thereby potentially reducing our profitability.
The healthcare industry continues to experience shortages in qualified home health service employees and management personnel.
We compete with other healthcare providers for our employees, both clinical associates and management personnel. As the demand for home health services and hospice services continues to exceed the supply of available and qualified staff, we and our competitors have been forced to offer more attractive wage and benefit packages to these professionals. Furthermore, the competitive arena for this shrinking labor market has created turnover as many seek to take advantage of the supply of available positions, each offering new and more attractive wage and benefit packages.
In addition to the wage pressures inherent in this environment, the cost of training new employees amid the turnover rates may cause added pressure on our operating margins.
An economic downturn, state budget pressures, rising unemployment and continued deficit spending by the federal government may result in a reduction in reimbursement and covered services.
An economic downturn can have a detrimental effect on our revenues. Historically, state budget pressures have translated into reductions in state spending. Given that Medicaid outlays are a significant component of state budgets, we can expect continuing cost containment pressures on Medicaid outlays for our services in the states in which we operate. In addition, an economic downturn, coupled with increased unemployment, may also impact the number of enrollees in managed care programs as well as the profitability of managed care companies, which could result in reduced reimbursement rates.
The existing federal deficit, as well as deficit spending by the government as the result of adverse developments in the economy, the war in Iraq and Afghanistan or other reasons, can lead to continuing pressure
29
to reduce government expenditures for other purposes, including government-funded programs in which we participate, such as Medicare and Medicaid. Such actions in turn may adversely affect our results of operations.
We may experience disruption to our business and operations from the effects of natural disasters or terrorist acts.
The occurrence of natural disasters, terrorist acts or “mass illnesses” such as the pandemic flu, and the erosion to our business caused by such an occurrence, may adversely impact our profitability. In the affected areas, our offices may be forced to close for limited or extended periods of time, and we may face the reduced availability of clinical associates.
If an impairment of goodwill or intangible assets were to occur, our earnings would be negatively impacted.
Goodwill and intangible assets represent a significant portion of our assets as a result of acquisitions. Goodwill and intangible assets amounted to $304.1 million and $253.1 million, respectively, at July 4, 2010 and, pro forma for the Transactions, would have amounted to $1,100.0 million and $413.1 million, respectively at July 4, 2010. We have assigned to our reportable business segments the appropriate amounts of goodwill and intangible assets based upon allocations of the purchase prices of individual acquisition transactions. As described in the notes to the financial statements contained in our Annual Report on Form 10-K for the year ended January 3, 2010 and our Quarterly Report on Form 10-Q for the quarter ended July 4, 2010 and in “Unaudited Pro Forma Condensed Consolidated Financial Information,” these assigned values are reviewed on an annual basis or at the time events or circumstances indicate that the carrying amount of an asset may not be recoverable. We performed an impairment test of goodwill in connection with the classification of our HME and IV businesses as held for sale. The impairment test indicated that the fair value of those operating units less costs to sell were lower than the carrying value and as such, we recorded a write-down of goodwill of approximately $9.6 million in discontinued operations, net of tax for fiscal 2009. Should business conditions or other factors deteriorate and negatively impact the estimated realizable value of future cash flows of our business segments, we could be required to write off a substantial portion of our assets. Depending upon the magnitude of the write-off, our results of operations could be negatively affected.
If we must write off a significant amount of long-lived assets, our earnings will be negatively impacted.
We have long-lived assets consisting of fixed assets, which include software development costs related to various information technology systems, including a new clinical management system. The net carrying value of fixed assets amounted to $65.9 million at January 3, 2010, which include deferred software developments costs of $37.0 million related to our LifeSmart clinical management system. During fiscal 2009, we began depreciating our clinical management software, on a straight-line basis utilizing a seven year useful life, at the time that the technology became available in a branch for its intended use. We review these amounts on an annual basis or at the time events or circumstances indicate that the carrying amount of an asset may not be recoverable. If a determination that a significant impairment in value of our unamortized long-lived assets occurs, such determination could require us to write off a substantial portion of our assets. Depending upon the magnitude of the write-off, our financial results could be negatively affected.
There are risks of business disruption and cost overruns associated with new business systems and technology initiatives.
During 2010, we expect to continue implementing a new clinical management system for use in our home health business. This system will involve the use of handheld devices by our clinical associates who provide care to our patients. The continued rollout and future development of this system involve substantial costs relating to salaries and benefits and consulting, travel and training costs. Implementation and future development costs in excess of expectations or the failure of new systems and other technology initiatives to operate in accordance with expectations could have a material adverse impact on our financial results and operations.
30
A prolonged disruption of the capital and credit markets may adversely affect our future access to capital and our cost of capital.
The continued volatility and disruption of the capital and credit markets in the United States have adversely affected the access to capital and increased the cost of capital. We have used the capital and credit markets for liquidity and to execute our business strategies, which include increasing our revenue base through a combination of internal growth and strategic ventures, including acquisitions. We believe that, after giving effect to the Transactions, we will have adequate capital and liquidity to conduct any foreseeable initiatives that may develop over the near term; however, should current economic and market conditions continue or deteriorate further, our future cost of debt or equity capital and future access to capital markets may be adversely affected.
We have risks related to obligations under our insurance programs.
We are obligated for certain costs under various insurance programs, including employee health and welfare, workers’ compensation, auto and professional liability. We may be subject to workers’ compensation claims and lawsuits alleging negligence or other similar legal claims. We maintain various insurance programs to cover these risks with insurance policies subject to substantial deductibles and retention amounts. We also may be subject to exposure relating to employment law and other related matters for which we do not maintain insurance coverage. We believe that our present insurance coverage and reserves are sufficient to cover currently estimated exposures; however, should we experience a significant increase in losses resulting from workers’ compensation. professional liability or employee health and welfare claims, the resulting increase in provisions and/or required reserves could negatively affect our profitability.
An adverse ruling against us in certain litigation could have an adverse effect on our financial condition and results of operations.
We are involved in litigation incidental to the conduct of our business currently and from time to time, including three recently filed collective and class action complaints alleging violations by the Company of the Federal Fair Labor Standards Act. The damages claimed against us in certain litigation are substantial.
We cannot assure you that we will prevail in the pending cases. In addition to the possibility of an adverse outcome, such litigation is costly to manage, investigate and defend, and the related defense costs, diversion of management’s time and related publicity may adversely affect the conduct of our business and the results of our operations.
Risks Related to Healthcare Regulation
Federal or state healthcare reform laws could adversely affect our operating results and financial condition.
In March 2010, President Obama signed into law the Health Care Reform Act. This culmination of a year-long legislative process will have a significant impact on the health care delivery system. Much of that impact, specifically as related to home health services and hospice services, is unknown.
The Health Care Reform Act, among other things, sets out a plan for a type of universal healthcare coverage. A number of states, including California, Colorado, Connecticut, Massachusetts, New York and Pennsylvania, are also contemplating significant reform of their health insurance markets. Other states have
31
mounted legal challenges to the implementation of certain aspects of the health care reform bill in their respective states. The Health Care Reform Act, along with possible changes at the state level, will affect both public programs and privately-financed health insurance arrangements. Both the new federal law and the state proposals will increase the number of insured persons by expanding the eligibility levels for public programs and compelling individuals and employers to purchase health coverage. At the same time, these laws seek to reform the underwriting and marketing practices of health plans. These laws could further increase pricing pressure on existing commercial payors. As a result, commercial payers may likely seek to lower their rates of reimbursement for the services we provide. The state proposals are still being debated in various legislatures and the legal challenges to the Health Care Reform Act are in their earliest stages.
The Health Care Reform Act mandates changes to home health and hospice benefits under Medicare. For home health, the Health Care Reform Act mandates creation of a value-based purchasing program, development of quality measures, a decrease in home health reimbursement beginning with federal fiscal year 2014 that will be phased-in over a four-year period, and a reduction in the outlier cap. In addition, the Health Care Reform Act requires the Secretary of Health and Human Services to test different models for delivery of care, some of which would involve home health services. It also requires the Secretary to establish a national pilot program for integrated care for patients with certain conditions, bundling payment for acute hospital care, physician services, outpatient hospital services (including emergency department services), and post-acute care services, which would include home health. The Health Care Reform Act further directs the Secretary to rebase payments for home health, which will result in a decrease in home health reimbursement beginning in 2013 that will be phased-in over a four-year period. The Secretary is also required to conduct a study to evaluate cost and quality of care among efficient home health agencies regarding access to care and treating Medicare beneficiaries with varying severity levels of illness, and provide a report to Congress no later than March 1, 2011. Beginning October 1, 2012, the annual market basket rate increase for hospice providers will be reduced by a formula that could cause payment rates to be lower than in the prior year.
Also included in the Health Care Reform Act are requirements that before certifying a patient for home heath services, the certifying physician must document that the physician or a non-physician practitioner under the direction of the physician must have a face-to-face encounter with the patient. In its Proposed 2011 Home Health Rule, CMS proposed regulations that would require a physician, or nurse practitioner, clinical nurse or physician assistant under the direction of the physician, to have a face-to-face encounter with the patient within 30 days of the home health start date in order to certify home health services. If the face-to-face encounter did not primarily relate to the reason for the home health services, there must be another face-to-face encounter within 2 weeks of the start date. Beginning January 1, 2011, in order to recertify a patient for an additional 180 days, a hospice physician or nurse practitioner must have a face-to-face encounter with the patient no more than 15 days prior to the 180-day recertification to document eligibility.
Given the recent enactment of the Health Care Reform Act, and taking into account proposed state reforms and possible legal challenges, we cannot predict how our business will be affected by the full implementation of these and future actions. The Health Care Reform Act, in connection with state initiatives, may increase our costs, decrease our revenues, expose us to expanded liability or require us to revise the ways in which we conduct our business, any of which could adversely affect our operating results and financial condition.
Legislative and regulatory actions resulting in changes in reimbursement rates or methods of payment from Medicare and Medicaid, or implementation of other measures to reduce reimbursement for our services, may have a material adverse effect on our revenues and operating margins. Reimbursement to us for our hospice services is subject to Medicare cap amounts, which are calculated by Medicare.
In fiscal 2009, 82% of Gentiva’s total net revenues were generated from Medicare and Medicaid and Local Government programs and in fiscal 2009, 97% of Odyssey’s net patient service revenue consisted of payments paid primarily on a per diem basis, from the Medicare and Medicaid programs. The healthcare industry is experiencing a trend toward cost containment, as the government seeks to stabilize or reduce reimbursement and utilization rates.
32
In addition, the timing of payments made under these programs is subject to regulatory action and governmental budgetary constraints. For certain Medicaid programs, the time period between submission of claims and payment has increased. Further, within the statutory framework of the Medicare and Medicaid programs, there are a substantial number of areas subject to administrative rulings and interpretations that may further affect payments made under those programs. Additionally, the federal and state governments may in the future reduce the funds available under those programs or require more stringent utilization and quality reviews of providers. These pressures may be increased as a result of the Health Care Reform Act. Moreover, we cannot assure you that adjustments from regulatory actions or Medicare or Medicaid audits, including the payment of fines or penalties to the federal or state governments, will not have a material adverse effect on our liquidity or profitability.
Overall payments made by Medicare to us for hospice services are subject to cap amounts calculated by Medicare. Total Medicare payments to us for hospice services are compared to the cap amount for the hospice cap period, which runs from November 1 of one year through October 31 of the next year. CMS usually announces the cap amount in the month of July or August in the cap period and not at the beginning of the cap period. We must estimate the cap amount for the cap period before CMS announces the cap amount and are at risk if our estimate exceeds the later announced cap amount. CMS can also make retroactive adjustments to cap amounts announced for prior cap periods. Payments to us in excess of the cap amount must be returned by us to Medicare. On July 23, 2010, CMS announced that the Medicare cap is $23,875 for the 2010 cap year, which is from November 1, 2009 through October 31, 2010. A second hospice cap amount limits the number of days of inpatient care to not more than 20 percent of total patient care days within the cap period.
As part of its review of the Medicare hospice benefit, MedPAC recommended to Congress in its 2009 MedPAC Report that Congress direct the Secretary of Health and Human Services to change the Medicare payment system for hospice to:
| • | have relatively higher payments per day at the beginning of a patient’s hospice care and relatively lower payments per day as the length of the duration of the hospice patient’s stay increases; |
| • | include relatively higher payments for the costs associated with patient death at the end of the hospice patient’s stay; and |
| • | implement the payment system changes in 2013, with a brief transitional period. |
In its 2009 MedPAC Report, MedPAC estimated that these changes would result in a reduction in aggregate payments to for-profit hospices of between 3.2% and 5.0%.
On January 14, 2010 MedPAC voted to recommend that the Congress should reduce the annual market basket update for hospice providers on October 1, 2010 by MedPAC’s adjustment for productivity growth, which is estimated to be 1.3%. In addition, the Health Care Reform Act includes several provisions that would adversely impact hospice providers, including a provision to reduce the annual market basket update for hospice providers by a productivity adjustment. We cannot predict at this time whether the recommendations included in the 2009 MedPAC Report or the recommendation approved by MedPAC on January 14, 2010 will be enacted or whether any additional healthcare reform initiatives will be implemented or whether the Health Care Reform Act or other changes in the administration of governmental healthcare programs or interpretations of governmental policies or other changes affecting the healthcare system will adversely affect our revenues. Further, due to budgetary concerns, several states have considered or are considering reducing or eliminating the Medicaid hospice benefit. Reductions or changes in Medicare or Medicaid funding could significantly reduce our net patient service revenue and our profitability
On July 16, 2010, CMS announced proposed changes to Medicare home health payments for calendar year 2011 and 2012 which, if implemented, would represent a net decrease in reimbursement of approximately 4.75%. The proposed reimbursement changes consist of (i) a 2.4% positive market basket update, (ii) a 1.0% reduction to
33
the market basket update as directed by the Health Care Reform Act, (iii) a 2.5% reduction in the base rate to reverse the 2010 benefit resulting from changes in the home health outlier policy, (iv) fractional benefits resulting from the fourth quarter of the rural add-on provision which was implemented on April 1, 2010 (an incremental 0.15%) and wage index updates and (v) a case-mix creep adjustment of 3.79%, instead of the expected reduction of 2.71%. In addition, CMS proposed an additional fifth year case-mix creep adjustment of 3.79% in 2012 and various other changes to promote efficiency in payment and program integrity. CMS warned that if case-mix creep continues, it will impose further payment reductions that will not be phased in. The payment reduction for case-mix creep results from a CMS study that identified increases in case-mix are due to improved coding, coding practice changes, and other behavioral responses to the change in reimbursement that went into effect in 2008, including greater use of high therapy treatment plans, above what CMS believes is any increase in patient acuity. Home health companies such as ours that provide services to higher acuity patients may be adversely impacted. The CMS proposal is subject to a comment period, with a final rule expected to be issued during the fourth quarter of 2010.
Reductions in amounts paid by government programs for our services or changes in methods or regulations governing payments could cause our net patient service revenue and profits to materially decline.
Approximately 35% of our hospice patients reside in nursing homes. Changes in the laws and regulations regarding payments for hospice services and “room and board” provided our hospice patients residing in nursing homes could reduce our net patient service revenue and profitability.
For hospice patients receiving nursing home care under certain state Medicaid programs who elect hospice care under Medicare or Medicaid, the state must pay us, in addition to the applicable Medicare or Medicaid hospice per diem rate, an amount equal to at least 95% of the Medicaid per diem nursing home rate for “room and board” furnished to the patient by the nursing home. We contract with various nursing homes for the nursing homes’ provision of certain “room and board” services that the nursing homes would otherwise provide Medicaid nursing home patients. We bill and collect from the applicable state Medicaid program an amount equal to at least 95% of the amount that would otherwise have been paid directly to the nursing home under the state’s Medicaid plan. Under our standard nursing home contracts, we pay the nursing home for these “room and board” services at 100% of the Medicaid per diem nursing home rate.
Government studies conducted in the last several years have suggested that the reimbursement levels for hospice patients living in nursing homes may be excessive. In particular, the federal government has expressed concern that hospice programs may provide fewer services to patients residing in nursing homes than to patients living in other settings due to the presence of the nursing home’s own staff to address problems that might otherwise be handled by hospice personnel. Because hospice programs are paid a fixed per diem amount, regardless of the volume or duration of services provided, the government is concerned that hospice programs may be increasing their profitability by shifting the cost of certain patient care services to nursing homes.
The reduction or elimination of Medicare payments for hospice patients residing in nursing homes would significantly reduce our net patient service revenue and profitability. In addition, changes in the way nursing homes are reimbursed for “room and board” services provided to hospice patients residing in nursing homes could affect our ability to obtain referrals from nursing homes. A reduction in referrals from nursing homes would adversely affect our net patient service revenue and profitability.
We conduct business in a heavily regulated industry, and changes in regulations and violations of regulations may result in increased costs or sanctions.
Our business is subject to extensive federal, state and, in some cases, local regulation. Compliance with these regulatory requirements, as interpreted and amended from time to time, can increase operating costs or reduce revenue and thereby adversely affect the financial viability of our business. Because these laws are amended from time to time and are subject to interpretation, we cannot predict when and to what extent liability
34
may arise. Failure to comply with current or future regulatory requirements could also result in the imposition of various remedies. including fines, the revocation of licenses or decertification. Unanticipated increases in operating costs or reductions in revenue could adversely affect our liquidity.
The Senate Finance Committee is conducting an inquiry into certain of our practices, and the SEC has commenced an investigation relating to our participation in the Medicare Home Health Prospective Payment System.
In a letter dated May 12, 2010, the United States Senate Finance Committee requested information from us regarding our Medicare utilization rates and amount of therapy services furnished to each beneficiary. The letter was sent to all of the publicly traded home healthcare companies mentioned in a Wall Street Journal article that explored the relationship between CMS home health policies and the utilization rates of some home health agencies. As part of our initial production of documents, on May 26, 2010 the Senate Finance Committee requested supplemental information relating to our compliance program, policies and procedures and billing manuals. We have responded to these requests. Additionally, on July 13, 2010, the SEC informed us that it has commenced an investigation relating to our participation in the Medicare Home Health Prospective Payment System, and, on July 16, 2010, we received subpoena from the SEC requesting certain documents in connection with its investigation. Similar to the Senate Finance Committee Request, the SEC subpoena, among other things, focuses on issues related to the number of and reimbursement received for therapy visits before and after changes in the Medicare reimbursement system, relationships with physicians, compliance efforts including compliance with fraud and abuse laws, and certain documents sent to the Senate Finance Committee. We are in the process of responding to the SEC’s request.
Given the preliminary stage of both the Senate Finance Committee inquiry and the SEC investigation, we are unable to assess the probable outcome or potential liability, if any, arising from either matter. There can be no assurances that we will not experience negative publicity with respect to these matters, that fines or other penalties will not be imposed by the SEC or that an investigation by other governmental agencies may not be initiated for which we could incur fines or other losses as a result, including a reduction in reimbursement for certain services we perform.
If Odyssey fails to comply with the terms of its Corporate Integrity Agreement, it could subject us to substantial monetary penalties or suspension or termination from participation in the Medicare and Medicaid programs.
On July 6, 2006, Odyssey entered into a five-year Corporate Integrity Agreement (“CIA”) with the Office of Inspector General of Health and Human Services. The CIA imposes certain auditing, self-reporting and training requirements that Odyssey must comply with. If Odyssey fails to comply with the terms of its CIA, it could subject us to substantial monetary penalties and/or suspension or termination from participation in the Medicare and Medicaid programs. The imposition of monetary penalties would adversely affect Odyssey’s and our profitability. A suspension or termination of its participation in the Medicare and Medicaid programs would have a material adverse affect on Odyssey’s and our profitability and financial condition as substantially all of Odyssey’s net patient service revenue is attributable to payments received from the Medicare and Medicaid programs. 97.0% and 96.6% of Odyssey’s net patient service revenue for the years ended December 31, 2009 and 2008, respectively, were attributed to Medicare and Medicaid payments.
If any of our hospice programs fails to comply with the Medicare conditions of participation, that program could be terminated from the Medicare program, thereby adversely affecting our net patient service revenue and profitability.
Each of our hospice programs must comply with the extensive conditions of participation of the Medicare hospice benefit. If any of our hospice programs fails to meet any of the Medicare conditions of participation, that program may receive a notice of deficiency from the applicable state surveyor. If that hospice program then fails to institute a plan of correction and correct the deficiency within the correction period provided by the state
35
surveyor, that program could be terminated from receiving Medicare payments. For example, under the Medicare hospice program, each of our hospice programs must demonstrate that volunteers provide administrative and direct patient care services in an amount equal to at least 5% of the total patient care hours provided by its employees and contract staff at the hospice program. If we are unable to attract a sufficient number of volunteers at one of our hospice programs to meet this requirement, that program could be terminated from the Medicare benefit if the program fails to address the deficiency within the applicable correction period. Any termination of one or more of our hospice programs from the Medicare program for failure to satisfy the volunteer or other conditions of participation could adversely affect our patient service revenue and profitability and financial condition. We believe that we are in compliance with the conditions of participation; however, we cannot predict how surveyors will interpret all aspects of the Medicare conditions of participation.
We are subject to periodic audits and requests for information by the Medicare and Medicaid programs or government agencies, which have various rights and remedies against us if they assert that we have overcharged the programs or failed to comply with program requirements.
The operation of our home health services business and hospice services is subject to federal and state laws prohibiting fraud by healthcare providers, including laws containing criminal provisions, which prohibit filing false claims or making false statements in order to receive payment or obtain certification under Medicare and Medicaid programs, or failing to refund overpayments or improper payments. Violation of these criminal provisions is a felony punishable by imprisonment and/or fines. We may also be subject to fines and treble damage claims if we violate the civil provisions that prohibit knowingly filing a false claim or knowingly using false statements to obtain payment. State and federal governments are devoting increased attention and resources to anti-fraud initiatives against healthcare providers. The Health Insurance Portability and Accountability Act of 1996, the Balanced Budget Act of 1997 and the Health Care Reform Act expanded the penalties for healthcare fraud, including broader provisions for the exclusion of providers from Medicare and Medicaid programs and other federal and state health care programs.
Additionally, the Health Care Reform Act requires providers, such as home health agencies and hospice providers, to notify the Secretary of Health and Human Services, intermediary, contractor or other appropriate person, of any overpayment and the reason for the overpayment, and to return the overpayment, within the later of 60 days from the time the overpayment is identified or the due date of the provider’s cost report. Failure to comply may result in prosecution under the false claims act and exclusion from participation in Medicare, Medicaid and other federal and state health care programs.
CMS has contracted with four Recovery Audit Contractors (“RACs”) to perform post-payment reviews of health care providers. In January 2010, CMS announced that it has approved two issues for the RACs to begin reviewing with respect to hospice providers. These initial hospice reviews will focus on durable medical equipment services and other Medicare Part A and B services provided to hospice patients that are related to a patient’s terminal prognosis and the financial obligation of the hospice provider to determine whether the hospice provider arranged for and paid for the services as required. We expect in the future that CMS will likely expand the scope of the reviews conducted by the RACs. We cannot predict whether reviews by RACs of our hospice programs’ reimbursement claims will result in material recoupments, which could have a material adverse affect on our financial condition and results of operations.
We have established policies and procedures that we believe are sufficient to ensure that we will operate in substantial compliance with these anti-fraud and abuse requirements. In April 2003, we received a subpoena from the Department of Health and Human Services, Office of Inspector General, Office of Investigations (“OIG”). The subpoena sought information regarding our implementation of settlements and corporate integrity agreements entered into with the government, as well as our treatment on cost reports of employees engaged in sales and marketing efforts. In February 2004, we received a subpoena from the U.S. Department of Justice (“DOJ”) seeking additional information related to the matters covered by the OIG subpoena. In early May 2010, we reached an agreement in principle, subject to final approvals, with the government to resolve this matter.
36
Under the agreement, we will pay the government $12.5 million, of which $9.5 million was recorded as a special charge in the 2010 first quarter with the remaining $3 million covered by a previously-recorded reserve.
Odyssey was the subject of a civil investigation by the Civil Division of the DOJ. On July 6, 2006, Odyssey entered into a settlement agreement with the DOJ to settle the investigation. As part of the settlement of the investigation, Odyssey entered into a corporate integrity agreement on July 6, 2006, with the U.S. Department of Health and Human Services, Office of Inspector General.
On February 14, 2008, Odyssey received a letter from the Medicaid Fraud Control Unit of the Texas Attorney General’s office notifying it that it is conducting an investigation concerning Medicaid hospice services provided by Odyssey, including its practices with respect to patient admission and retention, and requesting medical records of approximately 50 patients served by its programs in the State of Texas. Based on the preliminary stage of this investigation and the limited information that Odyssey has at this time, Odyssey cannot predict the outcome of this investigation, the Texas Attorney General’s views of the issues being investigated, any actions that the Texas Attorney General may take or the impact, if any, that the investigation may have on Odyssey’s and our business, results of operations, liquidity or capital resources. Odyssey believes that it is in material compliance with the rules and regulations applicable to the Texas Medicaid hospice program.
On May 5, 2008, Odyssey received a letter from the DOJ notifying it that the DOJ is conducting an investigation of VistaCare, Inc. (“VistaCare”) and requesting that Odyssey provide certain information and documents related to its investigation of claims submitted by VistaCare to Medicare, Medicaid and the U.S. government health insurance plan for active military members, their families and retirees, formerly the Civilian Health and Medical Program of the Uniformed Services (“TRICARE”), from January 1, 2003 through March 6, 2008, the date Odyssey completed the acquisition of VistaCare. Odyssey has been informed by the DOJ and the Medicaid Fraud Control Unit of the Texas Attorney General’s Office that they are reviewing allegations that VistaCare may have billed the federal Medicare, Medicaid and TRICARE programs for hospice services that were not reasonably or medically necessary or performed as claimed. The basis of the investigation is a qui tam lawsuit filed in the United States District Court for the Northern District of Texas by a former employee of VistaCare. The lawsuit was unsealed on October 5, 2009 and served on Odyssey on January 28, 2010. In connection with the unsealing of the complaint, the DOJ filed a notice with the court declining to intervene in the qui tam action at this time. The Texas Attorney General also filed a notice of non-intervention with the court. While these actions should not be viewed as a final assessment by the DOJ or the Texas Attorney General of the merits of this qui tam action, Odyssey considers them to be positive developments. Odyssey continues to cooperate with the DOJ and the Texas Attorney General in their investigation. Based on the limited information that it has at this time, Odyssey cannot predict the outcome of the investigation, the DOJ’s or Texas Attorney General’s views of the issues being investigated, other than the DOJ’s and Texas Attorney General’s notice declining to intervene in the qui tam action at this time, any actions that the DOJ or Texas Attorney General may take or the impact, if any, that the investigation may have on Odyssey’s and our business, results of operations, liquidity or capital resources.
On January 5, 2009, Odyssey received a letter from the Georgia State Health Care Fraud Control Unit notifying it that it is conducting an investigation concerning Medicaid hospice services provided by VistaCare from 2003 through 2007 and requesting certain documents. Odyssey is cooperating with the Georgia State Health Care Fraud Control Unit and has complied with the document request. Based on the preliminary stage of this investigation and the limited information that Odyssey has at this time, it cannot predict the outcome of the investigation, the Georgia State Health Care Fraud Control Unit’s views of the issues being investigated, any actions that the Georgia State Health Care Fraud Control Unit may take or the impact, if any, that the investigation may have on Odyssey’s and our business, results of operations, liquidity or capital resources.
On February 2, 2009, Odyssey received a subpoena from the OIG requesting certain documents related to its provision of continuous care services from January 1, 2004 through February 2, 2009. On September 9, 2009, Odyssey received a second subpoena from the OIG requesting medical records for certain patients who had been
37
provided continuous care services by Odyssey during the same time period. Odyssey is cooperating with the OIG and has completed its subpoena production. Based on the preliminary stage of this investigation and the limited information that Odyssey has at this time, it cannot predict the outcome of the investigation, the OIG’s views of the issues being investigated, any actions that the OIG may take or the impact, if any, that the investigation may have on Odyssey’s and our business, results of operations, liquidity or capital resources.
On February 23, 2010, Odyssey received a subpoena from the OIG requesting various documents and certain patient records of one its hospice programs relating to services performed from January 1, 2006 through December 31, 2009. Odyssey is cooperating with the OIG and has completed its subpoena production. Because of the preliminary stage of this investigation and the limited information that Odyssey has at this time, it cannot predict the outcome of the investigation, the OIG’s views of the issues being investigated, any actions that the OIG may take or the impact, if any, that the investigation may have on Odyssey’s and our business, results of operations, liquidity or capital resources.
In the future, different interpretations or enforcement of laws, rules and regulations governing the healthcare industry could subject our current business practices to allegations of impropriety or illegality or could require us to make changes in our facilities, equipment, personnel, services and capital expenditure programs, increase our operating expenses and distract our management. If we fail to comply with these extensive laws and government regulations, we could become ineligible to receive government program payments, suffer civil and criminal penalties or be required to make significant changes to our operations. In addition, we could be forced to expend considerable resources responding to an investigation or other enforcement action under these laws or regulations.
We are also subject to federal and state laws that govern financial and other arrangements among healthcare providers.
Federal law prohibits the knowing and willful offer, payment, solicitation or receipt, directly or indirectly, of remuneration to induce, arrange for, or in return for, the referral of federal health care program beneficiaries for items or services paid for by a federal health care program. State laws also prohibit such payments for Medicaid beneficiaries and some states have expanded anti-kickback statutes. The federal law known as the “Stark Law” prohibits certain financial arrangements with physicians. State laws often prohibit certain direct and indirect payments or fee-splitting arrangements between healthcare providers that are designed to encourage the referral of patients to a particular provider for medical products and services. Furthermore, some states have enacted laws similar to the Stark Law, which restrict certain business relationships between physicians and other providers of healthcare services. Many states prohibit business corporations from providing, or holding themselves out as a provider of, medical care. These laws vary from state to state, are often vague and have seldom been interpreted by the courts or regulatory agencies. Possible sanctions for violation of any of these restrictions or prohibitions include loss of licensure or eligibility to participate in reimbursement programs, civil and criminal penalties, and exclusion from participation in Medicare, Medicaid and other federal and state health care programs.
We face additional federal requirements that mandate major changes in the transmission and retention of health information and in notification requirements for any health information security breaches.
The Health Insurance Portability and Accountability Act of 1996 (“HIPAA”) was enacted to ensure that employees can retain and at times transfer their health insurance when they change jobs and to simplify healthcare administrative processes. The enactment of HIPAA also expanded protection of the privacy and security of personal medical data and required the adoption of standards for the exchange of electronic health information. Among the standards that the Secretary of Health and Human Services has adopted pursuant to HIPAA are standards for electronic transactions and code sets, unique identifiers for providers, employers, health plans and individuals, security and electronic signatures, privacy and enforcement. Although HIPAA was intended to ultimately reduce administrative expenses and burdens faced within the healthcare industry, we
38
believe that implementation of this law has resulted in additional costs. Failure to comply with HIPAA could result in fines and penalties that could have a material adverse effect on us.
The Health Information Technology for Economic and Clinical Health Act (“HITECH Act”), enacted as part of the American Recovery and Reinvestment Act of 2009 (“ARRA”), also known as the Stimulus Bill, effective February 22, 2010, sets forth health information security breach notification requirements and increased penalties for violation of HIPAA. A week after the effective date, covered entities and business associates were required to submit reports to the US Department of Health and Human Services (“HHS”) of any breaches that occurred during the last quarter of 2009. The HITECH Act requires patient notification for all breaches, media notification of breaches of over 500 patients and at least annual reporting of all breaches to the Secretary of HHS. The HITECH Act also replaced the prior penalty system of one tier of penalties of $100 per violation and an annual maximum of $25,000 with a 4-tier system of sanctions for breaches. Penalties now range from the original $100 per violation and an annual maximum of $25,000 for the first tier to a fourth-tier minimum of $50,000 per violation and an annual maximum of $1.5 million for the identical violation. On July 14, 2010, the Office for Civil Rights of the U.S. Department of Health and Human Services (“OCR”) published proposed regulations in the Federal Register to implement the HITECH Act revisions. Failure to comply with HIPAA could result in fines and penalties that could have a material adverse effect on us.
39
THE PROPOSED ODYSSEY ACQUISITION AND FINANCING
On May 23, 2010, we entered into the Plan of Merger with Merger Sub and Odyssey. Upon the terms and subject to the conditions set forth in the Plan of Merger, Merger Sub will merge with and into Odyssey with Odyssey continuing as the surviving corporation and a wholly-owned subsidiary of Gentiva. Upon consummation of the Merger, each issued and outstanding share of Odyssey common stock will be exchanged for the right to receive $27.00 in cash, without interest.
Consummation of the Merger is subject to customary conditions, including adoption of the Plan of Merger by Odyssey’s stockholders and the absence of legal restraints. Each party’s obligation to consummate the Merger is also subject to the accuracy of the representations and warranties of the other party (subject to certain exceptions) and the performance in all material respects of the other party’s covenants under the Plan of Merger.
The Transactions comprise the consummation of the Merger, our entering into a new $125 million revolving credit facility, our entering into an $800 million senior term loan facility, our issuance of $305 million aggregate principal amount of senior notes and the payment of the related fees and expenses, and the repayment upon consummation of the Merger of (x) all amounts outstanding under our existing senior credit facility and (y) all amounts outstanding under Odyssey’s existing senior credit facility.
40
The estimated sources and uses of the funds for the Transactions, assuming the Transactions had closed on July 4, 2010, are shown in the table below. Actual amounts may vary from estimated amounts depending on several factors, including differences between estimated and actual fees and expenses and differences between our cash and cash equivalents balances at July 4, 2010 and at the closing of the Transactions. For more information, see “The Proposed Odyssey Acquisition and Financing” and “Unaudited Pro Forma Condensed Consolidated Financial Information” and the related notes included elsewhere in this exhibit.
| ($ in millions) Sources of Funds |
Uses of Funds |
|||||||
| Cash and cash equivalents(1) |
$ | 295.4 | Merger consideration(4) | $ | 963.5 | |||
| New revolving credit facility(2) |
— | Repayment of existing Gentiva senior credit facility(5) |
232.7 | |||||
| New senior secured term loan facility(3) |
800.0 | Repayment of existing Odyssey senior credit facility(6) |
112.7 | |||||
| New senior unsecured notes |
305.0 | Estimated fees and expenses(7) | 91.5 | |||||
| Total sources of funds |
$ | 1,400.4 | Total uses of funds | $ | 1,400.4 | |||
| (1) | Reflects a portion of the cash and cash equivalents balances of Gentiva and Odyssey. |
| (2) | In connection with the Merger, we will enter into a $125 million revolving credit facility with a five-year maturity. We do not expect to borrow under the new revolving credit facility at the closing of the Merger, but we expect to issue up to approximately $45.0 million of letters of credit to replace existing letters of credit. See “Description of Other Indebtedness.” |
| (3) | In connection with the Merger, we will enter into a senior secured term loan facility, $200 million of which is expected to be a term loan A facility having a five-year final maturity and $600 million of which is expected to be a term loan B facility having a six-year final maturity. The entire amount of the new senior term loan facility will be drawn at the closing of the Merger. See “Description of Other Indebtedness.” |
| (4) | Reflects amounts payable to holders of Odyssey common stock and to holders of options and restricted stock units granted under Odyssey’s compensation plans. |
| (5) | Reflects the face amount of Gentiva’s existing indebtedness, plus accrued interest. |
| (6) | Reflects the face amount of Odyssey’s existing indebtedness, plus accrued interest, together with the amount payable to terminate the related interest rate swaps. |
| (7) | Reflects our estimate of fees and expenses associated with the Transactions, including placement and other financing fees (including upfront fees and original issue discount on the credit facility, if any) and other transaction costs and professional fees. |
41
CAPITALIZATION
The following table sets forth our consolidated cash and cash equivalents and our total capitalization as of July 4, 2010 on a historical basis and on a pro forma basis after giving effect to the Transactions.
You should read the information in the following table in conjunction with “The Proposed Odyssey Acquisition and Financing,” “Unaudited Pro Forma Condensed Consolidated Financial Information,” and the historical financial statements of Gentiva and Odyssey and related notes thereto included in the documents they have filed with the SEC.
| As of July 4, 2010 (unaudited) | ||||||
| Historical | Pro Forma | |||||
| (in thousands) | ||||||
| Cash and cash equivalents |
$ | 191,066 | $ | 60,167 | ||
| Long-term debt: |
||||||
| Existing term loan |
$ | 232,000 | $ | — | ||
| New revolving credit facility(1) |
— | — | ||||
| New term loan facility(1): |
||||||
| Term loan A |
— | 200,000 | ||||
| Term loan B |
— | 600,000 | ||||
| Senior unsecured notes |
— | 305,000 | ||||
| Total debt |
$ | 232,000 | $ | 1,105,000 | ||
| Stockholders’ equity: |
||||||
| Common stock: $0.10 par value per share, 100,000,000 shares authorized; 30,395,939 shares issued |
$ | 3,040 | $ | 3,040 | ||
| Additional paid-in capital, retained earnings and treasury stock (641,468 shares) |
601,730 | 577,930 | ||||
| Total stockholders’ equity |
604,770 | 580,970 | ||||
| Total capitalization |
$ | 836,770 | $ | 1,685,970 | ||
| (1) | Upon the closing of the Transactions, we will enter into new senior secured credit facilities, comprising (i) term loan facilities aggregating $800 million and (ii) a revolving credit facility of $125 million. |
42
UNAUDITED PRO FORMA CONDENSED CONSOLIDATED FINANCIAL INFORMATION
The following unaudited pro forma condensed consolidated financial information is based on the historical audited and unaudited consolidated financial statements of Gentiva and Odyssey, as adjusted to illustrate the estimated pro forma effects of the Transactions, as described in “The Proposed Odyssey Acquisition and Financing.” The unaudited pro forma condensed consolidated financial information should be read in conjunction with the consolidated financial statements and related notes of Gentiva and Odyssey as filed in their respective most recently-filed Annual Reports on Form 10-K and Quarterly Reports on Form 10-Q and the financial information appearing in this exhibit, including “The Proposed Odyssey Acquisition and Financing.”
The unaudited pro forma balance sheet gives effect to the Transactions as if they had occurred on July 4, 2010. The unaudited pro forma statements of operations give effect to the Transactions as if they had occurred on December 29, 2008 (the first day of fiscal 2009). Due to the different fiscal period ends for Gentiva and Odyssey, the unaudited pro forma statement of operations for the year ended January 3, 2010 combines Gentiva’s results for the year ended January 3, 2010, which were derived from our audited consolidated financial statements for the year ended January 3, 2010, with Odyssey’s historical results for the year ended December 31, 2009, which were derived from Odyssey’s results of operations for the year ended December 31, 2009, included in its audited consolidated financial statements for the year ended December 31, 2009. Under Gentiva’s accounting policies, our fiscal year ends on the Sunday nearest to December 31. As a result, our fiscal year 2009 ended on January 3, 2010 and included 53 weeks of activity. Odyssey’s fiscal year 2009 included the calendar year ended December 31, 2009.
Similarly, the unaudited pro forma statement of operations for the six months ended June 28, 2009 combines our results for the six-month period ended June 28, 2009, which were derived from our unaudited consolidated statement of operations for the six months ended June 28, 2009, with Odyssey’s historical results for the six months ended June 30, 2009, which were derived from Odyssey’s unaudited consolidated statement of operations for the six months ended June 30, 2009. The unaudited pro forma statement of operations for the six months ended July 4, 2010 combines Gentiva’s results for the six months ended July 4, 2010, which were derived from our unaudited consolidated statement of operations for the six months ended July 4, 2010, with Odyssey’s historical results for the six months ended June 30, 2010, which were derived from Odyssey’s unaudited consolidated statement of operations for the six months ended June 30, 2010.
We derived the unaudited pro forma condensed consolidated statement of operations data for the twelve months ended July 4, 2010 by adding the unaudited pro forma condensed consolidated statement of operations data for the year ended January 3, 2010 to the unaudited pro forma condensed consolidated statement of operations data for the six months ended July 4, 2010 and subtracting the unaudited pro forma condensed consolidated statement of operations data for the six months ended June 28, 2009.
The unaudited pro forma adjustments are based upon available information and certain assumptions that we believe are reasonable. For example, our acquisition of Odyssey will be accounted for, and is presented in the unaudited pro forma condensed consolidation financial information, using the authoritative guidance for the purchase method of accounting. Under these standards, the excess of the purchase price over the fair value of net assets acquired and liabilities assumed is recorded as goodwill. The pro forma adjustments reflect our preliminary estimates of the purchase price allocation related to our acquisition of Odyssey. However, as of the date of this exhibit, we have not performed the valuation studies necessary to determine with any certainty the fair values of the assets that we will acquire and the liabilities that we will assume and the related allocation of purchase price. The purchase price allocation is subject to change based upon finalization of appraisals and other valuation studies that we will arrange to obtain, and the amounts contained in the final
43
purchase price allocation may differ materially from our preliminary estimates. For purposes of computing pro forma adjustments, we have assumed that historical values of assets acquired, liabilities assumed and noncontrolling interests reflect fair value. The pro forma balance sheet includes a preliminary estimate of fair value adjustments for identifiable intangible assets such as tradenames and customer contracts, and the pro forma condensed consolidated statements of operations includes preliminary estimates of incremental amortization expense associated with certain identifiable intangible assets; however, these amounts are subject to change as we have not completed the appraisal process as of the date of this exhibit.
The pro forma adjustments do not include adjustments to deferred tax assets or liabilities other than with respect to Odyssey’s historical goodwill and our preliminary estimate of the purchase price to be allocated to identifiable intangible assets and goodwill. The structure of the Transactions and certain elections that we may make in connection with our acquisition of Odyssey and subsequent tax filings may impact the amount of deferred tax liabilities that are due and the realization of deferred tax assets.
The unaudited pro forma condensed consolidated financial information contained in this exhibit is for informational purposes only and is not intended to represent or be indicative of the consolidated results of operations or financial position that we would have reported had the Transactions been completed as of the dates presented and should not be taken as representative of our future consolidated results of operations or financial position.
44
UNAUDITED PRO FORMA CONDENSED CONSOLIDATED STATEMENT OF OPERATIONS
FOR THE YEAR ENDED JANUARY 3, 2010
(in thousands, except per share amounts)
| Gentiva | Odyssey | Pro Forma Adjustments (a) |
Pro Forma As Adjusted |
|||||||||||||
| Net revenues |
$ | 1,152,460 | $ | 686,438 | $ | — | $ | 1,838,898 | ||||||||
| Cost of services sold |
553,530 | 396,774 | — | 950,304 | ||||||||||||
| Gross profit |
598,930 | 289,664 | — | 888,594 | ||||||||||||
| Selling, general and administrative expenses |
(490,866 | ) | (216,874 | ) | (5,608 | )(b)(e) | (713,348 | ) | ||||||||
| Gain (loss) on sale of assets, net |
5,998 | (410 | ) | — | 5,588 | |||||||||||
| Interest income |
3,037 | 479 | — | 3,516 | ||||||||||||
| Interest expense and other |
(9,211 | ) | (6,574 | ) | (85,250 | )(c) | (101,035 | ) | ||||||||
| Income from continuing operations before income taxes and equity in net earnings of affiliate |
107,888 | 66,285 | (90,858 | ) | 83,315 | |||||||||||
| Income tax expense |
(39,164 | ) | (24,583 | ) | 32,734 | (d) | (31,013 | ) | ||||||||
| Equity in net earnings of affiliate |
1,072 | — | — | 1,072 | ||||||||||||
| Income from continuing operations |
69,796 | 41,702 | (58,124 | ) | 53,374 | |||||||||||
| Income attributable to noncontrolling interests |
— | (613 | ) | — | (613 | ) | ||||||||||
| Income from continuing operations attributable to Gentiva shareholders |
$ | 69,796 | $ | 41,089 | $ | (58,124 | ) | $ | 52,761 | |||||||
| Basic earnings per common share: |
||||||||||||||||
| Income from continuing operations attributable to Gentiva shareholders |
$ | 2.40 | $ | 1.81 | ||||||||||||
| Weighted average shares outstanding |
29,103 | 29,103 | ||||||||||||||
| Diluted earnings per common share: |
||||||||||||||||
| Income from continuing operations attributable to Gentiva shareholders |
$ | 2.34 | $ | 1.77 | ||||||||||||
| Weighted average shares outstanding |
29,822 | 29,822 | ||||||||||||||
See notes to unaudited pro forma condensed consolidated statements of operations.
45
UNAUDITED PRO FORMA CONDENSED CONSOLIDATED STATEMENT OF OPERATIONS
FOR THE SIX MONTHS ENDED JUNE 28, 2009
(in thousands, except per share amounts)
| Gentiva | Odyssey | Pro Forma Adjustments (a) |
Pro Forma As Adjusted |
|||||||||||||
| Net revenues |
$ | 561,202 | $ | 337,827 | $ | — | $ | 899,029 | ||||||||
| Cost of services sold |
268,025 | 197,899 | — | 465,924 | ||||||||||||
| Gross profit |
293,177 | 139,928 | — | 433,105 | ||||||||||||
| Selling, general and administrative expenses |
(240,033 | ) | (108,447 | ) | (2,859 | )(b)(e) | (351,339 | ) | ||||||||
| Gain on sale of assets, net |
5,747 | — | — | 5,747 | ||||||||||||
| Interest income |
1,618 | 287 | — | 1,905 | ||||||||||||
| Interest expense and other |
(5,880 | ) | (3,491 | ) | (42,012 | )(c) | (51,383 | ) | ||||||||
| Income from continuing operations before income taxes and equity in net earnings of affiliate |
54,629 | 28,277 | (44,871 | ) | 38,035 | |||||||||||
| Income tax expense |
(19,634 | ) | (10,347 | ) | 17,098 | (12,883 | ) | |||||||||
| Equity in net earnings of affiliate |
541 | — | — | 541 | ||||||||||||
| Income from continuing operations |
35,536 | 17,930 | (27,773 | ) | 25,693 | |||||||||||
| Income attributable to noncontrolling interests |
— | (217 | ) | — | (217 | ) | ||||||||||
| Income from continuing operations attributable to Gentiva shareholders |
$ | 35,536 | $ | 17,713 | $ | (27,773 | ) | $ | 25,476 | |||||||
| Basic earnings per common share: |
||||||||||||||||
| Income from continuing operations attributable to Gentiva shareholders |
$ | 1.23 | $ | 0.88 | ||||||||||||
| Weighted average shares outstanding |
28,952 | 28,952 | ||||||||||||||
| Diluted earnings per common share: |
||||||||||||||||
| Income from continuing operations attributable to Gentiva shareholders |
$ | 1.20 | $ | 0.86 | ||||||||||||
| Weighted average shares outstanding |
29,606 | 29,606 | ||||||||||||||
See notes to unaudited pro forma condensed consolidated statements of operations.
46
UNAUDITED PRO FORMA CONDENSED CONSOLIDATED STATEMENT OF OPERATIONS
FOR THE SIX MONTHS ENDED JULY 4, 2010
(in thousands, except per share amounts)
| Gentiva | Odyssey | Pro Forma Adjustments (a) |
Pro Forma As Adjusted |
|||||||||||||
| Net revenues |
$ | 594,230 | $ | 347,723 | $ | — | $ | 941,953 | ||||||||
| Cost of services sold |
275,839 | 194,433 | — | 470,272 | ||||||||||||
| Gross profit |
318,391 | 153,290 | — | 471,681 | ||||||||||||
| Selling, general and administrative expenses |
(264,771 | ) | (105,439 | ) | (2,904 | )(b)(e) | (373,114 | ) | ||||||||
| Gain (loss) on sale of assets, net |
103 | (3 | ) | — | 100 | |||||||||||
| Interest income |
1,314 | 170 | — | 1,484 | ||||||||||||
| Interest expense and other |
(3,514 | ) | (2,872 | ) | (43,997 | )(c) | (50,383 | ) | ||||||||
| Income from continuing operations before income taxes and equity in net earnings of affiliate |
51,523 | 45,146 | (46,901 | ) | 49,768 | |||||||||||
| Income tax expense |
(21,757 | ) | (17,090 | ) | 19,029 | (d) | (19,818 | ) | ||||||||
| Equity in net earnings of affiliate |
763 | — | — | 763 | ||||||||||||
| Income from continuing operations |
30,529 | 28,056 | (27,872 | ) | 30,713 | |||||||||||
| Income attributable to noncontrolling interests |
— | (482 | ) | — | (482 | ) | ||||||||||
| Income from continuing operations attributable to Gentiva shareholders |
$ | 30,529 | $ | 27,574 | $ | (27,872 | ) | $ | 30,231 | |||||||
| Basic earnings per common share: |
||||||||||||||||
| Income from continuing operations attributable to Gentiva shareholders |
$ | 1.03 | $ | 1.02 | ||||||||||||
| Weighted average shares outstanding |
29,715 | 29,715 | ||||||||||||||
| Diluted earnings per common share: |
||||||||||||||||
| Income from continuing operations attributable to Gentiva shareholders |
$ | 1.00 | $ | 0.99 | ||||||||||||
| Weighted average shares outstanding |
30,568 | 30,568 | ||||||||||||||
See notes to unaudited pro forma condensed consolidated statements of operations.
47
UNAUDITED PRO FORMA CONDENSED CONSOLIDATED STATEMENT OF OPERATIONS
FOR THE TWELVE MONTHS ENDED JULY 4, 2010
(in thousands, except per share amounts)
| Gentiva | Odyssey | Pro Forma Adjustments (a) |
Pro Forma As Adjusted |
|||||||||||||
| Net revenues |
$ | 1,185,488 | $ | 696,334 | $ | — | $ | 1,881,822 | ||||||||
| Cost of services sold |
561,344 | 393,308 | — | 954,652 | ||||||||||||
| Gross profit |
624,144 | 303,026 | — | 927,170 | ||||||||||||
| Selling, general and administrative expenses |
(515,604 | ) | (213,866 | ) | (5,653 | )(b)(e) | (735,123 | ) | ||||||||
| Gain (loss) on sale of assets, net |
354 | (413 | ) | — | (59 | ) | ||||||||||
| Interest income |
2,733 | 362 | — | 3,095 | ||||||||||||
| Interest expense and other |
(6,845 | ) | (5,955 | ) | (87,235 | )(c) | (100,035 | ) | ||||||||
| Income from continuing operations before income taxes and equity in net earnings of affiliate |
104,782 | 83,154 | (92,888 | ) | 95,048 | |||||||||||
| Income tax expense |
(41,287 | ) | (31,326 | ) | 34,665 | (37,948 | ) | |||||||||
| Equity in net earnings of affiliate |
1,294 | — | — | 1,294 | ||||||||||||
| Income from continuing operations |
64,789 | 51,828 | (58,223 | ) | 58,394 | |||||||||||
| Income attributable to noncontrolling interests |
— | (878 | ) | — | (878 | ) | ||||||||||
| Income from continuing operations attributable to Gentiva shareholders |
$ | 64,789 | $ | 50,950 | $ | (58,223 | ) | $ | 57,516 | |||||||
| Basic earnings per common share: |
||||||||||||||||
| Income from continuing operations attributable to Gentiva shareholders |
$ | 2.20 | $ | 1.95 | ||||||||||||
| Weighted average shares outstanding |
29,485 | 29,485 | ||||||||||||||
| Diluted earnings per common share: |
||||||||||||||||
| Income from continuing operations attributable to Gentiva shareholders |
$ | 2.15 | $ | 1.90 | ||||||||||||
| Weighted average shares outstanding |
30,200 | 30,200 | ||||||||||||||
See notes to unaudited pro forma condensed consolidated statements of operations.
48
NOTES TO UNAUDITED PRO FORMA CONDENSED CONSOLIDATED STATEMENTS OF OPERATIONS
| (a) | The pro forma adjustments reflect our preliminary estimates of the purchase price allocation related to the Odyssey acquisition. However, as of the date of this exhibit, we have not performed the valuation studies necessary to determine with any certainty the fair values of the assets we will acquire and the liabilities we will assume and the related allocation of purchase price. The purchase price allocation is subject to change based upon finalization of appraisals and valuation studies that we will arrange to obtain and the final purchase price allocation may differ materially from the preliminary estimates included in the pro forma statements included herein. |
Additionally, the pro forma statements of operations data do not reflect the non-recurring expenses that we expect to incur in connection with the Transactions, including approximately $29.8 million relating to fees to investment bankers, attorneys, accountants and other professional advisors and other transaction-related costs that will not be capitalized as deferred financing costs.
The pro forma statements of operations data do not reflect the effects of all anticipated cost savings and any related non-recurring costs to achieve those cost savings.
| (b) | For purposes of computing pro forma adjustments, we have assumed that the historical values of tangible assets acquired, liabilities assumed and noncontrolling interests reflect fair value. We have estimated a fair value adjustment for identifiable intangible assets such as tradenames and customer relationships of $60.0 million based solely on comparing the size of the Odyssey acquisition to other acquisitions made by Gentiva and estimating a value for these identifiable intangible assets relative to the values ascribed to similar identifiable intangible assets from valuation studies performed in connection with other Gentiva acquisitions. These identifiable intangible assets are being amortized using the straight-line method over assumed estimated useful lives of ten years for purposes of the pro forma information. As a result, the Pro Forma Condensed Consolidated Statements of Operations reflect amortization expense of $3.0 million for the six month periods and $6.0 million for the twelve month periods as a component of selling, general and administrative expenses. In addition, we have assumed a fair value adjustment of $100.0 million for non-amortizing identifiable intangible assets such as certificates of need and licenses based on the accounting treatment of such items in other Gentiva acquisitions. The remaining excess of the purchase price over the fair value of tangible and identifiable intangible assets acquired, liabilities assumed and noncontrolling interests is recorded as goodwill. Goodwill is not amortized but will be subject to annual impairment tests in accordance with generally accepted accounting principles. |
Selling, general and administrative expenses in the Pro Forma Condensed Consolidated Statements of Operations also reflect the pro forma adjustment to reverse Odyssey’s amortization of its existing identifiable intangible assets of $141,000 and $96,000 for the six month periods ending June 28, 2009 and July 4, 2010, respectively, and $347,000 for the twelve month periods as the related asset balances will be eliminated under the purchase method of accounting.
49
| (c) | Reflects pro forma adjustments to interest expense as follows: |
| (in thousands) |
Year ended January 3, 2010 |
Six Months ended June 28, 2009 |
Six Months ended July 4, 2010 |
Twelve Months ended July 4, 2010 |
||||||||||||
| Interest on senior secured term loan, revolving credit facility and new senior unsecured notes(1) |
$ | 89,796 | $ | 44,899 | $ | 44,899 | $ | 89,796 | ||||||||
| Commitment fees(2) |
400 | 200 | 200 | 400 | ||||||||||||
| Total pro forma increase to cash interest expense |
90,196 | 45,099 | 45,099 | 90,196 | ||||||||||||
| Amortization of capitalized debt issuance costs(3) |
10,339 | 5,169 | 5,169 | 10,339 | ||||||||||||
| Total pro forma increase to total interest expense |
100,535 | 50,268 | 50,268 | 100,535 | ||||||||||||
| Less: Reduction of Gentiva’s existing interest expense and fees(4) |
(8,711 | ) | (4,765 | ) | (3,399 | ) | (7,345 | ) | ||||||||
| Less: Odyssey’s historical interest expense and fees(5) |
(6,574 | ) | (3,491 | ) | (2,872 | ) | (5,955 | ) | ||||||||
| Total pro forma adjustment to interest expense |
$ | 85,250 | $ | 42,012 | $ | 43,997 | $ | 87,235 | ||||||||
| (1) | Interest on borrowings includes pro forma interest expense calculated using a weighted-average annual interest rate of 7.9% based on: (a) a term loan facility consisting of an expected $200 million Term loan A facility and an expected $600 million Term loan B facility and (b) $305 million of new senior unsecured notes plus estimated fees on average outstanding letters of credit of approximately $45.0 million. A 0.125% variance in the interest rates on the floating rate debt would result in a change in total annual pro forma interest expense of approximately $1.0 million. |
| (2) | Reflects pro forma commitment fees of 0.50% on the $80.0 million average available balance under the new revolving credit facility. The average available balance represents the $125.0 million senior secured revolving credit facility less assumed outstanding letters of credit of approximately $45.0 million. |
| (3) | Reflects non-cash amortization of capitalized deferred financing costs related to the Transaction over the term of the related facilities. |
| (4) | Reflects Gentiva’s historical interest expense on its existing term loan, letter of credit fees and commitment fees on its unused revolving credit facility. |
| (5) | Reflects Odyssey’s historical interest expense on its existing term loan, adjusted to reflect interest rate swap agreements, letter of credit fees and commitment fees on its unused revolving credit facility. |
| (d) | Represents the estimated reduction of the pro forma tax provision resulting from the combination of the consolidated tax groups of Gentiva and Odyssey, consideration of their resulting tax attributes and the impact of the pro forma adjustments. This adjustment is preliminary and is subject to additional analysis. The impact of the pro forma tax provision adjustments results in an effective tax rate of 39.9% on pre-tax income from continuing operations, exclusive of the gain on sale of assets, net. There was no tax expense relating to the gain on sale of assets due to the utilization of a capital loss carryforward. |
| (e) | Pro forma depreciation and amortization expense is as follows: |
| (in thousands) |
Year ended January 3, 2010 |
Six Months ended June 28, 2009 |
Six Months ended July 4, 2010 |
Twelve Months ended July 4, 2010 | ||||||||
| Depreciation and amortization |
$ | 29,220 | $ | 14,163 | $ | 15,225 | $ | 30,282 | ||||
Depending on the final purchase price allocation for our acquisition of Odyssey, depreciation and amortization expense may increase or decrease.
50
UNAUDITED PRO FORMA CONDENSED BALANCE SHEET
As of July 4, 2010
(in thousands)
| Gentiva | Odyssey | Pro Forma Adjustments |
Pro Forma As Adjusted |
|||||||||||||
| ASSETS |
||||||||||||||||
| Current assets: |
||||||||||||||||
| Cash and cash equivalents |
$ | 191,066 | $ | 164,501 | $ | (295,400 | )(a) | $ | 60,167 | |||||||
| Accounts receivables, net |
168,541 | 102,984 | — | 271,525 | ||||||||||||
| Deferred tax assets |
14,300 | 10,219 | — | 24,519 | ||||||||||||
| Prepaid expenses and other current assets |
25,358 | 9,793 | — | 35,151 | ||||||||||||
| Total current assets |
399,265 | 287,497 | (295,400 | ) | 391,362 | |||||||||||
| Long-term investments |
— | — | — | — | ||||||||||||
| Note receivable from affiliate |
25,000 | — | — | 25,000 | ||||||||||||
| Investment in affiliate |
25,100 | — | — | 25,100 | ||||||||||||
| Fixed assets, net |
65,258 | 19,064 | — | 84,322 | ||||||||||||
| Intangible assets, net |
253,085 | 19,155 | 140,845 | (b) | 413,085 | |||||||||||
| Goodwill |
304,080 | 192,390 | 603,518 | (c) | 1,099,988 | |||||||||||
| Other assets |
26,943 | 2,669 | 56,111 | (d) | 85,723 | |||||||||||
| Total assets |
$ | 1,098,731 | $ | 520,775 | $ | 505,074 | $ | 2,124,580 | ||||||||
| LIABILITIES AND SHAREHOLDERS’ EQUITY |
||||||||||||||||
| Current liabilities: |
||||||||||||||||
| Accounts payable |
$ | 5,967 | $ | 3,586 | $ | — | $ | 9,553 | ||||||||
| Payroll and related taxes |
24,701 | 27,675 | (4,844 | )(e) | 47,532 | |||||||||||
| Deferred revenue |
40,149 | — | — | 40,149 | ||||||||||||
| Medicare liabilities |
16,145 | 13,690 | — | 29,835 | ||||||||||||
| Obligations under insurance programs |
44,037 | — | 16,051 | (f) | 60,088 | |||||||||||
| Accrued nursing home costs |
— | 17,347 | 1,187 | (g) | 18,534 | |||||||||||
| Other accrued expenses |
35,465 | 44,681 | (21,419 | )(h) | 58,727 | |||||||||||
| Current portion of long-term debt |
— | 33,340 | 6,660 | (i) | 40,000 | |||||||||||
| Total current liabilities |
166,464 | 140,319 | (2,365 | ) | 304,418 | |||||||||||
| Long-term debt |
232,000 | 77,128 | 755,872 | (i) | 1,065,000 | |||||||||||
| Deferred tax liabilities, net |
71,895 | 15,261 | 58,346 | (j) | 145,502 | |||||||||||
| Other liabilities |
23,602 | 2,687 | — | 26,289 | ||||||||||||
| Shareholders’ equity: |
||||||||||||||||
| Common stock |
3,040 | 39 | (39 | )(k) | 3,040 | |||||||||||
| Additional paid-in capital |
365,731 | 131,849 | (131,849 | )(k) | 365,731 | |||||||||||
| Retained earnings |
248,483 | 221,808 | (245,608 | )(k) | 224,683 | |||||||||||
| Accumulated other comprehensive loss, net of income taxes |
— | (763 | ) | 763 | (k) | — | ||||||||||
| Treasury stock |
(12,484 | ) | (69,954 | ) | 69,954 | (k) | (12,484 | ) | ||||||||
| Total shareholders’ equity |
604,770 | 282,979 | (306,779 | ) | 580,970 | |||||||||||
| Noncontrolling interests |
— | 2,401 | — | 2,401 | ||||||||||||
| Total liabilities and shareholders’ equity |
$ | 1,098,731 | $ | 520,775 | $ | 505,074 | $ | 2,124,580 | ||||||||
See notes to unaudited pro forma condensed consolidated balance sheet.
51
NOTES TO UNAUDITED PRO FORMA CONDENSED CONSOLIDATED BALANCE SHEET
| (a) | The following table sets forth the estimated sources and uses of cash in the Transactions, assuming they had occurred on July 4, 2010 (in millions): |
| Sources |
|||
| New revolving credit facility(1) |
$ | — | |
| New senior secured term loan facility(2) |
800.0 | ||
| New senior unsecured notes |
305.0 | ||
| Cash and cash equivalents of Gentiva and Odyssey |
295.4 | ||
| $ | 1,400.4 | ||
| Uses: |
|||
| Odyssey equity consideration(3) |
$ | 963.5 | |
| Repayment of Gentiva existing senior credit facility(4) |
232.7 | ||
| Repayment of Odyssey existing indebtedness(5) |
112.7 | ||
| Estimated transaction fees and expenses(6) |
91.5 | ||
| $ | 1,400.4 | ||
| (1) | In connection with the Merger, we will enter into a $125 million revolving credit facility with a five-year maturity. We do not expect to borrow under the new revolving credit facility at the closing of the Merger, but we expect to issue up to approximately $45.0 million of letters of credit to replace existing letters of credit. See “Description of Other Indebtedness.” |
| (2) | In connection with the Merger, we will enter into a senior secured term loan facility, $200 million of which is expected to be a term loan A facility having a five-year final maturity and $600 million of which is expected to be a term loan B facility having a six-year final maturity. The entire amount of the new senior term loan facility will be drawn at the closing of the Merger. See “Description of Other Indebtedness.” |
| (3) | Reflects amounts payable to holders of Odyssey common stock and to holders of options and restricted stock units granted under Odyssey’s compensation plans. |
| (4) | The entire principal amount, plus accrued interest on Gentiva’s existing senior credit facility, will be paid in full at the closing of the Merger. |
| (5) | Reflects the face amount of Odyssey’s existing indebtedness plus accrued interest, together with the amount payable to terminate the related interest rate swaps. |
| (6) | Reflects the estimated fees and expenses associated with the Transactions, as described in the table below (in thousands): |
| Deferred financing costs: |
|||
| Financing fees(i) |
$ | 57,700 | |
| Other financing costs(ii) |
4,000 | ||
| Total deferred financing costs |
61,700 | ||
| Costs to be expensed by Gentiva: |
|||
| Other financing and transaction costs(ii) |
29,800 | ||
| Total estimated transaction costs |
$ | 91,500 | |
| (i) | Reflects estimated financing fees we will incur in connection with the new senior secured credit facilities and the new senior unsecured notes, which will be capitalized and amortized over the terms of the applicable indebtedness. |
52
| (ii) | Represents transaction costs, other than those included in (i) above, including fees attributable to professional advisors and other fees associated with the completion of the Transactions, which will be allocated between deferred financing costs and expenses associated with the Transactions, based on a study which is not yet complete. Accordingly, the actual amounts allocated to deferred financing costs and transaction expenses, and the corresponding amount of amortization and current expense, respectively, may be different from the amounts presented herein. |
| (b) | Reflects the preliminary pro forma adjustments relating to intangible assets as described in the table below (in thousands): |
| Estimated fair value of intangible assets acquired(1): |
||||
| Amortizable intangible assets |
$ | 60,000 | ||
| Non-amortizing intangible assets |
100,000 | |||
| 160,000 | ||||
| Less: Elimination of Odyssey’s existing intangible assets, net |
(19,155 | ) | ||
| Net adjustment to intangible assets |
$ | 140,845 | ||
| (1) | For purposes of computing pro forma adjustments, we have assumed that the historical values of tangible assets acquired, liabilities assumed and noncontrolling interests reflect fair value. We have estimated a fair value adjustment for identifiable intangible assets such as tradenames and customer relationships of $60.0 million based solely on comparing the size of the Odyssey acquisition to other acquisitions made by Gentiva and estimating a value for these identifiable intangible assets relative to the values ascribed to similar identifiable intangible assets from valuation studies performed in connection with other Gentiva acquisitions. These identifiable intangible assets are being amortized using the straight-line method over assumed estimated useful lives of ten years. In addition, we have assumed a fair value adjustment of $100.0 million for non-amortizing identifiable intangible assets such as certificates of need and licenses based on the accounting treatment of such items in other Gentiva acquisitions. The remaining excess of the purchase price over the fair value of tangible and identifiable intangible assets acquired, liabilities assumed and noncontrolling interests is recorded as goodwill as noted in Item (c). As of the date of this exhibit, we have not performed the valuation studies necessary to determine with any certainty the fair values of the assets we will acquire and the liabilities we will assume and the related allocation of purchase price. The purchase price allocation is subject to change based upon finalization of appraisals and valuation studies that we will arrange to obtain and the final purchase price allocation may differ materially from the preliminary estimates included in the pro forma statements included herein. |
| (c) | Reflects the preliminary estimated excess of purchase price over the fair values of assets acquired and liabilities assumed as a result of the following assumed purchase price allocation (in thousands): |
| Purchase of equity |
$ | 963,500 | ||
| Odyssey historical stockholders’ equity |
(282,979 | ) | ||
| Initial excess of purchase price over historical stockholders’ equity |
680,521 | |||
| Add: Historical Odyssey goodwill and intangible assets, net |
211,545 | |||
| Subtotal |
892,066 | |||
| Less: Preliminary allocation to intangible assets per Item(b) |
(160,000 | ) | ||
| Add: Net adjustment to non-current deferred tax(1) |
63,842 | |||
| Unallocated excess purchase price |
795,908 | |||
| Reversal of Odyssey’s existing goodwill |
(192,390 | ) | ||
| Net adjustment to goodwill |
$ | 603,518 | ||
53
| (1) | Reflects the recognition of non-current deferred tax liabilities related to the preliminary allocation to intangible assets of $160.0 million using an effective tax rate of 39.9%. This adjustment is preliminary and is subject to additional analysis. See note (j). |
| (d) | Reflects the capitalization of estimated financing costs in connection with the indebtedness we will incur in the Transactions consisting of the new senior secured credit facilities and the new senior notes, which will be amortized over the terms of the applicable indebtedness, less the elimination of Odyssey’s historical unamortized debt issuance costs, as follows (in thousands): |
| Estimated deferred financing costs related to the Transactions |
$ | 61,700 | ||
| Write-off of Gentiva debt issuance costs |
(2,920 | ) | ||
| Write-off of Odyssey debt issuance costs |
(2,669 | ) | ||
| Net adjustment to other assets |
$ | 56,111 | ||
| (e) | Reflects the reclassification of approximately $4.8 million of Odyssey’s accrued employee benefits costs from accrued payroll and related taxes to obligations under insurance programs to conform to Gentiva’s presentation format. |
| (f) | Reflects the net adjustment of obligations under insurance programs as a result of the reclassification of certain Odyssey current liabilities to conform to Gentiva’s presentation format (in thousands): |
| Accrued employee benefit costs |
$ | 4,844 | |
| Accrued workers’ compensation expense |
11,207 | ||
| Net adjustment to obligations under insurance programs |
$ | 16,051 | |
| (g) | Reflects the reclassification of approximately $1.2 million of Gentiva’s accrued nursing home costs from other accrued expenses. |
| (h) | Reflects the net adjustment of other accrued expenses as a result of the reclassification of certain current liabilities and adjustments as a result of the Transactions as follows (in thousands): |
| Odyssey’s accrued workers’ compensation expense |
$ | (11,207 | ) | |
| Gentiva’s accrued nursing home costs |
(1,187 | ) | ||
| Accrued interest payments (Items (a)(4) and (a)(5)) |
(1,848 | ) | ||
| Termination of Odyssey’s interest rate swap agreement (Item (a)(5)) |
(1,177 | ) | ||
| Assumed tax benefit on financing and transaction costs to be expensed by Gentiva |
(6,000 | ) | ||
| Net adjustment to other accrued expenses |
$ | (21,419 | ) | |
| (i) | Reflects the net adjustments to long-term debt as a result of the Transactions as follows (in thousands): |
| Current Portion |
Long-Term Portion |
Total Debt | ||||||||||
| New senior secured term loan facility |
$ | 40,000 | $ | 760,000 | $ | 800,000 | ||||||
| New senior notes |
— | 305,000 | 305,000 | |||||||||
| Repayment of Gentiva existing credit facility |
— | (232,000 | ) | (232,000 | ) | |||||||
| Repayment of Odyssey existing indebtedness |
(33,340 | ) | (77,128 | ) | (110,468 | ) | ||||||
| Net adjustments to long-term debt |
$ | 6,660 | $ | 755,872 | $ | 762,532 | ||||||
54
| (j) | Reflects the net adjustment to net non-current deferred tax liabilities as follows (in thousands): |
| Reduction of non-current deferred tax liabilities related to historical Odyssey intangible assets and goodwill |
$ | (5,910 | ) | |
| Reduction in non-current deferred tax assets resulting from the termination of the interest rate swap |
414 | |||
| Estimated increase in non-current deferred tax liabilities relating to the identifiable intangible assets resulting from the Transactions (as noted in Item (c)(1)) |
63,842 | |||
| Net adjustment to deferred tax liabilities |
$ | 58,346 | ||
| (k) | Reflects the net adjustment to shareholders’ equity, as follows (in thousands): |
| Elimination of Odyssey’s shareholders’ equity |
$ | (282,979 | ) | |
| Other financing and transaction costs, net of tax(1) |
(23,800 | ) | ||
| Total pro forma adjustment to shareholders’ equity |
$ | (306,779 | ) | |
| (1) | Represents other financing and transaction costs to be expensed by Gentiva of $29.8 million as noted in Item (a)(6) above, less an assumed tax benefit of $6.0 million as noted in Item (h) above. The assumed tax benefit is estimated at a rate below the effective tax rate due to the non-deductibility of certain financing and transaction costs for tax purposes. |
55
DESCRIPTION OF OTHER INDEBTEDNESS
New Senior Credit Facility
Overview
In connection with the Merger, Gentiva will enter into a senior secured credit agreement with Bank of America, N.A., as administrative agent, the lenders and the other parties thereto. Affiliates of certain of the initial purchasers will be lenders under our senior secured credit agreement.
The senior secured credit facility will provide senior secured financing consisting of a term loan facility, $200 million of which is expected to be a term loan A facility and $600 million of which is expected to be a term loan B facility, and a $125 million revolving credit facility. All of the term loans will be drawn at the closing of the Merger.
The revolving credit facility will include borrowing capacity available for letters of credit and for borrowings on same-day notice, referred to as the swingline loans and will be available in U.S. dollars. No portion of the revolving credit facility is expected to be drawn on the closing date of the Merger with certain exceptions for the replacement of existing letters of credit.
Interest Rate and Fees
Borrowings under the revolving credit facility and term loan facility will bear interest at a rate equal to an applicable margin plus, at our option, either (a) a base rate determined by reference to the highest of (1) the corporate base rate of interest of Bank of America, N.A., (2) the federal funds rate plus 0.50% and (3) a LIBOR rate determined by reference to the costs of funds for deposits in U.S. dollars for the interest period relevant to such borrowing adjusted for certain additional costs, plus 1.00%, or (b) a LIBOR rate determined by reference to the costs of funds for deposits in U.S. dollars for the interest period relevant to such borrowing adjusted for certain additional costs.
We will be required to pay a commitment fee to the lenders under the revolving credit facility in respect of the unutilized commitments thereunder. The commitment fee rate is 0.50% per annum. We must also pay customary letter of credit fees.
Maturity
Term loan A of the term loan facility matures five years after the closing date (the “Term Loan A Maturity Date”).
Term loan B of the term loan facility matures six years after the closing date (the “Term Loan B Maturity Date”).
The revolving credit facility matures five years after the closing date.
Scheduled Amortization
Term loan A is expected to be subject to annual amortization of principal (in equal quarterly installments), in an aggregate principal amount equal to 12.5% of the initial aggregate term loan A advances. The balance of the term loan A advances will be payable on the Term Loan A Maturity Date.
56
Term loan B is expected to be subject to annual amortization of principal (in equal quarterly installments), in an aggregate principal amount equal to 2.5% of the initial aggregate term loan B advances. The balance of the term loan B advances will be payable on the Term Loan B Maturity Date.
Advances under the revolving credit facility may be made, and letters of credit may be issued, on a revolving basis up to the full amount of the revolving credit facility.
Prepayments
The revolving credit facility will require us to prepay outstanding loans under the revolving credit facility at any time the aggregate outstanding amount of loans and letter of credit obligations under the revolving credit facility exceeds the aggregate commitment of all lenders under the revolving credit facility, by an amount equal to such excess.
We may voluntarily repay outstanding loans under the revolving credit facility or the term loan facility at any time without premium or penalty, other than customary “breakage” costs with respect to LIBOR loans.
Prepayments and commitment reductions will be required in connection with (i) certain asset sales, (ii) certain extraordinary receipts such as certain insurance proceeds, (iii) cash proceeds from the issuance of debt (other than the notes and the exchange notes) and certain other exceptions, (iv) 50% of the proceeds from the issuance of equity with step-downs based on leverage, subject to certain exceptions, and (v) 75% of “Excess Cash Flow” (as defined in the loan documentation) with two expected step-downs based on leverage.
Guarantees and Security
All obligations under the revolving credit facility and the term loan facility will be unconditionally guaranteed by substantially all of our existing and future direct and indirect domestic wholly-owned subsidiaries (the “Guarantors”).
Subject to certain exceptions, all obligations under the revolving credit facility and the term loan facility, and the guarantees of those obligations, will be secured by all of the following (collectively, the “Collateral”):
(a) all present and future shares of capital stock of (or other ownership or profit interests in) each of our present and future subsidiaries (limited, in the case of each entity that is a “controlled foreign corporation” under Section 957 of the Internal Revenue Code, to 66% of the voting stock of each such entity to the extent that security over a greater percentage would result in a material tax liability);
(b) all present and future intercompany debt of Gentiva and each Guarantor;
(c) all of the present and future property and assets, real and personal, of Gentiva and each Guarantor, including, but not limited to, cash, equipment, inventory, accounts receivable, owned real estate, leaseholds, fixtures, deposit and bank accounts, investment property, license rights, patents, trademarks, trade names, copyrights, other intellectual property and other general intangibles, insurance proceeds and instruments; and
(d) all proceeds and products of the property and assets described in clauses (a), (b) and (c) above.
The Collateral ratably secures the relevant party’s obligations in respect of the senior secured credit facilities, any interest rate swap or similar agreements with a senior lender or an affiliate of a senior lender and treasury management agreements (including purchasing cards and credit cards) with a senior lender or an affiliate of a senior lender.
57
Certain Covenants and Events of Default
The revolving credit facility and term loan facility will contain a number of covenants that, among other things, restrict, subject to certain exceptions, our ability and the ability of our subsidiaries to:
| • | incur additional indebtedness or issue certain preferred stock; |
| • | create liens on assets; |
| • | enter into sale and leaseback transactions; |
| • | engage in mergers or consolidations with or into other companies; |
| • | sell assets; |
| • | pay dividends and distributions or repurchase our capital stock; |
| • | make investments, loans or advances; |
| • | make certain acquisitions; |
| • | engage in certain transactions with affiliates; |
| • | amend material agreements (including our organizational documents and those of our subsidiaries); |
| • | repay certain indebtedness; |
| • | change our nature of business; |
| • | change our accounting policies and practices; |
| • | grant negative pledges; and |
| • | incur capital expenditures. |
In addition, the revolving credit facility and term loan facility will require us to maintain the following financial covenants:
| • | a minimum interest coverage ratio; and |
| • | a maximum total leverage ratio. |
The revolving credit facility and term loan facility will also contain certain customary affirmative covenants and events of default.
58