Attached files
| file | filename |
|---|---|
| 8-K - 8-K - SMURFIT-STONE CONTAINER ENTERPRISES INC | a10-15135_18k.htm |
| EX-99.1 - EX-99.1 - SMURFIT-STONE CONTAINER ENTERPRISES INC | a10-15135_1ex99d1.htm |
Exhibit 99.2
|
|
Earnings Update Second Quarter 2010 Pat Moore Chief Executive Officer Steve Klinger President & Chief Operating Officer Tim Griffith Vice President, Investor Relations &Treasurer August 3, 2010 |
|
|
Forward-Looking Statements & Non-GAAP Measures This presentation contains statements and illustrations relating to future results, which are forward-looking statements as that term is defined in the Private Securities Litigation Reform Act of 1995. Actual results may differ materially from those projected as a result of certain risks and uncertainties, including but not limited to changes in general economic conditions, pricing in key product lines, seasonality, changes in input costs including recycled fiber and energy costs, as well as other risks and uncertainties described in the Company’s Annual Report on Form 10-K for the year ended December 31, 2009, as updated from time to time in the Company’s Securities and Exchange Commission filings. In this presentation, certain non-U.S. GAAP financial information is presented. A reconciliation of that information to U.S. GAAP financial measures and additional disclosure regarding our use of non-GAAP financial measures are included in the schedules that are a part of this presentation. The Company does not intend to review, revise or update any particular forward-looking statements in light of future events. |
|
|
Today’s Agenda Priorities Second Quarter Performance Update: Selected Financial Items Outlook Questions and Discussion |
|
|
Priorities Improve EBITDA margins: Achieve targeted SG&A savings; set targets for 2011 Invest for sustainable cost savings & profitable growth Drive free cash flow growth |
|
|
Second Quarter 2010 Highlights Financial results significantly impacted by: Bankruptcy-related and emergence items Maintenance-related downtime Sequential operating profit improved due to increased capacity utilization, selling prices and demand Improved productivity at mills and converting facilities Successful emergence from reorganization |
|
|
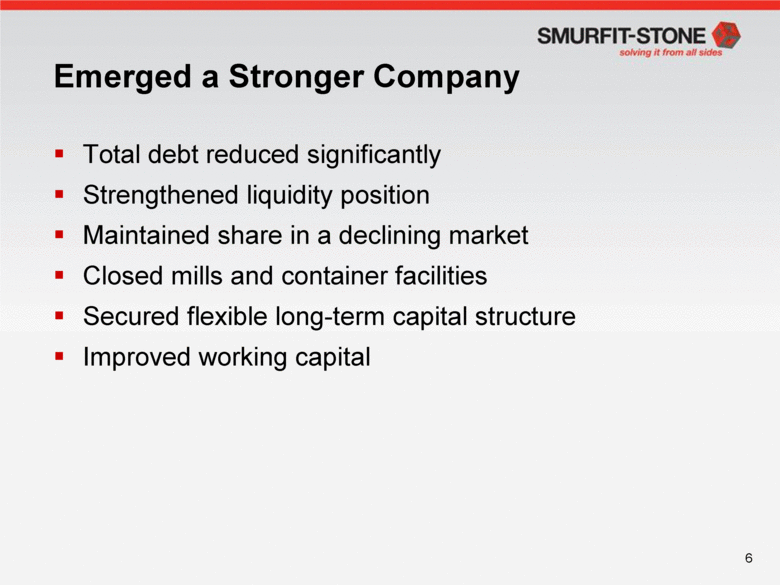
Emerged a Stronger Company Total debt reduced significantly Strengthened liquidity position Maintained share in a declining market Closed mills and container facilities Secured flexible long-term capital structure Improved working capital |
|
|
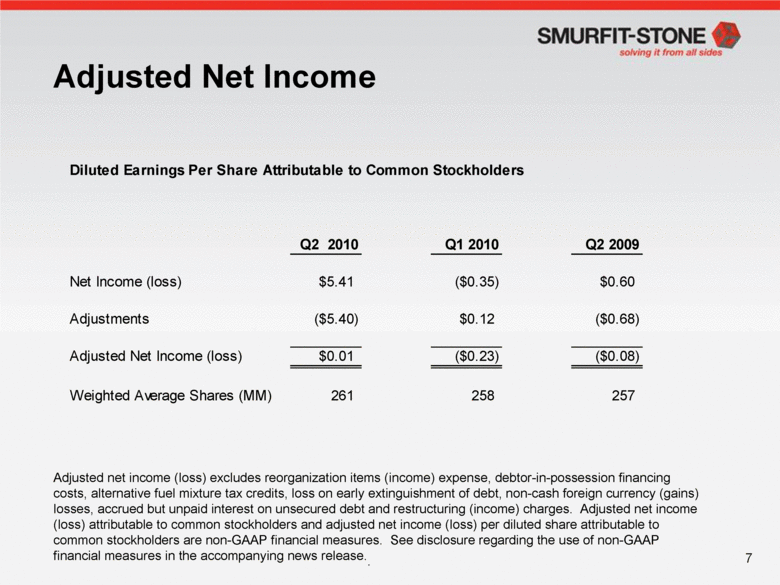
Adjusted Net Income Adjusted net income (loss) excludes reorganization items (income) expense, debtor-in-possession financing costs, alternative fuel mixture tax credits, loss on early extinguishment of debt, non-cash foreign currency (gains) losses, accrued but unpaid interest on unsecured debt and restructuring (income) charges. Adjusted net income (loss) attributable to common stockholders and adjusted net income (loss) per diluted share attributable to common stockholders are non-GAAP financial measures. See disclosure regarding the use of non-GAAP financial measures in the accompanying news release Diluted Earnings Per Share Attributable to Common Stockholders Q2 2010 Q1 2010 Q2 2009 Net Income (loss) $5.41 ($0.35) $0.60 Adjustments ($5.40) $0.12 ($0.68) Adjusted Net Income (loss) $0.01 ($0.23) ($0.08) Weighted Average Shares (MM) 261 258 257 |
|
|
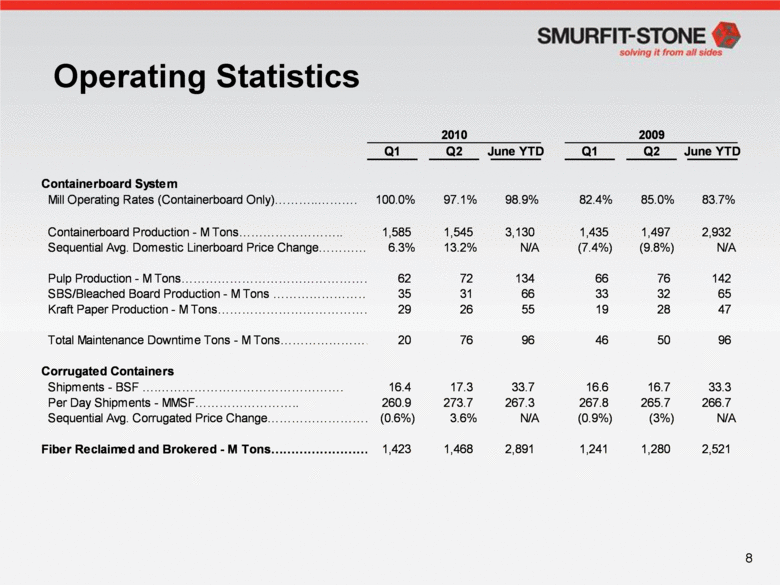
Operating Statistics 2009 2010 2,521 1,280 1,241 2,891 1,468 1,423 Fiber Reclaimed and Brokered - M Tons N/A (3%) (0.9%) N/A 3.6% (0.6%) Sequential Avg. Corrugated Price Change 266.7 265.7 267.8 267.3 273.7 260.9 Per Day Shipments - MMSF 33.3 16.7 16.6 33.7 17.3 16.4 Shipments - BSF Corrugated Containers 96 50 46 96 76 20 Total Maintenance Downtime Tons - M Tons 47 28 19 55 26 29 Kraft Paper Production - M Tons 65 32 33 66 31 35 SBS/Bleached Board Production - M Tons 142 76 66 134 72 62 Pulp Production - M Tons N/A (9.8%) (7.4%) N/A 13.2% 6.3% Sequential Avg. Domestic Linerboard Price Change 2,932 1,497 1,435 3,130 1,545 1,585 Containerboard Production - M Tons 83.7% 85.0% 82.4% 98.9% 97.1% 100.0% Mill Operating Rates (Containerboard Only) Containerboard System June YTD Q2 Q1 June YTD Q2 Q1 |
|
|
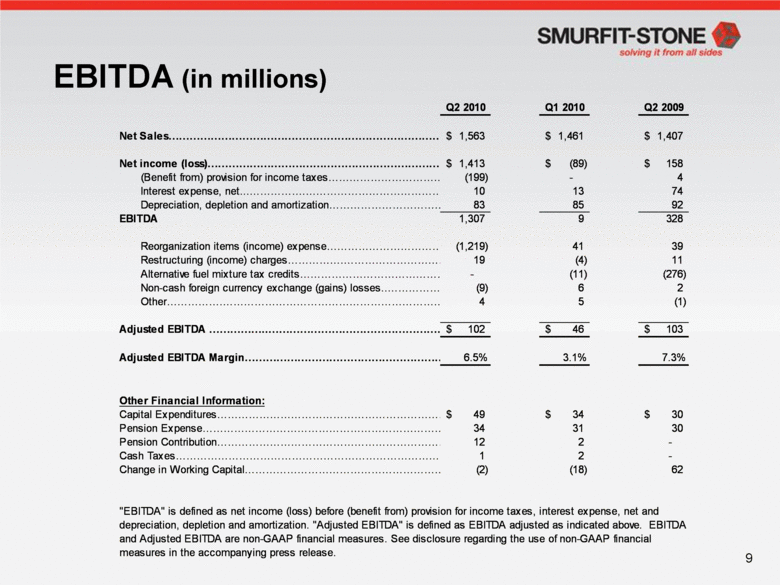
EBITDA (in millions) "EBITDA" is defined as net income (loss) before (benefit from) provision for income taxes, interest expense, net and depreciation, depletion and amortization. "Adjusted EBITDA" is defined as EBITDA adjusted as indicated above. EBITDA and Adjusted EBITDA are non-GAAP financial measures. See disclosure regarding the use of non-GAAP financial measures in the accompanying press release. 62 (18) (2) Change in Working Capital 2 1 Cash Taxes 2 12 Pension Contribution 30 31 34 Pension Expense - - - Alternative fuel mixture tax credits $30 $34 $49 Capital Expenditures Other Financial Information: 7.3% 3.1% 6.5% Adjusted EBITDA Margin $103 $46 $102 Adjusted EBITDA (1) 5 4 Other 2 6 (9) Non-cash foreign currency exchange (gains) losses (276) (11) 11 (4) 19 Restructuring (income) charges 39 41 (1,219) Reorganization items (income) expense 328 9 1,307 EBITDA 92 85 83 Depreciation, depletion and amortization 74 13 10 Interest expense, net 4 (199) (Benefit from) provision for income taxes $158 $(89) $1,413 Net income (loss) $1,407 $1,461 $1,563 Net Sales Q2 2010 Q1 2010 Q2 2009 |
|
|
|
|
|
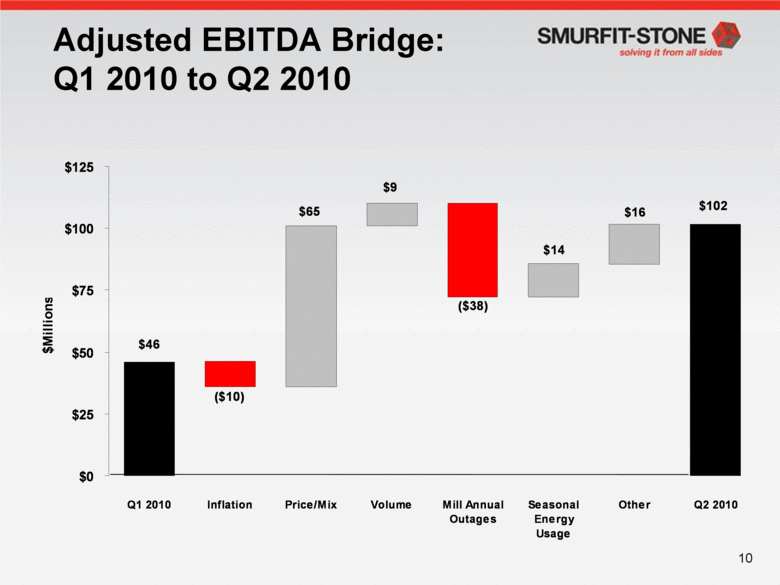
Adjusted EBITDA Bridge: Q1 2010 to Q2 2010 $46 ($10) $9 ($38) $14 $16 $102 $65 $0 $25 $50 $75 $100 $125 Q1 2010 Inflation Price/Mix Volume Mill Annual Outages Seasonal Energy Usage Other Q2 2010 $Millions |
|
|
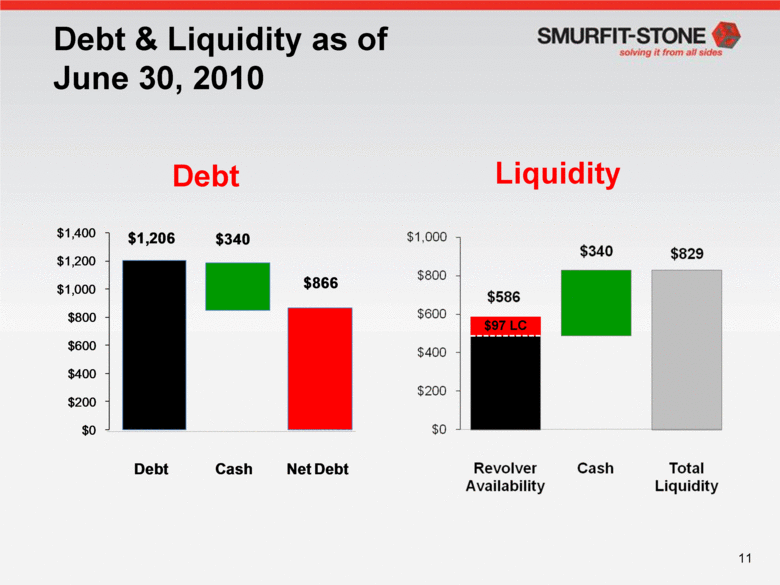
Debt & Liquidity as of June 30, 2010 Liquidity Debt $97 LC $1,206 $340 $866 $0 $200 $400 $600 $800 $1,000 $1,200 $1,400 Debt Cash Net Debt |
|
|
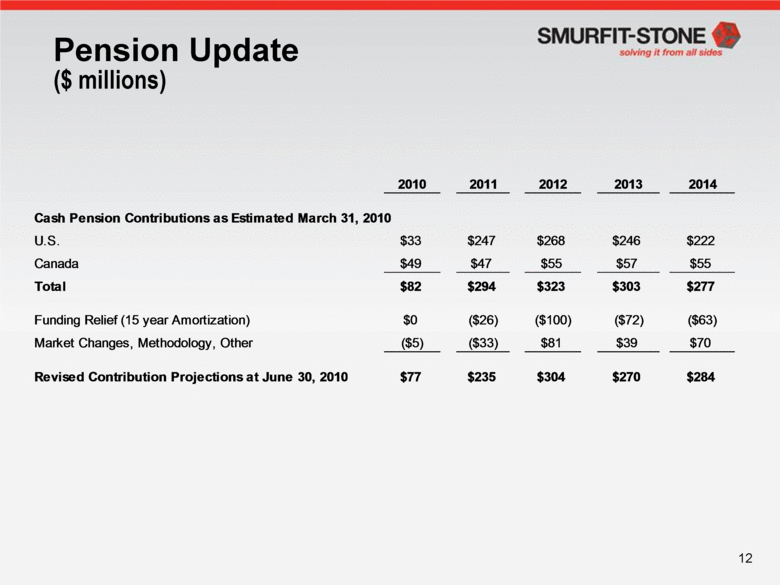
Pension Update ($ millions) $284 $270 $304 $235 $77 Revised Contribution Projections at June 30, 2010 $70 $39 $81 ($33) ($5) Market Changes, Methodology, Other ($63) ($72) ($100) ($26) $0 Funding Relief (15 year Amortization) $277 $303 $323 $294 $82 Total $55 $57 $55 $47 $49 Canada $222 $246 $268 $247 $33 U.S. Cash Pension Contributions as Estimated March 31, 2010 2014 2013 2012 2011 2010 |
|
|
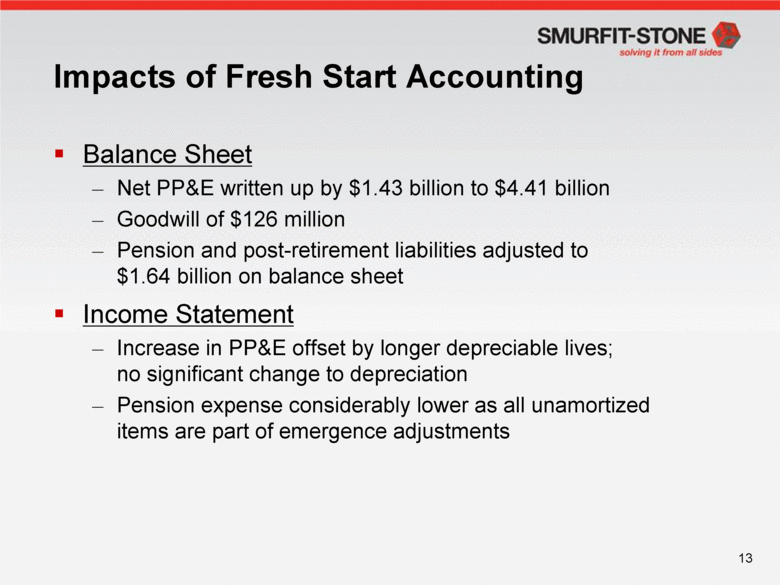
Impacts of Fresh Start Accounting Balance Sheet Net PP&E written up by $1.43 billion to $4.41 billion Goodwill of $126 million Pension and post-retirement liabilities adjusted to $1.64 billion on balance sheet Income Statement Increase in PP&E offset by longer depreciable lives; no significant change to depreciation Pension expense considerably lower as all unamortized items are part of emergence adjustments |
|
|
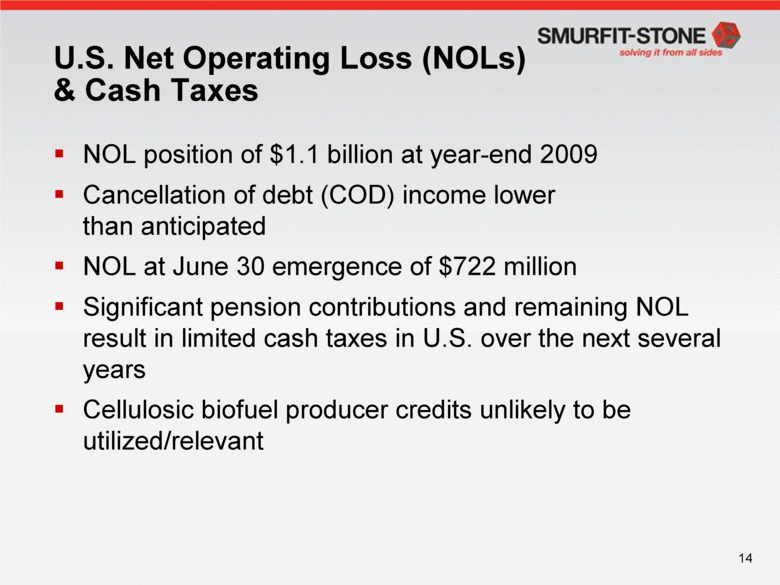
U.S. Net Operating Loss (NOLs) & Cash Taxes NOL position of $1.1 billion at year-end 2009 Cancellation of debt (COD) income lower than anticipated NOL at June 30 emergence of $722 million Significant pension contributions and remaining NOL result in limited cash taxes in U.S. over the next several years Cellulosic biofuel producer credits unlikely to be utilized/relevant |
|
|
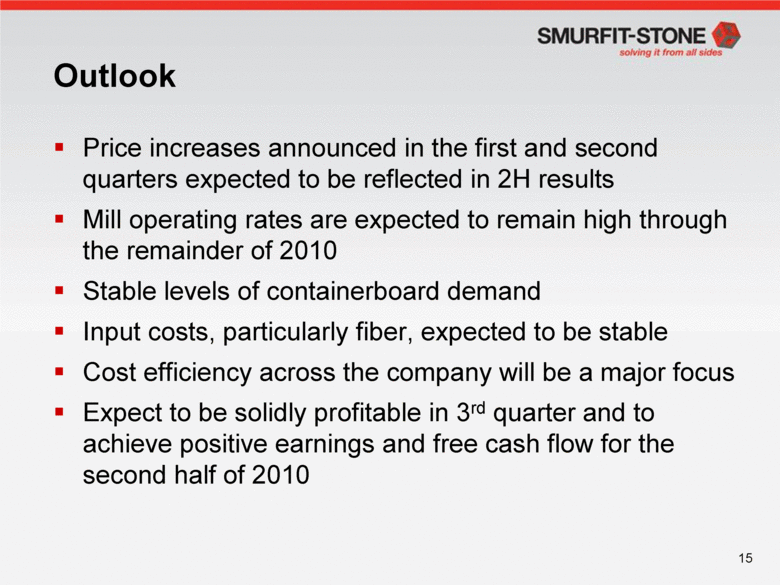
Outlook Price increases announced in the first and second quarters expected to be reflected in 2H results Mill operating rates are expected to remain high through the remainder of 2010 Stable levels of containerboard demand Input costs, particularly fiber, expected to be stable Cost efficiency across the company will be a major focus Expect to be solidly profitable in 3rd quarter and to achieve positive earnings and free cash flow for the second half of 2010 |
|
|
Questions & Discussion |
|
|
Appendix |
|
|
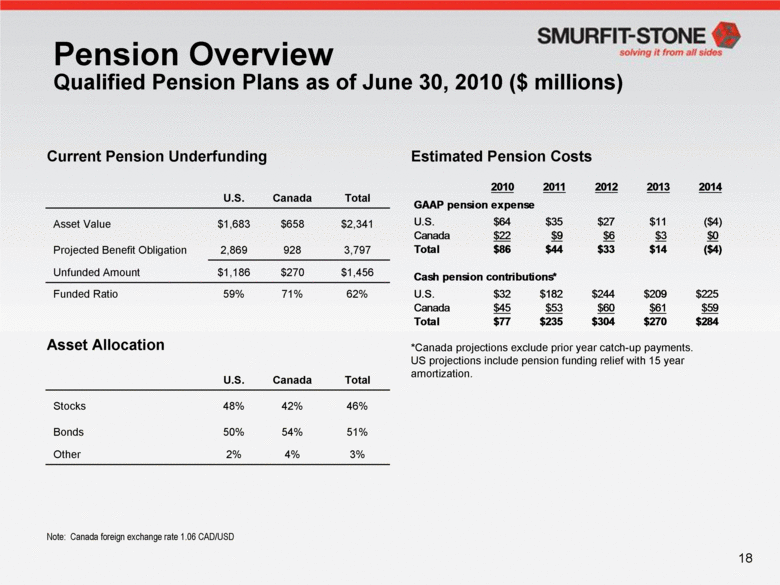
Note: Canada foreign exchange rate 1.06 CAD/USD Pension Overview Qualified Pension Plans as of June 30, 2010 ($ millions) Current Pension Underfunding Estimated Pension Costs Asset Allocation *Canada projections exclude prior year catch-up payments. US projections include pension funding relief with 15 year amortization. U.S. Canada Total Asset Value $1,683 $658 $2,341 Projected Benefit Obligation 2,869 928 3,797 Unfunded Amount $1,186 $270 $1,456 Funded Ratio 59% 71% 62% U.S. Canada Total Stocks 48% 42% 46% Bonds 50% 54% 51% Other 2% 4% 3% $284 $270 $304 $235 $77 Total $59 $61 $60 $53 $45 Canada $225 $209 $244 $182 $32 U.S. Cash pension contributions* ($4) $14 $33 $44 $86 Total $0 $3 $6 $9 $22 Canada ($4) $11 $27 $35 $64 U.S. GAAP pension expense 2014 2013 2012 2011 2010 |
|
|
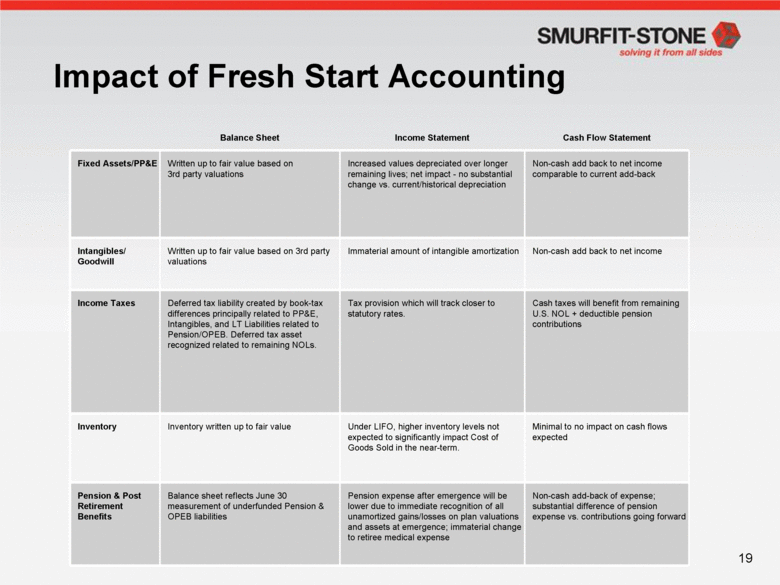
Impact of Fresh Start Accounting Balance Sheet Income Statement Cash Flow Statement Fixed Assets/PP&E Written up to fair value based on 3rd party valuations Increased values depreciated over longer remaining lives; net impact - no substantial change vs. current/historical depreciation Non-cash add back to net income comparable to current add-back Intangibles/ Goodwill Written up to fair value based on 3rd party valuations Immaterial amount of intangible amortization Non-cash add back to net income Income Taxes Deferred tax liability created by book-tax differences principally related to PP&E, Intangibles, and LT Liabilities related to Pension/OPEB. Deferred tax asset recognized related to remaining NOLs. Tax provision which will track closer to statutory rates. Cash taxes will benefit from remaining U.S. NOL + deductible pension contributions Inventory Inventory written up to fair value Under LIFO, higher inventory levels not expected to significantly impact Cost of Goods Sold in the near-term. Minimal to no impact on cash flows expected Pension & Post Retirement Benefits Balance sheet reflects June 30 measurement of underfunded Pension & OPEB liabilities Pension expense after emergence will be lower due to immediate recognition of all unamortized gains/losses on plan valuations and assets at emergence; immaterial change to retiree medical expense Non-cash add-back of expense; substantial difference of pension expense vs. contributions going forward 19 |
|
|
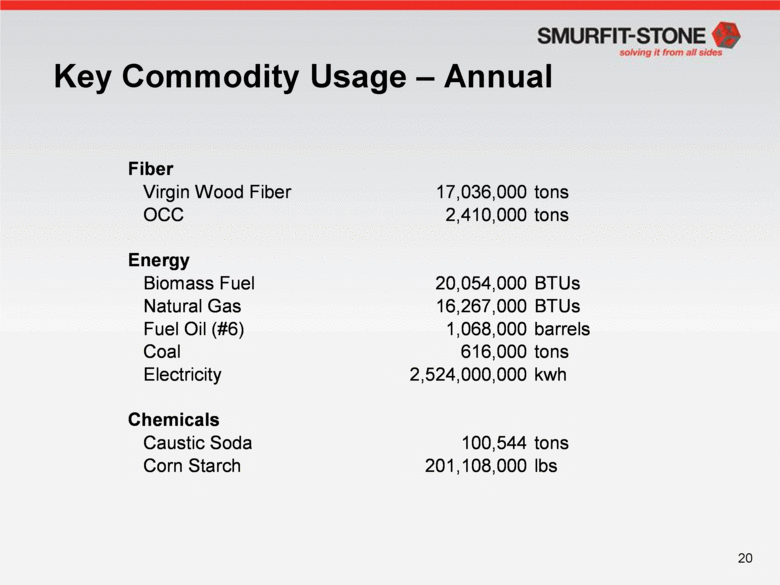
Key Commodity Usage – Annual lbs 201,108,000 Corn Starch tons 100,544 Caustic Soda Chemicals kwh 2,524,000,000 Electricity tons 616,000 Coal barrels 1,068,000 Fuel Oil (#6) BTUs 16,267,000 Natural Gas BTUs 20,054,000 Biomass Fuel Energy tons 2,410,000 OCC tons 17,036,000 Virgin Wood Fiber Fiber |
|
|
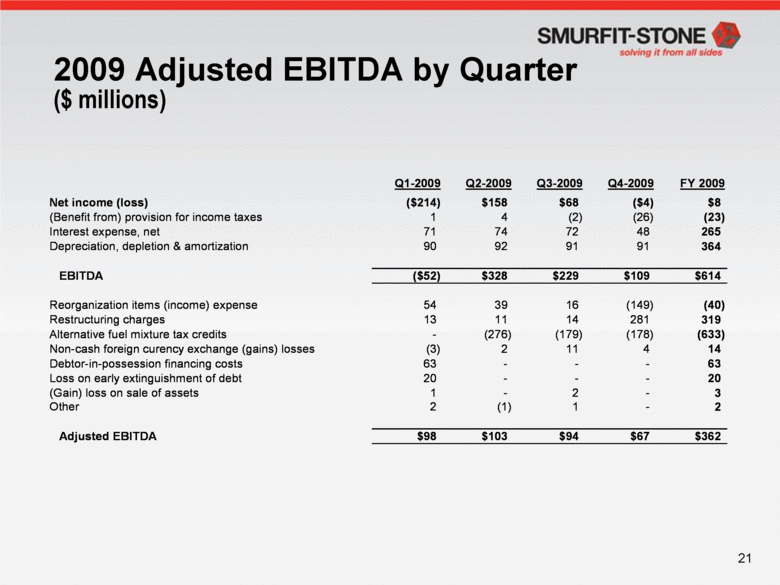
2009 Adjusted EBITDA by Quarter ($ millions) $362 $67 $94 $103 $98 Adjusted EBITDA 2 - 1 (1) 2 Other 3 - 2 - 1 (Gain) loss on sale of assets 20 - - - 20 Loss on early extinguishment of debt 63 - - - 63 Debtor-in-possession financing costs 14 4 11 2 (3) Non-cash foreign curency exchange (gains) losses (633) (178) (179) (276) - Alternative fuel mixture tax credits 319 281 14 11 13 Restructuring charges (40) (149) 16 39 54 Reorganization items (income) expense $614 $109 $229 $328 ($52) EBITDA 364 91 91 92 90 Depreciation, depletion & amortization 265 48 72 74 71 Interest expense, net (23) (26) (2) 4 1 (Benefit from) provision for income taxes $8 ($4) $68 $158 ($214) Net income (loss) FY 2009 Q4-2009 Q3-2009 Q2-2009 Q1-2009 |
|
|
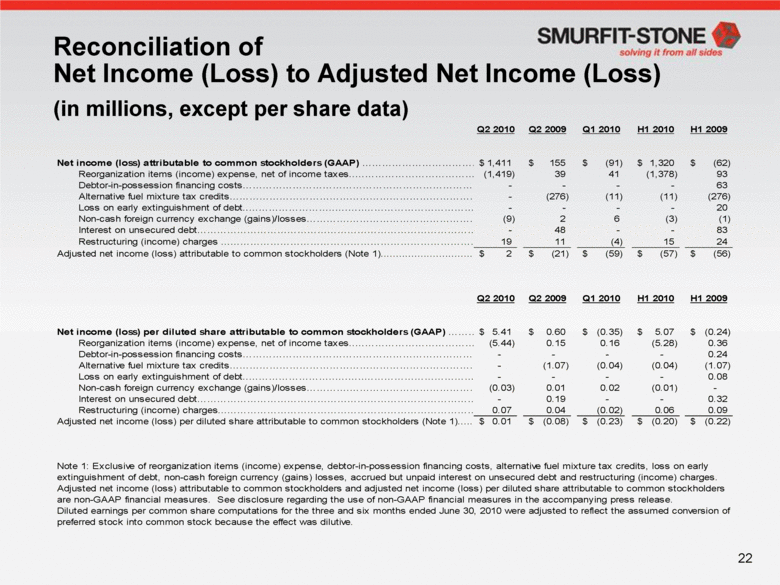
Reconciliation of Net Income (Loss) to Adjusted Net Income (Loss) (in millions, except per share data) Q2 2010 Q2 2009 Q1 2010 H1 2010 H1 2009 Net income (loss) attributable to common stockholders (GAAP) $1,411 $155 $(91) $1,320 $(62) Reorganization items (income) expense, net of income taxes (1,419) 39 41 (1,378) 93 Debtor-in-possession financing costs - - - - 63 Alternative fuel mixture tax credits - (276) (11) (11) (276) Loss on early extinguishment of debt - - - - 20 Non-cash foreign currency exchange (gains)/losses (9) 2 6 (3) (1) Interest on unsecured debt - 48 - - 83 Restructuring (income) charges 19 11 (4) 15 24 Adjusted net income (loss) attributable to common stockholders (Note 1) $2 $(21) $(59) $(57) $(56) Q2 2010 Q2 2009 Q1 2010 H1 2010 H1 2009 Net income (loss) per diluted share attributable to common stockholders (GAAP) $5.41 $0.60 $(0.35) $5.07 $(0.24) Reorganization items (income) expense, net of income taxes (5.44) 0.15 0.16 (5.28) 0.36 Debtor-in-possession financing costs - - - - 0.24 Alternative fuel mixture tax credits - (1.07) (0.04) (0.04) (1.07) Loss on early extinguishment of debt - - - - 0.08 Non-cash foreign currency exchange (gains)/losses (0.03) 0.01 0.02 (0.01) - Interest on unsecured debt - 0.19 - - 0.32 Restructuring (income) charges 0.07 0.04 (0.02) 0.06 0.09 Adjusted net income (loss) per diluted share attributable to common stockholders (Note 1) $0.01 $(0.08) $(0.23) $(0.20) $(0.22) Note 1: Exclusive of reorganization items (income) expense, debtor-in-possession financing costs, alternative fuel mixture tax credits, loss on early extinguishment of debt, non-cash foreign currency (gains) losses, accrued but unpaid interest on unsecured debt and restructuring (income) charges. Adjusted net income (loss) attributable to common stockholders and adjusted net income (loss) per diluted share attributable to common stockholders are non-GAAP financial measures. See disclosure regarding the use of non-GAAP financial measures in the accompanying press release. Diluted earnings per common share computations for the three and six months ended June 30, 2010 were adjusted to reflect the assumed conversion of preferred stock into common stock because the effect was dilutive. |

