Attached files
| file | filename |
|---|---|
| 8-K - FORM 8-K - DOLE FOOD CO INC | v56908e8vk.htm |
| EX-99.1 - EX-99.1 - DOLE FOOD CO INC | v56908exv99w1.htm |
Exhibit 99.2

| 1 1 Dole Food Company, Inc. Earnings Call and Webcast Second Quarter 2010 August 3, 2010 |

| 2 2 Beth Potillo Treasurer |

| 3 3 Forward Looking Statements Some of the information presented contains forward-looking statements that involve a number of risks and uncertainties. Forward looking statements, which are based on management's assumptions and describe the company's future plans, strategies and expectations, are generally identifiable by the use of terms such as "anticipate," "will," "expect," "believe," "shall," or similar expressions. The potential risks and uncertainties that could cause the company's actual results to differ materially from those expressed or implied herein include weather-related phenomena; market responses to industry volume pressures; product and raw materials supplies and pricing; electrical power supply and pricing; changes in interest and currency exchange rates; economic crises; quotas, tariffs and other governmental actions; and international conflict. |

| 4 Non-GAAP Financial Measures EBIT, Adjusted EBITDA and Comparable income from continuing operations (total and per share) are measures commonly used by financial analysts in evaluating the performance of companies. EBIT is calculated by subtracting income from discontinued operations, net of incomes taxes, from net income, by subtracting the gain on disposal of discontinued operations, net of income taxes, by adding interest expense and by adding income tax expenses to net income. Adjusted EBITDA is calculated from EBIT by adding depreciation and amortization from continuing operations, adding the net unrealized loss or subtracting the net unrealized gain on certain derivative instruments (foreign currency and bunker fuel hedges and the cross currency swap), adding the foreign currency loss or subtracting the foreign currency gain on the vessel obligations, adding the net unrealized loss or subtracting the net unrealized gain on foreign denominated instruments, and by subtracting gains on asset sales. Comparable income from continuing operations is calculated from income from continuing operations by adding the net unrealized loss or subtracting the net unrealized gain on certain derivative instruments (foreign currency and bunker fuel hedges and the cross currency swap), net of income taxes, adding the foreign currency loss or subtracting the foreign currency gain on the vessel obligations, net of income taxes, adding the net unrealized loss or subtracting the net unrealized gain on foreign denominated instruments, net of income taxes, and subtracting gains on asset sales, net of income taxes. These items have been adjusted because management excludes these amounts when evaluating the performance of Dole. Net debt is calculated as total debt less cash and cash equivalents. EBIT, Adjusted EBITDA and Comparable income from continuing operations (total and per share) are not calculated or presented in accordance with U.S. GAAP and they are not a substitute for net income attributable to Dole Food Company, Inc., net income, income from continuing operations, cash flows from operating activities or any other measure prescribed by U.S. GAAP. Further, EBIT, Adjusted EBITDA and Comparable income from continuing operations (total and per share) as used herein are not necessarily comparable to similarly titled measures of other companies. However, Dole has included EBIT, Adjusted EBITDA and Comparable income from continuing operations (total and per share) herein because management believes that they are useful performance measures for Dole. In addition, EBIT, Adjusted EBITDA and Comparable income from continuing operations (total and per share) are presented because management believes that these measures are frequently used by securities analysts, investors and others in the evaluation of Dole. |

| 5 5 David A. DeLorenzo Chief Executive Officer |

| 6 ($ millions) $113 $143 Packaged foods Fresh vegetables Fresh fruit Note: Graph does not include Corporate Q2 Adjusted EBITDA declined $30 million Fresh fruit decreased $37 million Lower local banana pricing in Europe and Asia; higher costs in Europe and North America Vegetables improved $10 million Improvements in both packaged salads and fresh-packed vegetables Packaged foods increased $1 million Improved volumes and pricing for canned pineapple Higher volumes and lower costs for frozen fruit Q2 Adjusted EBITDA |

| 7 Packaged Foods Strong performance despite earlier Easter Higher pricing and volumes in global canned pineapple Higher volumes and lower costs in frozen fruit New products ahead of plan |

| 8 Fresh Vegetables Dole investments in infrastructure and process improvement yielding substantial results Higher volumes Improved pricing Lower costs Raw materials Plant utilization |

| 9 Fresh Fruit Chilean business improved with higher grape volumes and prices North America banana business continues to perform well Higher prices Higher costs primarily due to higher prices paid to 3rd party growers Europe improved during Q2, but still challenging Local prices improved, but weakening euro reduced $ revenues per box Asia impacted by persistent weak economic conditions in Japan, but other markets still strong |

| 10 Recent Developments EU tariff refund of $7 million recorded in 2nd quarter Total benefit to Fiscal 2010 EBIT of $16 million at current exchange rates July 15 decision in favor of Dole in last remaining lawsuit brought by Nicaraguan plaintiffs in the U.S. Court vacated earlier $1.6 million judgment against Dole, citing rampant fraud by plaintiffs |

| 11 Capital Structure Reduced Net debt by $51 million during the quarter Non-core asset sales in the first half totaled $18 million On track to hit $50 million target After close of 2nd quarter, executed contract for sale of two additional properties totaling $6.5 million |

| 12 Summary Another strong quarter, despite challenging economic climate Encouraged by continued strong performance of packaged foods and fresh vegetable segments Results demonstrate benefits of our diversified portfolio |

| 13 13 Joseph S. Tesoriero Chief Financial Officer |

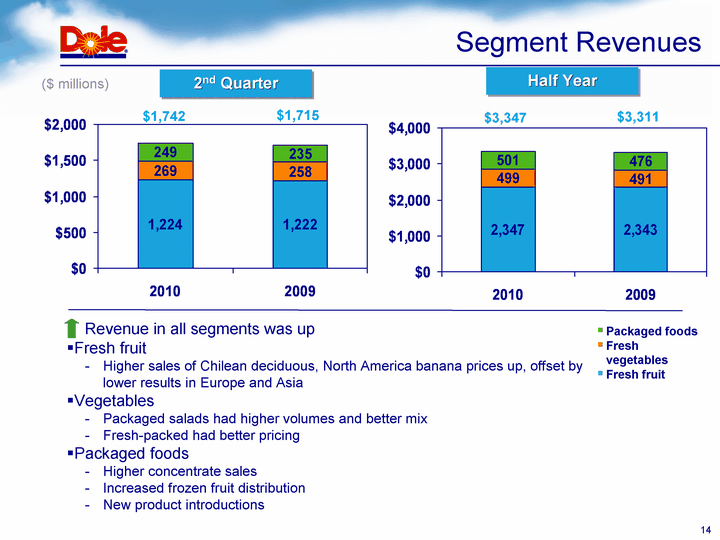
| 14 Segment Revenues Packaged foods Fresh vegetables Fresh fruit ($ millions) 2010 2009 Fresh Fruit 2347 2343 Fresh Vegetables 499 491 Packaged Foods 501 476 $3,347 $3,311 Half Year 2nd Quarter 2010 2009 Fresh Fruit 1224 1222 Fresh Vegetables 269 258 Packaged Foods 249 235 $1,742 $1,715 Revenue in all segments was up Fresh fruit Higher sales of Chilean deciduous, North America banana prices up, offset by lower results in Europe and Asia Vegetables Packaged salads had higher volumes and better mix Fresh-packed had better pricing Packaged foods Higher concentrate sales Increased frozen fruit distribution New product introductions |

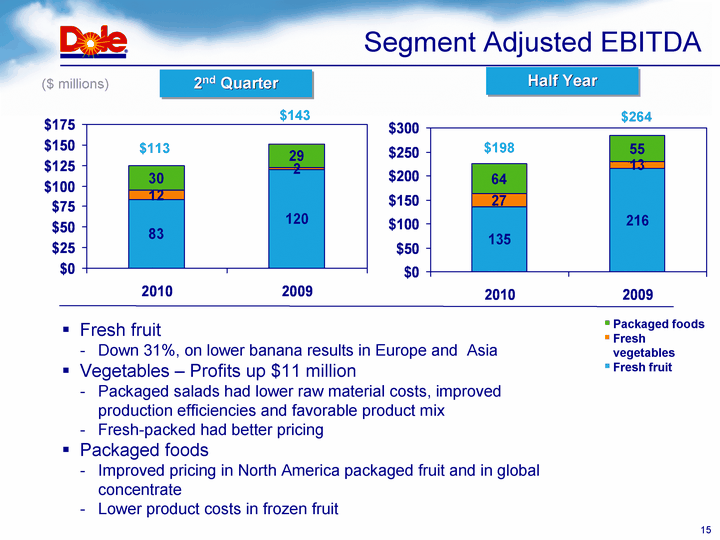
| 15 Segment Adjusted EBITDA Packaged foods Fresh vegetables Fresh fruit ($ millions) 2010 2009 Fresh Fruit 135 216 Fresh Vegetables 27 13 Packaged Foods 64 55 $198 $264 Half Year 2nd Quarter 2010 2009 Fresh Fruit 83 120 Fresh Vegetables 12 2 Packaged Foods 30 29 $113 $143 Fresh fruit Down 31%, on lower banana results in Europe and Asia Vegetables - Profits up $11 million Packaged salads had lower raw material costs, improved production efficiencies and favorable product mix Fresh-packed had better pricing Packaged foods Improved pricing in North America packaged fruit and in global concentrate Lower product costs in frozen fruit |

| 16 16 Q&A |

| 17 17 Appendix |

| 18 Adjusted EBITDA ($ millions) |

| 19 Adjusted Q2 EBITDA by Segment ($ millions) |

| 20 Adjusted Half-Year EBITDA by Segment ($ millions) |

| 21 Q2 and Half-Year Income Statements |

| 22 Non-GAAP Financial Measures |
