Attached files
| file | filename |
|---|---|
| 8-K - FORM 8-K - INTERNATIONAL PAPER CO /NEW/ | d8k.htm |
| EX-99.1 - PRESS RELEASE OF INTERNATIONAL PAPER COMPANY - INTERNATIONAL PAPER CO /NEW/ | dex991.htm |
 Second Quarter
2010 Review
July 28, 2010
Second Quarter
2010 Review
July 28, 2010
John V. Faraci
Chairman &
Chief Executive Officer
Tim S. Nicholls
Senior Vice President &
Chief Financial Officer
Exhibit 99.2 |
 2
Forward-Looking Statements
Forward-Looking Statements
These slides and statements made during this presentation contain
forward-looking statements. These statements reflect management's
current views and are subject to risks and uncertainties that could cause
actual results to differ materially from those expressed or
implied
in
these
statements.
Factors
which
could
cause
actual
results
to
differ
relate
to:
(i) increases in interest rates; (ii) industry conditions, including but not
limited to changes in the cost or availability of raw materials, energy and
transportation costs, competition we face, cyclicality and changes in
consumer preferences, demand and pricing for our products; (iii) global
economic conditions and political changes, including but not limited to the
impairment of financial institutions, changes in currency exchange rates, credit ratings
issued by recognized credit rating organizations, the amount of our future pension
funding obligation and changes in pension and health care costs; (iv)
unanticipated expenditures related to the cost of compliance with
environmental and other governmental regulations and to actual or potential
litigation; and (v) whether we experience a material disruption at one of
our manufacturing facilities and risks inherent in conducting business through a joint
venture. We undertake no obligation to publicly update any forward-looking
statements, whether as a result of new information, future events or
otherwise. These and other factors that could cause or contribute to actual
results differing materially from such forward looking statements are
discussed in greater detail in the company's Securities and Exchange
Commission filings. |
 3
Statements Relating to Non-GAAP
Financial Measures
Statements Relating to Non-GAAP
Financial Measures
During the course of this presentation, certain
non-U.S. GAAP financial information will be
presented.
A reconciliation of those numbers to U.S.
GAAP financial measures is available on the
company’s website at internationalpaper.com
under Investors. |
 4
Second Quarter 2010
Headlines
Second Quarter 2010
Headlines
Revenue Growth
Margin Expansion
Strong Free Cash Flow Generation
All businesses posted strong results |
 5
Second Quarter 2010
Significant Earnings Improvement
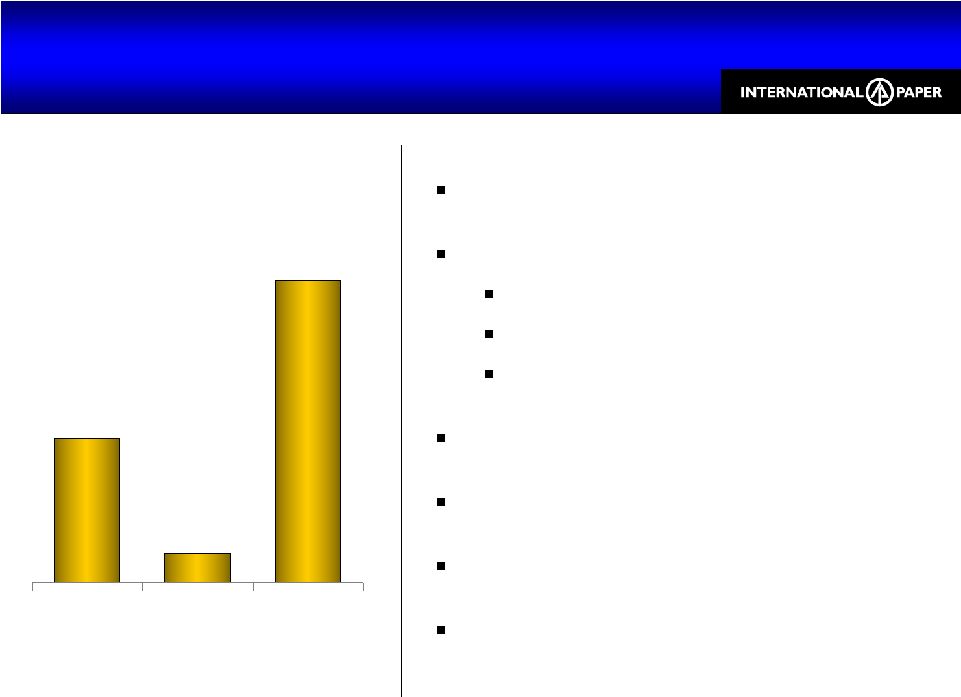
Second Quarter 2010
Significant Earnings Improvement
Balanced Global Results
Record Earnings
European Paper
European Packaging
Asia
Strong Operations
Continued Cost Reduction
Declining (but Elevated) Fiber Costs
Highest Maintenance Outages of Year
Earnings from continuing operations before
special items
Earnings per Share
$0.20
$0.04
$0.42
2Q09
1Q10
2Q10 |
 6
2Q10 Financial Snapshot
2Q10 Financial Snapshot
2Q09
1Q10
2Q10
Sales ($B)
$5.8
$5.8
$6.1
EBITDA
1
($MM)
$723
$560
$782
Free Cash Flow
2
($MM)
$576
$39
$356
Debt ($B)
$10.9
$9.0
$8.9
Cash Balance ($B)
$1.7
$1.7
$1.9
1
Earnings from continuing operations before special items
2
Cash provided by continuing operations less capital expenditures, excluding cash
received from alternative fuel credits of $688 MM in 2Q09 and $132 MM in
2Q10 |
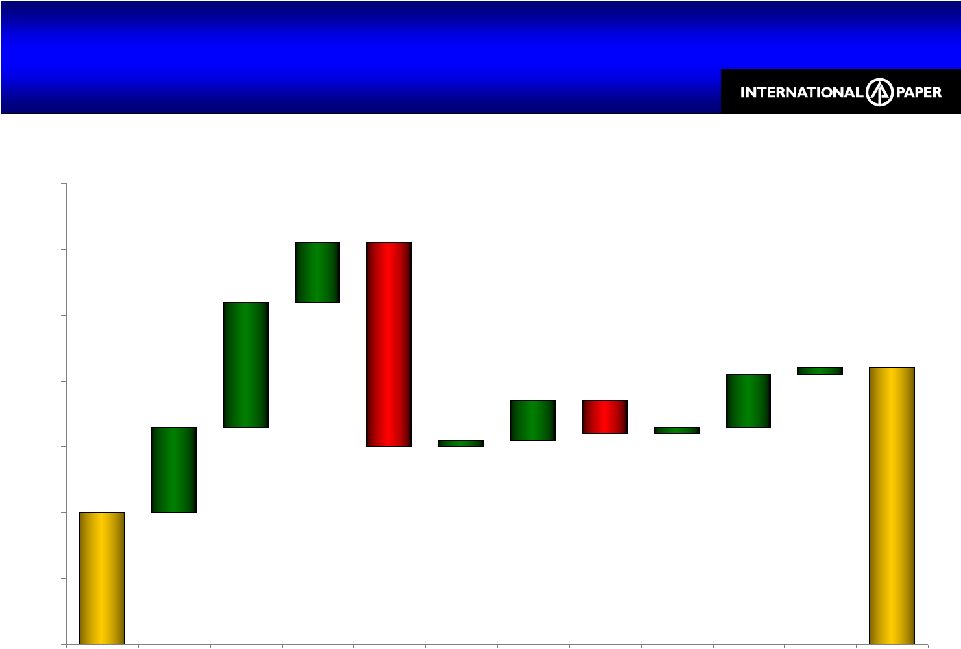
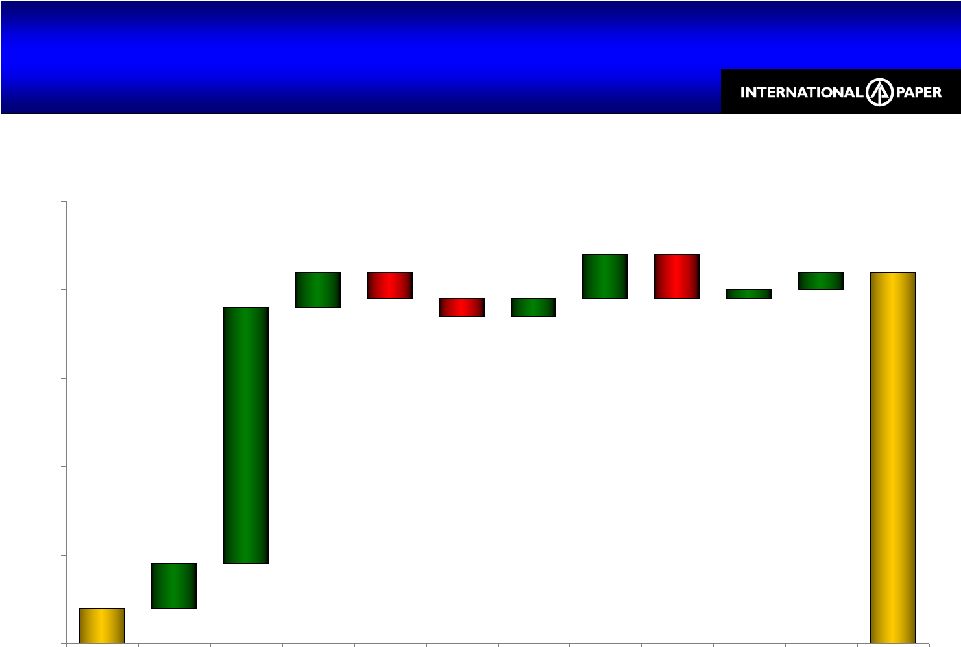 7
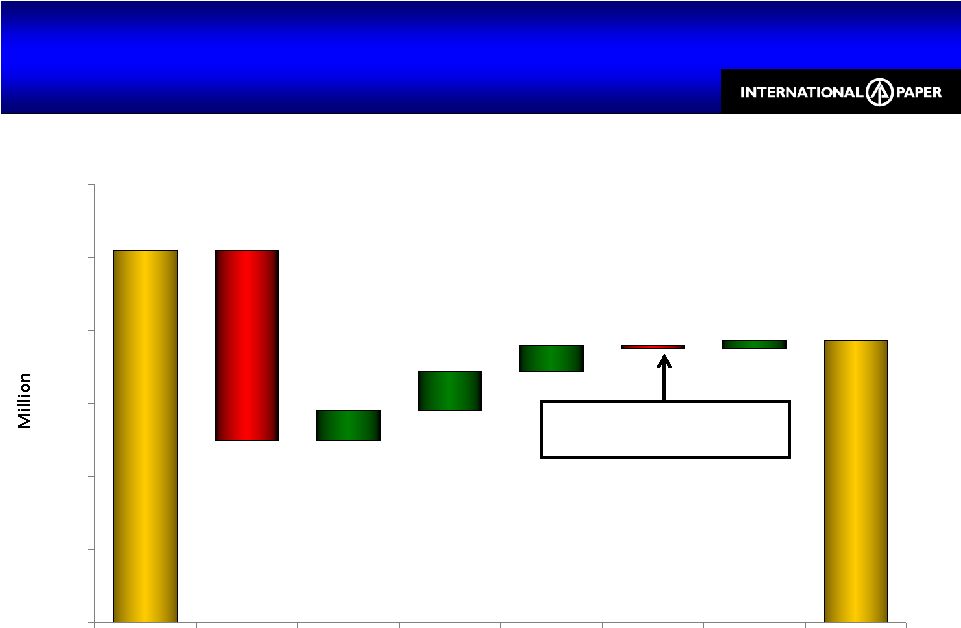
Earnings before special items
2Q10 vs. 1Q10 EPS
Price Realization, Improved Volumes
2Q10 vs. 1Q10 EPS
Price Realization, Improved Volumes
.04
.42
(.03)
(.02)
(.05)
.05
.29
.04
.02
.05
.01
.02
$0.00
$0.10
$0.20
$0.30
$0.40
$0.50
1Q10
Volume
Price
Operations
& Costs
Maintenance
Outages
Input
Costs
Mix
Forest
Products
Bad Debt
Tax
Ilim
JV
2Q10 |
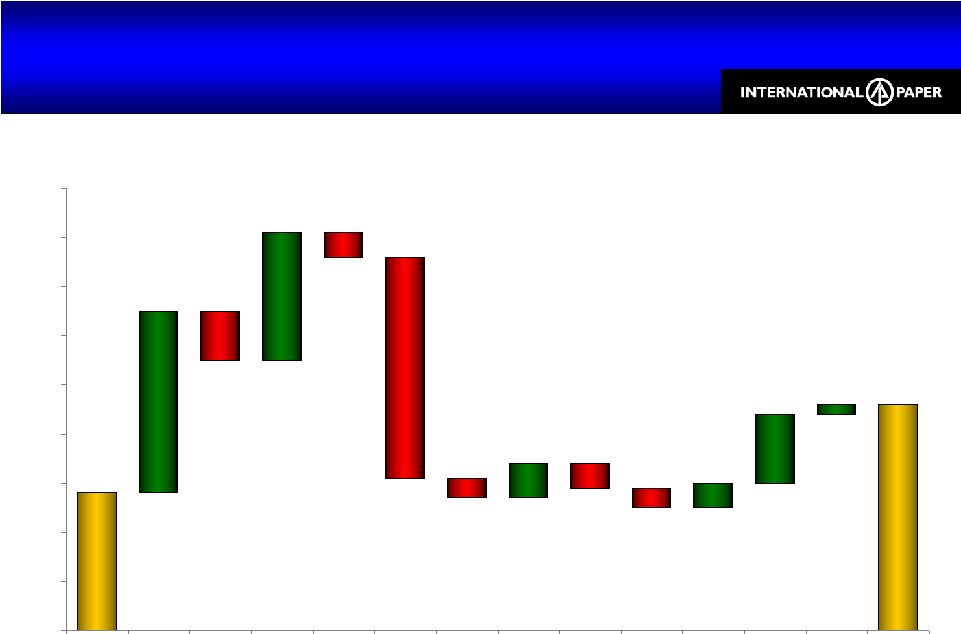 8
Earnings from continuing operations before special items
1H10 vs. 1H09 EPS
Improved Volumes & Operations, Higher Fiber Costs
1H10 vs. 1H09 EPS
Improved Volumes & Operations, Higher Fiber Costs
.28
.46
(.10)
(.05)
(.45)
(.04)
(.05)
(.04)
.37
.26
.07
.05
.14
.02
$0.00
$0.10
$0.20
$0.30
$0.40
$0.50
$0.60
$0.70
$0.80
$0.90
1H09
Volume
/ LOO
Price
Operations
& Costs
Maintenance
Outages
Input
Costs
Mix
Forest
Products
Bad Debt
Corporate
& Other
Interest
Ilim
JV
Tax
1H10 |
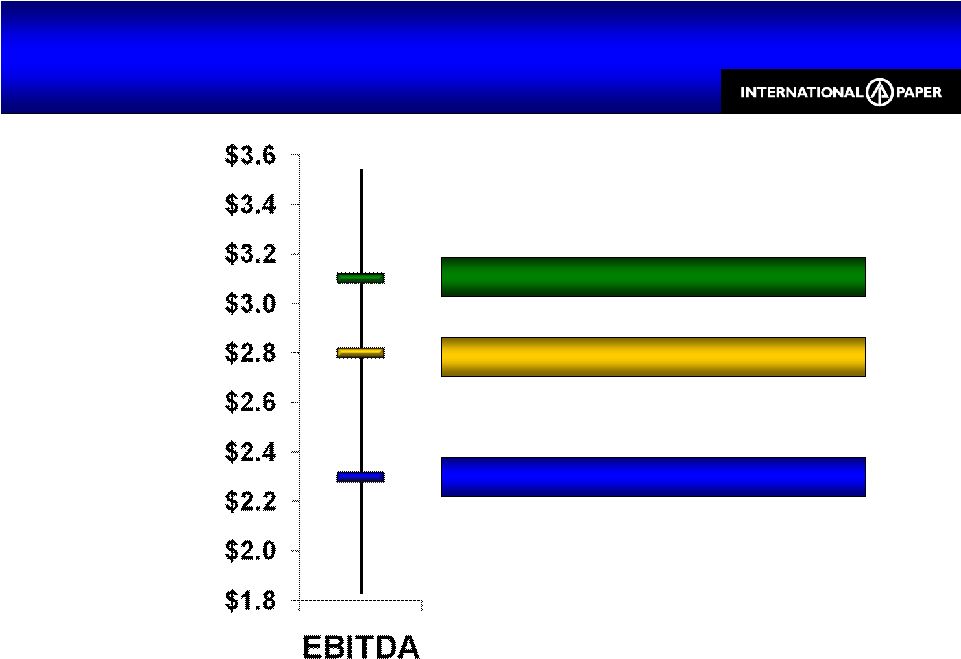 9
Total IP EBITDA & Margin
Improving EBITDA Annualized Run Rate
Total IP EBITDA & Margin
Improving EBITDA Annualized Run Rate
$ Billion
1Q10 Run Rate (9.5% EBITDA)
2Q10 Run Rate
(13% EBITDA)
2009 Actual
(12% EBITDA) |
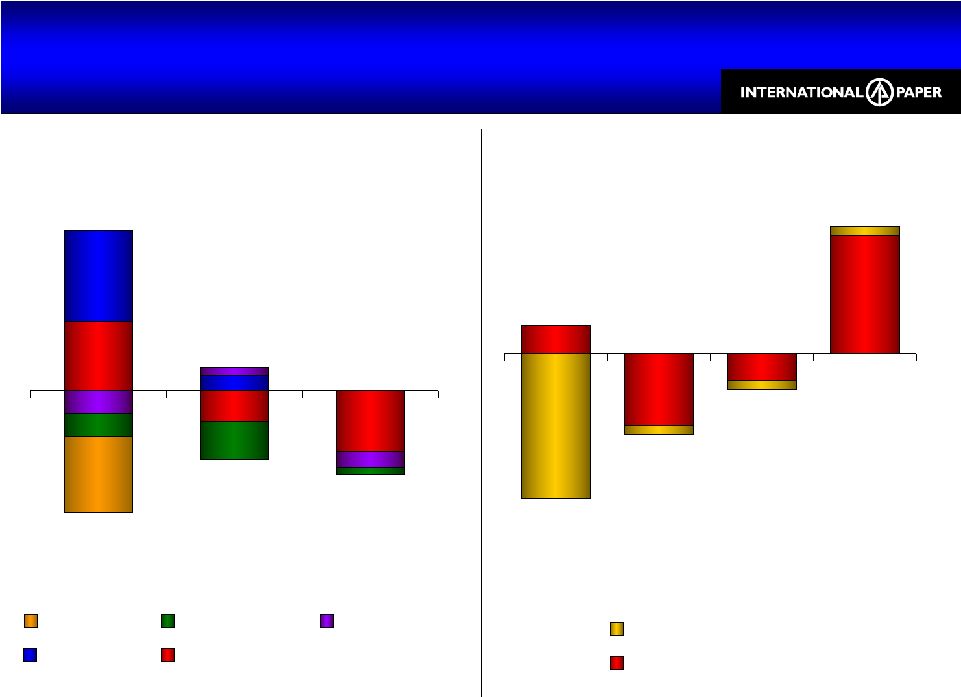 10
Global Input Costs vs. 1Q10
$12 MM, or $0.02/Share Unfavorable
Global Input Costs vs. 1Q10
$12 MM, or $0.02/Share Unfavorable
By Business
By Input Type
$5
($6)
($11)
Industrial
Packaging
Printing
Papers
Consumer
Packaging
Wood
Energy
Chemicals
Freight
($13)
($9)
($4)
$14
Fiber
Freight
Chemicals
Energy
Outside North America
North America
OCC |
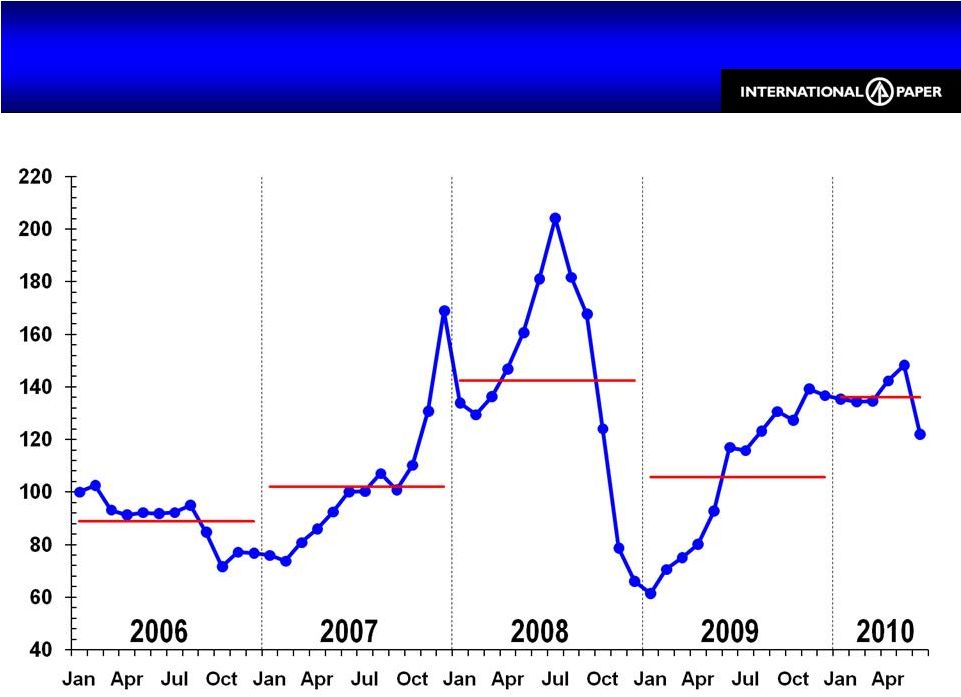
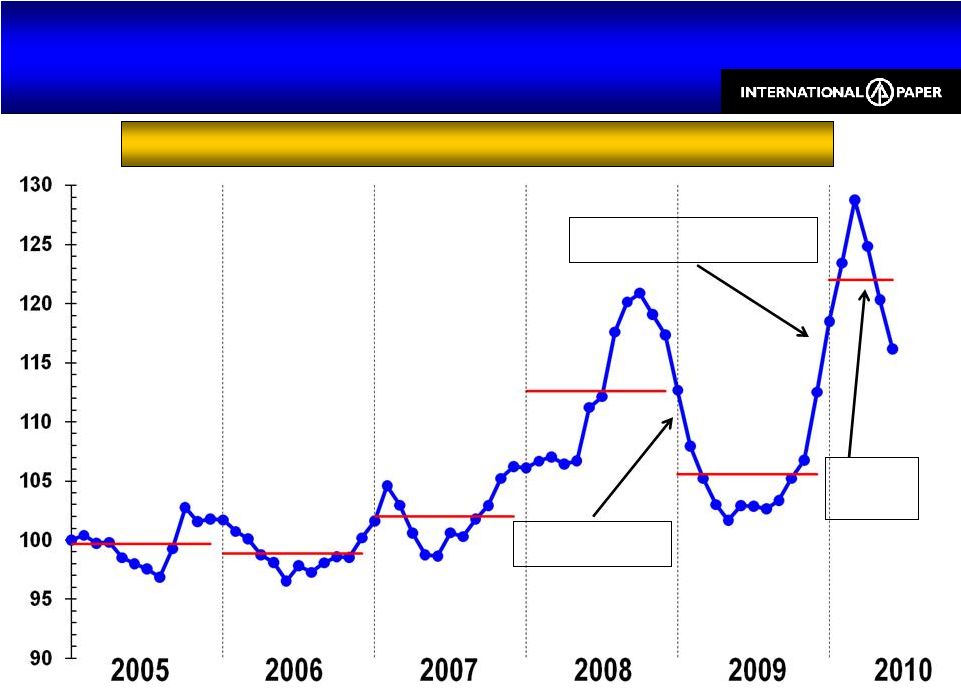 11
Index
U.S. Mill Wood Delivered Cost Trends
3% Decrease vs. 1Q10 Average Cost
U.S. Mill Wood Delivered Cost Trends
3% Decrease vs. 1Q10 Average Cost
Wood Costs Declining, But Still Elevated
Declining Wood
Demand
Poor Harvesting Conditions
& Higher Wood Demand
Normal
Harvesting
Conditions |
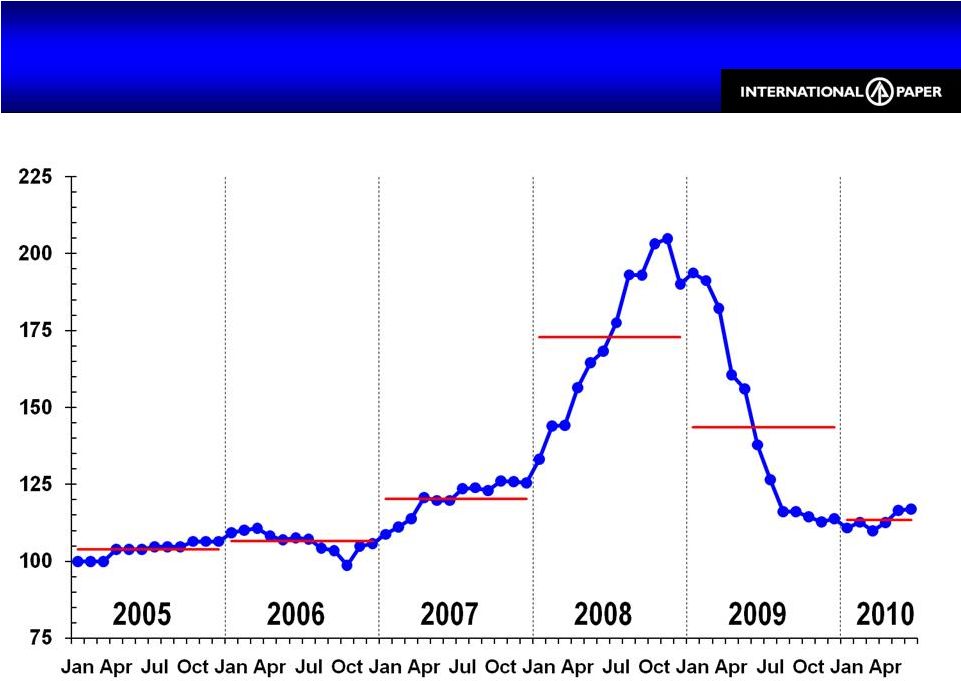
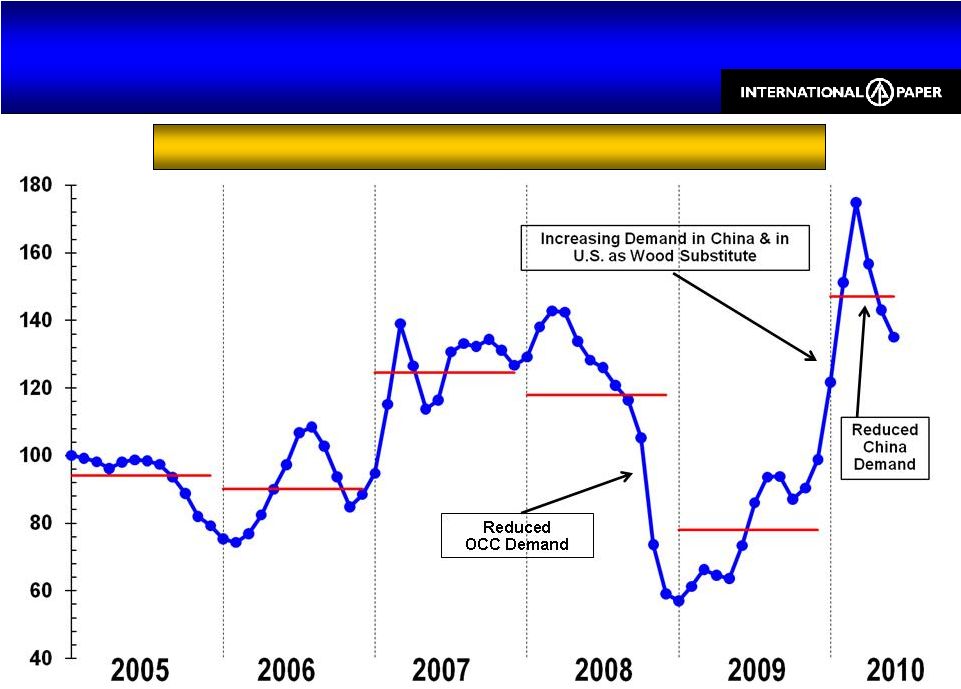 12
U.S. OCC Delivered Cost Trends
3% Decrease vs. 1Q10 Average Cost
U.S. OCC Delivered Cost Trends
3% Decrease vs. 1Q10 Average Cost
Index
2005-2007 represents WY PKG delivered costs; 2008-2010 represents delivered
costs to the integrated system OCC Costs Declining, But Still Elevated
|
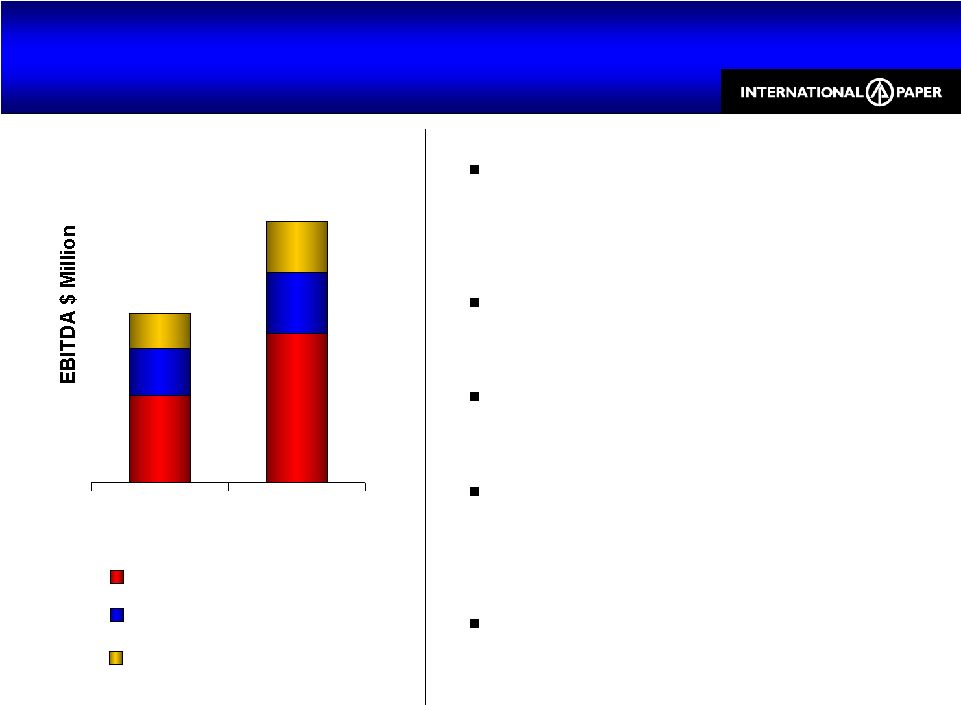 13
IP Europe, Middle East & Africa
1H10: 11% of IP Sales & 18% of IP EBITDA
IP Europe, Middle East & Africa
1H10: 11% of IP Sales & 18% of IP EBITDA
EBITDA margins increased
from 12% to 19%
Record Paper Earnings
Record Container Earnings
Cost-of-Capital Returns in
Paper & Packaging
Inverurie
& Etienne mill
shutdowns completed
$158
$245
1H09
1H10
Coated Paperboard
Container
Papers |
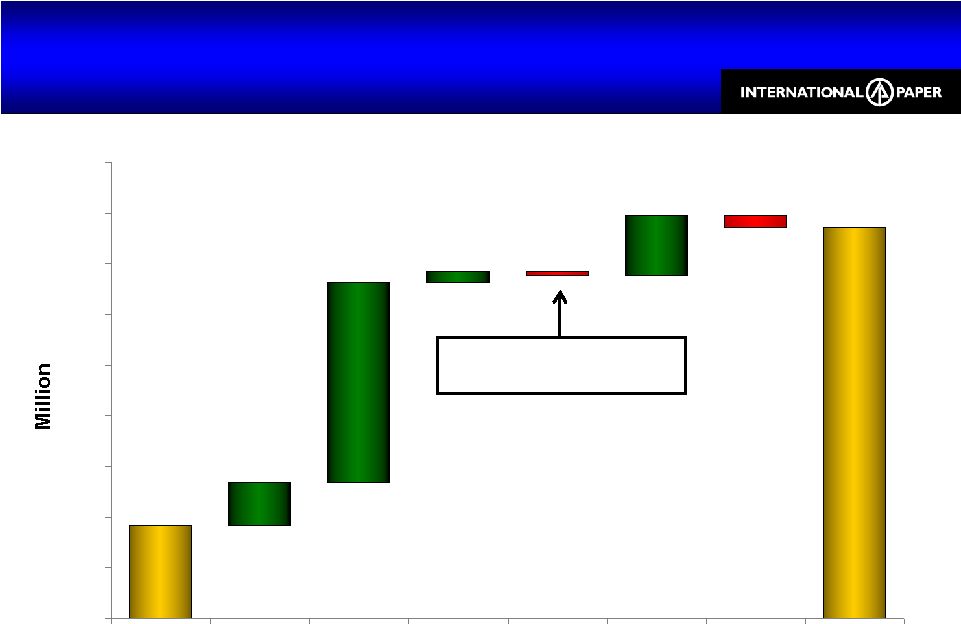 14
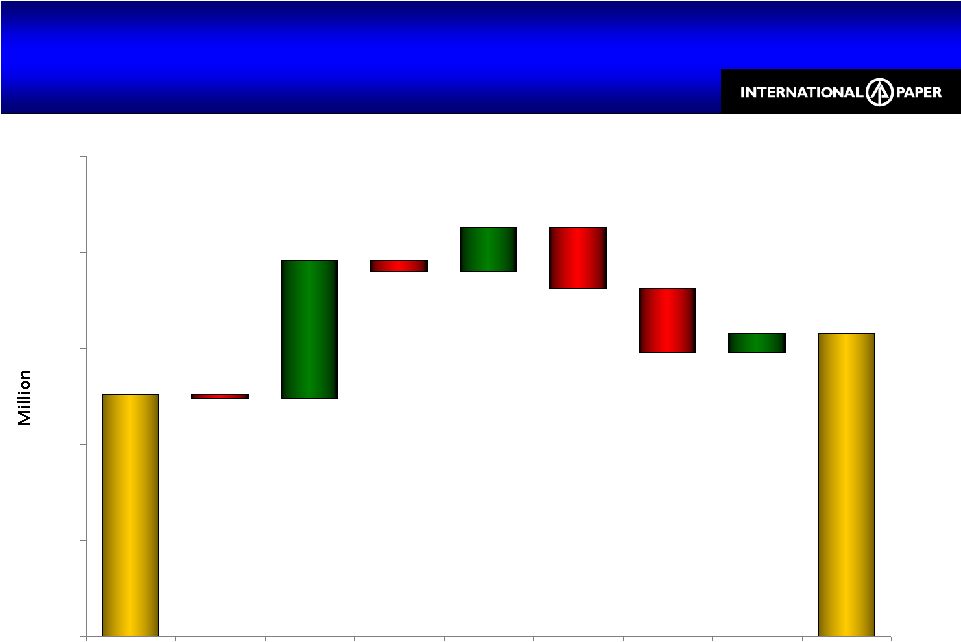
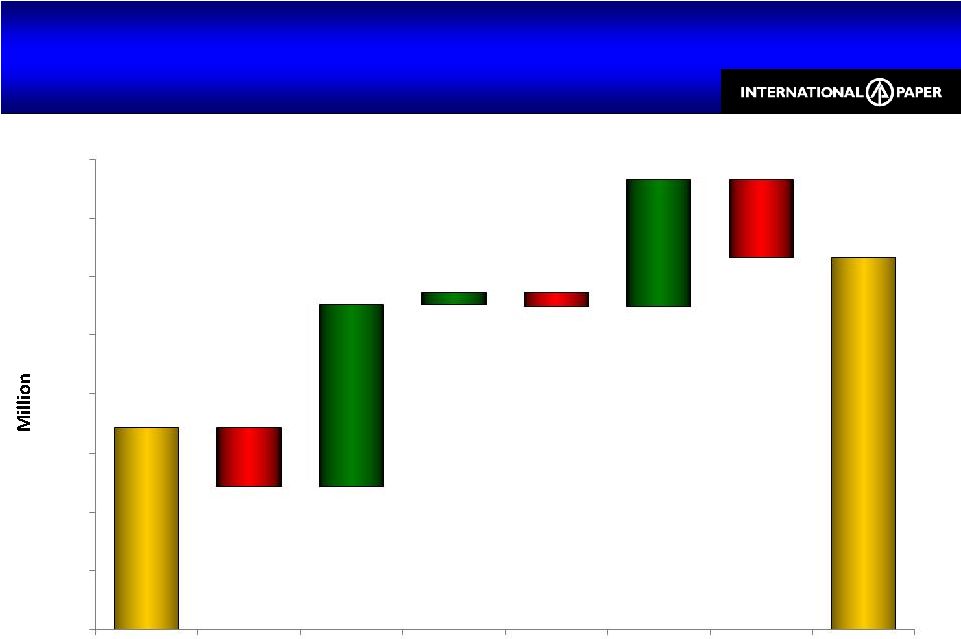
46
193
(2)
(6)
21
99
5
30
$0
$25
$50
$75
$100
$125
$150
$175
$200
$225
1Q10
Volume
Price
& Mix
Input
Costs
Operations
& Costs
Maintenance
Outages
Other
2Q10
Industrial Packaging Earnings
2Q10 vs. 1Q10
Industrial Packaging Earnings
2Q10 vs. 1Q10
Earnings before special items
Operations
LIFO, Other Costs (33)
31 |
 15
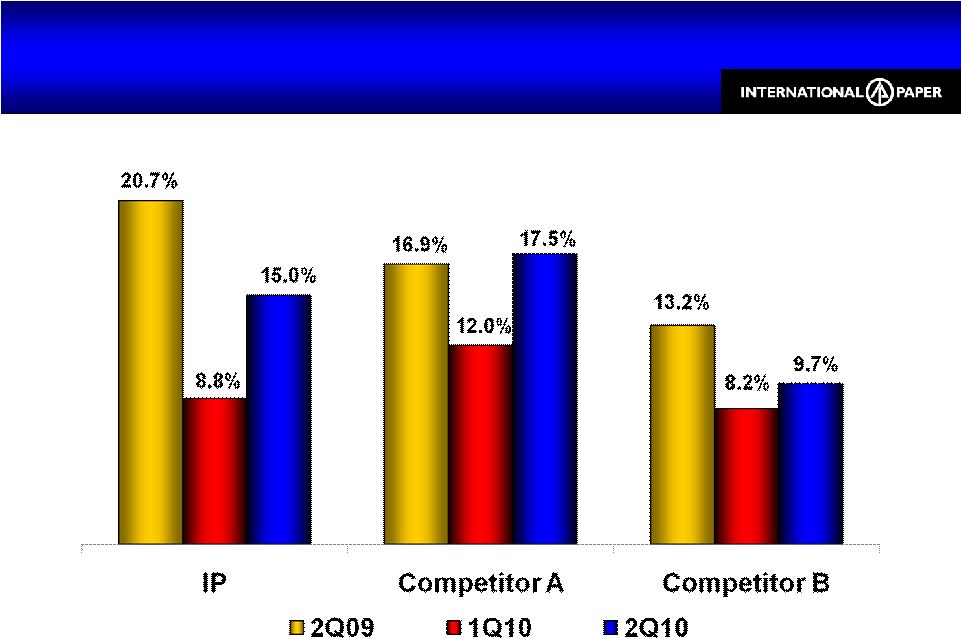
N.A. Industrial Packaging Relative EBITDA Margins
N.A. Industrial Packaging Relative EBITDA Margins
IP EBITDA margins based on North American Industrial Packaging operating profit
before special items Competitor EBITDA margin estimates obtained from public
filings and IP analysis |
 16
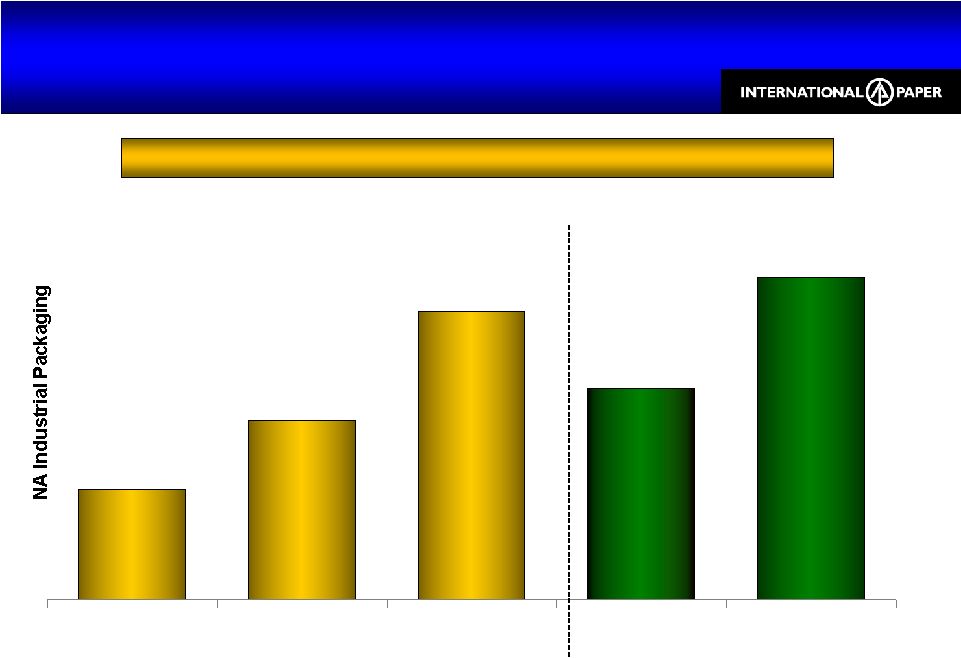
$0.5
$0.8
$1.3
$1.0
$1.5
2007
2008
2009
1H10
Run Rate
June 2010
Run Rate
Progress on Industrial Packaging Integration
Approaching Cost-of-Capital Returns
Progress on Industrial Packaging Integration
Approaching Cost-of-Capital Returns
June Run Rate of $1.5 Billion EBITDA and 8% ROI
Earnings before special items |
 17
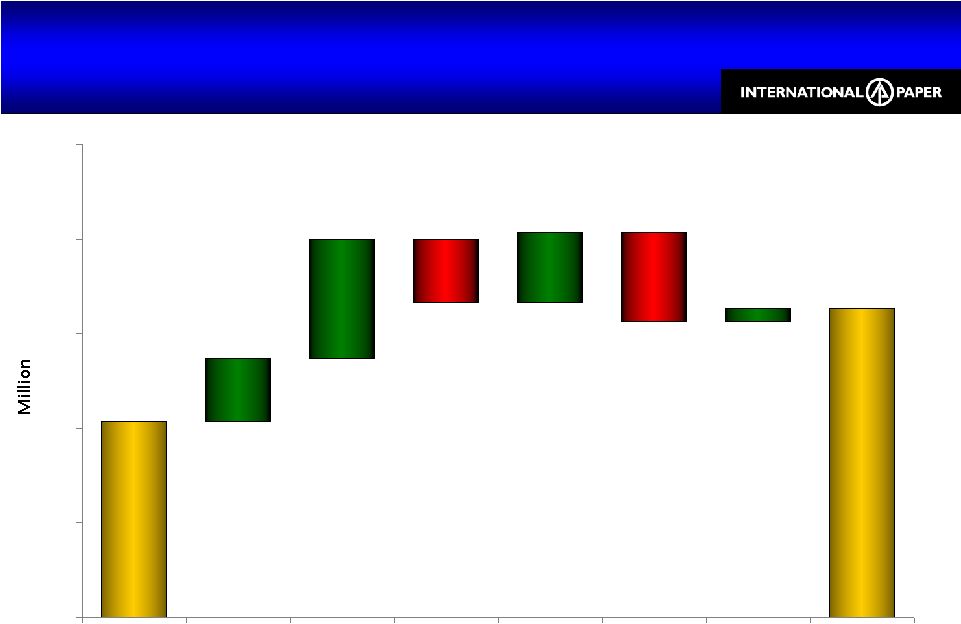
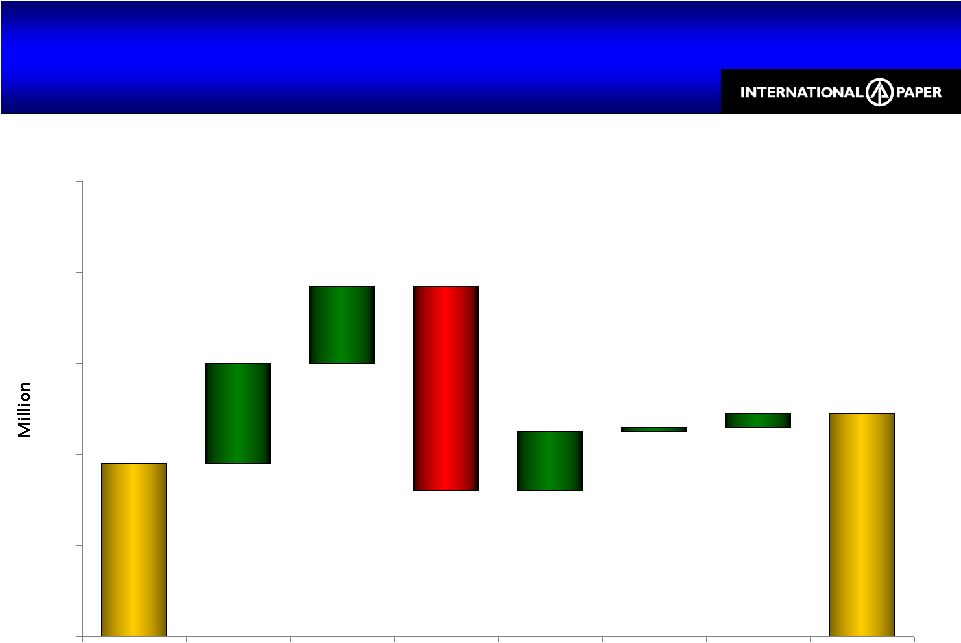
Printing Papers Earnings
2Q10 vs.
1Q10
Printing Papers Earnings
2Q10 vs.
1Q10
Earnings before special items
126
158
(2)
(6)
(32)
(33)
72
23
10
$0
$50
$100
$150
$200
$250
1Q10
Volume
Price
& Mix
Input
Costs
Operations
& Costs
Maintenance
Outages
Bad Debt
Other
2Q10 |
 18
Consumer Packaging Earnings
2Q10 vs.
1Q10
Consumer Packaging Earnings
2Q10 vs.
1Q10
Earnings before special items
31
49
(10)
(14)
10
19
11
2
$0
$15
$30
$45
$60
$75
1Q10
Volume
Price
& Mix
Input
Costs
Operations
& Costs
Maintenance
Outages
Other
2Q10 |
 19
Progress on Fixed Cost Reductions
All Fixed Cost Reductions Achieved by 2Q
Progress on Fixed Cost Reductions
All Fixed Cost Reductions Achieved by 2Q
$ Million
Mill
2
nd
-Quarter Annualized
Run-Rate Fixed Cost
Savings
Industrial Packaging
Albany,
Pineville
$60
Printing & Communications Papers
Franklin
$90
Coated Paperboard
Franklin
$20
In
addition,
the
closure
of
the
Inverurie
&
Etienne
mills
have
been
completed,
and
the
associated
operating
losses
have
been
eliminated. |
 20
$ Million
2Q09
1Q10
2Q10
Sales
$1,595
$1,580
$1,630
Earnings
$10
$21
$26
xpedx
Improvement from 1Q10
xpedx
Improvement from 1Q10
Revenues up 3%
from 1Q10
Strong year-over-year earnings growth driven
by aggressive operating cost management
* Facility supplies daily sales change reflects the loss of a large national
account; daily sales rate up 9.1% excluding this impact Daily Sales
Change vs. 1Q10
Printing
1.6%
Packaging
2.6%
Facility Supplies*
(2.1%) |
 21
Forest Products
Mineral Rights Sale; Land Sale Agreement
Forest Products
Mineral Rights Sale; Land Sale Agreement
Mineral rights sale to Natural Resource Partners in June
$43 MM revenue
$39 MM operating profit
Agreement to sell 163,000 acres to Rock Creek Capital
$200 MM sales price plus ongoing profits interest
Expect $50 MM in 3Q operating profit
Expected to close in 3Q10
Completion of land sales program |
 22
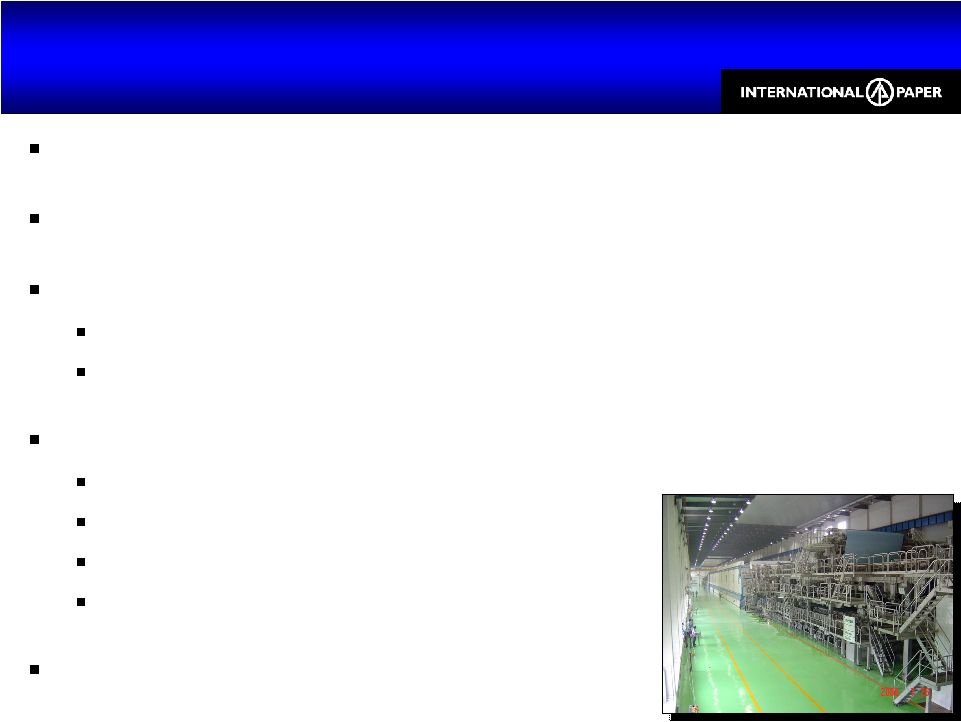
Sun Joint Venture
Record EBIT in 2Q10
Sun Joint Venture
Record EBIT in 2Q10
2009: 4 MM tons of coated paperboard demand in China
Projected 2010 –
2013 Demand CAGR: 8% -
9%
3 existing board machines
915,000 tons of capacity
Sold out since March 2009
New 4
th
board machine approved by Sun & IP boards
550,000-ton annual capacity
~$300 MM investment ($55 MM of IP cash)
Yanzhou, China
Start up in 1Q12
5
th
board machine in planning stage |
 23
$ Million
2Q09
1Q10
2Q10
Sales (100%)
$290
$395
$435
Earnings (IP Share)
($30)
($3)
$5
Ilim’s
results are reported on a one-quarter lag
IP’s shares of Ilim’s
2Q09 & 1Q10 earnings includes an after-tax foreign exchange loss of $22 MM
and $2 MM, respectively. The foreign exchange impact in 2Q10 was
minimal. Ilim
Joint Venture
Ilim
Joint Venture
2Q10 vs. 1Q10
2Q10 vs. 2Q09
Business
Volume
Price /
Ton
Volume
Price /
Ton
Pulp
4%
$56
14%
$202
Containerboard
1%
$22
15%
$54 |
  24
Ilim Joint Venture Update
Ilim Joint Venture Update
Stabilized Russian Economy
Improved Results after Russian Crisis
Siberian pulp business continues to improve
Koryazhma mill improving with domestic market
Ilim JV Paid Cash Dividends of $330 Million
IP received $152 million, or ~ 25% of capital invested
Resuming Capital Projects to Strengthen Ilim
Focus on value-added paper products for Ilim West
Leverage competitive advantage of Siberian pulp mills
|
  25
Ilim Joint Venture
Resuming Capital Investment Plan
Ilim Joint Venture
Resuming Capital Investment Plan
1.
Expand Siberian pulp business
790,000-ton NBSK pulp line at Bratsk
550,00-ton net increase in capacity
$700 MM in capital
Recovery boiler start-up in 3Q11
Pulp line start-up in 2Q12
2.
Integrate Koryazhma pulp into domestic market
Install paper machine at Koryazhma
165,000 tons of UFS; 55,000 tons of coating base
$270 MM in capital
Shift from export pulp to uncoated freesheet
Evaluating 75,000-ton off-line coater
Paper machine start-up in 2012 |
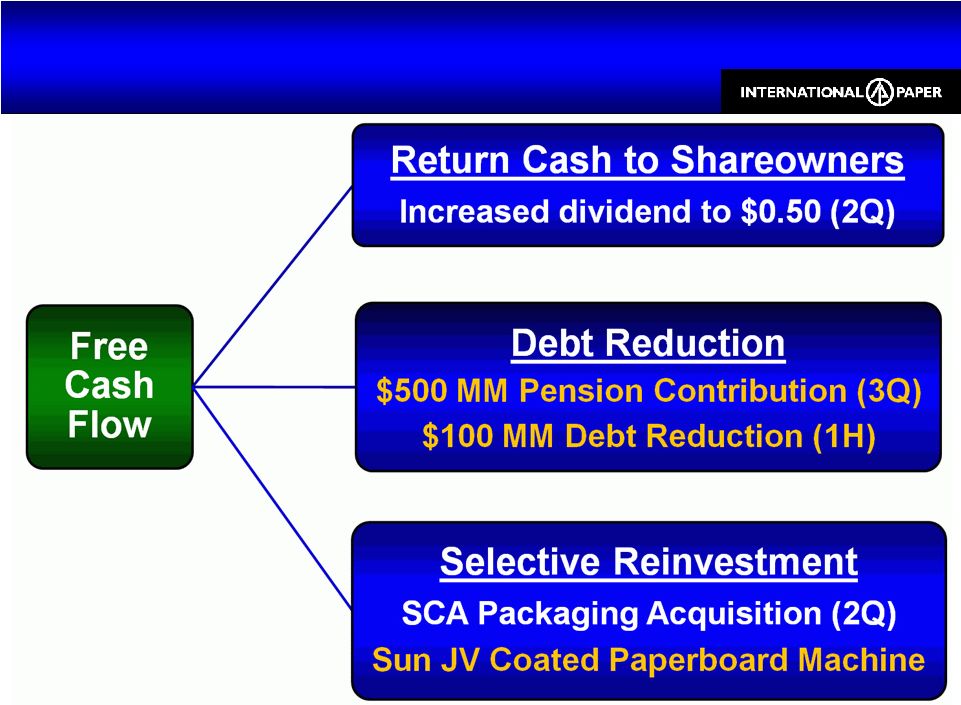 26
Balanced Capital Allocation
to Increase Shareowner Value
Balanced Capital Allocation
to Increase Shareowner Value |
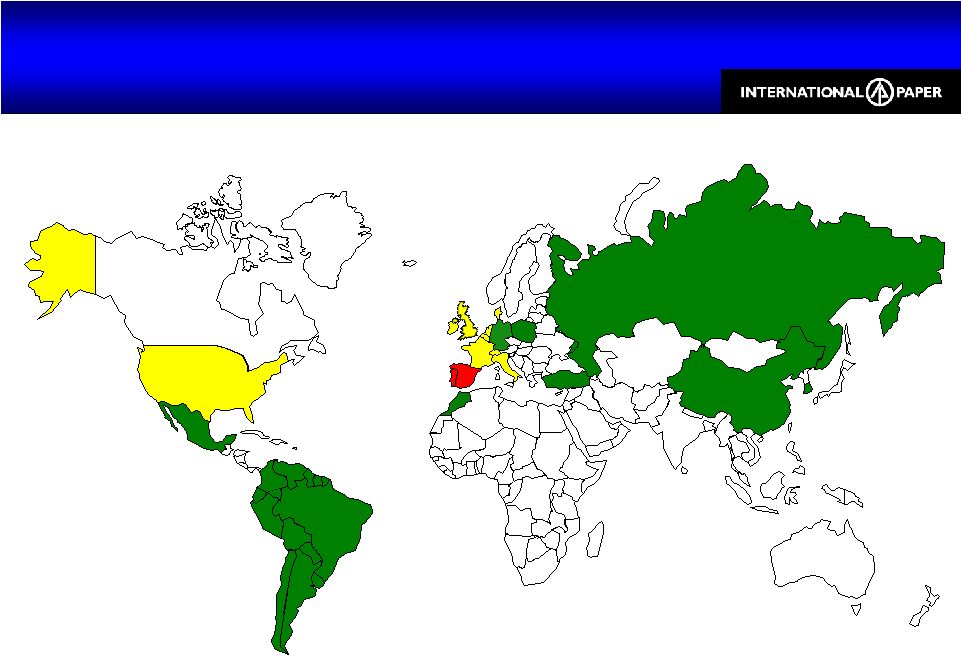 27
Current Macroeconomic Conditions
Current Macroeconomic Conditions |
 28
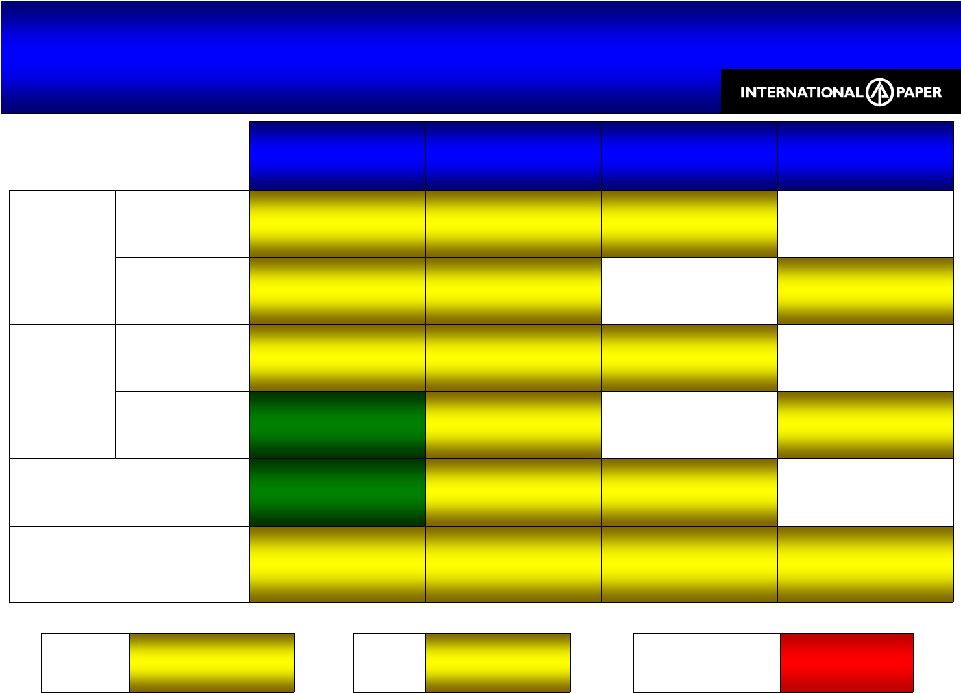
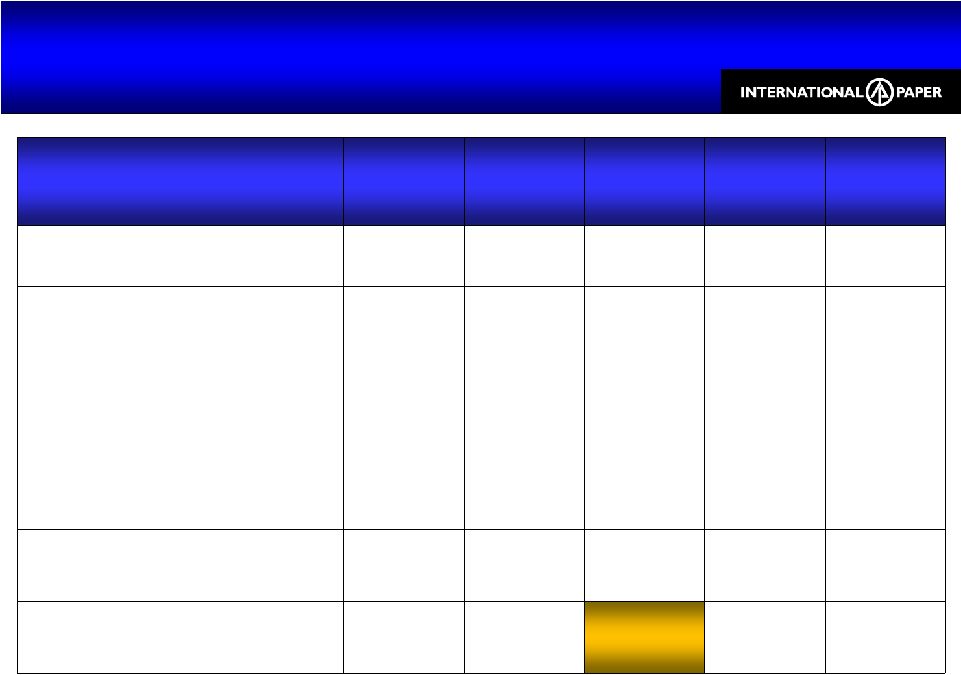
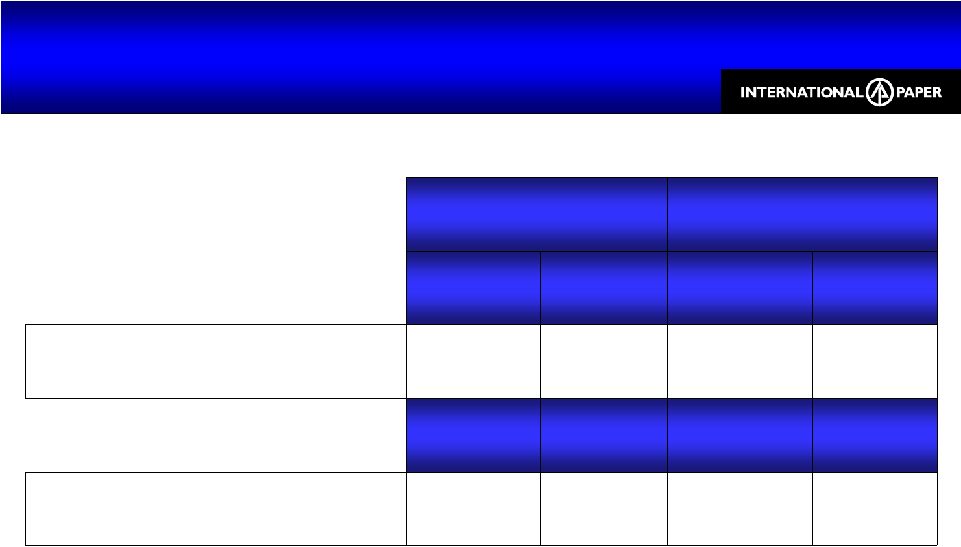
Third Quarter Outlook
Changes from 2Q10
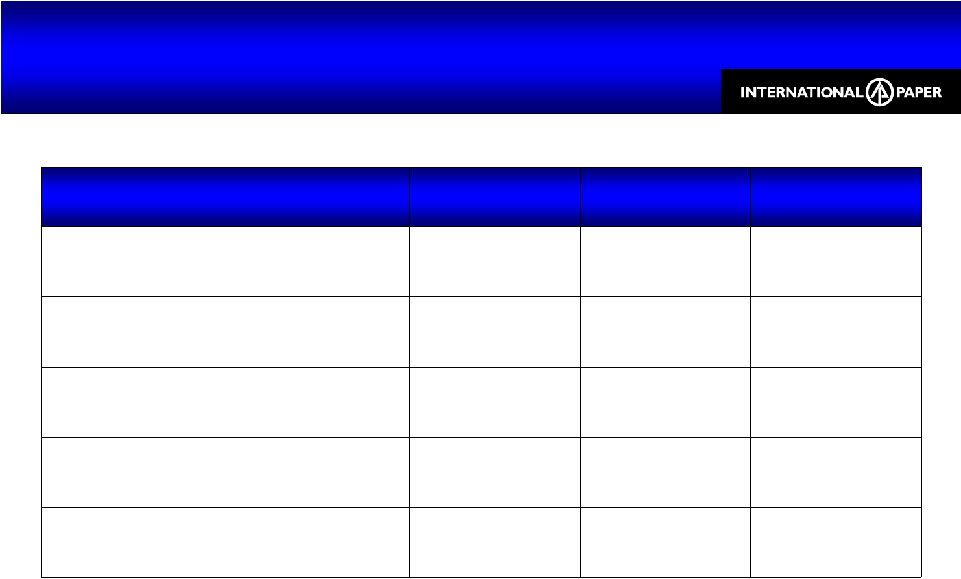
Third Quarter Outlook
Changes from 2Q10
North America
Europe
Brazil
Asia
Volume
Paper
Growth at
Slower Rate
Stable
Stable
Packaging
Growth at
Slower Rate
Seasonal
Decrease
Stable
Pricing
Paper
Continued
Realization
Stable
Increasing
Packaging
Significant
Increase
Stable
CPB Decreasing,
Box Stable
Maintenance Outages
~$77 MM
Decrease
~$4 MM
Increase
Stable
Input & Freight Costs
Moderating
Linerboard
Increasing
Stable
Pulp Decreasing,
Linerboard
Increasing
xpedx
Slight
Decrease
Ilim
Increase
Other Costs
Significant
Increase |
 29
Summary
Significant Earnings & Cash Flow
Summary
Significant Earnings & Cash Flow
2Q10 Summary
Volume recovery
Significant price increase
realization
Strong operations
Declining fiber costs
3Q10 Outlook
N.A. demand growing at
slower rate
Further realization of
announced price increases
Moderating wood costs
Uncertain OCC costs
Significant reduction in
maintenance outages |
 30
Appendix
Investor Relations Contacts
Thomas A. Cleves
901-419-7566
Emily Nix
901-419-4987
Media Contact
Patty Neuhoff
901-419-4052 |
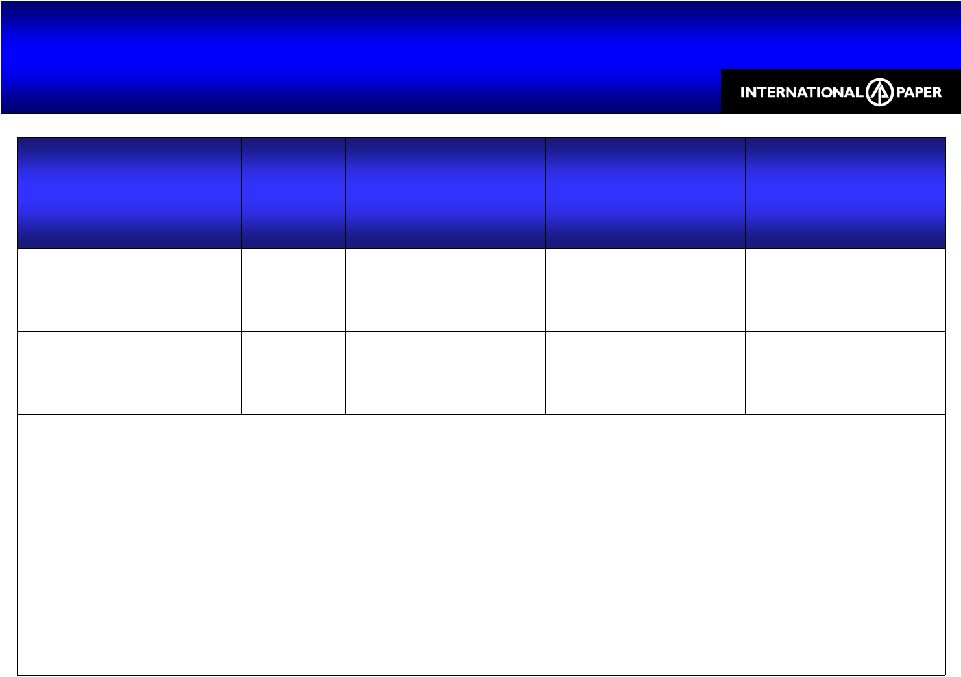
 31
$ Million
2008
2009
2010
Estimate
Capital Spending
$1,002
$534
$800
Depreciation &
Amortization
$1,347
$1,472
$1,450
Net Interest Expense
$492
$669
$600 -
$625
Corporate Items
$103
$181
$200 -
$225
Effective Tax Rate
31.5%
30%
30-32%
Before special items and excluding Ilim
Key Financial Statistics
Key Financial Statistics |
 32
Free Cash Flow
Free Cash Flow
$ Million
2Q09
1Q10
2Q10
Cash from Operations
$707
$159
$509
Cash Received from Alternative Fuel
Mixture Tax Credits (AFMTC)
$688
$0
$132
Cash Provided by Continuing
Operations
$1,395
$159
$641
Less Capital Investment
($131)
($120)
($153)
Free Cash Flow
$1,264
$39
$488
Free Cash Flow Excluding AFMTC
$576
$39
$356 |
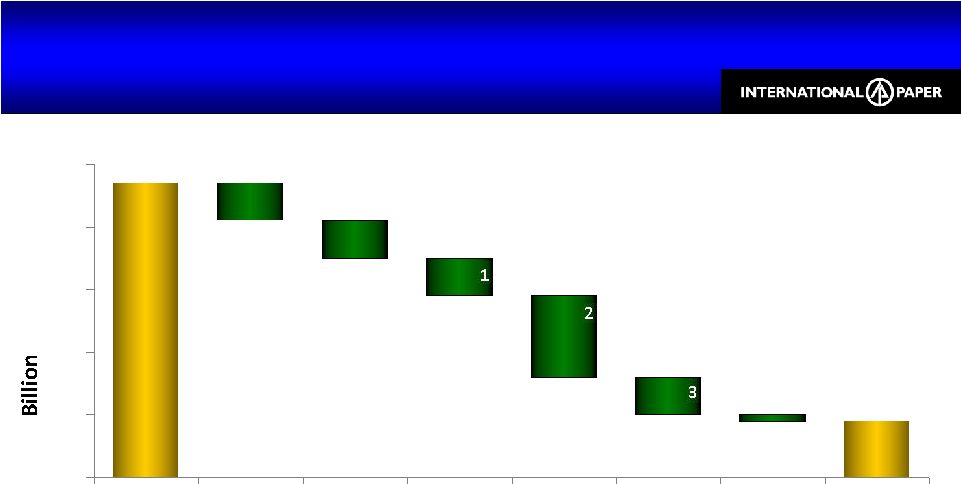 33
Debt Reduction Progress
$3.8 Billion Reduction since Acquisition
Debt Reduction Progress
$3.8 Billion Reduction since Acquisition
1
Excludes the debt repayment of $1 B from the proceeds of our May bond issuance: $1
B 9.375% notes due 2019 2
Excludes the debt repayment of $1 B from the proceeds of our August bond issuance:
$1 B 7.5% notes due 2021 3
Excludes the debt repayment of $750 MM from the proceeds of our November bond
issuance: $750 MM 7.3% notes due 2039 $12.7
$8.9
$0.6
$0.6
$0.6
$1.3
$0.6
$0.1
$8
$9
$10
$11
$12
$13
August
2008 Pro
Forma with
Acquisition
2H08
1Q09
2Q09
3Q09
4Q09
1H10
2Q Balance |
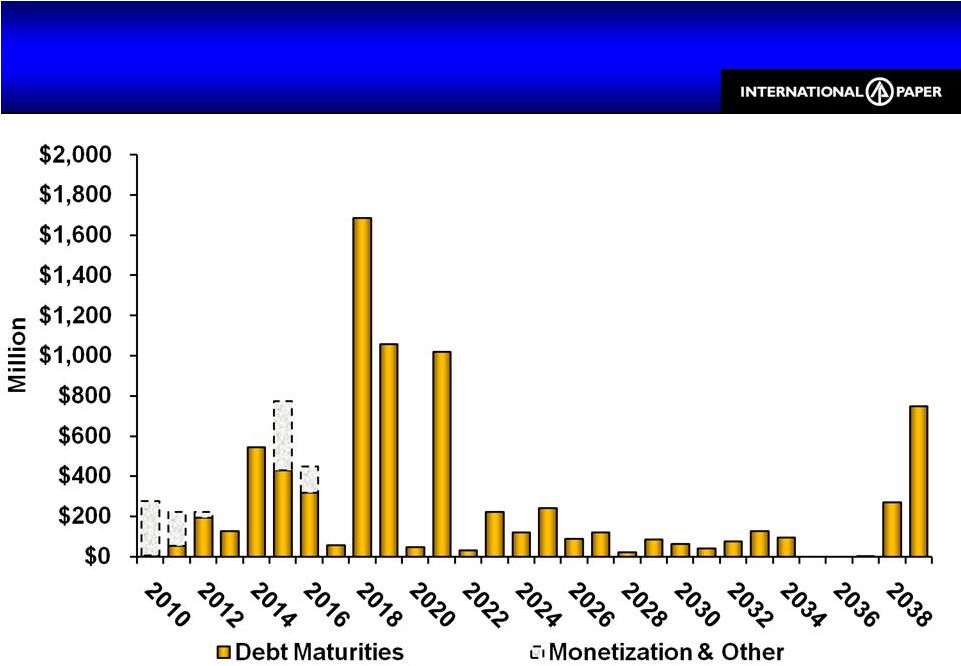 34
Monetization & Other: Intend to rollover or refinance timber monetization debt,
Sun JV debt and other foreign subsidiary debt Debt Maturity Profile
Maturities as of Quarter-End
Debt Maturity Profile
Maturities as of Quarter-End |
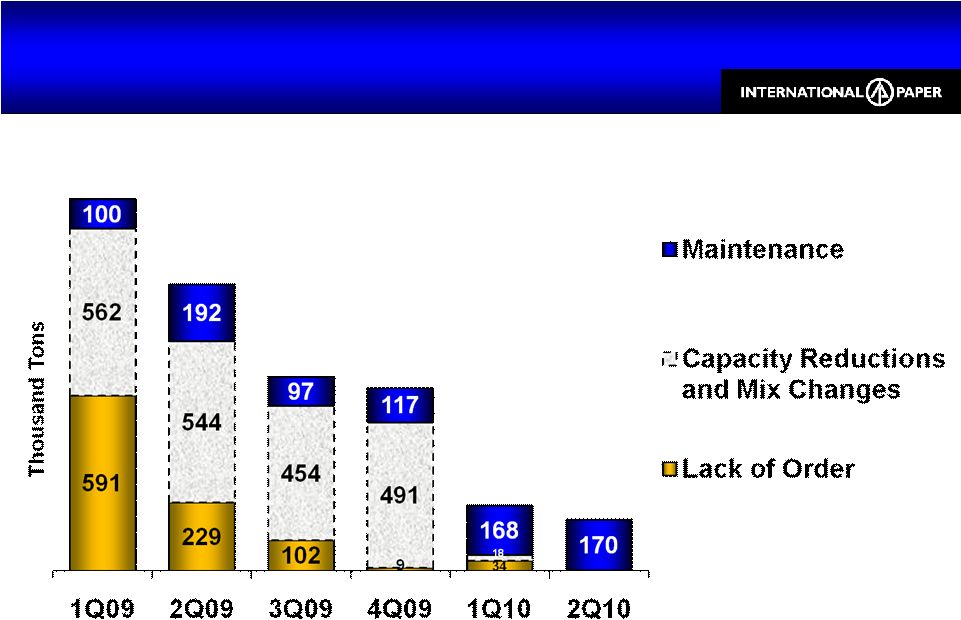 35
North American Downtime
5% of Capacity in 2Q
North American Downtime
5% of Capacity in 2Q
•
Lack-of-order & maintenance downtime for North American Containerboard,
Uncoated Papers, Market Pulp, & Coated
Paperboard. See the following slide for detail by business.
Lack of order downtime excludes capacity from mills or machines that have been
permanently shutdown 1,253
965
653
617
220
172 |
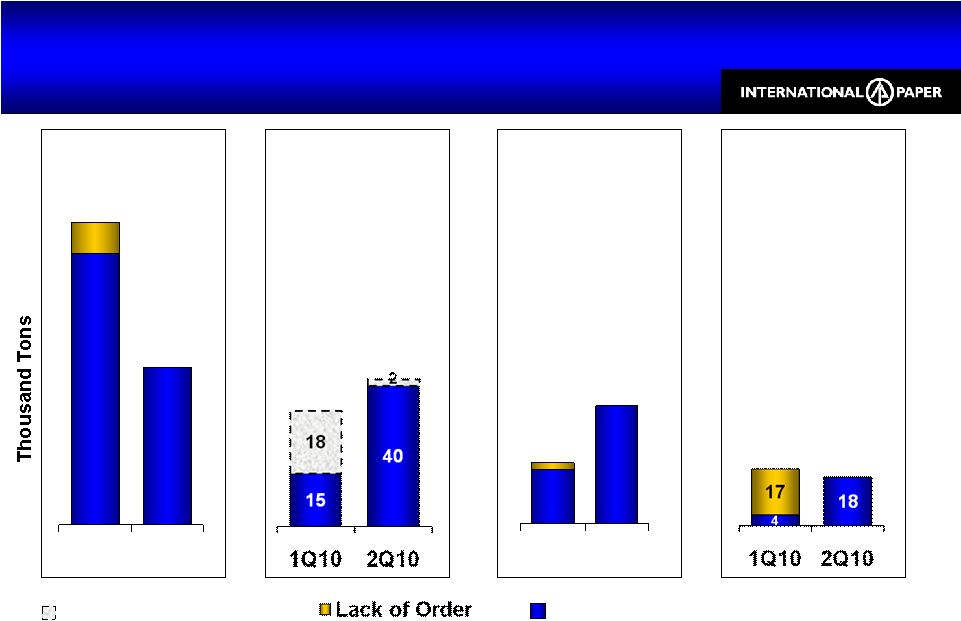 36
133
77
15
1Q10
2Q10
Capacity Reductions
and Mix Changes
North American Downtime
North American Downtime
•
Lack of order downtime excludes capacity from mills or machines that have been
permanently shutdown 16
35
2
1Q10
2Q10
Maintenance
Containerboard
Uncoated Papers
Market Pulp
Coated
Paperboard
148
42
33
21
18 |
 37
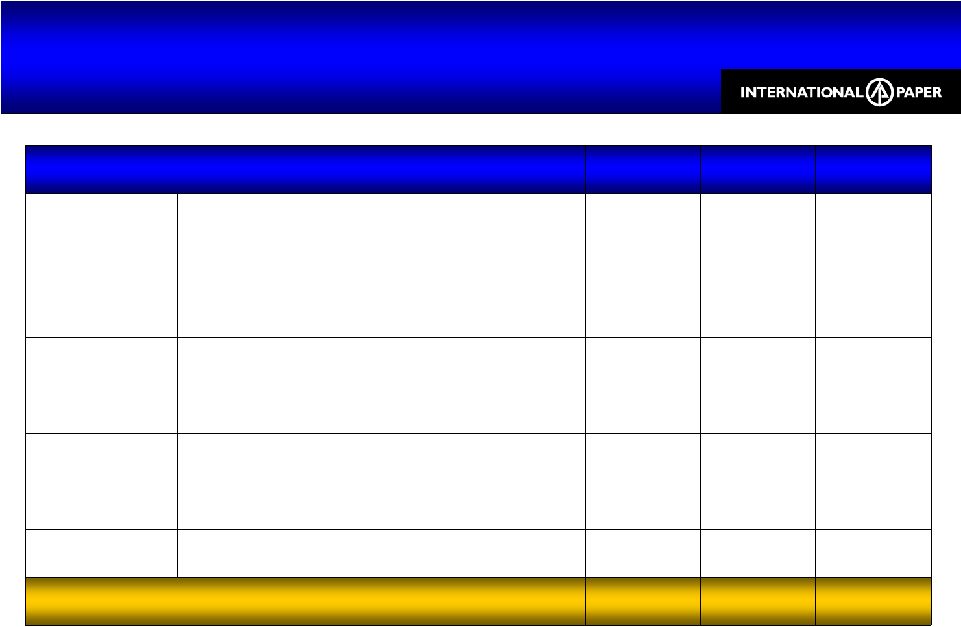
$ Million
1Q10
2Q10
3Q10E
4Q10E
2010E
Industrial Packaging
$70
$41
$4
$24
$139
North America
$27
$45
$24
$21
$117
Europe
0
10
14
16
$40
Brazil
0
5
5
0
$10
Printing Papers Total
$27
$60
$43
$37
$167
Consumer Packaging
$6
$19
$0
$17
$42
Total Impact
$103
$120
$47
$78
$348
Dollar impact of planned maintenance outages are estimates and subject to
change Maintenance Outages Expenses
Maintenance Outages Expenses |
 38
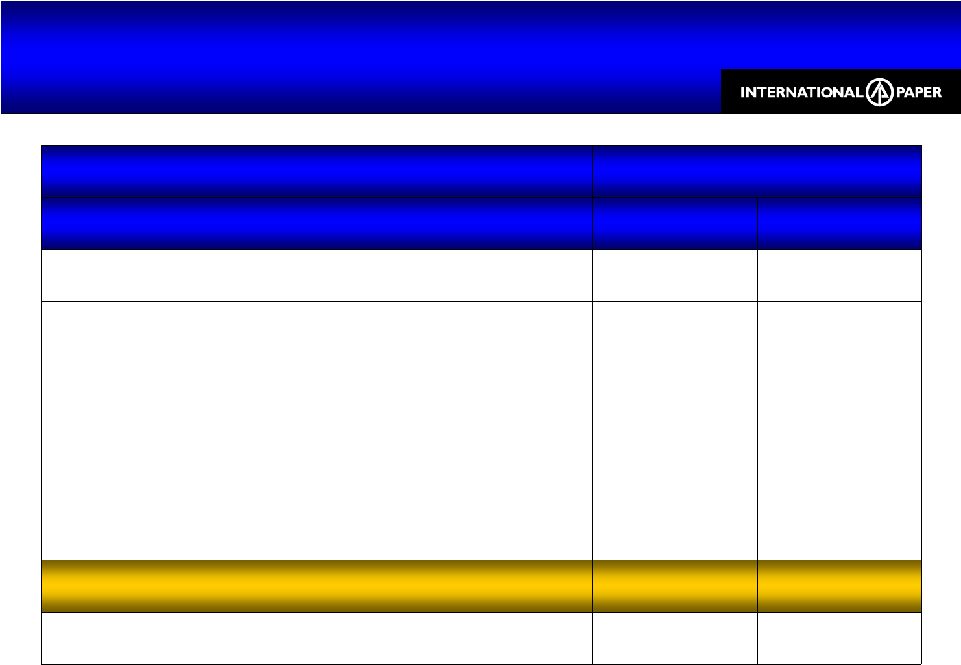
Rock Creek Capital Agreement
Rock Creek Capital Agreement
$ Millions
Acres
Cash Value
Potential Value of
Partnership
Interest
Total Value
Original 2009 Sale
Agreement
143,000
$220
$55
$275
Rock Creek Capital
Agreement
163,000
$200
$35
$235
•
10,000
acres
of
the
land
in
the
Original
2009
Sale
Agreement
was
subsequently
sold
for
$25 MM
•
30,000 acres worth $36 MM were added to the Rock Creek Capital Agreement
•
Lower total value of the Rock Creek Capital Agreement reflects the different land mix
and the change in market value driven by a later and slower recovery in real
estate •
Competitive bidding process indicated that land value had declined by ~15% over the
last 12 –
18 months
After the Rock Creek transaction, IP will have ~24,000 acres of land worth up to
$15 million |
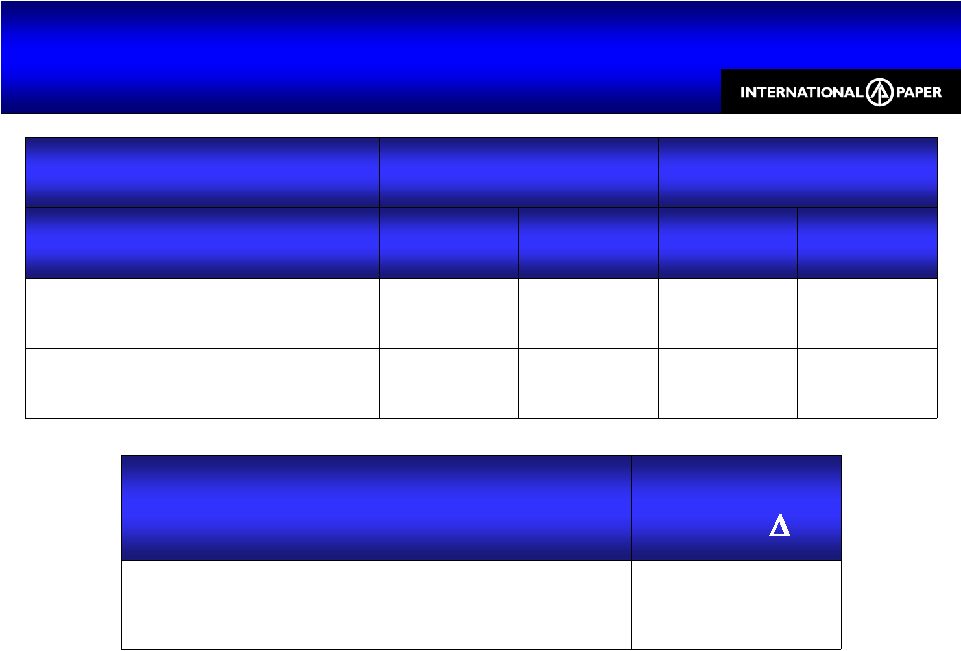 39
2Q10 vs. 1Q10
2Q10 vs. 2Q09
Business
Volume
Price /
Ton
Volume
Price /
Ton
N.A. Container
8%
$43
3%
($6)
European Container*
1%
€26
9%
(€3)
Industrial Packaging
Industrial Packaging
N.A. Price Improvement per Ton
vs. December 2009 Price
June 2010
Price
Corrugated Boxes
$70
* European Container volumes reflect box shipments only, including the shipments by
the non-consolidated joint venture in Turkey
|
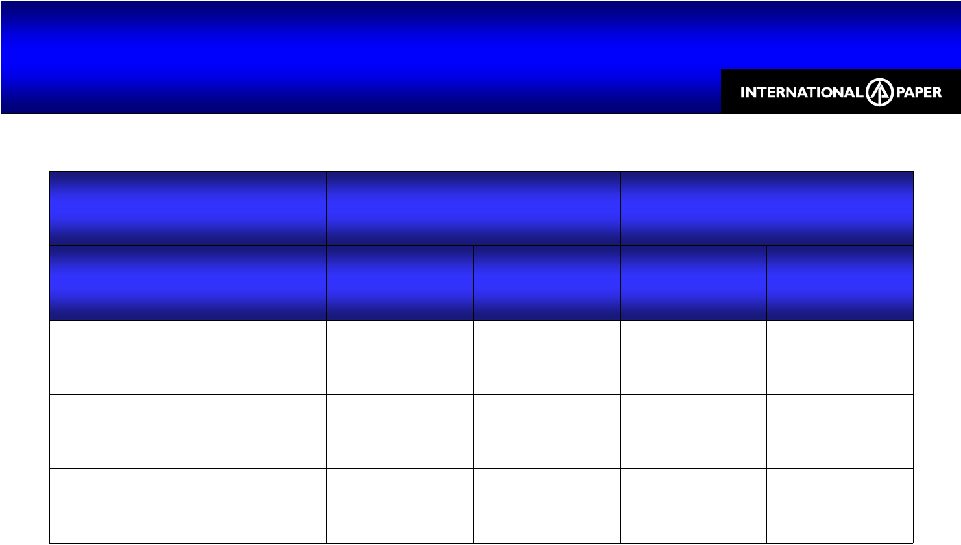 40
Average
IP
price
realization
(includes
the
impact
of
mix
across
all
grades)
2Q10 vs. 1Q10
2Q10 vs. 2Q09
Business
Volume
Price / Ton
Volume
Price / Ton
N.A. Paper
(5%)
$39
(4%)
$27
N.A. Pulp
(13%)
$106
(18%)
$228
European Paper
1%
€28
(7%)
€0
Printing Papers
Printing Papers |
 41
Average IP price realization (includes the impact of mix across all grades)
2Q10 vs. 1Q10
2Q10 vs. 2Q09
Volume
Price/Ton
Volume
Price/Ton
U.S. Coated Paperboard
4%
$28
12%
($7)
Revenue
Price
Revenue
Price
Converting Businesses
4%
NA
(6%)
NA
Consumer Packaging
Consumer Packaging |
 42
Special Items Pre-Tax
from Continuing Operations
Special Items Pre-Tax
from Continuing Operations
Special Items Pre-Tax ($Million)
2Q09
1Q10
2Q10
Industrial
Packaging
Alternative Fuel Mixture Credits
$208
Facility & Machine Closure Costs
($18)
($5)
($1)
Integration Costs
($63)
Printing
Papers
Alternative Fuel Mixture Credits
$197
Facility Closure Costs
($4)
($204)
($111)
Consumer
Packaging
Alternative Fuel Mixture Credits
$77
Reorganization
($1)
($3)
($1)
Corporate
Restructuring & Other Charges
($59)
($3)
($31)
Total Special Items Pre-Tax
$337
($215)
($144) |
 43
Special Items Net of Taxes
from Continuing Operations
Special Items Net of Taxes
from Continuing Operations
2Q10
$ Million
EPS
Earnings Before Special Items
$181
$0.42
Special Items Net of Taxes:
Franklin Mill Shutdown
($68)
Debt Extinguishment
($11)
Tax Adjustment
($7)
Other
($2)
Total Special Items Net of Taxes
($88)
($0.21)
Net Earnings
$93
$0.21 |
 44
2Q10 EBITDA
before Special Items
2Q10 EBITDA
before Special Items
Operating
Profit
$ Million
D & A
$ Million
Tons
Thousand
EBITDA
per Ton
EBITDA
Margin
Industrial Packaging
North America
1
$171
$143
2,608
$120
15.8%
Europe
$19
$7
259
$100
11.2%
Printing Papers
North America
2
$46
$51
688
$141
14.3%
Western Europe
3
$7
$5
70
$171
16.2%
Eastern Europe & Russia
3
$39
$13
240
$217
26.3%
Brazil
$39
$34
282
$259
26.6%
U.S. Market Pulp
$18
$13
215
$144
19.5%
Consumer Packaging
U.S. Coated Paperboard
$14
$35
354
$138
12.5%
1
Excludes Recycling & Bag businesses; includes Saturating Kraft business
2
Includes Bleached Kraft business
3
Excludes Market Pulp |
 45
Operating Profits by Industry Segment
Operating Profits by Industry Segment
$ Million
2Q09
1Q10
2Q10
Industrial Packaging
$255
$46
$193
Printing Papers
$86
$126
$158
Consumer Packaging
$38
$31
$49
Distribution
$10
$21
$26
Forest Products
$3
$8
$40
Operating Profit
$392
$232
$466
Net Interest Expense
($173)
($149)
($157)
Noncontrolling Interest / Equity Earnings Adjustment
$8
$8
$7
Corporate Items
($44)
($51)
($54)
Special Items
$337
($215)
($144)
Earnings (Loss) from continuing operations before
income taxes, equity earnings & noncontrolling interest
$520
($175)
$118
Equity Earnings (Loss), net of taxes -
Ilim
($30)
($3)
$5 |
 46
Geographic Business Segment Operating Results
Before Special Items
Geographic Business Segment Operating Results
Before Special Items
$ Million
Sales
Operating Profit
2Q09
1Q10
2Q10
2Q09
1Q10
2Q10
Industrial Packaging
North American
$1,955
$1,890
$2,120
$241
$23
$172
European
$240
$245
$235
$14
$24
$19
Asian
$75
$85
$85
$0
($1)
$2
Printing Papers
North American
$685
$685
$675
$61
$70
$46
European
$315
$315
$320
$16
$48
$55
Brazilian
$215
$225
$275
$23
$11
$39
U.S. Market Pulp
$135
$155
$160
($14)
($3)
$18
Asian
$10
$25
$15
$0
$0
$0
Consumer Packaging
North American
$565
$550
$580
$17
($1)
$17
European
$80
$85
$80
$14
$20
$19
Asian
$125
$170
$185
$7
$12
$13
Distribution
$1,595
$1,580
$1,630
$10
$21
$26
Excludes Forest Products |
 47
1
Assuming dilution
2
A
reconciliation
to
GAAP
EPS
is
available
at
www.internationalpaper.com
under
the
Investors
tab
at
Webcasts
and
Presentations
Pre-Tax
$MM
Tax
$MM
Non-
controlling
Interest
$MM
Equity
Earnings
Net
Income
$MM
Estimated
Tax Rate
Average
Shares
MM
Diluted
EPS
Before Special Items
1Q10
$40
($13)
($9)
($2)
$16
32%
429
$0.04
2Q10
$262
($81)
($7)
$7
$181
31%
433
$0.42
Special Items
1Q10
($215)
$37
$0
$0
($178)
17%
429
($0.42)
2Q10
($144)
$56
$0
$0
($88)
39%
434
($0.21)
Earnings
1Q10
($175)
$24
($9)
($2)
($162)
14%
429
($0.38)
2Q10
$118
($25)
($7)
$7
$93
21%
433
$0.21
2010 Earnings from Continuing Operations
2010 Earnings from Continuing Operations
2
1 |
 48
Earnings from continuing operations before special items
2Q10 vs. 2Q09 EPS
2Q10 vs. 2Q09 EPS
.20
.42
(.31)
(.05)
.13
.19
.09
.01
.06
.01
.08
.01
$0.00
$0.10
$0.20
$0.30
$0.40
$0.50
$0.60
$0.70
2Q09
Volume
/ LOO
Price
Operations
& Costs
Input
Costs
Mix
Forest
Products
Bad Debt
Corporate
& Other
Ilim
JV
Tax
2Q10 |
 49
255
193
(130)
(2)
20
27
18
5
$0
$50
$100
$150
$200
$250
$300
2Q09
Input
Costs
Volume
LOO
Price
& Mix
Operations
& Costs
Maintenance
Outages
2Q10
Industrial Packaging Earnings
2Q10 vs. 2Q09
Industrial Packaging Earnings
2Q10 vs. 2Q09
Earnings before special items
Operations
32 LIFO, Other Costs (34) |
 50
Printing Papers Earnings
2Q10 vs. 2Q09
Printing Papers Earnings
2Q10 vs. 2Q09
Earnings before special items
86
158
(25)
(6)
(33)
77
5
54
$0
$25
$50
$75
$100
$125
$150
$175
$200
2Q09
Input
Costs
Price
& Mix
Volume
Maintenance
Outages
Operations
& Costs
Bad Debt
2Q10 |
 51
$ Million
2Q09
1Q10
2Q10
Sales
$215
$225
$275
Earnings
$23
$11
$39
EBITDA Margin
24%
20%
27%
IP Brazil results are reported in the Printing Papers segment
IP Brazil
IP Brazil
2Q10 vs. 1Q10
2Q10 vs. 2Q09
Business
Volume
Price /
Ton
Volume
Price /
Ton
Uncoated Freesheet
14%
$43
20%
($9)
Domestic
3%
$54
(7%)
($37)
Export
21%
$36
44%
$6 |
 52
Consumer Packaging Earnings
2Q10 vs. 2Q09
Consumer Packaging Earnings
2Q10 vs. 2Q09
Earnings before special items
38
49
(45)
22
17
13
1
3
$0
$20
$40
$60
$80
$100
2Q09
Price
& Mix
Volume
/ LOO
Input
Costs
Operations
& Costs
Maintenance
Outages
Other
2Q10 |
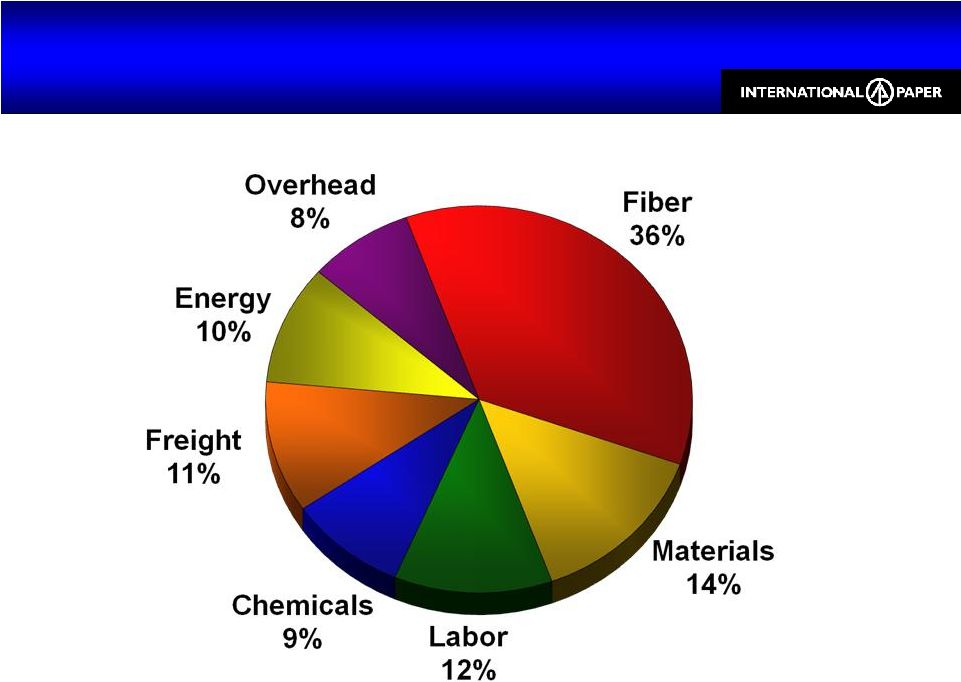 53
Total Cash Cost Components
2Q10 YTD
Total Cash Cost Components
2Q10 YTD
North American Mills Only |
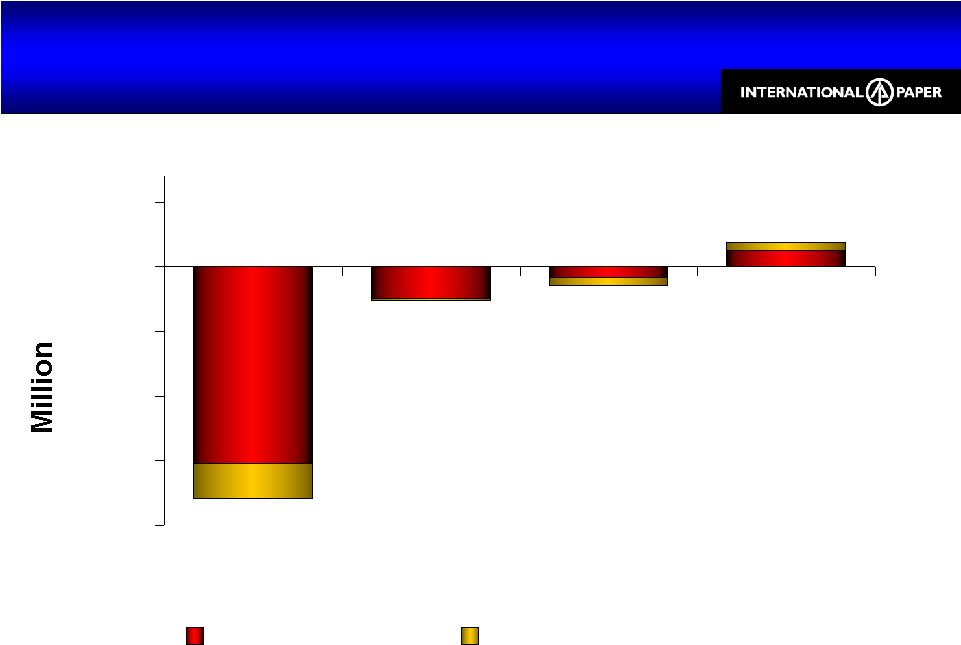
 54
Global Input & Freight Costs vs. 1H09
$287 MM, or $0.45/Share Unfavorable
Global Input & Freight Costs vs. 1H09
$287 MM, or $0.45/Share Unfavorable
Input costs for continuing businesses
76
(17)
(36)
(310)
($350)
($250)
($150)
($50)
$50
Fiber
Freight
Energy
Chemicals
Outside North America
North America |
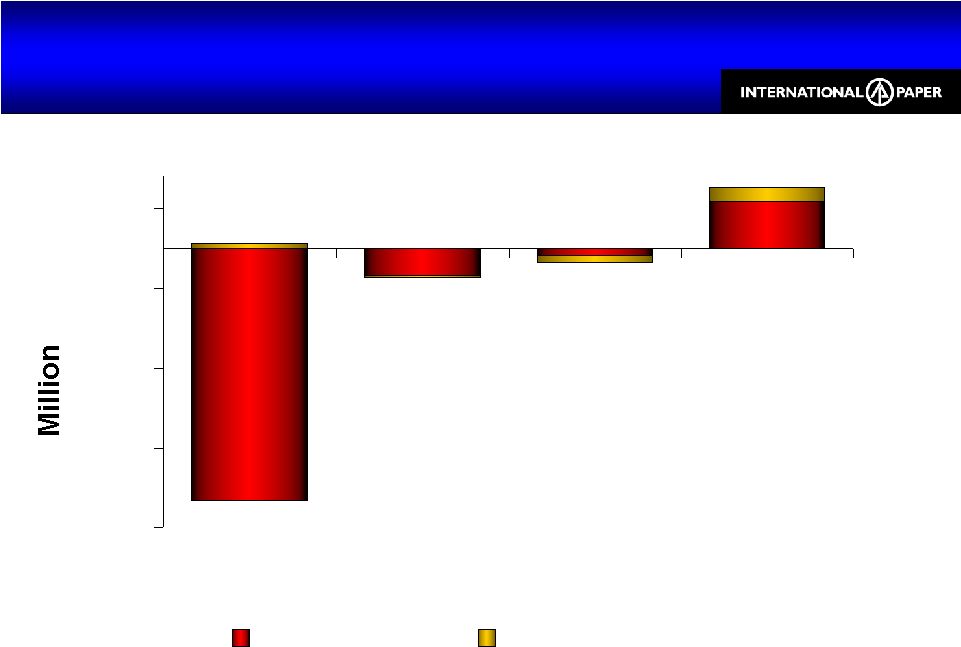
 55
Global Input & Freight Costs vs. 2Q09
$200 MM, or $0.32/Share Unfavorable
Global Input & Freight Costs vs. 2Q09
$200 MM, or $0.32/Share Unfavorable
Input costs for continuing businesses
(179)
(26)
(14)
19
($200)
($150)
($100)
($50)
$0
$50
Fiber
Freight
Energy
Chemicals
North America
Outside North America |
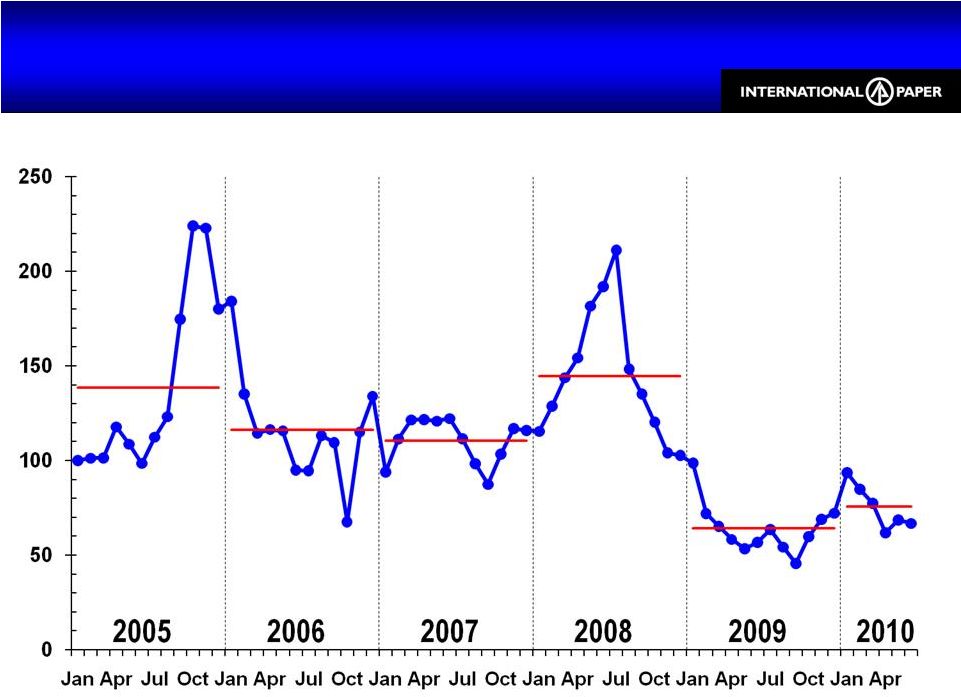 56
NYMEX Natural Gas closing prices
Index: Jan 2005 Natural Gas Costs = 100
Natural Gas Costs
23% Decrease vs. 1Q10 Average Cost
Natural Gas Costs
23% Decrease vs. 1Q10 Average Cost |
 57
U.S. Fuel Oil
2% Increase vs. 1Q10 Average Cost
U.S. Fuel Oil
2% Increase vs. 1Q10 Average Cost
Index: Jan 2006 Fuel Oil Costs = 100
WTI Crude prices |
 58
U.S. Chemical Composite Index
4% Increase vs. 1Q10 Average Cost
U.S. Chemical Composite Index
4% Increase vs. 1Q10 Average Cost
Delivered cost to U.S. facilities; includes Caustic Soda, Sodium
Chlorate, Starch and Sulfuric Acid
2005 -
2008 excludes WY PKG
Index: 1Q05 Chemical Composite= 100 |
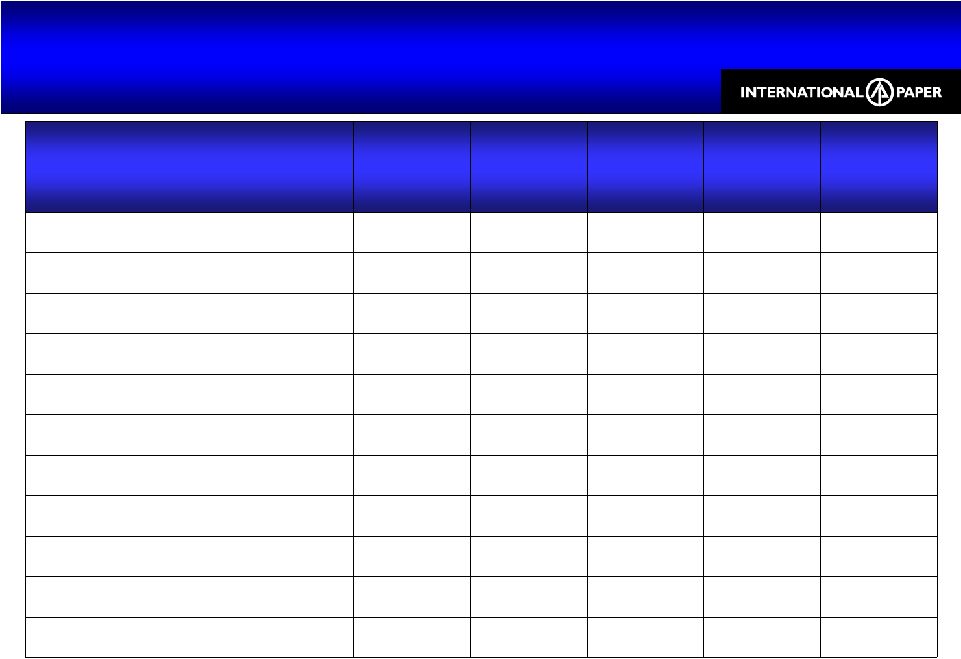
 59
2010 Global Consumption
Annual Purchase Estimates for Key Inputs
2010 Global Consumption
Annual Purchase Estimates for Key Inputs
Does not include Asian or Ilim consumption
Estimates are based on normal operations and may be impacted by downtime
Commodity
U. S.
Non –
U. S.
Energy
Natural Gas (MM BTUs)
42,000,000
13,000,000
Fuel Oil (Barrels)
1,500,000
500,000
Coal (Tons)
860,000
260,000
Fiber
Wood (Tons)
44,200,000
8,800,000
Old Corrugated Containers (Tons)
3,000,000
310,000
Chemicals
Caustic Soda (Tons)
250,000
70,000
Starch (Tons)
394,000
96,000
Sodium Chlorate (Tons)
180,000
40,000
LD Polyethylene (Tons)
39,000
-
Latex (Tons)
22,000
4,000 |