Attached files
| file | filename |
|---|---|
| EX-99.2 - EX-99.2 - Horizon Lines, Inc. | g24163exv99w2.htm |
| EX-99.4 - EX-99.4 - Horizon Lines, Inc. | g24163exv99w4.htm |
| EX-99.1 - EX-99.1 - Horizon Lines, Inc. | g24163exv99w1.htm |
| 8-K - FORM 8-K - Horizon Lines, Inc. | g24163e8vk.htm |
Exhibit 99.3

| HORIZON LINES, INC. SECOND QUARTER 2010 REVIEW JULY 23, 2010 |

| Agenda Second Quarter 2010 Review Introduction and Overview Chuck Raymond Chairman, President & Chief Executive Officer Operations Review John Keenan Senior Vice President & Chief Operating Officer Asia Service Update Brian Taylor Senior Vice President, International Services Financial Review Mike Avara Senior Vice President & Chief Financial Officer Questions and Answers |
| Risks, Uncertainties, Other Factors with Respect to “Forward-Looking Statements” Risks, Uncertainties, Other Factors with Respect to “Forward-Looking Statements”: The information contained in this presentation should be read in conjunction with our filings made with the Securities and Exchange Commission. This presentation contains “forward-looking statements” within the meaning of the federal securities laws. These forward-looking statements are intended to qualify for the safe harbor from liability established by the Private Securities Litigation Reform Act of 1995. Forward-looking statements are those that do not relate solely to historical fact. They include, but are not limited to, any statement that may predict, forecast, indicate or imply future results, performance, achievements or events. Words such as, but not limited to, “believe,” “expect,” “anticipate,” “estimate,” “intend,” “plan,” “target,” “projects,” “likely,” “will,” “would,” “could,” and similar expressions or phrases identify forward-looking statements. All forward-looking statements involve risk and uncertainties. In light of these risks and uncertainties, expected results or other anticipated events or circumstances discussed in this presentation might not occur. We undertake no obligation, and specifically decline any obligation, to publicly update or revise any forward-looking statement, whether as a result of new information, future events or otherwise. See the section entitled “Risk Factors” in our Form 10-K filed with the SEC on February 4, 2010, and in our Form 10-Q to be filed on July 23, 2010, for a more complete discussion of these risks and uncertainties and for other risks and uncertainties. Those factors and the other risk factors described therein are not necessarily all of the important factors that could cause actual results or developments to differ materially from those expressed in any of our forward-looking statements. Other unknown or unpredictable factors also could harm our results. Consequently, there can be no assurance that actual results or developments anticipated by us will be realized or, even if substantially realized, that they will have the expected consequences. Use of Non-GAAP Measures Horizon Lines reports its financial results in accordance with U.S. generally accepted accounting principles (GAAP). The company also believes that the presentation of certain non-GAAP measures, i.e., results excluding certain costs and expenses, provides useful information for the understanding of its ongoing operations and enables investors to focus on period-over-period operating performance without the impact of significant special items, and thereby enhances the user’s overall understanding of the company’s current financial performance relative to past performance and provides a better baseline for modeling future earnings expectations. The company cautions that non-GAAP measures should be considered in addition to, but not as a substitute for, the company’s reported GAAP results. |

| Second Quarter 2010 Review Chuck Raymond Chairman, President & Chief Executive Officer Introduction and Overview |
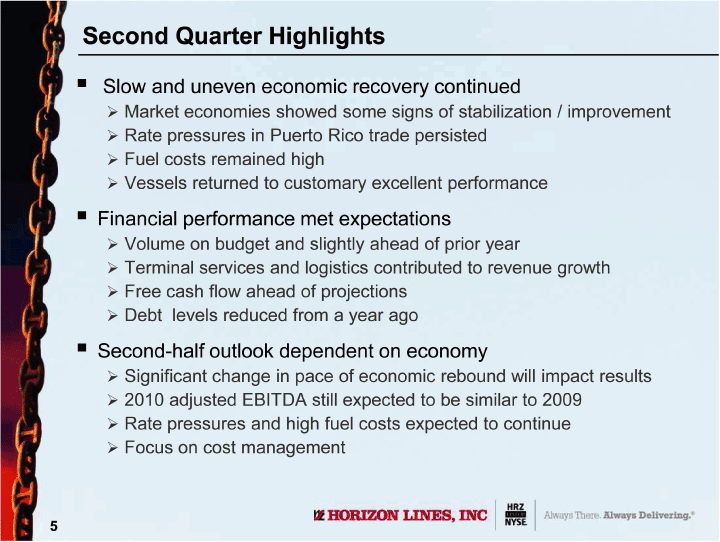
| Second Quarter Highlights Slow and uneven economic recovery continued Market economies showed some signs of stabilization / improvement Rate pressures in Puerto Rico trade persisted Fuel costs remained high Vessels returned to customary excellent performance Financial performance met expectations Volume on budget and slightly ahead of prior year Terminal services and logistics contributed to revenue growth Free cash flow ahead of projections Debt levels reduced from a year ago Second-half outlook dependent on economy Significant change in pace of economic rebound will impact results 2010 adjusted EBITDA still expected to be similar to 2009 Rate pressures and high fuel costs expected to continue Focus on cost management |
| Second Quarter 2010 Review John Keenan Senior Vice President and Chief Operating Officer Operations Review |
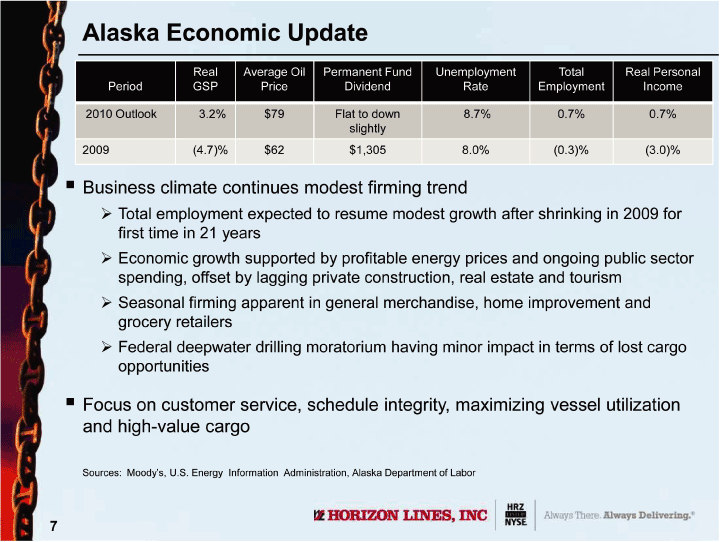
| Alaska Economic Update Real Average Oil Permanent Fund Unemployment Total Real Personal Period GSP Price Dividend Rate Employment Income 2010 Outlook 3.2% $79 Flat to down 8.7% 0.7% 0.7% slightly 2009 (4.7)% $62 $1,305 8.0% (0.3)% (3.0)% Business climate continues modest firming trend Total employment expected to resume modest growth after shrinking in 2009 for first time in 21 years Economic growth supported by profitable energy prices and ongoing public sector spending, offset by lagging private construction, real estate and tourism Seasonal firming apparent in general merchandise, home improvement and grocery retailers Federal deepwater drilling moratorium having minor impact in terms of lost cargo opportunities Focus on customer service, schedule integrity, maximizing vessel utilization and high-value cargo Sources: Moody’s, U.S. Energy Information Administration, Alaska Department of Labor |
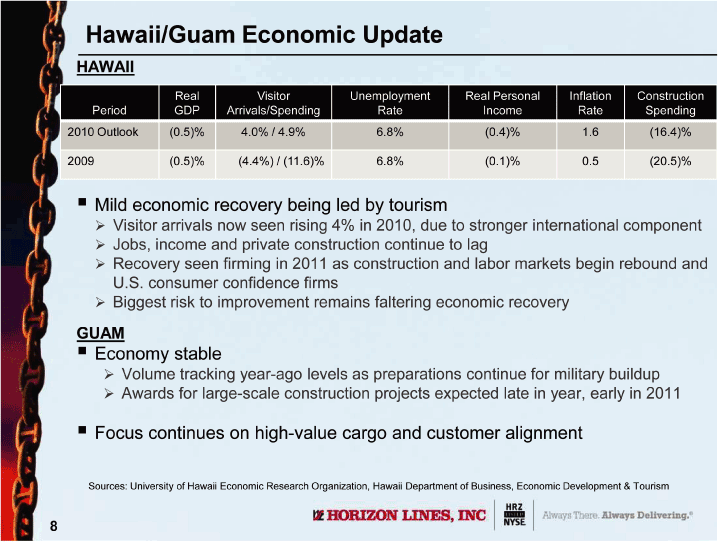
| Hawaii/Guam Economic Update HAWAII Real Visitor Unemployment Real Personal Inflation Construction Period GDP Arrivals/Spending Rate Income Rate Spending 2010 Outlook (0.5)% 4.0% / 4.9% 6.8% (0.4)% 1.6 (16.4)% 2009 (0.5)% (4.4%) / (11.6)% 6.8% (0.1)% 0.5 (20.5)% Mild economic recovery being led by tourism Visitor arrivals now seen rising 4% in 2010, due to stronger international component Jobs, income and private construction continue to lag Recovery seen firming in 2011 as construction and labor markets begin rebound and U.S. consumer confidence firms Biggest risk to improvement remains faltering economic recovery GUAM Economy stable Volume tracking year-ago levels as preparations continue for military buildup Awards for large-scale construction projects expected late in year, early in 2011 Focus continues on high-value cargo and customer alignment Sources: University of Hawaii Economic Research Organization, Hawaii Department of Business, Economic Development & Tourism |
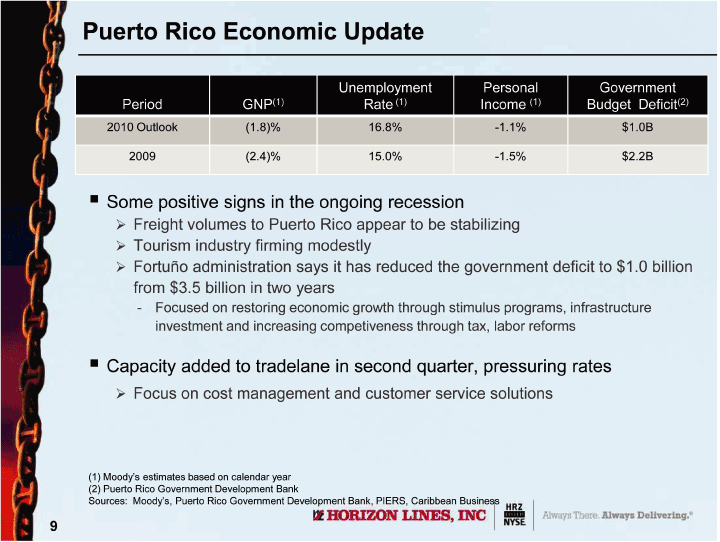
| Puerto Rico Economic Update Unemployment Personal Government Period GNP(1) Rate (1) Income (1) Budget Deficit(2) 2010 Outlook (1.8)% 16.8% -1.1% $1.0B 2009 (2.4)% 15.0% -1.5% $2.2B Some positive signs in the ongoing recession Freight volumes to Puerto Rico appear to be stabilizing Tourism industry firming modestly Fortuño administration says it has reduced the government deficit to $1.0 billion from $3.5 billion in two years — Focused on restoring economic growth through stimulus programs, infrastructure investment and increasing competiveness through tax, labor reforms Capacity added to tradelane in second quarter, pressuring rates Focus on cost management and customer service solutions (1) Moody’s estimates based on calendar year (2) Puerto Rico Government Development Bank Sources: Moody’s, Puerto Rico Government Development Bank, PIERS, Caribbean Business |
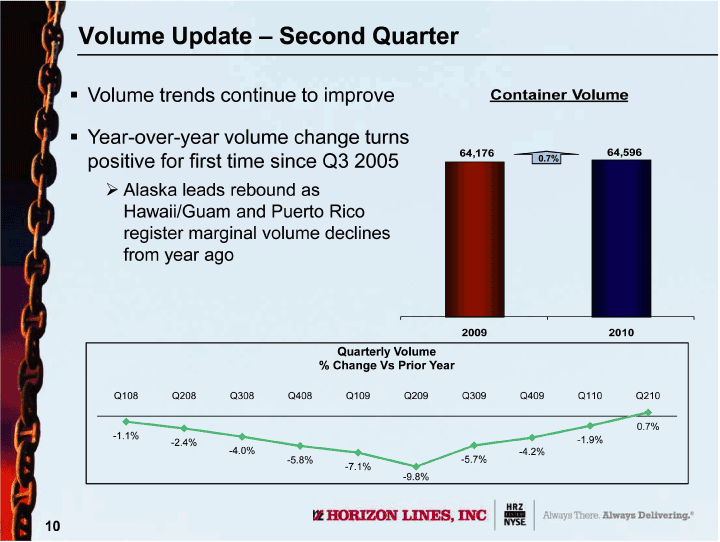
| Volume Update — Second Quarter Volume trends continue to improve Year-over-year volume change turns positive for first time since Q3 2005 Alaska leads rebound as Hawaii/Guam and Puerto Rico register marginal volume declines from year ago |
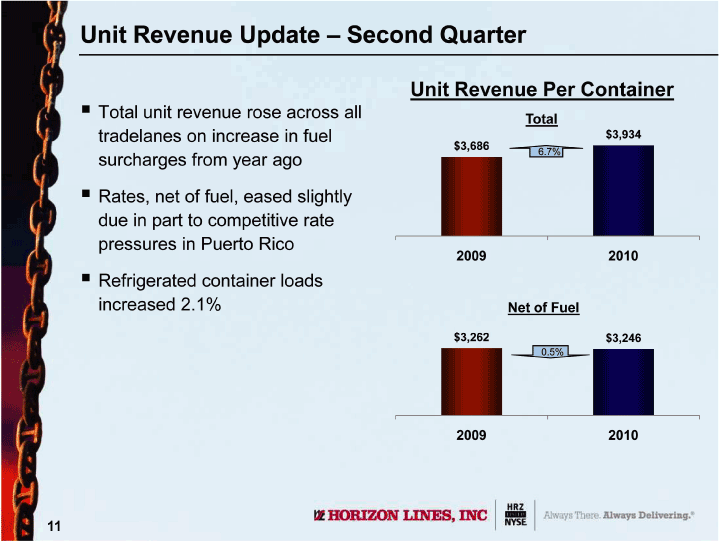
| Unit Revenue Update — Second Quarter Total unit revenue rose across all tradelanes on increase in fuel surcharges from year ago Rates, net of fuel, eased slightly due in part to competitive rate pressures in Puerto Rico Refrigerated container loads increased 2.1% Unit Revenue Per Container |
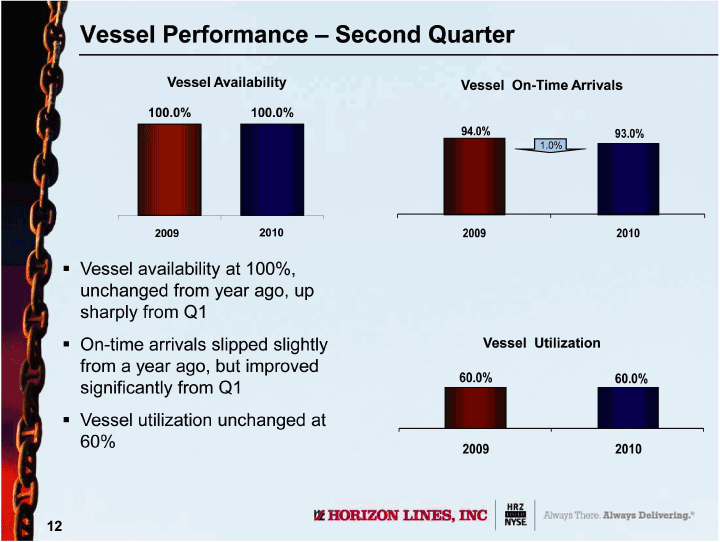
| Vessel Performance — Second Quarter Vessel Availability Vessel On-Time Arrivals Vessel availability at 100%, unchanged from year ago, up sharply from Q1 On-time arrivals slipped slightly from a year ago, but improved significantly from Q1 Vessel utilization unchanged at 60% |

| Second Quarter 2010 Review Brian Taylor Senior Vice President, International Services Asia Service Update |

| Asia Service Update — Right Place / Right Time International market offers long-term growth potential Large, growing market Rates rebounding Perceived need for “niche” service |
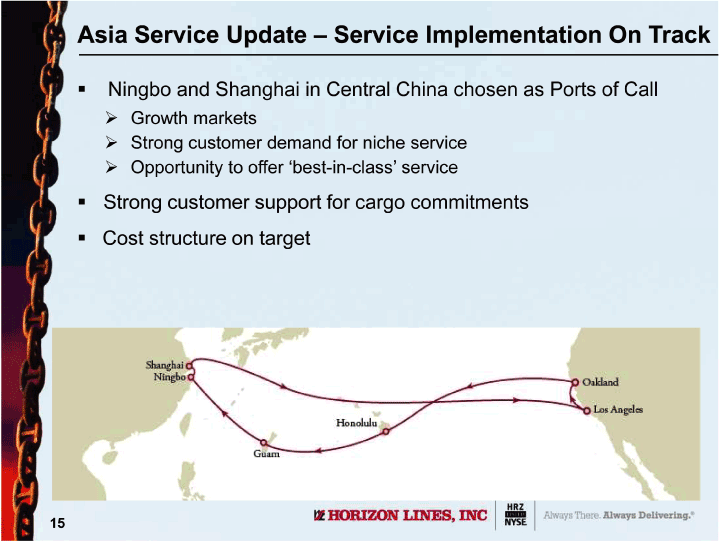
| Asia Service Update — Service Implementation On Track Ningbo and Shanghai in Central China chosen as Ports of Call Growth markets Strong customer demand for niche service Opportunity to offer ‘best-in-class’ service Strong customer support for cargo commitments Cost structure on target |

| Second Quarter 2010 Review Mike Avara Senior Vice President & Chief Financial Officer Financial Review |
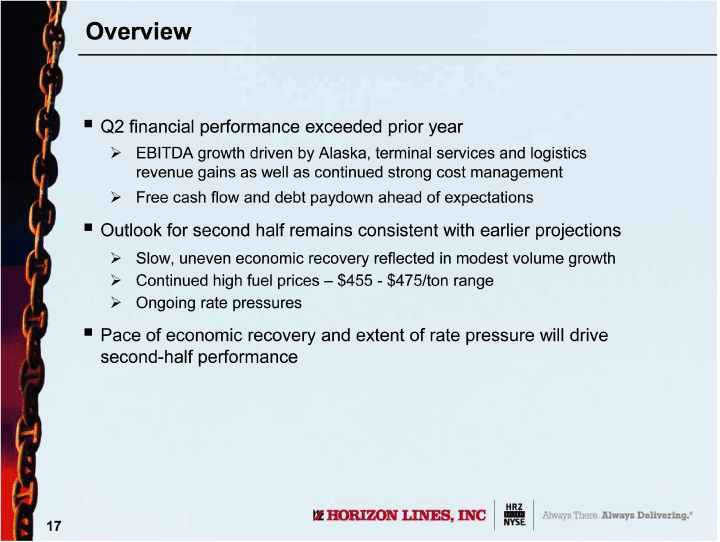
| Overview Q2 financial performance exceeded prior year EBITDA growth driven by Alaska, terminal services and logistics revenue gains as well as continued strong cost management Free cash flow and debt paydown ahead of expectations Outlook for second half remains consistent with earlier projections Slow, uneven economic recovery reflected in modest volume growth Continued high fuel prices — $455 — $475/ton range Ongoing rate pressures Pace of economic recovery and extent of rate pressure will drive second-half performance |
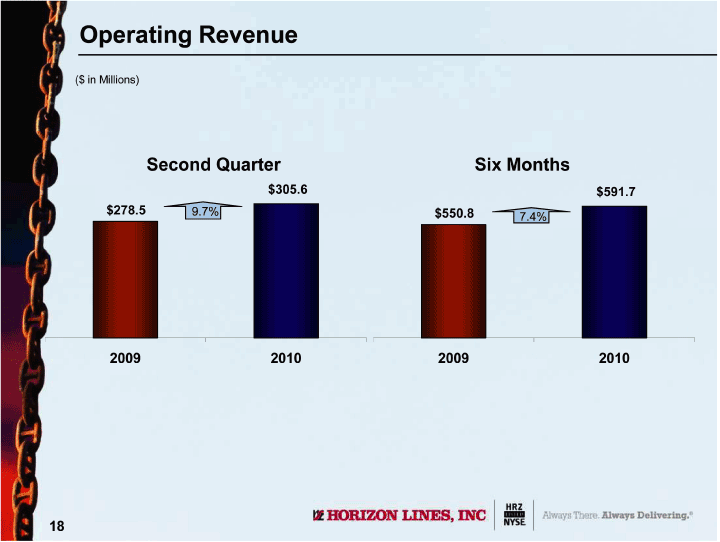
| Operating Revenue ($ in Millions) |
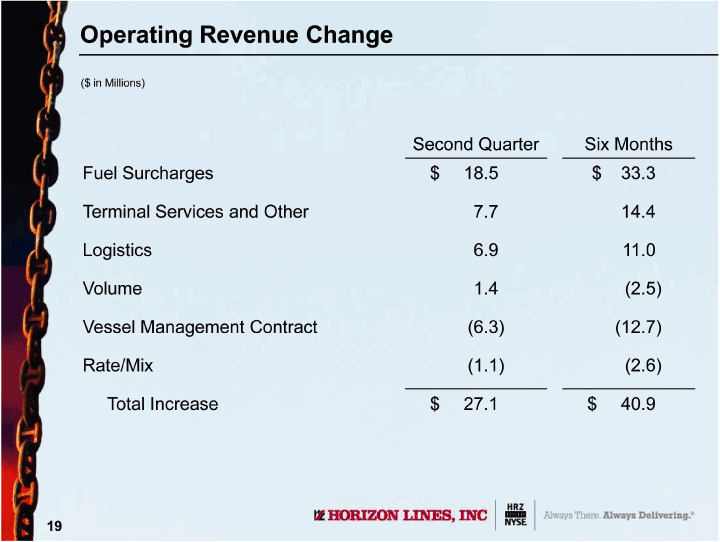
| Operating Revenue Change ($ in Millions) Second Quarter Six Months Fuel Surcharges $ 18.5 $33.3 Terminal Services and Other 7.7 14.4 Logistics 6.9 11.0 Volume 1.4 (2.5) Vessel Management Contract (6.3) (12.7) Rate/Mix (1.1) (2.6) Total Increase $27.1 $40.9 |
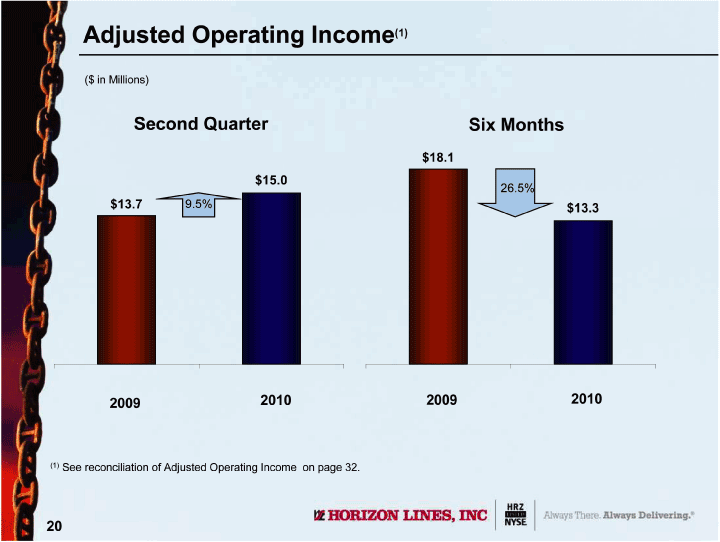
| Adjusted Operating Income(1) ($ in Millions) Second Quarter Six Months (1) See reconciliation of Adjusted Operating Income on page 32. |
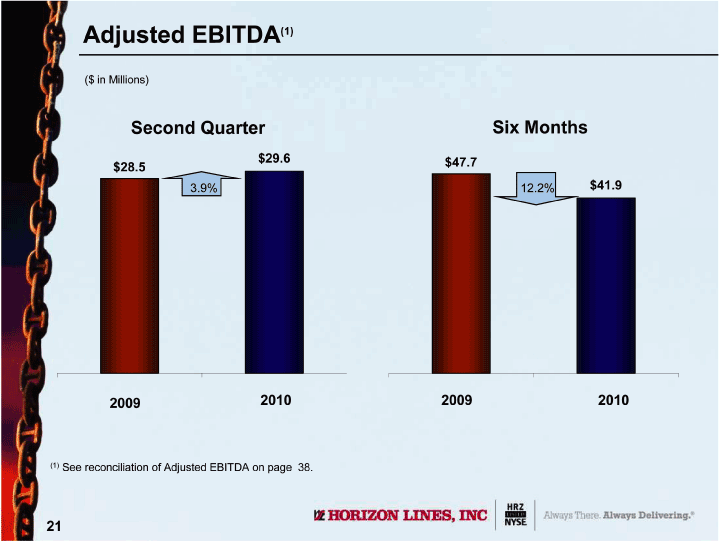
| Adjusted EBITDA(1) ($ in Millions) Second Quarter Six Months (1) See reconciliation of Adjusted EBITDA on page 38. |
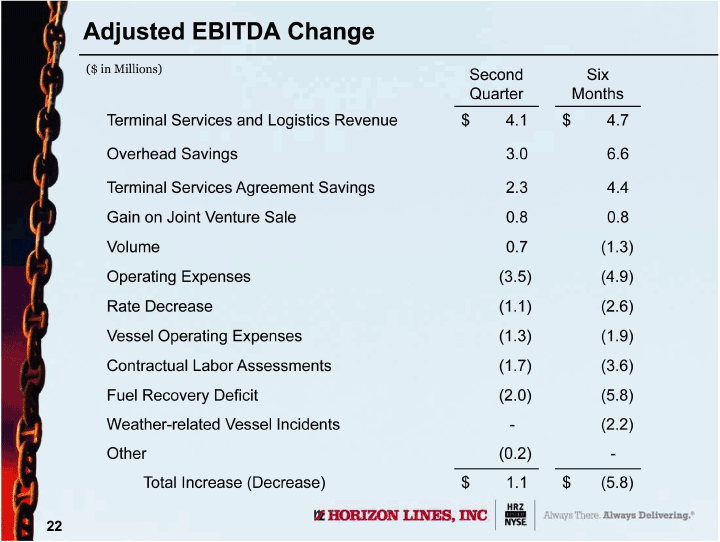
| Adjusted EBITDA Change ($ in Millions) ($ in Millions) Second Six Quarter Months Terminal Services and Logistics Revenue $4.1 $ 4.7 Overhead Savings 3.0 6.6 Terminal Services Agreement Savings 2.3 4.4 Gain on Joint Venture Sale 0.8 0.8 Volume 0.7 (1.3) Operating Expenses (3.5) (4.9) Rate Decrease (1.1) (2.6) Vessel Operating Expenses (1.3) (1.9) Contractual Labor Assessments (1.7) (3.6) Fuel Recovery Deficit (2.0) (5.8) Weather-related Vessel Incidents — (2.2) Other (0.2) — Total Increase (Decrease) $1.1 $ (5.8) |
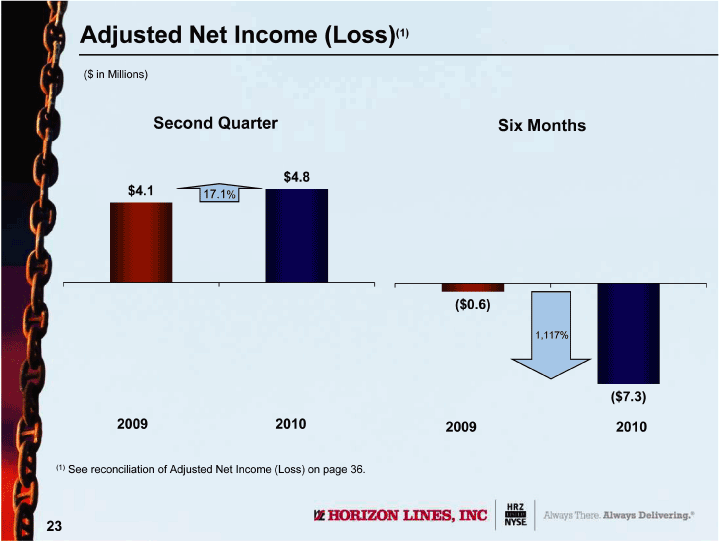
| Adjusted Net Income (Loss)(1) ($ in Millions) Second Quarter Six Months (1) See reconciliation of Adjusted Net Income (Loss) on page 36. |
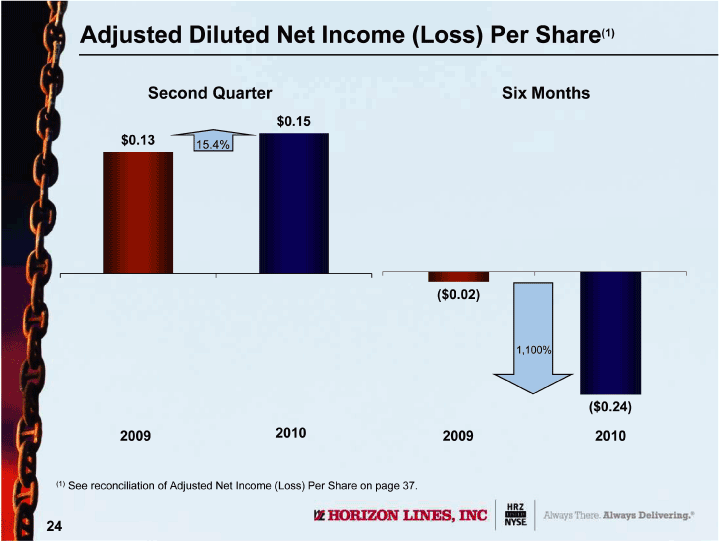
| Adjusted Diluted Net Income (Loss) Per Share(1) Second Quarter Six Months (1) See reconciliation of Adjusted Net Income (Loss) Per Share on page 37. |
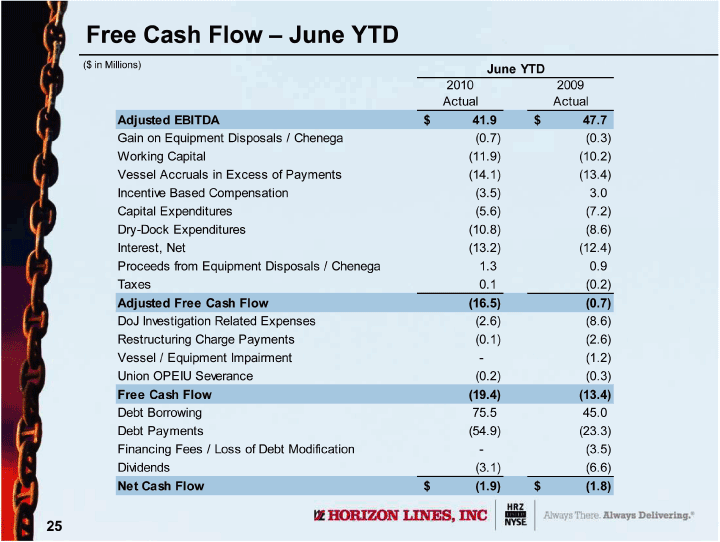
| Free Cash Flow — June YTD ($ in Millions) June YTD 2010 2009 Actual Actual Adjusted EBITDA $41.9 $47.7 Gain on Equipment Disposals / Chenega (0.7) (0.3) Working Capital (11.9) (10.2) Vessel Accruals in Excess of Payments (14.1) (13.4) Incentive Based Compensation (3.5) 3.0 Capital Expenditures (5.6) (7.2) Dry-Dock Expenditures (10.8) (8.6) Interest, Net (13.2) (12.4) Proceeds from Equipment Disposals / Chenega 1.3 0.9 Taxes 0.1 (0.2) Adjusted Free Cash Flow (16.5) (0.7) DoJ Investigation Related Expenses (2.6) (8.6) Restructuring Charge Payments (0.1) (2.6) Vessel / Equipment Impairment - (1.2) Union OPEIU Severance (0.2) (0.3) Free Cash Flow (19.4) (13.4) Debt Borrowing 75.5 45.0 Debt Payments (54.9) (23.3) Financing Fees / Loss of Debt Modification - (3.5) Dividends (3.1) (6.6) Net Cash Flow $ (1.9) $ (1.8) |
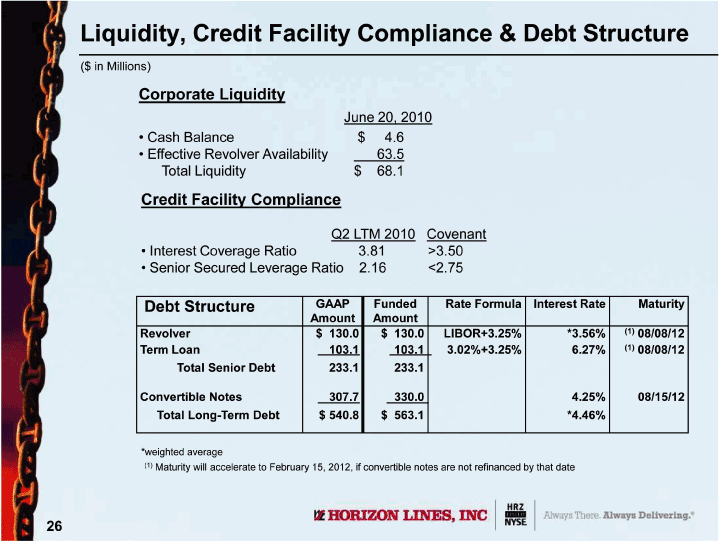
| Liquidity, Credit Facility Compliance & Debt Structure ($ in Millions) Corporate Liquidity June 20, 2010 • Cash Balance $4.6 • Effective Revolver Availability 63.5 Total Liquidity $68.1 Credit Facility Compliance Q2 LTM 2010 Covenant • Interest Coverage Ratio 3.81 >3.50 • Senior Secured Leverage Ratio 2.16 <2.75 Debt Structure GAAP Funded Rate Formula Interest Rate Maturity Amount Amount Revolver $130.0 $130.0 LIBOR+3.25% *3.56% (1) 08/08/12 Term Loan 103.1 103.1 3.02%+3.25% 6.27% (1) 08/08/12 Total Senior Debt 233.1 233.1 Convertible Notes 307.7 330.0 4.25% 08/15/12 Total Long-Term Debt $540.8 $563.1 *4.46% *weighted average (1) Maturity will accelerate to February 15, 2012, if convertible notes are not refinanced by that date |

| Second Quarter 2010 Review Questions & Answers |

| Financial Appendix |
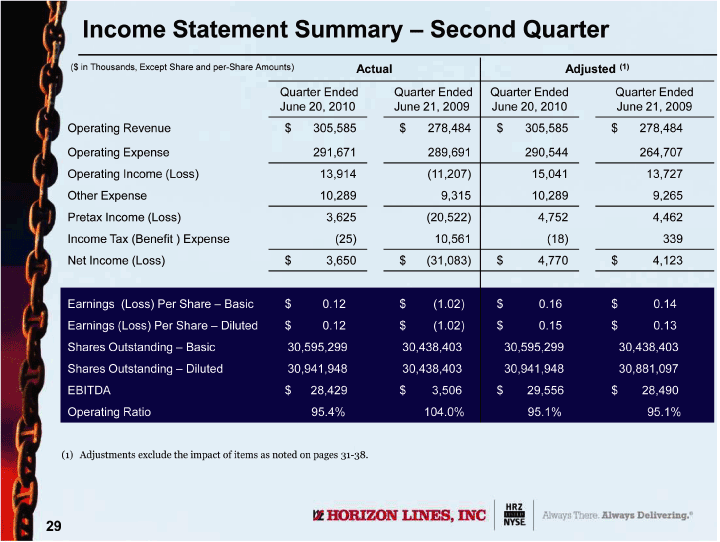
| Income Statement Summary — Second Quarter ($ in Thousands, Except Share and per-Share Amounts) Actual Adjusted (1) Quarter Ended Quarter Ended Quarter Ended Quarter Ended June 20, 2010 June 21, 2009 June 20, 2010 June 21, 2009 Operating Revenue $305,585 $278,484 $305,585 $278,484 Operating Expense 291,671 289,691 290,544 264,707 Operating Income (Loss) 13,914 (11,207) 15,041 13,727 Other Expense 10,289 9,315 10,289 9,265 Pretax Income (Loss) 3,625 (20,522) 4,752 4,462 Income Tax (Benefit ) Expense (25) 10,561 (18) 339 Net Income (Loss) $3,650 $ (31,083) $4,770 $4,123 Earnings (Loss) Per Share — Basic $0.12 $ (1.02) $0.16 $0.14 Earnings (Loss) Per Share — Diluted $0.12 $ (1.02) $0.15 $0.13 Shares Outstanding — Basic 30,595,299 30,438,403 30,595,299 30,438,403 Shares Outstanding — Diluted 30,941,948 30,438,403 30,941,948 30,881,097 EBITDA $28,429 $3,506 $29,556 $28,490 Operating Ratio 95.4% 104.0% 95.1% 95.1% (1) Adjustments exclude the impact of items as noted on pages 31-38. |
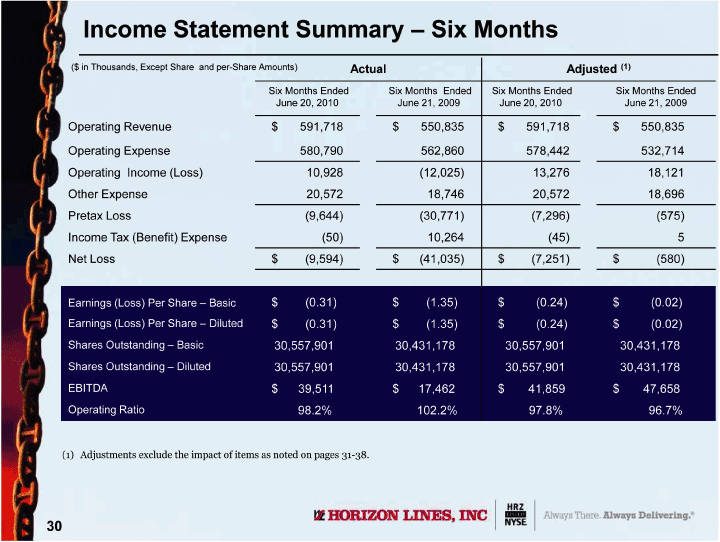
| Income Statement Summary — Six Months ($ in Thousands, Except Share and per-Share Amounts) Actual Adjusted (1) Six Months Ended Six Months Ended Six Months Ended Six Months Ended June 20, 2010 June 21, 2009 June 20, 2010 June 21, 2009 Operating Revenue $591,718 $550,835 $591,718 $550,835 Operating Expense 580,790 562,860 578,442 532,714 Operating Income (Loss) 10,928 (12,025) 13,276 18,121 Other Expense 20,572 18,746 20,572 18,696 Pretax Loss (9,644) (30,771) (7,296) (575) Income Tax (Benefit) Expense (50) 10,264 (45) 5 Net Loss $ (9,594) $ (41,035) $ (7,251) $ (580) Earnings (Loss) Per Share — Basic $ (0.31) $ (1.35) $ (0.24) $ (0.02) Earnings (Loss) Per Share — Diluted $ (0.31) $ (1.35) $ (0.24) $ (0.02) Shares Outstanding — Basic 30,557,901 30,431,178 30,557,901 30,431,178 Shares Outstanding — Diluted 30,557,901 30,431,178 30,557,901 30,431,178 EBITDA $39,511 $17,462 $41,859 $47,658 Operating Ratio 98.2% 102.2% 97.8% 96.7% (1) Adjustments exclude the impact of items as noted on pages 31-38. |
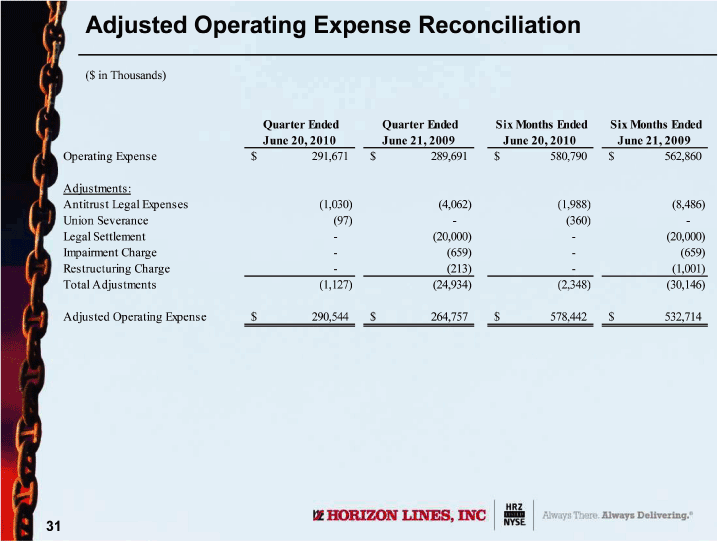
| Adjusted Operating Expense Reconciliation ($ in Thousands) Quarter Ended Quarter Ended Six Months Ended Six Months Ended June 20, 2010 June 21, 2009 June 20, 2010 June 21, 2009 Operating Expense $291,671 $289,691 $580,790 $562,860 Adjustments: Antitrust Legal Expenses (1,030) (4,062) (1,988) (8,486) Union Severance (97) — (360) -Legal Settlement — (20,000) - (20,000) Impairment Charge — (659) — (659) Restructuring Charge — (213) — (1,001) Total Adjustments (1,127) (24,934) (2,348) (30,146) Adjusted Operating Expense $290,544 $264,757 $ 578,442 $532,714 |
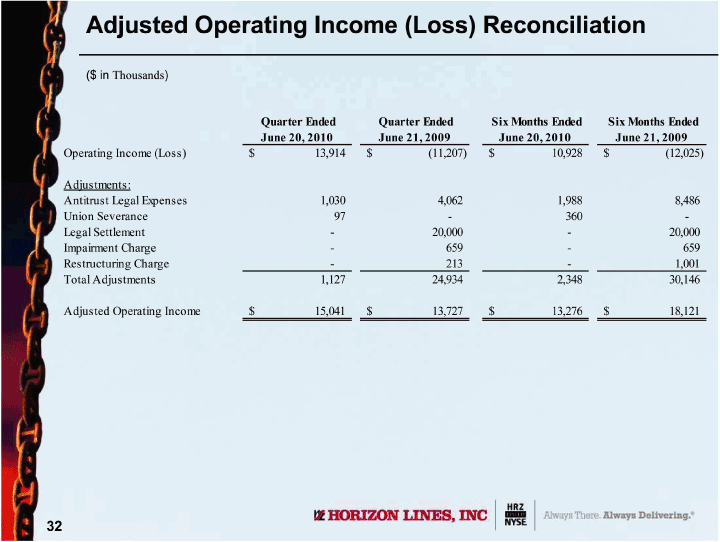
| Adjusted Operating Income (Loss) Reconciliation ($ in Thousands) Quarter Ended Quarter Ended Six Months Ended Six Months Ended June 20, 2010 June 21, 2009 June 20, 2010 June 21, 2009 Operating Income (Loss) $13,914 $ (11,207) $10,928 $ (12,025) Adjustments: Antitrust Legal Expenses 1,030 4,062 1,988 8,486 Union Severance 97 — 360 -Legal Settlement — 20,000 — 20,000 Impairment Charge — 659 — 659 Restructuring Charge — 213 — 1,001 Total Adjustments 1,127 24,934 2,348 30,146 Adjusted Operating Income $15,041 $13,727 $13,276 $18,121 |
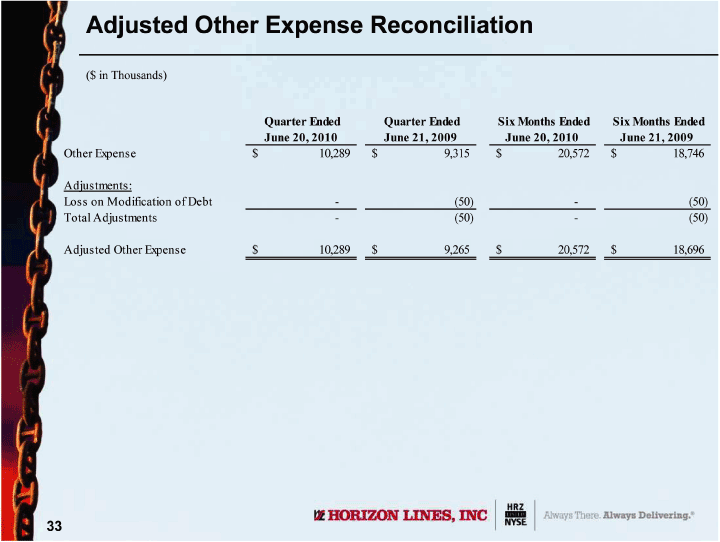
| Adjusted Other Expense Reconciliation ($ in Thousands) Quarter Ended Quarter Ended Six Months Ended Six Months Ended June 20, 2010 June 21, 2009 June 20, 2010 June 21, 2009 Other Expense $10,289 $9,315 $20,572 $18,746 Adjustments: Loss on Modification of Debt - (50) — (50) Total Adjustments — (50) — (50) Adjusted Other Expense $10,289 $9,265 $20,572 $ 18,696 |
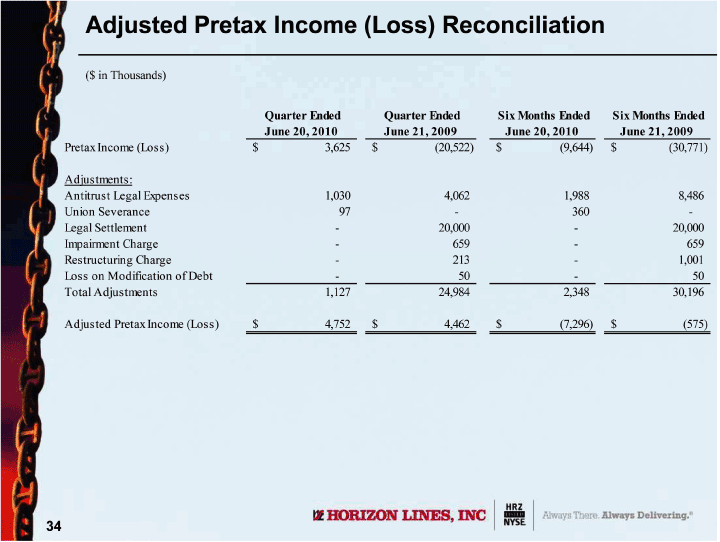
| Adjusted Pretax Income (Loss) Reconciliation ($ in Thousands) Quarter Ended Quarter Ended Six Months Ended Six Months Ended June 20, 2010 June 21, 2009 June 20, 2010 June 21, 2009 Pretax Income (Loss) $3,625 $ (20,522) $ (9,644) $ (30,771) Adjustments: Antitrust Legal Expenses 1,030 4,062 1,988 8,486 Union Severance 97 — 360 -Legal Settlement — 20,000 — 20,000 Impairment Charge — 659 — 659 Restructuring Charge — 213 — 1,001 Loss on Modification of Debt — 50 - 50 Total Adjustments 1,127 24,984 2,348 30,196 Adjusted Pretax Income (Loss) $4,752 $4,462 $ (7,296) $ (575) |
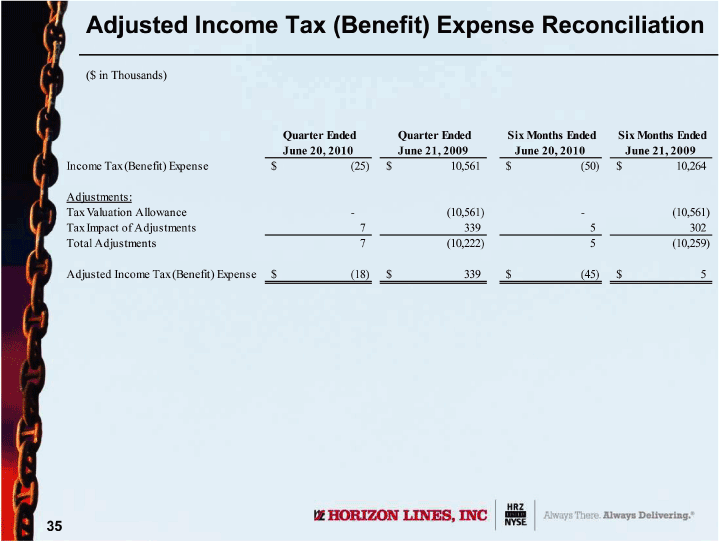
| Adjusted Income Tax (Benefit) Expense Reconciliation ($ in Thousands) Quarter Ended Quarter Ended Six Months Ended Six Months Ended June 20, 2010 June 21, 2009 June 20, 2010 June 21, 2009 Income Tax (Benefit) Expense $ (25) $10,561 $ (50) $10,264 Adjustments: Tax Valuation Allowance — (10,561) — (10,561) Tax Impact of Adjustments 7 339 5 302 Total Adjustments 7 (10,222) 5 (10,259) Adjusted Income Tax (Benefit) Expense $ (18) $339 $ (45) $5 |
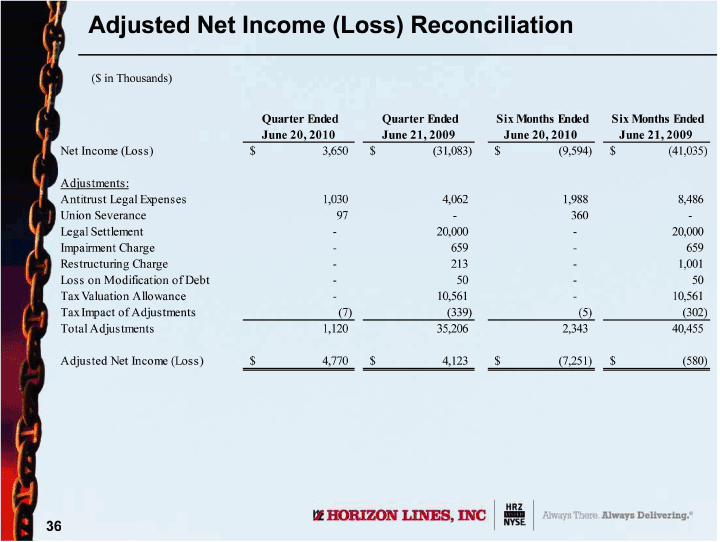
| Adjusted Net Income (Loss) Reconciliation ($ in Thousands) Quarter Ended Quarter Ended Six Months Ended Six Months Ended June 20, 2010 June 21, 2009 June 20, 2010 June 21, 2009 Net Income (Loss) $3,650 $ (31,083) $ (9,594) $ (41,035) Adjustments: Antitrust Legal Expenses 1,030 4,062 1,988 8,486 Union Severance 97 — 360 -Legal Settlement — 20,000 — 20,000 Impairment Charge — 659 — 659 Restructuring Charge — 213 — 1,001 Loss on Modification of Debt — 50 - 50 Tax Valuation Allowance — 10,561 — 10,561 Tax Impact of Adjustments (7) (339) (5) (302) Total Adjustments 1,120 35,206 2,343 40,455 Adjusted Net Income (Loss) $4,770 $4,123 $ (7,251) $ (580) |
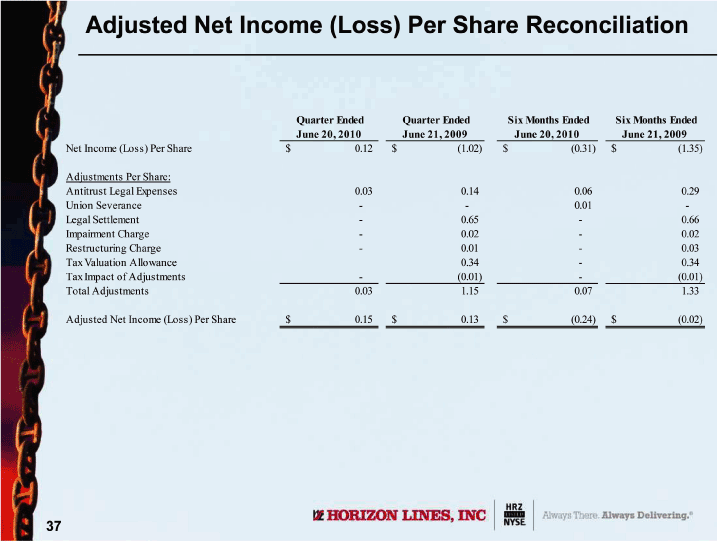
| Adjusted Net Income (Loss) Per Share Reconciliation Quarter Ended Quarter Ended Six Months Ended Six Months Ended June 20, 2010 June 21, 2009 June 20, 2010 June 21, 2009 Net Income (Loss) Per Share $0.12 $ (1.02) $ (0.31) $ (1.35) Adjustments Per Share: Antitrust Legal Expenses 0.03 0.14 0.06 0.29 Union Severance — - 0.01 -Legal Settlement — 0.65 — 0.66 Impairment Charge — 0.02 — 0.02 Restructuring Charge — 0.01 — 0.03 Tax Valuation Allowance 0.34 — 0.34 Tax Impact of Adjustments — (0.01) — (0.01) Total Adjustments 0.03 1.15 0.07 1.33 Adjusted Net Income (Loss) Per Share $0.15 $0.13 $ (0.24) $ (0.02) |
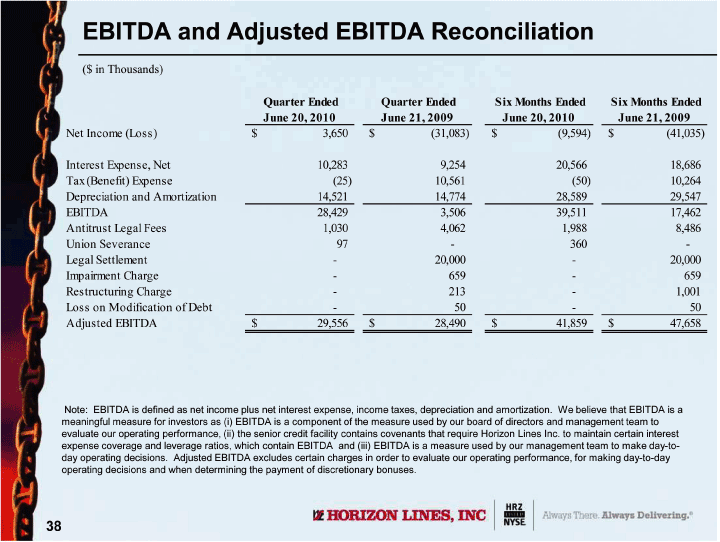
| EBITDA and Adjusted EBITDA Reconciliation ($ in Thousands) Quarter Ended Quarter Ended Six Months Ended Six Months Ended June 20, 2010 June 21, 2009 June 20, 2010 June 21, 2009 Net Income (Loss) $3,650 $ (31,083) $ (9,594) $ (41,035) Interest Expense, Net 10,283 9,254 20,566 18,686 Tax (Benefit) Expense (25) 10,561 (50) 10,264 Depreciation and Amortization 14,521 14,774 28,589 29,547 EBITDA 28,429 3,506 39,511 17,462 Antitrust Legal Fees 1,030 4,062 1,988 8,486 Union Severance 97 — 360 -Legal Settlement — 20,000 — 20,000 Impairment Charge — 659 — 659 Restructuring Charge — 213 — 1,001 Loss on Modification of Debt — 50 — 50 Adjusted EBITDA $29,556 $28,490 $ 41,859 $47,658 Note: EBITDA is defined as net income plus net interest expense, income taxes, depreciation and amortization. We believe that EBITDA is a meaningful measure for investors as (i) EBITDA is a component of the measure used by our board of directors and management team to evaluate our operating performance, (ii) the senior credit facility contains covenants that require Horizon Lines Inc. to maintain certain interest expense coverage and leverage ratios, which contain EBITDA and (iii) EBITDA is a measure used by our management team to make day-today operating decisions. Adjusted EBITDA excludes certain charges in order to evaluate our operating performance, for making day-to-day operating decisions and when determining the payment of discretionary bonuses. |

| Thank You |
