Attached files
| file | filename |
|---|---|
| 8-K - 8-K - CF Industries Holdings, Inc. | a10-14695_18k.htm |
Exhibit 99.1
|
|
Corporate Development Supply Chain Sales Finance Legal Operations Human Resources Dv Sc Sa Fi Le Op Hr CF Industries Southwestern Fertilizer Conference Steve Wilson July 27, 2010 |
|
|
Fertilizer Industry Dynamics The New CF Industries Topics |
|
|
Global Fertilizer Dynamics |
|
|
Total World Grains Harvested Acres & Production Global Grain Production Source: USDA, FAS |
|
|
World Coarse Grain Production by Source Source: USDA, CF (MM Tonnes) |
|
|
Global Nitrogen Consumption & Consumers Source: Fertecon, CF Source: FERTECON |
|
|
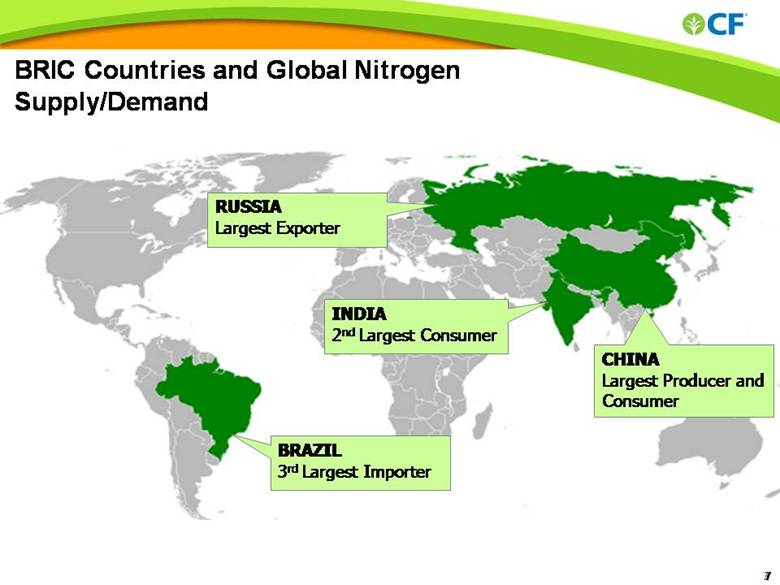
BRIC Countries and Global Nitrogen Supply/Demand BRAZIL 3rd Largest Importer CHINA Largest Producer and Consumer INDIA 2nd Largest Consumer RUSSIA Largest Exporter |
|
|
Nitrogen Importing Countries Source: FERTECON |
|
|
Phosphate Consumption & Consumers Source: Fertecon, CF Source: FERTECON |
|
|
BRIC Countries and Global Phosphate Supply/Demand BRAZIL 4th Largest Consumer CHINA 3rd Largest Exporter INDIA 2nd Largest Consumer RUSSIA 2nd Largest Exporter |
|
|
Phosphate Exporting Countries Source: FERTECON |
|
|
Global commodity prices have been volatile Timing of supply and demand growth will determine future volatility Supply/Demand Volatility Source: FERTECON NOLA price per short ton |
|
|
U.S. Natural Gas Prices First-of-month price at Henry Hub in $/MMBtu Volatility in natural gas pricing has been reduced Supply in the U.S. has increased due to low-cost non-conventional drilling Storage remains near record levels and storage capacity has grown Gas is attractively priced in the U.S. relative to world markets, due partly to high contract pricing in Europe Source: IFERC |
|
|
Cost Advantage Serving Principal Markets ($ per tonne) High natural gas costs in both Eastern and Western Europe expected to force producers in those regions into the role of swing suppliers W. Europe Ukraine Russia U.S. Middle East Source: Fertecon U.S. Delivered Ammonia Supply Cost – U.S. Gulf $100 $200 $300 $400 $500 $600 2007 2008 2009 2010E 2011E 2012E |
|
|
Fertilizer Demand by Nutrient Farm-Level Demand YOY Change in Demand After falling in 2008 and 2009, farm-level fertilizer demand rose for all three primary nutrients in Fertilizer Year 2010 Nitrogen demand is much more stable because it is not stored in the soil from year to year In 2011, application rates are expected to increase while acreage for fertilizer intensive crops increases Nitrogen Phosphate Potash 000 nutrient tons Source: Fertecon, CF |
|
|
Ethanol Update Advanced biofuel production of 1 billion gallons in 2010 expected to double every two years through 2016 Increase in ethanol blend rate for gasoline needed to meet RFS Corn-based ethanol will plateau by 2015 Advanced biofuels including cellulosic ethanol extend growth Like corn, cellulosic feedstocks are grasses that respond well to nitrogen and other fertilizers 10% blend wall Source: Energy Information Agency |
|
|
Diesel Exhaust Fluid (DEF) EPA-mandated NOx Reduction New emissions standard for commercial trucks effective Jan. 1, 2010 All manufacturers except one using SCR technology, which requires regular doses of DEF (urea based) U.S. demand expected to reach ~2.5 million tons of urea equivalent by 2018 CF Industries well positioned to lead TET leading U.S. provider Domestic production preferred due to quality requirements and shipping costs |
|
|
Outlook: Tight Supply/Demand Balance Low producer and downstream inventories Continued buying from India, Pakistan and South America Heavy summer turnaround schedule Normal harvest followed by full fall window |
|
|
The New CF Industries |
|
|
The New Leader in Nitrogen Fertilizer Global #2 in nitrogen and the clear leader in North America Third largest producer of phosphate fertilizer among public companies globally Strong balance sheet Committed to maintaining flexibility through deleveraging Favorable natural gas position and production located in markets to best serve North America |
|
|
A Global Leader in Nitrogen Fertilizers Nitrogen Production Capacity (Million Nutrient Tons in 2009) Source: Public Data, FERTECON, CF 7.3 6.3 3.1 3.1 2.3 0.0 1.0 2.0 3.0 4.0 5.0 6.0 7.0 8.0 Yara CF Agrium Potash Koch |
|
|
World-Scale, Fully-Integrated Phosphate Pro Forma CF/Terra Revenues (2009) Phosphate 17% $679MM Nitrogen 83% $3,420MM Source: Fertecon Global Phosphoric Acid Capacity MOS 9% PCS 5% CF 2% All Other Public 6% Private/ Government Entities 78% 3rd largest phosphate business among public fertilizer companies Plant City is the world’s 7th largest phosphate facility |
|
|
CF Export Sales Tons (000) Export capability provides flexibility Phosphates Nitrogen 5 Year Average Keytrade partnership provides access to global markets for both imports and exports |
|
|
Rationale for Terra Acquisition Greatly enhanced scale and strategic platform Nearly doubles revenues More than doubles nitrogen manufacturing capacity Exposure to cost advantaged North American natural gas Significant synergy opportunity Complementary production footprint with overlapping distribution footprint Identified $105 million to $135 million of annual cost synergies Additional synergies in cap. ex. and working capital Enhanced capabilities and access to sales channels Transition facilitated by location and similarity of businesses |

|
|
Complementary Strengths In Nitrogen (000s Product Tons) Legacy Terra Capacity Nitrogen Production Capacities 2,415 1,164 2,490 3,833 1,839 280 6,248 3,003 2,770 1,437 1,437 0 2,000 4,000 6,000 8,000 UAN Ammonia Urea Ammonium Nitrate Legacy CF Capacity |
|
|
Things that Won’t Change Commitment to safety and environmental stewardship Commitment to agricultural markets Outstanding customer service and support Commitment to getting product to customer at right place and right time World class manufacturing and extensive distribution system Highest standards of ethics and mutual respect Your nitrogen fertilizer producer of choice |
|
|
Customer Segmentation 2009 Product Tons |
|
|
Better Able to Serve Customers A one-stop shop for nitrogen products, including Ammonium Nitrate Sales organization, including regional team, aligned with customers FPP and PROMISE customer interface for all customers In-market production and shortened supply lines The combination of two complementary businesses and adoption of best practices will allow us to serve you better in the following ways: |
|
|
Enhanced flexibility to meet customer needs MEDICINE HAT, AB Nitrogen Complementary Production Locations DONALDSONVILLE, LA Nitrogen PORT NEAL, IA Nitrogen COURTRIGHT, ON Nitrogen WOODWARD, OK Nitrogen VERDIGRIS, OK Nitrogen YAZOO CITY, MS Nitrogen PLANT CITY, FL Phosphate |
|
|
Brings CF Industries closer to you Overlapping Distribution Points |
|
|
Significant Cost Synergies $105 million to $135 million annual rate achieved over the next 18 to 24 months |
|
|
Summary Even more intense globalization Positive fundamentals in the near term It’s a good time to be a North American nitrogen producer (and a North American phosphate producer) We’re pleased with our position (post Terra acquisition) and eager to serve you from our new, bigger and more efficient platform |