Attached files
| file | filename |
|---|---|
| 8-K - FORM 8-K - JOHNSON CONTROLS INC | c59247e8vk.htm |
| EX-99.1 - EX-99.1 - JOHNSON CONTROLS INC | c59247exv99w1.htm |
Exhibit 99.2
| Quarterly update FY 2010 third quarter July 23, 2010 Exhibit 99.2 |
| Agenda Introduction Glen Ponczak, Vice President, Investor Relations Overview Steve Roell, Chairman and Chief Executive Officer Business results and financial review Bruce McDonald, Executive Vice President and Chief Financial Officer Q&A (conclude at noon Eastern time) FORWARD-LOOKING STATEMENT Johnson Controls, Inc. ("the Company") has made forward-looking statements in this presentation pertaining to its financial results for fiscal 2010 and beyond that are based on preliminary data and are subject to risks and uncertainties. All statements other than statements of historical fact are statements that are or could be deemed forward-looking statements and included terms such as "outlook," "expectations," "estimates," or "forecasts." For those statements, the Company cautions that numerous important factors, such as automotive vehicle production levels, mix and schedules, energy prices, the strength of the U.S. or other economies, currency exchange rates, cancellation of or changes to commercial contracts, changes in the levels or timing of investments in commercial buildings, the ability to execute on restructuring actions according to anticipated timelines and costs as well as other factors discussed in Item 1A of Part I of the Company's most recent Form 10-k filing (filed November 24, 2009) could affect the Company's actual results and could cause its actual consolidated results to differ materially from those expressed in any forward-looking statement made by, or on behalf of, the Company. 2 |
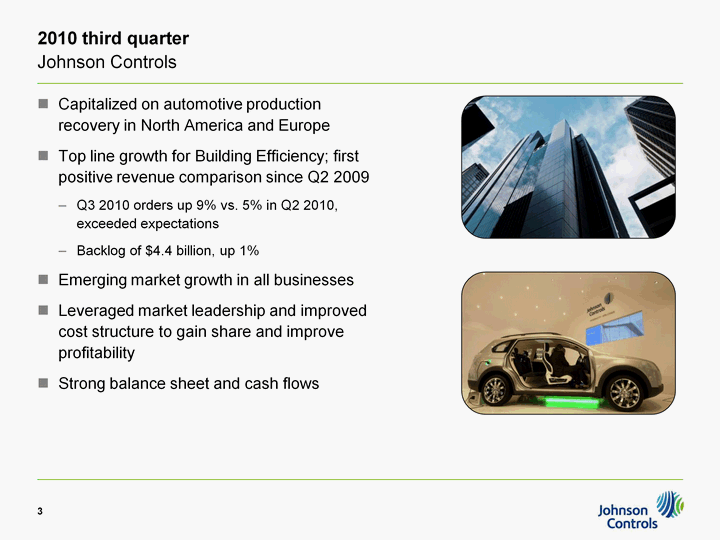
| 2010 third quarter Johnson Controls Capitalized on automotive production recovery in North America and Europe Top line growth for Building Efficiency; first positive revenue comparison since Q2 2009 Q3 2010 orders up 9% vs. 5% in Q2 2010, exceeded expectations Backlog of $4.4 billion, up 1% Emerging market growth in all businesses Leveraged market leadership and improved cost structure to gain share and improve profitability Strong balance sheet and cash flows 3 |
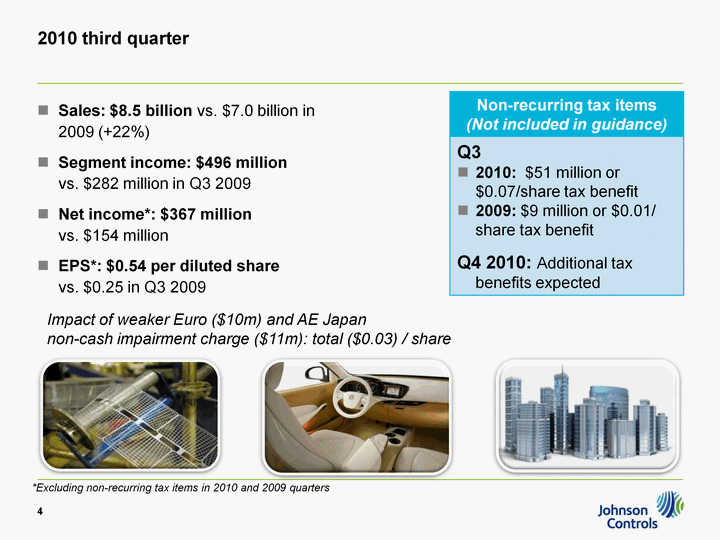
| 2010 third quarter Sales: $8.5 billion vs. $7.0 billion in 2009 (+22%) Segment income: $496 million vs. $282 million in Q3 2009 Net income*: $367 million vs. $154 million EPS*: $0.54 per diluted share vs. $0.25 in Q3 2009 vs. $0.25 in Q3 2009 vs. $0.25 in Q3 2009 vs. $0.25 in Q3 2009 vs. $0.25 in Q3 2009 vs. $0.25 in Q3 2009 vs. $0.25 in Q3 2009 vs. $0.25 in Q3 2009 vs. $0.25 in Q3 2009 4 *Excluding non-recurring tax items in 2010 and 2009 quarters Impact of weaker Euro ($10m) and AE Japan non-cash impairment charge ($11m): total ($0.03) / share |
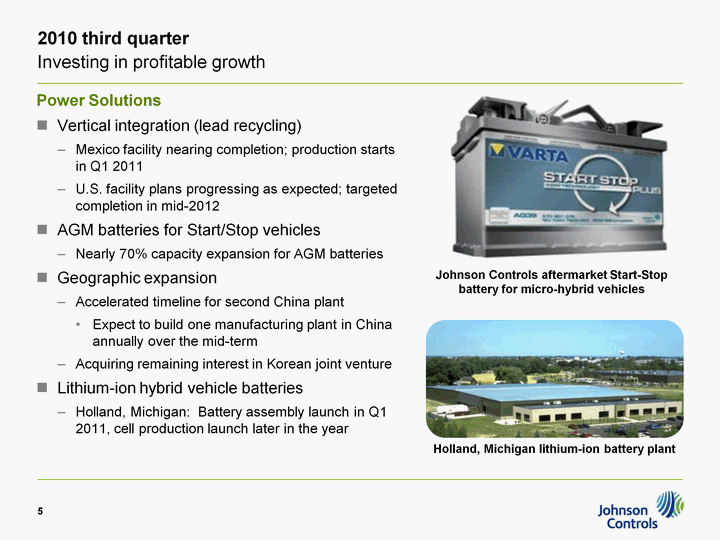
| 2010 third quarter Investing in profitable growth Power Solutions Vertical integration (lead recycling) Mexico facility nearing completion; production starts in Q1 2011 U.S. facility plans progressing as expected; targeted completion in mid-2012 AGM batteries for Start/Stop vehicles Nearly 70% capacity expansion for AGM batteries Geographic expansion Accelerated timeline for second China plant Expect to build one manufacturing plant in China annually over the mid-term Acquiring remaining interest in Korean joint venture Lithium-ion hybrid vehicle batteries Holland, Michigan: Battery assembly launch in Q1 2011, cell production launch later in the year 5 Holland, Michigan lithium-ion battery plant Johnson Controls aftermarket Start-Stop battery for micro-hybrid vehicles |
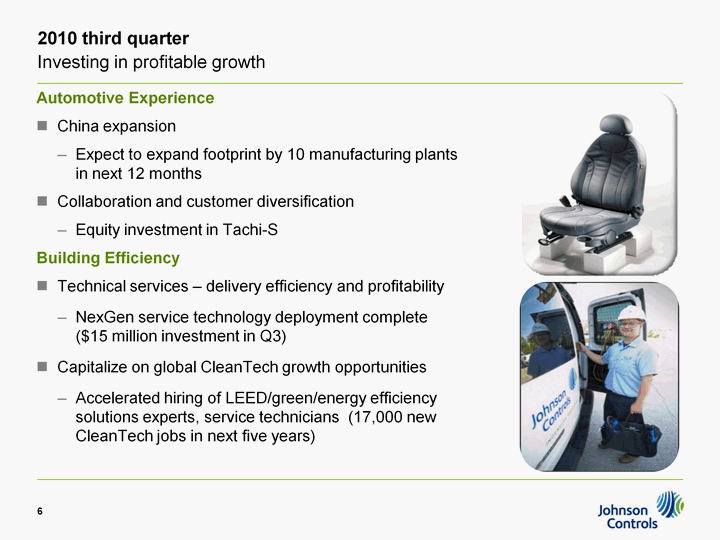
| 2010 third quarter Investing in profitable growth Automotive Experience China expansion Expect to expand footprint by 10 manufacturing plants in next 12 months Collaboration and customer diversification Equity investment in Tachi-S Building Efficiency Technical services - delivery efficiency and profitability NexGen service technology deployment complete ($15 million investment in Q3) Capitalize on global CleanTech growth opportunities Accelerated hiring of LEED/green/energy efficiency solutions experts, service technicians (17,000 new CleanTech jobs in next five years) 6 |
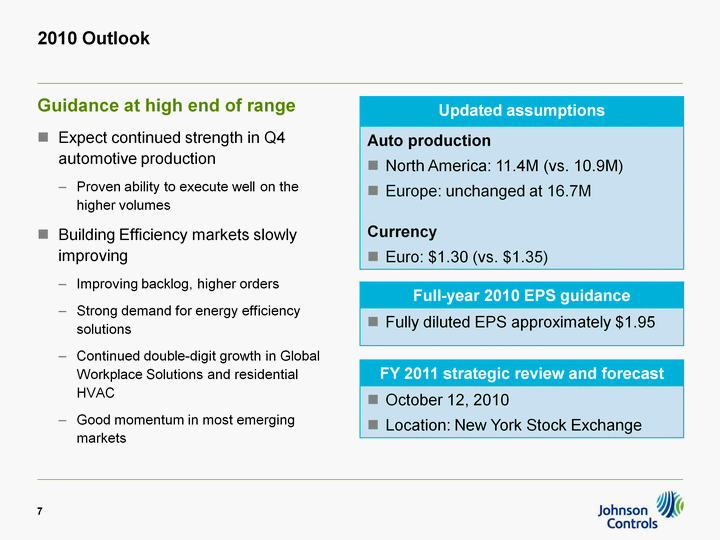
| 2010 Outlook Guidance at high end of range Expect continued strength in Q4 automotive production Proven ability to execute well on the higher volumes Building Efficiency markets slowly improving Improving backlog, higher orders Strong demand for energy efficiency solutions Continued double-digit growth in Global Workplace Solutions and residential HVAC Good momentum in most emerging markets markets markets markets markets markets markets markets markets markets markets markets markets markets markets markets 7 Full-year 2010 EPS guidance Fully diluted EPS approximately $1.95 FY 2011 strategic review and forecast October 12, 2010 Location: New York Stock Exchange |
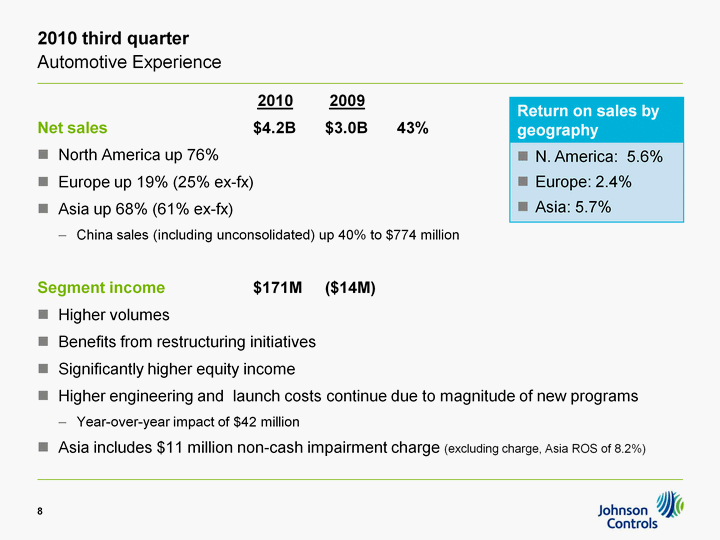
| 2010 third quarter Automotive Experience 2010 2009 Net sales $4.2B $3.0B 43% North America up 76% Europe up 19% (25% ex-fx) Asia up 68% (61% ex-fx) China sales (including unconsolidated) up 40% to $774 million Segment income $171M ($14M) Higher volumes Benefits from restructuring initiatives Significantly higher equity income Higher engineering and launch costs continue due to magnitude of new programs Year-over-year impact of $42 million Asia includes $11 million non-cash impairment charge (excluding charge, Asia ROS of 8.2%) 8 Return on sales by geography N. America: 5.6% Europe: 2.4% Asia: 5.7% |
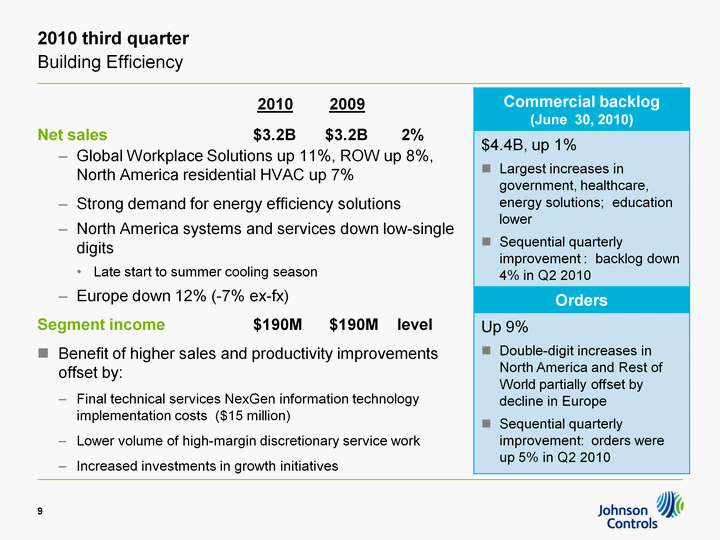
| 2010 third quarter Building Efficiency 2010 2009 Net sales $3.2B $3.2B 2% Global Workplace Solutions up 11%, ROW up 8%, North America residential HVAC up 7% Strong demand for energy efficiency solutions North America systems and services down low-single digits Late start to summer cooling season Europe down 12% (-7% ex-fx) Segment income $190M $190M level Benefit of higher sales and productivity improvements offset by: Final technical services NexGen information technology implementation costs ($15 million) Lower volume of high-margin discretionary service work Increased investments in growth initiatives 9 Commercial backlog (June 30, 2010) $4.4B, up 1% Largest increases in government, healthcare, energy solutions; education lower Sequential quarterly improvement : backlog down 4% in Q2 2010 Orders Up 9% Double-digit increases in North America and Rest of World partially offset by decline in Europe Sequential quarterly improvement: orders were up 5% in Q2 2010 |
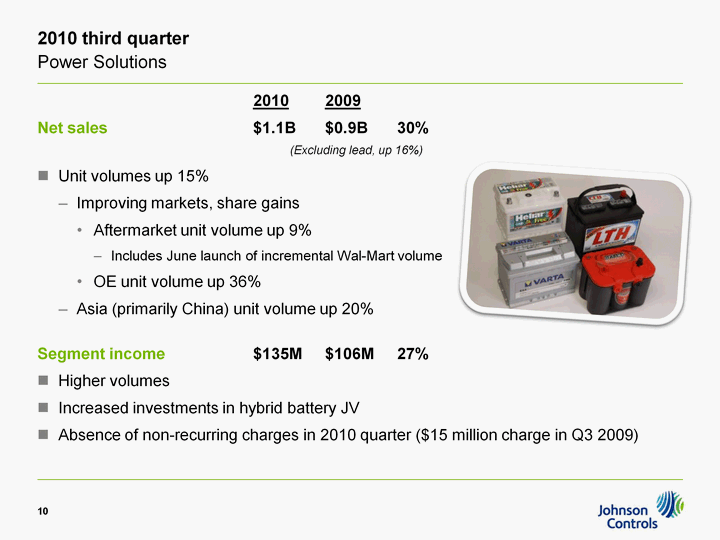
| 2010 third quarter Power Solutions 2010 2009 Net sales $1.1B $0.9B 30% (Excluding lead, up 16%) Unit volumes up 15% Improving markets, share gains Aftermarket unit volume up 9% Includes June launch of incremental Wal-Mart volume OE unit volume up 36% Asia (primarily China) unit volume up 20% Segment income $135M $106M 27% Higher volumes Increased investments in hybrid battery JV Absence of non-recurring charges in 2010 quarter ($15 million charge in Q3 2009) Absence of non-recurring charges in 2010 quarter ($15 million charge in Q3 2009) Absence of non-recurring charges in 2010 quarter ($15 million charge in Q3 2009) Absence of non-recurring charges in 2010 quarter ($15 million charge in Q3 2009) Absence of non-recurring charges in 2010 quarter ($15 million charge in Q3 2009) Absence of non-recurring charges in 2010 quarter ($15 million charge in Q3 2009) Absence of non-recurring charges in 2010 quarter ($15 million charge in Q3 2009) Absence of non-recurring charges in 2010 quarter ($15 million charge in Q3 2009) Absence of non-recurring charges in 2010 quarter ($15 million charge in Q3 2009) Absence of non-recurring charges in 2010 quarter ($15 million charge in Q3 2009) Absence of non-recurring charges in 2010 quarter ($15 million charge in Q3 2009) Absence of non-recurring charges in 2010 quarter ($15 million charge in Q3 2009) Absence of non-recurring charges in 2010 quarter ($15 million charge in Q3 2009) Absence of non-recurring charges in 2010 quarter ($15 million charge in Q3 2009) Absence of non-recurring charges in 2010 quarter ($15 million charge in Q3 2009) 10 |
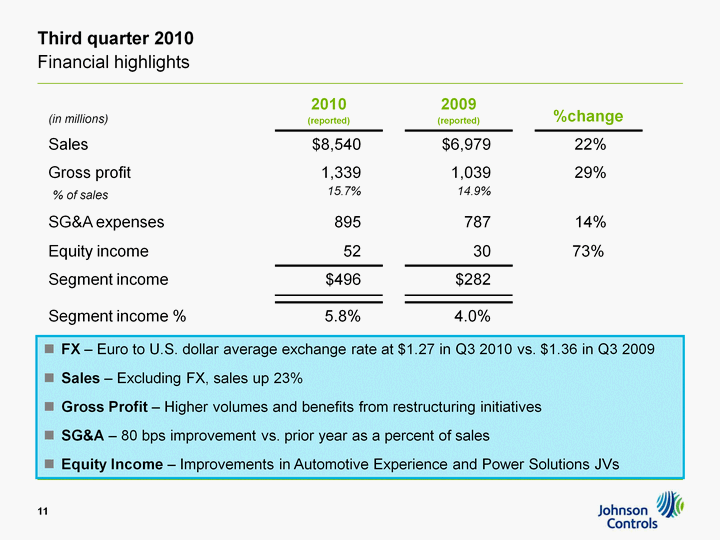
| Third quarter 2010 Financial highlights Financial highlights Financial highlights 11 FX - Euro to U.S. dollar average exchange rate at $1.27 in Q3 2010 vs. $1.36 in Q3 2009 Sales - Excluding FX, sales up 23% Gross Profit - Higher volumes and benefits from restructuring initiatives SG&A - 80 bps improvement vs. prior year as a percent of sales Equity Income - Improvements in Automotive Experience and Power Solutions JVs |
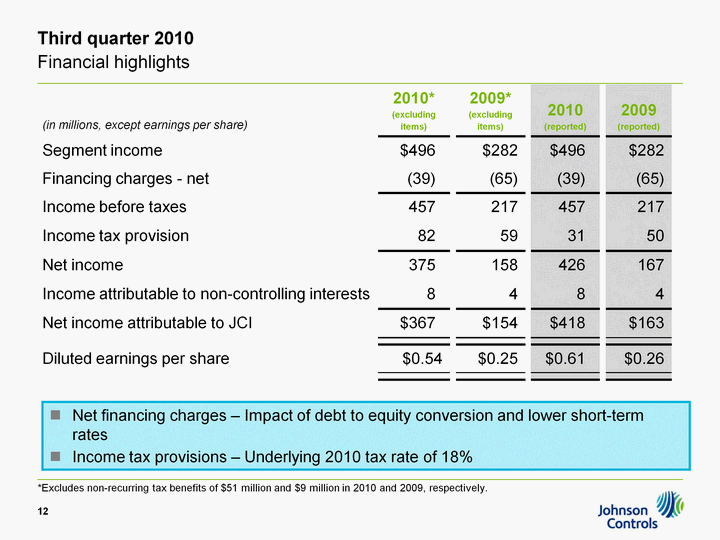
| Third quarter 2010 Financial highlights Financial highlights Financial highlights 12 Net financing charges - Impact of debt to equity conversion and lower short-term rates Income tax provisions - Underlying 2010 tax rate of 18% *Excludes non-recurring tax benefits of $51 million and $9 million in 2010 and 2009, respectively. |
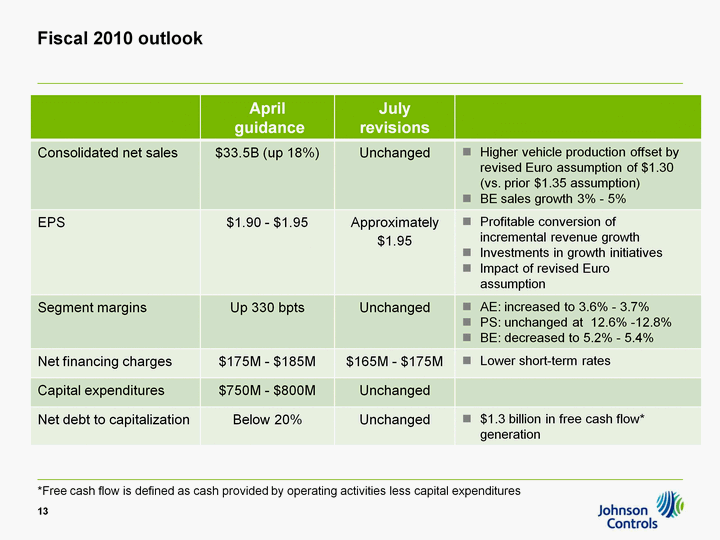
| Fiscal 2010 outlook Fiscal 2010 outlook 13 *Free cash flow is defined as cash provided by operating activities less capital expenditures |
