Attached files
Table of Contents
UNITED STATES
SECURITIES AND EXCHANGE COMMISSION
Washington, D. C. 20549
FORM 10-K
| x | ANNUAL REPORT PURSUANT TO SECTION 13 or 15(d) OF THE SECURITIES EXCHANGE ACT OF 1934 |
For the fiscal year ended May 31, 2010
OR
| ¨ | TRANSITION REPORT PURSUANT TO SECTION 13 or 15(d) OF THE SECURITIES EXCHANGE ACT OF 1934 |
For the transition period from to
Commission File Number 1-4887
TEXAS INDUSTRIES, INC.
(Exact name of Registrant as specified in its charter)
| Delaware | 75-0832210 | |
| (State or other jurisdiction of incorporation or organization) |
(I.R.S. Employer Identification No.) |
1341 West Mockingbird Lane, Suite 700W, Dallas, Texas 75247-6913
(Address of principal executive offices, including zip code)
Registrant’s telephone number, including area code: (972) 647-6700
Securities registered pursuant to Section 12(b) of the Act:
| Title of each class | Name of each exchange on which registered | |
| Common Stock, $1.00 Par Value | New York Stock Exchange |
Securities registered pursuant to Section 12(g) of the Act: NONE
Indicate by check mark if the Registrant is a well-known seasoned issuer, as defined in Rule 405 of the Securities Act. Yes x No ¨
Indicate by check mark if the Registrant is not required to file reports pursuant to Section 13 or 15(d) of the Act. Yes ¨ No x
Indicate by check mark whether the Registrant (1) has filed all reports required to be filed by Section 13 or 15(d) of the Securities Exchange Act of 1934 during the preceding 12 months (or for such shorter period that the Registrant was required to file such reports), and (2) has been subject to such filing requirements for the past 90 days. Yes x No ¨
Indicate by check mark whether the Registrant has submitted electronically and posted on its corporate Web site, if any, every Interactive Data File required to be submitted and posted pursuant to Rule 405 of Regulation S-T (§ 232.405 of this chapter) during the preceding 12 months (or for such shorter period that the registrant was required to submit and post such files). Yes ¨ No ¨
Indicate by check mark if disclosure of delinquent filers pursuant to Item 405 of Regulation S-K is not contained herein, and will not be contained, to the best of Registrant’s knowledge, in definitive proxy or information statements incorporated by reference in Part III of this Form 10-K or any amendment to this Form 10-K. x
Indicate by check mark whether the Registrant is a large accelerated filer, an accelerated filer, a non-accelerated filer or a smaller reporting company. See the definitions of “large accelerated filer,” “accelerated filer,” and “smaller reporting company” in Rule 12b-2 of the Exchange Act. (Check one):
Large Accelerated Filer x Accelerated Filer ¨ Non-accelerated Filer ¨ Smaller Reporting Company ¨
Indicate by check mark whether the Registrant is a shell company (as defined in Rule 12b-2 of the Act). Yes ¨ No x
The aggregate market value of the Registrant’s common stock held by non-affiliates of the Registrant was approximately $946,392,222, computed by reference to the price at which the common stock was last sold on the New York Stock Exchange as of November 30, 2009, the last business day of the Registrant’s most recently completed second fiscal quarter.
The number of shares outstanding of the Registrant’s common stock as of June 30, 2010 was 27,796,393.
DOCUMENTS INCORPORATED BY REFERENCE: Portions of the Registrant’s definitive proxy statement for the annual meeting of shareholders to be held October 13, 2010, are incorporated by reference into Part III.
Table of Contents
| Page | ||||
| PART I | ||||
| Item 1. |
1 | |||
| Item 1A. |
10 | |||
| Item 1B. |
16 | |||
| Item 2. |
16 | |||
| Item 3. |
19 | |||
| Item 4. |
19 | |||
| PART II | ||||
| Item 5. |
Market for the Registrant’s Common Equity, Related Stockholder Matters and Issuer Purchases of Equity Securities | 20 | ||
| Item 6. |
22 | |||
| Item 7. |
Management’s Discussion and Analysis of Financial Condition and Results of Operations |
23 | ||
| Item 7A. |
37 | |||
| Item 8. |
37 | |||
| Item 9. |
Changes in and Disagreements with Accountants on Accounting and Financial Disclosure |
69 | ||
| Item 9A. |
69 | |||
| Item 9B. |
71 | |||
| PART III | ||||
| Item 10. |
Directors, Executive Officers and Corporate Governance | 72 | ||
| Item 11. |
72 | |||
| Item 12. |
Security Ownership of Certain Beneficial Owners and Management and Related Stockholder Matters | 72 | ||
| Item 13. |
Certain Relationships and Related Transactions, and Director Independence |
72 | ||
| Item 14. |
72 | |||
| PART IV | ||||
| Item 15. |
73 | |||
| 77 | ||||
Table of Contents
PART I
| ITEM 1. | BUSINESS |
When used in the Report, the terms “Company,” “we,” “us,” or “our” mean Texas Industries, Inc. and subsidiaries unless the context indicates otherwise.
General
We are a leading supplier of heavy construction materials in the United States through our three business segments: cement, aggregates and consumer products. Our cement segment produces gray portland cement and specialty cements. Our cement production and distribution facilities are concentrated primarily in Texas and California, the two largest cement markets in the United States. Based on production capacity, we are the largest producer of cement in Texas with a 24% share in that state. Our aggregates segment produces natural aggregates, including sand, gravel and crushed limestone, and specialty lightweight aggregates. Our consumer products segment produces primarily ready-mix concrete and, to a lesser extent, packaged products. We are a major supplier of natural aggregates and ready-mix concrete in Texas and northern Louisiana and, to a lesser extent, in Oklahoma and Arkansas. For financial information about our business segments, see Note 10 of Notes to Consolidated Financial Statements in Item 8 of this Report.
As of May 31, 2010, we had 85 manufacturing facilities in six states. In fiscal year 2010, our net sales were $621.1 million, of which 40.2% was generated by our cement segment, 23.0% by our aggregates segment, and 36.8% by our consumer products segment. During the year, we shipped 3.2 million tons of finished cement, 11.4 million tons of natural aggregates, 1.0 million cubic yards of lightweight aggregates and 2.1 million cubic yards of ready-mix concrete.
Our revenue is derived from multiple end-use markets, including the public works, residential, commercial, retail, industrial and institutional construction sectors, as well as the oil and gas industry. Our diversified mix of products provides access to this broad range of end-user markets and helps mitigate the exposure to cyclical downturns in any one product or end-user market. No one customer accounted for more than 10% of our total net sales in fiscal year 2010.
During fiscal year 2009 and into fiscal year 2010, the economy in all of our operating regions was in recession. Declining home values, investor losses on mortgage related securities, tight credit conditions, state budget shortfalls, rising unemployment and other factors led to declines in all segments of construction activity in our markets. These conditions impacted all segments of our business. In response, we took numerous steps to manage our production to more closely match market demand, reduce costs and manage our cash position. We significantly reduced both capital and non-capital spending, including delaying construction of the expansion of our Hunter, Texas cement plant. We idled plants where necessary and reduced our employee and contract labor force by approximately 30%. We also significantly reduced overtime pay, implemented a salary freeze for non-union employees and renegotiated a number of supply and service agreements. Our president and chief executive officer voluntarily reduced his salary by 10% and other executive officers similarly reduced their salaries by 5%. We negotiated amendments to our senior secured revolving credit facility to reduce the risk that the market decline would cause our operating results to fall below levels required by financial covenants.
During fiscal year 2010, the national economy began to pull out of the recession, but construction activity has remained at low levels. As a consequence, we have continued with the steps that we began taking in fiscal year 2009 in response to the recession. These steps and others are indicative of our intense focus on cost reduction, management of our cash position and management of production levels, which we believe had a significant positive impact on our operating results in the last two fiscal years.
In October 2007 we commenced construction on a project to expand our Hunter, Texas cement plant. We plan to expand the Hunter plant by approximately 1.4 million tons of advanced dry process annual cement production capacity. The 900,000 tons of existing production will remain in operation. When completed, the Hunter plant will be a modern, low cost facility, similar to our Midlothian and Oro Grande dry process facilities, and we will be well positioned to cost-effectively supply the southern and central Texas market. In May 2009 we
1
Table of Contents
temporarily halted construction on the project because we believed that economic and market conditions made it unlikely that current cement demand levels in Texas would permit the new kiln to operate profitably if the project was completed as originally scheduled. We expect to resume construction by November 2010. We have not entered into a new construction contract to complete the construction, so no schedule for completion has yet been determined. As of May 31, 2010, we had incurred $293.9 million, excluding capitalized interest of $16.3 million, related to the project, of which $289.4 million had been paid. Until we determine the period over which the construction will occur, we cannot accurately estimate the cost of completing the project.
We expect our capital expenditures in fiscal year 2011 to be approximately $15 million to $25 million, excluding those related to the construction of the Hunter cement plant expansion.
Our Competitive Strengths and Strategies
We believe the following competitive strengths and strategies are key to our ability to grow and compete successfully:
Leading Market Positions. We strive to be a major supplier in markets that have attractive characteristics, such as large market size, above average long-term projected population growth, strong economic activity and a year-round building season. Based on production capacity, we are the largest producer of cement in Texas (with a 24% share of total production capacity), and the second largest producer of cement in southern California. We believe we are also the largest supplier of expanded shale and clay specialty aggregate products west of the Mississippi River, the second largest supplier of stone, sand and gravel natural aggregate products in North Texas, one of the largest suppliers of ready-mix concrete in North Texas and one of the largest suppliers of sand and gravel aggregate products and ready-mix concrete in northern Louisiana. We believe our leadership in these markets enhances our competitive position.
Low Cost Supplier. We strive to be a low cost supplier in our markets. We believe we have some of the lowest operating costs in the cement and aggregate industries. We focus on optimizing the use of our equipment, enhancing our productivity and exploring new technologies to further improve our unit cost of production at each of our facilities. Our low operating costs are primarily a result of our efficient plant designs, high productivity rate and innovative manufacturing processes.
Strategic Locations and Markets. The strategic locations of our facilities near our customer base and sources of raw materials allow us to access the largest cement consuming markets in the United States. Our cement manufacturing facilities are located in Texas and California, the two largest U.S. cement markets. During calendar year 2009, Texas and California accounted for approximately 10.8 million and 7.4 million tons, respectively, of cement consumption or approximately 14% and 10%, respectively, of total U.S. cement consumption. California and Texas have also been the largest beneficiaries of federal transportation funding during the last several years. Funds distributed under multi-year federal highway legislation historically have comprised a majority of California and Texas’ public works spending.
Diversified Product Mix and Broad Range of End-User Markets. Our revenue streams are derived from multiple end-user markets, including the public works, residential, commercial, retail, industrial and institutional construction sectors, as well as the oil and gas industry. Accordingly, we have a broad and diverse customer base. Our diversified mix of products provides access to this broad range of end-user markets and helps mitigate the exposure to cyclical downturns in any one product or end-user market. No one customer accounted for more than 10% of our net sales in fiscal year 2010.
Long-Standing Customer Relationships. We have established a solid base of long-standing customer relationships. For example, our ten largest customers during fiscal year 2010 have done business with us for an average of over 15 years. We strive to achieve customer loyalty by delivering superior customer service and maintaining an experienced sales force with in-depth market knowledge. We believe our long-standing relationships and our leading market positions help to provide additional stability to our operating performance and make us a preferred supplier.
Experienced Management Team. Mel Brekhus, our chief executive officer, Ken Allen, our chief financial officer, and the vice presidents responsible for the cement, aggregates and consumer products segments have an
2
Table of Contents
average of 28 years of industry experience. Our management team has led our company through several industry cycles and has demonstrated the ability to successfully complete and operate major expansion projects.
Products
Cement Segment
Our cement segment produces gray portland cement as its principal product. We also produce specialty cements such as masonry and oil well cements.
Our cement production facilities are located at three sites in Texas and California: Midlothian, Texas, south of Dallas/ Fort Worth, the largest cement plant in Texas; Hunter, Texas, south of Austin; and Oro Grande, California, near Los Angeles. The limestone reserves used as the primary raw material are located on property we own adjacent to each of the plants. Additional information about our cement production facilities and associated limestone reserves is provided in Item 2, Properties, of this Report.
Due to the recession that gripped our nation throughout fiscal year 2009 and into fiscal year 2010, we modified our operating processes in order to reduce costs and more closely match cement production to demand in our markets. We temporarily idle each of our dry process gray cement kilns from time to time in order to control inventories. We idled the four wet kilns at our Midlothian, Texas plant which are less efficient than the large dry kiln at that plant. Finally, the white cement production facility and the gray cement grinding facility at our Crestmore plant near Riverside, California remain idled. We continue to operate a cement terminal and packaging facility at the Crestmore plant.
In July 2010 we decided to surrender the operating permits for the four wet kilns at our Midlothian plant, which had a rated annual production capacity of 600,000 tons of clinker. We plan to replace the production capacity of the wet kilns by increasing the much more efficient capacity of the large modern dry process kiln at the plant. Closing the four wet kilns is expected to allow us to obtain the permits needed to enhance and optimize the dry kiln. We do not know how long it will take to obtain the permits needed to make the enhancements to the dry kiln. As a consequence, we cannot yet estimate the cost or schedule for the enhancements. We do not expect that the closure of the wet kilns will have a material impact on our consolidated financial statements.
The primary fuel source for all of our facilities is coal. At our Hunter, Texas plant we also use alternative fuels. Our facilities also consume large amounts of electricity. We believe that adequate supplies of both fuel and electricity are available.
We produced approximately 3.2 million tons of finished cement during fiscal year 2010. We shipped approximately 3.2 million tons during the year, of which 2.7 million tons were shipped to outside trade customers. At May 31, 2010, our backlog was approximately 509,000 tons, approximately 194,000 tons of which we do not expect to fill in fiscal year 2011. At May 31, 2009, our backlog was approximately 682,000 tons.
We market our cement products in the southwestern United States. Our principal marketing area includes the states of Texas, Louisiana, Oklahoma, California, Nevada and Arizona. Sales offices are maintained throughout the marketing area and sales are made primarily to numerous customers in the construction industry, no one of which would be considered material to our business.
Cement is distributed by rail or truck to 8 distribution terminals located throughout the marketing area.
Aggregates Segment
Natural Aggregates. Our natural aggregate operations produce sand, gravel and crushed limestone. These operations are conducted from facilities primarily serving the Dallas/Fort Worth, Austin and Houston areas in Texas; the southern Oklahoma area; and the Alexandria and Monroe areas in Louisiana. Additional information about our natural aggregates production facilities and associated reserves is provided in Item 2, Properties, of this Report.
We produced approximately 11.8 million tons of natural aggregate during fiscal year 2010. We shipped approximately 11.4 million tons of natural aggregate during fiscal year 2010, of which 9.1 million tons were
3
Table of Contents
shipped to outside trade customers. At May 31, 2010, our backlog was approximately 1.5 million tons, the majority of which will be shipped in 2011. At May 31, 2009, our backlog was approximately 1.8 million tons.
The cost of transportation limits the marketing of aggregate products to the areas within approximately 100 miles of the plant sites. Sales are therefore related to the level of construction activity near the plants. The products are marketed by our sales organization located in the areas served by the plants and are sold to numerous customers, no one of which would be considered material to our business.
Products are distributed to trade customers principally by contract or customer-owned haulers or through rail distribution facilities. To enhance our efficiency and competitiveness, particularly in sales of crushed stone, we strive to establish direct rail links between production facilities and our key markets, reducing the cost of transportation. We have installed rail loops at our crushed stone plants and rail terminals close to major markets, which allow rapid loading and unloading of product. In local areas surrounding our rail terminals, we believe we have a transportation cost advantage over some competing suppliers who rely to a greater extent on truck transportation.
Lightweight Aggregates. Expanded shale and clay, a specialty lightweight aggregate product, is manufactured from facilities serving the Dallas/Fort Worth, Austin and Houston areas in Texas; the Oakland/San Francisco and Los Angeles areas in California; and the Denver area in Colorado. Additional information about our lightweight aggregates production facilities and associated reserves is provided in Item 2, Properties, of this Report.
We produced approximately 1.1 million cubic yards of lightweight aggregate during fiscal year 2010. We shipped approximately 1.0 million cubic yards of lightweight aggregate during fiscal year 2010, of which approximately 0.9 million cubic yards were shipped to outside trade customers. At May 31, 2010, our backlog was approximately 125,000 cubic yards, the majority of which will be shipped in 2011.
The cost of transportation limits the marketing of most lightweight aggregate products to the areas within approximately 200 miles of the plant or terminal sites. Sales are therefore related to the level of construction activity near the plants and terminals. The products are marketed by our sales organization located in the areas served by the plants and terminals and are sold to numerous customers, no one of which would be considered material to our business. Products are distributed to trade customers principally by contract or customer-owned haulers and, to a lesser extent, by rail. Certain specialty products we have developed from our expanded shale and clay, such as DiamondPro® baseball infield conditioner, have developed a geographically dispersed customer base and are shipped to a significant portion of the continental United States.
Consumer Products Segment
Ready-mix Concrete. Our ready-mix concrete operations are situated in three areas in Texas (Dallas/Fort Worth/Denton, Houston and east Texas), in north and central Louisiana, and at one location in southern Arkansas. Additional information about our ready-mix concrete production facilities and associated equipment is provided in Item 2, Properties, of this Report.
We shipped approximately 2.1 million cubic yards of ready-mix concrete during fiscal year 2010. At May 31, 2010, our backlog was approximately 1.4 million cubic yards, the majority of which will be shipped in 2011. At May 31, 2009, our backlog was approximately 1.5 million cubic yards.
We manufacture and supply a substantial amount of the cement and aggregates used by the ready-mix plants. The remainder is purchased from outside suppliers. Ready-mix concrete is sold to various contractors in the construction industry, no one of which would be considered material to our business. We believe that we are a significant participant in the Texas and Louisiana concrete products markets in which we operate. The principal methods of competition in concrete products markets are quality and service at competitive prices. Because we are a producer of cement and aggregates, the primary components of concrete, we believe that our customers view us as a reliable supplier of quality concrete, particularly during times that the supply of raw material is tight.
Other Products. We manufacture and market packaged concrete mix, mortar, sand and related products from plant or distribution sites we own in the Dallas/Fort Worth, Austin and Houston areas in Texas. We also
4
Table of Contents
market our Maximizer packaged concrete mix in southern California. The products are marketed by our sales force in each of these locations, and are delivered primarily by contract haulers direct to retailers. Since the cost of delivery is significant to the overall cost of most of these products, the market area is generally restricted to within approximately 100 miles of the plant locations. These products are sold by the retailers to contractors, distributors and property owners.
Competition
All of the product segments and markets in which we participate are highly competitive. These markets are also generally regional because transportation costs are high relative to the value of the product. Ready-mix concrete also competes in relatively small geographic areas due to delivery time constraints associated with pre-mixed concrete after the addition of water. As a result, in our aggregates and consumer products markets, there is little competition from imported products. However, our cement segment does compete with imported cement because of the higher value of the product.
The nature of our competition varies among our product lines due to the widely differing amounts of capital necessary to build production facilities. Construction of cement production facilities is highly capital intensive and requires long lead times to complete engineering design, obtain regulatory permits, acquire equipment and construct a plant. Most domestic producers of cement are owned by large foreign companies operating in multiple international markets. Many of these producers maintain the capability to import cement from foreign production facilities.
Sand and gravel production by dredging, or crushed stone production from stone quarries, is moderately capital intensive. Our major competitors in the aggregates markets are typically large vertically integrated companies.
Ready-mix concrete production requires relatively small amounts of capital to build a concrete batching plant and acquire delivery trucks. As a result, in each local market we face competition from numerous small producers as well as large vertically integrated companies with facilities in many markets.
Due to the lack of product differentiation, competition for all of our products is based largely on price and, to a lesser extent, quality of product and service. As a result, the prices that we charge our customers are not likely to be materially different from the prices charged by other producers in the same markets. Accordingly, our profitability is generally dependent on the level of demand for cement, aggregates and concrete products in the local markets we serve, and on our ability to control operating costs.
Employees
At May 31, 2010, we had approximately 1,930 employees. Approximately 108 employees at our Oro Grande, California cement plant are covered by a collective bargaining agreement that expires in June 2012. Approximately 13 employees at our Crestmore plant near Riverside, California are covered by a collective bargaining agreement that expires in 2013.
We believe our relationship with our employees is good.
Legal Proceedings
In March 2008, the South Coast Air Quality Management District, or SCAQMD, informed one of our subsidiaries, Riverside Cement Company (Riverside), that it believed that operations at the Crestmore cement plant in Riverside, California caused the level of hexavalent chromium, or chrome 6, in the air in the vicinity of the plant to be elevated above ambient air levels. Chrome 6 has been identified by the State of California as a carcinogen. Riverside immediately began taking steps, in addition to its normal dust control procedures, to reduce dust from plant operations and eliminate the use of open clinker stockpiles. In February 2008, the SCAQMD placed an air monitoring station at the downwind property line closest to the open clinker stockpiles. In the SCAQMD’s first public report of the results of its monitoring, over the period of February 12 to April 9, 2008, the average level of chrome 6 was 2.43 nanograms per cubic meter, or ng/m³. Since that time, the average
5
Table of Contents
level has decreased. The average levels of chrome 6 reported by the SCAQMD at all of the air monitoring stations in areas around the plant, including the station at the property line, are below 1.0 ng/m³ over the entire period of time it has operated the stations. The SCAQMD compared the level of exposure at the air monitor on our property line with the following employee exposure standards established by regulatory agencies:
| Occupational Safety and Health Administration |
5,000 ng/m³ | |
| National Institute for Occupational Safety and Health |
1,000 ng/m³ | |
| California Environmental Protection Agency |
200 ng/m³ |
In public meetings conducted by the SCAQMD, it stated that the risk of long term exposure immediately adjacent to the plant is similar to living close to a busy freeway or rail yard, and it estimated an increased risk of 250 to 500 cancers per one million people, assuming continuous exposure for 70 years. Riverside has not determined how this particular risk number was calculated by SCAQMD. However, the Riverside Press Enterprise reported in a May 30, 2008 story that “John Morgan, a public health and epidemiology professor at Loma Linda University, said he looked at cancer cases reported from 1996 to 2005 in the … census [tract] nearest the [plant] and found no excess cases. That includes lung cancer, which is associated with exposure to hexavalent chromium.”
In late April 2008, a lawsuit was filed in Riverside County Superior Court of the State of California styled Virginia Shellman, et al. v. Riverside Cement Holdings Company, et al. The lawsuit against three of our subsidiaries purports to be a class action complaint for medical monitoring for a putative class defined as individuals who were allegedly exposed to chrome 6 emissions from our Crestmore cement plant. The complaint alleges an increased risk of future illness due to the exposure to chrome 6 and other toxic chemicals. The suit requests, among other things, establishment and funding of a medical testing and monitoring program for the class until their exposure to chrome 6 is no longer a threat to their health, as well as punitive and exemplary damages.
Since the Shellman lawsuit was filed, five additional putative class action lawsuits have been filed in the same court. The putative class in each of these cases is the same as or a subset of the putative class in the Shellman case, and the allegations and requests for relief are similar to those in the Shellman case. As a consequence, the court has stayed four of these lawsuits until the Shellman lawsuit is finally determined.
Since August 2008, 25 additional lawsuits have been filed in the same court against us or one or more of our subsidiaries containing allegations of personal injury and wrongful death by over 2,700 individual plaintiffs who were allegedly exposed to chrome 6 and other toxic or harmful substances in the air, water and soil caused by emissions from the Crestmore plant. The plaintiffs allege causes of action that vary somewhat from suit to suit, but typically include, among other things, negligence, intentional and negligent infliction of emotional distress, trespass, public and private nuisance, strict liability, willful misconduct, fraudulent concealment, wrongful death and loss of consortium. The plaintiffs generally request, among other things, general and punitive damages, medical expenses, loss of earnings, property damages and medical monitoring costs. Some of the suits include additional defendants, such as the owner of another cement plant located approximately four miles from the Crestmore plant.
Since January 2009, seven lawsuits have been filed against us or one or more of our subsidiaries in the same court involving similar allegations, causes of action and requests for relief, but with respect to our Oro Grande, California cement plant instead of the Crestmore plant. The suits involve approximately 300 individual plaintiffs. Prior to the filing of the lawsuits, the air quality management district in whose jurisdiction the plant lies conducted air sampling from locations around the plant. None of the samples contained chrome 6 levels above 1.0 ng/m³.
At the date of this report, none of the plaintiffs in these cases has alleged any specific amount or range of damages. We will vigorously defend all of these suits but we cannot predict what liability, if any, could arise from them. We also cannot predict whether any other suits may be filed against us alleging damages due to injuries to persons or property caused by claimed exposure to chrome 6.
We are defendants in other lawsuits that arose in the ordinary course of business. In our judgment the ultimate liability, if any, from such legal proceedings will not have a material effect on our consolidated financial position or results of operations.
6
Table of Contents
Environmental
We are subject to various federal, state and local environmental, health and safety laws and regulations. These laws and regulations govern, among other things:
| • | air emissions, |
| • | wastewater discharges, |
| • | generation, use, handling, storage, transportation and disposal of hazardous substances and wastes, |
| • | investigation and remediation of contamination existing at current and former properties, and at third-party waste disposal sites, |
| • | exposure limits of our employees and others to dust, silica and other substances, and |
| • | safety standards for operating our quarries and plant equipment. |
Sources of air emissions and wastewater discharges at our facilities are regulated by a combination of permit limitations and emission standards of national and statewide application. The laws and regulations requiring permits and establishing emission standards have tended to become increasingly stringent over time. In addition, permits are subject to modification, renewal and revocation requirements, which allow issuing agencies to tighten the permit limitations.
One area in which changes in laws and regulations are likely to have a significant impact on us and our industry is climate change. Many scientists believe that carbon dioxide, a product of combustion of fuel in cement kilns and a natural byproduct of the cement manufacturing process, is a greenhouse gas that contributes to global warming.
In 2006, California adopted the “California Global Warming Solutions Act of 2006”, which requires the California Air Resources Board (CARB) to achieve a statewide reduction in emissions of greenhouse gases in California to 1990 levels by 2020. A significant portion of our cement production capacity is in California, but CARB has not yet adopted regulations fully defining how the new law may apply to us.
The U.S. Supreme Court decision in Massachusetts v. EPA relating to regulation of carbon dioxide emissions from automobiles has spurred the EPA to issue in December 2009 a finding that greenhouse gases contribute to air pollution that may endanger public health or welfare. Numerous parties, including certain states, industry associations and other private parties, have filed court petitions challenging the validity of the finding. We cannot predict the ultimate outcome of those challenges.
The endangerment finding does not include any proposed regulations. Although both the Obama administration and the Administrator of the EPA have indicated their preference for comprehensive federal legislation to address this issue, in May 2010 the EPA issued a final rule under which it will begin implementing greenhouse gas emission limitations in permits for stationary sources such as cement plants in January 2011. The rule would require us to incorporate best available control technology in a new cement plant or an existing plant that we propose to modify in a manner that would increase carbon dioxide emissions by more than 75,000 tons per year. No technologies or methods of operation for reducing or capturing carbon dioxide have been proven successful in large scale applications other than improvements in fuel efficiency. In addition, the rule appears to require us to incorporate greenhouse gas related provisions in the operating permits for our cement plants. We do not currently know what the EPA will require as best available control technology or what conditions it will require to be added to operating permits. Therefore, at this time, it is impossible to predict what the cost or effect of the rule will be on our business.
Although no federal laws currently limit greenhouse gas emissions, in June 2009, the U.S. House of Representatives passed the American Clean Energy and Security Act of 2009, a bill introduced by Rep. Henry Waxman and Rep. Edward Markey and popularly known as the Waxman Markey bill. The bill would regulate greenhouse gas emissions by instituting a cap-and-trade-system in which an economy-wide cap on U.S. greenhouse gas emissions would be established starting in 2012 with a cap 3% below the baseline 2005 level.
7
Table of Contents
The cap would steeply decline over time until in 2050 it reaches 83% below the baseline level. Emissions allowances, which are rights to emit greenhouse gases, would be both allocated for free and auctioned. Trade vulnerable industries would be allocated for free up to 15% of the total allowances in 2014. This percentage would be gradually reduced over time until it is phased out in 2025. We expect that the cement industry would qualify as a trade vulnerable industry under the bill.
In May 2010, Senators John Kerry and Joe Lieberman released a proposed Senate bill that contains cap-and-trade provisions with emission caps similar to the Waxman Markey bill. It also contains similar provisions for trade vulnerable industries. The prospects for passage of the Kerry Lieberman bill by the U.S. Senate are uncertain. As a consequence, at this time it is impossible to predict whether any federal climate change legislation will be enacted, and if enacted, what the cost or effect on our business will be.
Various states have banded together in three initiatives to develop regional strategies to address climate change. Six western states, including California, and four Canadian provinces have formed the Western Climate Initiative, six Midwestern states and one Canadian province are members of the Midwestern Greenhouse Gas Reduction Accord, and ten northeastern and mid-Atlantic states have joined the Regional Greenhouse Gas Initiative. These initiatives call for establishing goals for reduction of greenhouse gas emissions in the member states and designing market-based mechanisms to help achieve these reduction goals. Other states may join these initiatives.
In April 2009, the EPA issued a proposed rule amendment that would dramatically reduce the permitted levels of emissions of mercury, total hydrocarbons, particulate matter and hydrochloric acid from cement plants. The amendments, if adopted as proposed, would take full effect no earlier than 2013, and would likely be subject to court challenges. Our cement plants do not currently meet all of the proposed standards, and we believe that it is unlikely that any cement plant in the U.S. meets all of these standards. We can not predict whether the amendments will be adopted as proposed. If they are, since it is unknown how effective currently existing control technology will be in meeting the proposed standards, we cannot predict the cost or effect on our business of the proposed amendments.
Many of the raw materials, products and by-products associated with the operation of any industrial facility, including those for the production of cement or concrete products, contain chemical elements or compounds that can be designated as hazardous. Some examples are the metals present in cement kiln dust, or CKD, and the ignitability of the waste derived fuels that we use as a primary or supplementary fuel substitute for nonrenewable fuels such as coal and natural gas to fire certain of our cement kilns. Currently, CKD is exempt from hazardous waste management standards under the Resource Conservation and Recovery Act, or RCRA, if certain tests are satisfied. We have demonstrated that the CKD we generate satisfies these tests, but there can be no guarantee that the tests will not be changed in the future.
Like others in our business, we expend substantial amounts to comply with these environmental, health and safety laws, regulations and permit limitations, including amounts for pollution control equipment required to monitor and regulate air emissions and wastewater discharges. Since many of these requirements are subjective and therefore not quantifiable, or are presently not determinable, or are likely to be affected by future legislation or rule making by government agencies, it is not possible to accurately predict the aggregate future costs of compliance and their affect on our future results of operations or financial condition.
For additional information about the environmental, health and safety risks inherent in our operations, see “Legal Proceedings” above and Item 1A, Risk Factors, in this Report.
Intellectual Property
We own trademarks such as TXI® and Maximizer® and certain process patents. While we believe that none of our active trademarks or patents are essential to our business as a whole, brand recognition can play a role in sales of specialty products and packaged products. We believe our packaged product brands are perceived as premium quality in the local markets we serve, such as the Maximizer® brand of patented lightweight concrete in Texas and southern California.
8
Table of Contents
Real Estate
We own significant amounts of land, acquired for our business purposes such as mining limestone, sand, gravel and clay. When mining is completed or land becomes surplus for other reasons, we sell it for development or, in some instances, develop it ourselves. We are involved in the sale of land in a high quality industrial and multi-use park that we developed in the metropolitan area of Dallas/Fort Worth, Texas.
Research and Development
We incurred no research and development cost for any of the past three fiscal years. All of our innovations are developed through the production process.
Executive Officers of the Registrant
Following is information as of June 30, 2010 about our executive officers:
Mel G. Brekhus, age 61, has been President and Chief Executive Officer since June 1, 2004. From 1998 through May 2004, he was Executive Vice President, Cement, Aggregate and Concrete. He joined us in 1989 as Vice President, Cement Production and within a short period became Vice President, Cement. His career in the cement industry began in 1972 when he joined Lehigh Portland Cement Company (1972-1983). While at Lehigh, he held various positions throughout the United States as Chemist, Production Manager and Plant Manager. He was Technical Manager and Plant Manager for Missouri Portland Cement Company (1984-1989) in their Midwest operations. His professional affiliations include the Portland Cement Association, where he is Past Chairman and presently a Director.
Kenneth R. Allen, age 52, has been Vice President, Finance and Chief Financial Officer since August 1, 2008. Mr. Allen joined us in 1985 and became Treasurer in 1991 and Vice President and Treasurer in 1999. Mr. Allen is a director of The Empire District Electric Company.
Frederick G. Anderson, age 59, has been Vice President, General Counsel and Secretary since November 2004. He has been a practicing attorney for 29 years. From March 2003 until November 2004 he engaged in the private practice of law, including as of counsel to Davis Munck P.C., a Dallas, Texas based law firm. From August 1997 through March 2003, he was Senior Vice President, General Counsel and Secretary of WebLink Wireless, Inc., a wireless telecommunications company. Mr. Anderson maintains membership in the State Bar of Texas and Dallas Bar Association. He is Chairman of the Legal Counsels Committee of the Portland Cement Association.
Barry M. Bone, age 52, has been Vice President-Real Estate since 1995 and President of Brookhollow Corporation, our real estate subsidiary, since 1991. He joined us in 1982 and has served in various real estate positions since then.
Michael P. Collar, age 57, has been Vice President-Human Resources of the Company since June 1, 2010. From June 2002 until June 2010, he was Director, Human Resources of the Company. Prior to joining the Company in 2002, Mr. Collar had over 20 years of human resources experience with companies such as Ford Motor Company and Atlantic Richfield Company. Mr. Collar is a member of the Executive Committee of the Cement Employers Association.
J. Lynn Davis, age 61, has been Vice President-Cement since August 2002. From 1996 until August 2002 he was Vice President-Cement Production. He joined us in 1971 and has served in various positions in our cement, aggregates and concrete operations since then.
Stephen D. Mayfield, age 50, has been Vice President-Aggregates since September 2000. He joined us in 1984 and has held various positions in our cement, aggregates and concrete operations since then. He is a director and a member of the executive committee of the National Stone, Sand and Gravel Association and a director of the Texas Aggregate and Concrete Association.
Ronnie Pruitt, age 39, has been Vice President-Cement & Aggregates Marketing and Sales since August 2002. He joined us in 1995 and has held various positions in our cement, aggregates and concrete operations since then.
9
Table of Contents
James B. Rogers, age 43, has been Vice President-Consumer Products since August 2002. He joined us in 1996 and has held various positions in our cement, aggregates and concrete operations since then. He is a director of the National Ready-Mix Concrete Association and the Texas Aggregates and Concrete Association. Mr. Rogers is the son of Robert D. Rogers, our Chairman of the Board.
Executive officers are elected annually by the board of directors and serve at the pleasure of the board.
Available Information
Our company was incorporated in Delaware in 1951. Our internet address is www.txi.com. We file annual, quarterly and current reports, proxy statements and other information with the Securities and Exchange Commission, or SEC. You may read and copy any reports, statements and other information filed by us at the SEC’s Public Reference Room at 100 F Street, N.E., Washington, D.C. 20549. Please call (800) SEC-0330 for further information on the Public Reference Room. The SEC maintains an internet web site that contains our reports, proxy and information statements and other information about us that is filed electronically with the SEC, which may be accessed at http://www.sec.gov.
We make available, free of charge, through our investor relations website at http://investorrelations.txi.com/our reports on Forms 10-K, 10-Q and 8-K, and amendments to those reports, as soon as reasonably practicable after they are filed with the SEC. Our annual report to shareholders and Code of Ethics for the CEO and Senior Financial Officers are also available at this website. We intend to disclose amendments and waivers of such Code of Ethics on this website.
| ITEM 1A. | RISK FACTORS |
In addition to the risks discussed elsewhere in this annual report, you should carefully consider the risks described below before making an investment decision. If any such risks materialize, our business and results of operations could be materially and adversely affected, which in turn could materially and adversely affect our cash flow and financial condition. In such an instance, the trading price of our securities could decline, and you might lose all or part of your investment.
Our business is sensitive to economic cycles within the public, residential and non-residential construction segments as well as seasonality and inclement weather conditions. Some of our competitors may cope better than we can with adverse economic and market conditions.
The cement, aggregate and concrete markets are generally regional because transportation costs are high relative to the value of the product. Demand for our products is derived primarily from public (infrastructure), residential and non-residential construction activity in our specific regional markets. Construction activity in each of these markets is cyclical and is influenced by prevailing economic conditions in these markets. During fiscal year 2009 and into fiscal year 2010, the economy in all of our operating regions was in recession. Declining home values, investor losses on mortgage related securities, tight credit conditions, state budget shortfalls and significant levels of unemployment have led to declines in all segments of construction activity in our markets. Demand for our products has fallen, and our results of operations have been negatively impacted. If these conditions continue or worsen, we could incur significant losses, which could materially and adversely affect our business and financial condition.
Economic factors may fluctuate more widely in regional markets than in the United States as a whole. As a result, even though we sell in more than one region, our operating results are subject to significant fluctuation from region to region. Because we sell most of our cement in Texas and southern California, and because cement sales have historically contributed more to our profitability than any other product line, a significant further decline in cement demand or prices in Texas or southern California could materially and negatively impact our profitability.
Our product prices are subject to material changes in response to relatively minor fluctuations in supply and demand, which can be affected by economic and other market conditions beyond our control. In the last year we
10
Table of Contents
have experienced both volume and price declines in the Texas and California cement markets and the Texas aggregates and ready mix markets. We may face more price or volume declines in the future. Due to the high fixed cost nature of our business, our operating results may be significantly affected by relatively small changes in production volumes. Moreover, our industry is characterized by low backlogs, which means that our results of operations may be promptly affected by short term economic fluctuations.
Our customers are engaged in a substantial amount of construction in which government funding is a component and, as a result, can be subject to government budget constraints and political shifts resulting in funding reallocation. In February 2009, President Obama signed into law an economic stimulus plan, which provides billions of dollars in new funding for infrastructure construction projects. We expect these funds will have a positive impact on demand for our products for a period of time, but the length and depth of that demand cannot be predicted. The current multi-year federal highway funding legislation expired on September 30, 2009, but was extended by an authorization bill through the end of calendar year 2010. Funding provided by this legislation has historically comprised a majority of California and Texas’ public works spending. Failure to pass new long-term federal highway funding legislation upon expiration of the current extension period, or a significant decrease in public works spending in either state for any reason, including the recent budget crisis in the state of California, could have a material and adverse effect on our operating results.
The regional nature of our business also makes us vulnerable to changes in regional weather and its impact on the regional construction industry. Our operating profit is generally lower in our fiscal quarter ending on the last day of February than it is in our other three fiscal quarters because of the impact of winter weather on construction activity. Although southern California and Texas are regions characterized by longer periods of favorable weather, extended periods of inclement weather can reduce construction activity at any time of the year.
Some of our competitors are larger and have greater financial resources or less financial leverage than we do. As a result, these competitors may cope better than we can with adverse economic or market conditions and any downward pressure on prices or volumes.
The availability and pricing of energy could materially and adversely affect our results of operations.
We are dependent upon energy sources, including electricity and fossil fuels. Prices for energy are subject to market forces largely beyond our control. We have generally not entered into any long-term contracts to satisfy our fuel and electricity needs, with the exception of coal which we purchase from specific mines pursuant to contracts that expire on December 31, 2011 and May 31, 2014. Despite our long-term coal contracts, we expect our coal supplies could be interrupted in the event of rail service disruptions or mine failures. If we are unable to meet our requirements for fuel and electricity, we may experience interruptions in our production.
Price increases that we are unable to pass through in the form of price increases for our products, or disruption of the uninterrupted supply of fuel and electricity, could adversely affect our results of operations.
The enforcement of environmental, health and safety laws and regulations may result in liability for civil or criminal fines or penalties or curtailment or suspension of our operations. We may become liable for environmental injury to persons or property. We may incur substantial expenditures to comply with changes in such laws and regulations.
We are subject to various federal, state and local environmental, health and safety laws, regulations and permits as described more fully under the caption “Environmental Matters” in Item 1, Business. The U.S. Environmental Protection Agency, the Occupational Safety and Health Administration, the Mining Safety and Health Administration and various state agencies are charged with enforcing these laws, regulations and permits. These agencies can impose substantial civil and criminal fines and penalties, as well as curtail or suspend our operations, for violations and non-compliance. Moreover, private parties may bring civil actions against us for injuries to persons and damages to property allegedly caused by our operations. We intend to comply with these laws, regulations and permits. However, from time to time we receive claims from federal and state regulatory agencies asserting that we are or may be in violation of certain of these laws, regulations and permits, or from private parties alleging that our operations have injured them or their property. See “Legal Proceedings” in
11
Table of Contents
Item 1, Business, for a description of certain claims. If violations of law, injury to persons, damage to property or contamination of the environment has been or is caused by the conduct of our business or hazardous substances or wastes used, generated or disposed of by us, we may be liable for such violations, injuries and damages and be required to pay the cost of investigation and remediation of such contamination. The amount of such liability could materially and adversely affect our results of operations.
Changes in federal or state laws, regulations or permits or discovery of currently unknown conditions could increase our cost of compliance, require additional capital expenditures, reduce or shut down production or hinder our ability to expand or build new production facilities. See “Environmental” in Item 1, Business, for a description of certain existing or proposed laws and regulations affecting our industry. Although we cannot yet predict the final nature of these laws and regulations, each one could have a significant impact on the cement manufacturing industry and a material adverse effect on our results of operations.
Our construction project to expand our Hunter, Texas cement plant has been delayed. We expect to resume construction by November 2010. The capital expenditures that we have already incurred for construction of the Hunter plant, and future capital expenditures for expansion of our business may not strengthen our competitive position.
In order to strengthen our competitive position, in recent years we have made significant capital expenditures to expand our facilities. In October 2007 we commenced construction on a project to expand our Hunter, Texas cement plant by approximately 1.4 million tons of advanced dry process annual cement production capacity. In May 2009 we temporarily halted construction on the project because we believed that economic and market conditions made it unlikely that current cement demand levels in Texas would permit the new kiln to operate profitably if the project was completed as originally scheduled. We expect to resume construction by November 2010. We have not entered into a new construction contract to complete the construction, so no schedule for completion has yet been determined. As of May 31, 2010, we had incurred $293.9 million, excluding capitalized interest of $16.3 million related to the project, of which $289.4 million had been expended. Until we determine the period over which the construction will occur, we cannot accurately estimate the cost of completing the project.
Our Hunter plant expansion, when construction resumes, and future expansion projects could experience construction delays or cost overruns for many reasons, including inclement weather, unavailability of materials or equipment, unanticipated site conditions and unanticipated problems in obtaining required permits during construction, startup and commissioning. We currently have all material environmental authorizations necessary for the Hunter plant expansion. We cannot assure you that market conditions will be favorable, that the actual cost of the plant expansion will not exceed our cost projections or that additional financing, if required, will be available on acceptable terms. We cannot assure you that our expanded Hunter plant or any new plant, when completed, will operate in accordance with its design specifications. If it does not, we could incur additional costs or production delays while problems are corrected. As we do not have control over the cost or the outcome of these factors, we cannot assure you that any planned expansion will occur on schedule or within budget.
As a result of these or other unanticipated factors, the Hunter project or any other future expansionary capital expenditures may not improve our competitive position and business prospects as anticipated. If certain of the events described above occur, it could materially and adversely affect our results of operations.
Future litigation could affect our profitability.
The nature of our business exposes us to various litigation matters. These matters may include claims by private parties or governmental entities seeking compensatory and punitive damages, environmental clean up costs, penalties, injunctive relief or other types of recovery. The types of claims to which we may be subject include:
| • | Product liability claims that our products have caused buildings, roadways, oil wells, or other structures to fail or not comply with specifications. |
12
Table of Contents
| • | Contract claims that we have breached a legally enforceable agreement in a manner that has damaged one or more other parties. |
| • | Employment claims that we violated anti-discrimination, wage and hour, fair labor standards or other employment related laws, regulations or contracts. |
| • | Claims by regulatory or administrative bodies that we have violated specified laws, regulations or permit conditions. |
| • | Environmental claims that we have exposed individuals to or contaminated property with toxic or hazardous substances. |
| • | Other tort claims that our actions or omissions caused damage to persons or property. |
See “Legal Proceedings” in Item 1, Business, for a description of certain legal proceedings. We contest these matters vigorously and make insurance claims where appropriate. However, litigation is inherently costly and unpredictable, making it difficult to accurately estimate the outcome of existing or future litigation. Although we make accruals as we believe warranted and in accordance with generally accepted accounting principles, the amounts that we accrue could vary significantly from any amounts we actually pay due to the inherent uncertainties and shortcomings in the estimation process. Future litigation costs, settlements or judgments could materially and adversely affect our results of operations.
Unexpected equipment failures, catastrophic events and scheduled maintenance may lead to production curtailments or shutdowns.
Due to the high fixed cost nature of our business, interruptions in our production capabilities may cause our productivity and results of operations to decline significantly during the affected period. Our manufacturing processes are dependent upon critical pieces of equipment, such as our kilns and finishing mills. This equipment, on occasion, may be out of service as a result of unanticipated failures or damage during accidents. In addition to equipment failures, our facilities are also subject to the risk of catastrophic loss due to unanticipated events such as fires, explosions or violent weather conditions. In addition, our operations in California are susceptible to damage from earthquakes, for which we maintain only a limited amount of earthquake insurance and, therefore, we are not fully insured against earthquake risk. We also have one to two-week scheduled outages at least once a year to refurbish our cement production facilities. Any significant interruption in production capability may require us to make significant capital expenditures to remedy problems or damage as well as cause us to lose revenue due to lost production time, which could have a material adverse effect on our results of operations.
We rely heavily on third-party truck and rail transportation, which is subject to delays and rate fluctuations.
We rely heavily on third-party truck and rail transportation to ship our products to customers and coal, our primary fuel, to our plants. Rail and trucking operations are subject to capacity constraints, high fuel costs and various hazards, including extreme weather conditions and slowdowns due to labor strikes and other work stoppages. If there are material changes in the availability or cost of rail or trucking services, we may not be able to arrange alternative and timely means to ship our products or coal at a reasonable cost, which could lead to interruptions or slowdowns in our businesses or increases in our costs, either of which could materially and adversely affect our results of operations.
Implementation of our growth strategy has certain risks.
As part of our growth strategy, we may expand existing facilities, build additional plants, acquire other reserves or operations, enter into joint ventures or form strategic alliances that we believe will expand or complement our existing business. If any of these transactions occur, they will likely involve some or all of the following risks:
| • | the potential disruption of our ongoing business; |
| • | the diversion of resources and management’s time and attention; |
13
Table of Contents
| • | the inability of management to maintain uniform standards, controls, procedures and policies; |
| • | the difficulty of managing the operations of a larger company; |
| • | the risk of becoming involved in labor, commercial or regulatory disputes or litigation related to the new enterprise; |
| • | the risk of contractual or operational liability to joint venture participants or to third parties as a result of our participation; |
| • | the difficulty of competing for acquisitions and other growth opportunities with companies having greater financial resources than we have; and |
| • | the difficulty of integrating the acquired operations and personnel into our existing business. |
Pursuing our growth strategy may be required for us to remain competitive, but we may not be able to complete any such transactions or obtain financing, if necessary, for such transactions on favorable terms or at all. Future transactions may not improve the competitive position and business prospects as anticipated, and could reduce sales or profit margins, and, therefore, our results of operations if they are not successful.
Our business could suffer if cement imports from other countries significantly increase or are sold in the U.S. in violation of U.S. fair trade laws.
The cement industry has in the past obtained antidumping orders imposing duties on imports of cement and clinker from other countries that violated U.S. fair trade laws. Currently, an antidumping order against cement and clinker from Japan is expected to remain in effect until at least 2011. As has always been the case, cement operators with import facilities can purchase cement from other countries, such as those in Latin America and Asia, which could compete with domestic producers. In addition, if currently proposed environmental regulations increase the costs of domestic producers compared to foreign producers that are not subject to similar regulations, imported cement could achieve a significant cost advantage over domestically produced cement. An influx of cement or clinker products from countries not subject to antidumping orders, or sales of imported cement or clinker in violation of U.S. fair trade laws, could materially and adversely affect our results of operations.
Additionally, fluctuations in the value of the dollar could affect our business. A strong U.S. dollar makes imported cement less expensive, resulting in more imports into the United States by foreign competitors, while a weak U.S. dollar has the opposite effect. If the dollar strengthens appreciably against other world currencies, it will encourage additional imports of cement, which could negatively affect our results of operations.
We have a substantial amount of debt which will require a significant amount of cash to service and which could have important consequences for us. Our ability to generate cash from operations or borrowing depends on many factors beyond our control.
Our debt could have important consequences for us. For example, it could:
| • | make it more difficult for us to satisfy our other obligations; |
| • | increase our vulnerability to general adverse economic and industry conditions; |
| • | require us to dedicate a substantial portion of our cash flow from operations to service our debt, thereby reducing the availability of our cash flow to fund working capital, capital expenditures, investments and other general corporate purposes; |
| • | limit our flexibility in planning for, or reacting to, changes in our business, the cement, aggregate and concrete industry or the markets in which we operate; |
| • | place us at a competitive disadvantage compared to our competitors that have less debt or debt with less restrictive terms; and |
| • | limit, among other things, our ability to borrow additional funds, even when necessary to maintain adequate liquidity. |
14
Table of Contents
Our ability to make payments on, or repay or refinance, our debt and to fund planned capital expenditures will depend largely upon the availability of financing and our future operating performance. In fiscal year 2010 we had a net loss of $38.9 million. Our future operating performance, to a certain extent, is subject to general economic, financial, competitive, legislative, regulatory and other factors that are beyond our control. In addition, our ability to borrow funds in the future if needed to make payments on our debt will depend on our satisfaction of the covenants in our senior secured credit facility and our other current and future debt agreements. We cannot assure you that our business will generate sufficient cash flow from operations or that future borrowings will be available to us under our senior secured credit facility or from other sources in an amount sufficient to pay our debt or to fund our other liquidity needs. If we are unable to generate sufficient cash flow to meet our debt service requirements, we may have to renegotiate the terms of our debt or obtain additional financing. We cannot assure you that we will be able to refinance any of our debt or obtain additional financing on commercially reasonable terms or at all. If we were unable to meet our debt service requirements or obtain new financing under these circumstances, we would have to consider other options, such as:
| • | sales of certain assets to meet our debt service obligations; |
| • | sales of equity; and |
| • | negotiations with our lenders to restructure the applicable debt. |
Our debt agreements may restrict, or market or business conditions may limit, our ability to do any of these things.
The financing agreements governing our debt contain various covenants that limit our discretion in the operation of our business and could lead to acceleration of debt and foreclosure on collateral.
Our financing agreements impose operating and financial restrictions on our activities. Restrictions contained in these financing agreements also limit or prohibit our ability and certain of our subsidiaries ability to, among other things:
| • | pay dividends to our stockholders; |
| • | make certain investments and capital expenditures; |
| • | incur additional debt or sell preferred stock; |
| • | create liens; |
| • | restrict dividend payments or other payments from subsidiaries to us; |
| • | engage in consolidations and mergers or sell or transfer assets; |
| • | engage in transactions with our affiliates; and |
| • | sell stock in our subsidiaries. |
We are not required to maintain any financial ratios or covenants unless an event of default occurs or the unused portion of our borrowing base under our senior secured credit facility is less than $40 million, in which case we must comply with a fixed charge coverage ratio of 1.1 to 1.0.
At May 31, 2010 we were in compliance with our loan covenants. Various risks and events beyond our control could in the future affect our ability to comply with these covenants and maintain financial tests and ratios. If we cannot comply with the fixed charge coverage ratio in our senior secured credit facility and the unused portion of our borrowing base falls below $40 million, we may not be able to borrow under this facility. At May 31, 2010, our fixed charge coverage ratio was .7 to 1.0. Given this ratio, we may use only $117.7 million of the borrowing base as of such date. Because $28.5 million of the borrowing base was used to support letters of credit, the maximum amount we could borrow as of May 31, 2010 was $89.2 million. In addition, failure to comply with any of the covenants in our existing or future financing agreements could result in a default under those agreements and under other agreements containing cross-default provisions. A default would permit
15
Table of Contents
lenders to accelerate the maturity of the debt under these agreements, terminate any commitments they made to supply us with further funds and foreclose on collateral. Under these circumstances, we might not have sufficient funds or other resources to satisfy all of our obligations. In addition, the limitations imposed by our financing agreements on our ability to incur additional debt and to take other actions might significantly impair our ability to obtain other financing. We cannot assure you that we will be able to obtain waivers or amendments of our financing agreements, if necessary, on acceptable terms or at all.
| ITEM 1B. | UNRESOLVED STAFF COMMENTS |
None.
| ITEM 2. | PROPERTIES |
General
As of May 31, 2010, we:
| • | manufactured cement at three facilities in Texas and California using limestone from adjacent quarries, |
| • | produced natural aggregates (sand, gravel and crushed limestone) from 12 quarries in Texas, Louisiana and Oklahoma, |
| • | manufactured lightweight aggregates from three facilities in Texas, Colorado and California using shale and clay from adjacent quarries, and |
| • | manufactured ready mix concrete at 59 plants in Texas, Louisiana and Arkansas. |
In addition, we operated 8 cement distribution terminals, 5 aggregate distribution terminals, and 5 cement and aggregate packaging facilities.
16
Table of Contents
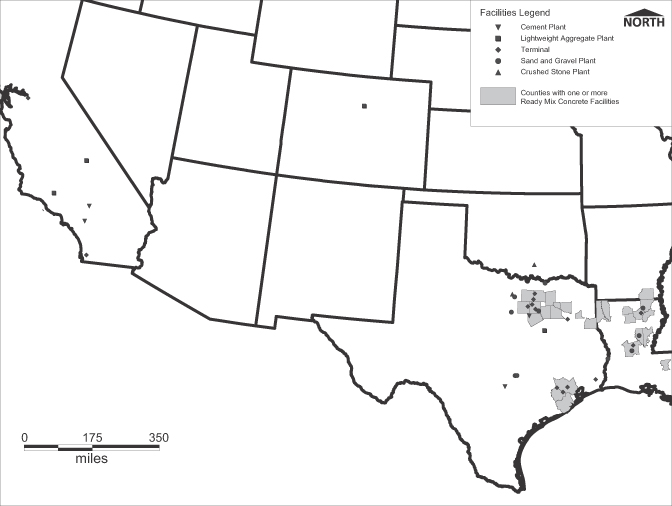
The following map shows the locations of our cement, aggregate and ready mix manufacturing and distribution facilities at May 31, 2010, all of which are in the U. S.
Reserves are estimated by our geological and mine services group based upon drilling and testing data sufficient to elevate reserves to probable status. The estimates of reserves are of recoverable stone, sand, gravel, shale and clay of suitable quality for economic extraction, recognizing reasonable economic and operating constraints as to excavation, maximum depth of overburden, permit or zoning restrictions and lease terms on any leased property. Aggregate resource holdings are generally not reported as reserves until a recovery plan has been developed. The average estimated minimum reserves in years shown below are based on normalized annual rates of production. Certain individual locations may be subject to more limited reserves.
17
Table of Contents
Cement
Our cement production facilities are located at three sites in Texas and California: Midlothian, Texas, south of Dallas/ Fort Worth, the largest cement plant in Texas; Hunter, Texas, south of Austin; and Oro Grande, California, near Los Angeles. The following table summarizes certain information about our cement manufacturing facilities at May 31, 2010:
| Plant |
Rated Annual Productive Capacity— Tons of Clinker |
Manufacturing Process |
Service Date |
Internally Estimated Minimum Reserves—Years | ||||
| Midlothian, TX |
2,200,000 | Dry | 2001 | 46 | ||||
| Hunter, TX |
850,000 | Dry | 1979 | 100 | ||||
| Oro Grande, CA |
2,200,000 | Dry | 2008 | 48 | ||||
| Total |
5,250,000 | |||||||
Reserves identified with the facilities shown above are contained on approximately 5,579 acres of land we own. At May 31, 2010, we estimate our total proven and probable limestone reserves to be approximately 908 million tons.
Our cement manufacturing facilities include kilns, crushers, pre-heaters/calciners, coolers, finish mills and other equipment used to process limestone and other raw materials into cement, as well as equipment used to extract and transport the limestone from the adjacent quarries. The cement manufacturing facilities are served by rail and truck. We believe the facilities are generally in good condition and suitable for the purposes for which they are used.
Natural Aggregates
Our natural aggregate operations are conducted from facilities primarily serving the Dallas/Fort Worth, Austin and Houston areas in Texas; the southern Oklahoma area; and the Alexandria and Monroe areas in Louisiana. The following table summarizes certain information about our natural aggregate production facilities at May 31, 2010.
| Type of Facility and General Location |
Number of Plants |
Rated Annual Productive Capacity |
Internally Estimated Minimum Reserves—Years | |||
| Crushed Limestone: |
||||||
| North Central Texas |
1 | 9.0 million tons | 30 | |||
| Oklahoma |
1 | 6.0 million tons | 90 | |||
| Sand & Gravel: |
||||||
| North Central Texas |
4 | 4.3 million tons | 10 | |||
| Central Texas |
2 | 3.5 million tons | 6 | |||
| Louisiana |
4 | 1.5 million tons | 10 |
Reserves identified with the facilities shown above and additional reserves available to support future plant sites are contained on approximately 25,000 acres of land, of which we own approximately 17,475 acres and lease the remainder. We typically acquire an option on a property prior to lease or purchase. At May 31, 2010, we estimate our total proven and probable aggregate reserves to be approximately 810 million tons, of which 78% are owned and 22% are leased.
Our crushed limestone production facilities include primary and secondary crushers used to process limestone extracted from quarries we own adjacent to each plant, as well as equipment to produce manufactured sand at each site. The stone facilities are served by rail and truck. Our sand and gravel production facilities include excavating or dredging equipment used to extract sand and gravel from open pits owned or leased near each plant. The sand and gravel facilities are served by truck. We use mining contractors to provide blasting services at our stone quarries and to extract limestone to fulfill certain sales contracts for larger specialty products such as rip rap used in erosion control. We believe the facilities are generally in good condition and suitable for the purposes for which they are used.
18
Table of Contents
Lightweight Aggregates
Our lightweight aggregate manufacturing facilities serve primarily the Dallas/Fort Worth, Austin and Houston areas in Texas; the Oakland/San Francisco and Los Angeles areas in California; and the Denver area in Colorado. The following table summarizes certain information about our lightweight aggregate production facilities at May 31, 2010.
| Location |
Number of Plants |
Rated Annual Productive Capacity |
Internally Estimated Minimum Reserves—Years | |||
| North Central Texas |
1 | .8 million cu. yds. | 100 | |||
| California |
1 | .3 million cu. yds. | 100 | |||
| Colorado |
1 | .5 million cu. yds. | 25 |
Reserves identified with the facilities shown above are contained on approximately 4,062 acres of land, of which we own approximately 1,291 acres and lease the remainder. At May 31, 2010, we estimate our total proven and probable shale and clay reserves to be approximately 147 million tons.
Our lightweight aggregate manufacturing facilities include kilns, crushers, coolers and other equipment used to process shale and clay into lightweight aggregate, as well as equipment used to extract and transport the shale and clay from the adjacent quarries. The lightweight aggregate facilities are served by rail and truck. We believe the facilities are generally in good condition and suitable for the purposes for which they are used.
Ready-Mix Concrete
Our ready-mix concrete operations are situated in three areas in Texas (Dallas/Fort Worth/Denton, Houston and east Texas), in north and central Louisiana, and at one location in southern Arkansas. The following table summarizes certain information about our ready mix concrete facilities at May 31, 2010.
| Location |
Number of Plants | Number of Trucks | ||
| Texas |
45 | 371 | ||
| Louisiana |
13 | 75 | ||
| Arkansas |
1 | 2 |
We hold approximately 436 acres for our current and future ready-mix concrete operations, of which we own approximately 352 acres and lease approximately 84 additional acres.
Our ready mix concrete manufacturing facilities include batch plants and other equipment in addition to the delivery trucks listed above. The ready mix concrete facilities are served by truck. We believe the facilities are generally in good condition and suitable for the purposes for which they are used.
Other
See “Intellectual Property” and “Real Estate” in Item 1, Business.
| ITEM 3. | LEGAL PROCEEDINGS |
The information required by this item is included in “Legal Proceedings” in Item 1 of this Report and in Note 9 to Consolidated Financial Statements in Item 8 of this Report.
| ITEM 4. | [REMOVED AND RESERVED] |
19
Table of Contents
PART II
| ITEM 5. | MARKET FOR THE REGISTRANT’S COMMON EQUITY AND RELATED STOCKHOLDER MATTERS AND ISSUER PURCHASES OF EQUITY SECURITIES |
Market and Shareholder Information
Shares of our common stock, $1 par value, are traded on the New York Stock Exchange (ticker symbol TXI). There were 1,644 shareholder accounts of record as of June 30, 2010. Restrictions on the payment of dividends are described in Note 3 of Notes to Consolidated Financial Statements in Item 8 of this Report. The following table sets forth for each of the fiscal quarterly periods ending with the month indicated the high and low prices per share for our common stock as reported on the New York Stock Exchange and cash dividends declared per share.
| Per share |
Aug. | Nov. | Feb. | May | ||||||||
| 2010 |
||||||||||||
| Stock prices: High |
$ | 48.70 | $ | 46.30 | $ | 39.67 | $ | 40.86 | ||||
|
Low |
27.36 | 32.08 | 31.43 | 32.42 | ||||||||
| Cash dividends declared |
.075 | .075 | .075 | .075 | ||||||||
| 2009 |
||||||||||||
| Stock prices: High |
$ | 74.75 | $ | 55.57 | $ | 37.82 | $ | 37.95 | ||||
|
Low |
44.22 | 19.33 | 15.74 | 12.58 | ||||||||
| Cash dividends declared |
.075 | .075 | .075 | .075 | ||||||||
Equity Compensation Plan Information
The following table summarizes our equity compensation plans as of May 31, 2010.
| Plan Category |
Number of securities to be issued upon exercise of outstanding options, warrants and rights |
Weighted
average exercise price of outstanding options, warrants and rights |
Number of securities remaining available for future issuance under equity compensation plans (excluding securities reflected in column (a)) | ||||
| (a) | (b) | (c) | |||||
| Equity compensation plans approved by security holders(1)(2) |
1,768,015 | $ | 38.47 | 939,815 | |||
| Equity compensation plans not approved by security holders(3) |
2,070 | — | — | ||||
| Total |
1,770,085 | $ | 38.42 | 939,815 | |||
| (1) | Our equity compensation plans are described in Note 6 of Notes to Consolidated Financial Statements in Item 8 of this Report. |
| (2) | Includes 3,499 shares of Common Stock issuable under stock awards assumed under our 2004 Omnibus Equity Compensation Plan in which certain employees were granted stock awards at no cost. Subject to continued employment, the 6 remaining participants are to be issued shares in five-year installments until age 60. The original program was discontinued in 1990. |
| (3) | Represents common stock issuable under deferred compensation agreements in which directors elected to defer their fees. Compensation so deferred is denominated in shares of our common stock determined by reference to the average market price as specified by the terms of the individual agreement. Dividends are credited to the account denominated in shares of our common stock at a value equal to the fair market value of the stock on the date of payment of such dividend. |
20
Table of Contents
All shares of common stock issuable under our compensation plans are subject to adjustment to reflect any increase or decrease in the number of shares outstanding as a result of stock splits, combination of shares, recapitalizations, mergers or consolidations.
Recent Sales of Unregistered Securities
We did not sell unregistered equity securities during fiscal year 2010 that were not reported in a Quarterly Report on Form 10-Q or a Current Report on Form 8-K.
Issuer Purchases of Equity Securities
We are restricted by our loan covenants from purchasing our Common Stock on the open market. However, in connection with the forfeiture of unvested restricted stock, shares are surrendered to the Company at no cost. The following table presents information with respect to such transactions which occurred during the three-month period ended May 31, 2010.
| Period |
(a) Total Number of Shares Purchased |
(b) Average Price Paid per Share |
(c) Total Number of Shares Purchased as Part of Publicly Announced Plans or Programs |
(d) Maximum Number of Shares that May Yet Be Purchased Under the Plans or Programs | |||||
| March 1, 2010 – March 31, 2010 |
1,000 | $ | — | — | — | ||||
| April 1, 2010 – April 30, 2010 |
— | — | — | — | |||||
| May 1, 2010 – May 31, 2010 |
— | — | — | — | |||||
| Total |
1,000 | $ | — | — | — | ||||
21
Table of Contents
| ITEM 6. | SELECTED FINANCIAL DATA |
TEXAS INDUSTRIES, INC. AND SUBSIDIARIES
| 2010 | 2009 | 2008 | 2007 | 2006 | ||||||||||||||||
| $ In thousands except per share | ||||||||||||||||||||
| FOR THE YEAR |
||||||||||||||||||||
| Net sales |
$ | 621,064 | $ | 839,202 | $ | 1,028,854 | $ | 996,250 | $ | 943,922 | ||||||||||
| Earnings |
||||||||||||||||||||
| Income (loss) from continuing operations |
(38,853 | ) | (17,647 | ) | 87,631 | 104,711 | (589 | ) | ||||||||||||
| Income (loss) from discontinued operations |
— | — | — | — | 8,691 | |||||||||||||||
| Net income (loss) |
(38,853 | ) | (17,647 | ) | 87,631 | 104,711 | 8,102 | |||||||||||||
| Capital expenditures |
13,659 | 288,544 | 312,525 | 317,658 | 110,245 | |||||||||||||||
| PER SHARE INFORMATION |
||||||||||||||||||||
| Earnings per share (diluted) |
||||||||||||||||||||
| Income (loss) from continuing operations |
$ | (1.40 | ) | $ | (.64 | ) | $ | 3.14 | $ | 3.94 | $ | (.03 | ) | |||||||
| Income (loss) from discontinued operations |
— | — | — | — | .38 | |||||||||||||||
| Net income (loss) |
(1.40 | ) | (.64 | ) | 3.14 | 3.94 | .35 | |||||||||||||
| Cash dividends |
.30 | .30 | .30 | .30 | .30 | |||||||||||||||
| Book value |
27.39 | 28.98 | 30.02 | 26.98 | 19.96 | |||||||||||||||
| YEAR END POSITION |
||||||||||||||||||||
| Total assets |
$ | 1,531,747 | $ | 1,572,544 | $ | 1,531,534 | $ | 1,275,370 | $ | 1,087,531 | ||||||||||
| Net working capital |
245,072 | 219,143 | 186,897 | 142,296 | 292,393 | |||||||||||||||
| Long-term debt |
538,620 | 541,540 | 401,880 | 274,416 | 251,505 | |||||||||||||||
| Convertible subordinated debentures |
— | — | — | — | 159,725 | |||||||||||||||
| Shareholders’ equity |
761,248 | 803,145 | 825,367 | 737,119 | 477,897 | |||||||||||||||
| Return on average common equity |
(4.9 | )% | (2.1 | )% | 11.2 | % | 18.5 | % | 1.8 | % | ||||||||||
| OTHER INFORMATION |
||||||||||||||||||||
| Diluted average common shares outstanding (in 000’s) |
27,744 | 27,614 | 27,860 | 27,684 | 23,071 | |||||||||||||||
| Common stock prices |
||||||||||||||||||||
| High |
$ | 48.70 | $ | 74.75 | $ | 93.80 | $ | 88.22 | $ | 74.75 | ||||||||||
| Low |
27.36 | 12.58 | 45.38 | 43.39 | 45.62 | |||||||||||||||
On July 29, 2005, we completed the spin-off of our steel segment in the form of a pro-rata, tax-free dividend to our shareholders of one share of Chaparral Steel Company common stock for each share of our common stock that was owned on July 20, 2005. The results of operations of the steel segment prior to the spin-off are presented as discontinued operations. Stock prices prior to July 29, 2005, the last trading day before the spin-off of Chaparral Steel Company, have not been adjusted for the value of the distribution.
22
Table of Contents
| ITEM 7. | MANAGEMENT’S DISCUSSION AND ANALYSIS OF FINANCIAL CONDITION AND RESULTS OF OPERATIONS |
GENERAL
We are a leading supplier of heavy construction materials in the United States through our three business segments: cement, aggregates and consumer products. Our principal products are gray portland cement, produced and sold through our cement segment; stone, sand and gravel, produced and sold through our aggregates segment; and ready-mix concrete, produced and sold through our consumer products segment. Other products include expanded shale and clay lightweight aggregates, produced and sold through our aggregates segment, and packaged concrete mix, mortar, sand and related products, produced and sold through our consumer products segment.
Our facilities are concentrated primarily in Texas, Louisiana and California. We own long-term reserves of the primary raw materials for the production of cement and aggregates. Our business requires large amounts of capital investment, energy, labor and maintenance.
During fiscal year 2009 and into fiscal year 2010, the economy in all of our operating regions was in recession. Declining home values, investor losses on mortgage related securities, tight credit conditions, state budget shortfalls, rising unemployment and other factors led to declines in all segments of construction activity in our markets. These conditions impacted all segments of our business. In response, we took numerous steps to manage our production to more closely match market demand, reduce costs and manage our cash position. We significantly reduced both capital and non-capital spending, including delaying construction of the expansion of our Hunter, Texas cement plant. We idled plants where necessary and reduced our employee and contract labor force by approximately 30%. We also significantly reduced overtime pay, implemented a salary freeze for non-union employees and renegotiated a number of supply and service agreements. Our president and chief executive officer voluntarily reduced his salary by 10% and other executive officers similarly reduced their salaries by 5%. We negotiated amendments to our senior secured revolving credit facility to reduce the risk that the market decline would cause our operating results to fall below levels required by financial covenants.
During fiscal year 2010, the national economy began to pull out of the recession, but construction activity has remained at low levels. As a consequence, we have continued with the steps that we began taking in fiscal year 2009 in response to the recession. These steps and others are indicative of our intense focus on cost reduction, management of our cash position and management of production levels, which we believe had a significant positive impact on our operating results in the last two fiscal years.
In October 2007 we commenced construction on a project to expand our Hunter, Texas cement plant. We plan to expand the Hunter plant by approximately 1.4 million tons of advanced dry process annual cement production capacity. The 900,000 tons of existing production will remain in operation. When completed, the Hunter plant will be a modern, low cost facility, similar to our Midlothian and Oro Grande dry process facilities, and we will be well positioned to cost-effectively supply the southern and central Texas market. In May 2009 we temporarily halted construction on the project because we believed that economic and market conditions made it unlikely that current cement demand levels in Texas would permit the new kiln to operate profitably if the project was completed as originally scheduled. We expect to resume construction by November 2010. We have not entered into a new construction contract to complete the construction, so no schedule for completion has yet been determined. As of May 31, 2010, we had incurred $293.9 million, excluding capitalized interest of $16.3 million, related to the project, of which $289.4 million had been paid. Until we determine the period over which the construction will occur, we cannot accurately estimate the cost of completing the project.
23
Table of Contents
RESULTS OF OPERATIONS
Management uses segment operating profit as its principal measure to assess performance and to allocate resources. Business segment operating profit consists of net sales less operating costs and expenses that are directly attributable to the segment. Corporate includes non-operating income and expenses related to administrative, financial, legal, human resources environmental and real estate activities. Certain amounts in the prior period financial statements have been reclassified to conform to the current period presentation.
During fiscal year 2010, the economy in both our California and Texas market areas continued to be challenging. In addition, abnormally inclement weather further impacted already depressed construction activity during the six-month and three-month periods ended February 28, 2010 in our Texas and California market areas, respectively. We have continued to manage our production to more closely match market demand, reduce costs and manage our cash position. We believe these steps have had a significant positive impact on our cash flows in the current fiscal year.
Consolidated sales for fiscal year 2010 were $621.1 million, a decrease of $218.1 million from the prior fiscal year. Consolidated cost of products sold was $562.1 million, a decrease of $164.1 million from the prior fiscal year. Consolidated gross profit was $59.0 million, a decrease of $54.1 million from the prior fiscal year. Lower shipments and sales prices reduced consolidated gross profit approximately $92 million. The effect of lower shipments and sales prices was offset in part by lower costs including approximately $14 million lower supplies and maintenance costs related to plant shutdowns for maintenance at our three cement plants, $16 million lower aggregate production costs and $10 million lower ready-mix concrete raw material costs.
Consolidated sales for fiscal year 2009 were $839.2 million, a decrease of $189.7 million from the prior fiscal year. Consolidated cost of products sold was $726.1 million, a decrease of $108.2 million from the prior fiscal year. Consolidated gross profit was $113.1 million, a decrease of $81.5 million from the prior fiscal year. Lower shipments and sales prices reduced consolidated gross profit approximately $52 million. Consolidated gross profit was further reduced by higher cement fixed costs, including approximately $12 million of depreciation at our Oro Grande, California cement plant and by approximately $5 million higher ready-mix concrete raw material costs.
Consolidated selling, general and administrative expense for fiscal year 2010 was $79.4 million, an increase of $7.3 million from the prior fiscal year. Consolidated selling, general and administrative expense for fiscal year 2009 was $72.1 million, a decrease of $24.1 million from the prior fiscal year. Financial-based incentive expense decreased $0.6 million in 2010 and $16.1 million in 2009 from the prior fiscal years. Our stock-based compensation includes awards expected to be settled in cash, the expense for which is based on their fair value at the end of each period until the awards are paid. The impact of changes in our stock price on the fair value of these awards increased expense $8.9 million in 2010 and decreased expense $5.8 million in 2009 from the prior fiscal years. Our financial security plan postretirement benefit obligations are determined using assumptions as of the end of the year. In 2010, it was discovered that our actuarial assumptions for certain participants failed to consider that these participants will receive their defined benefit for a minimum of 15 years or life. Previously, our calculations had incorrectly assumed that the payments to these participants ceased after 15 years. We have recomputed the defined benefit liability for these participants and have accordingly recognized a charge of $4.4 million in 2010 to record the additional liability. Management estimates that $3.4 million of this additional liability relates to years prior to 2010. This $3.4 million would have accumulated over time since the year 2000. The $1.0 million increase related to 2010 was primarily a function of the decreased discount rate in 2010 compared to the discount rate in 2009. Management determined that the amount related to prior years was not material to the financial statements and the entire change has been recognized in selling, general and administrative expense in 2010. Financial security plan postretirement benefit expense excluding this adjustment increased $3.1 million in 2010 and decreased $1.6 million in 2009 from the prior fiscal years. Our focus on reducing controllable costs lowered overall other expenses $8.5 million in 2010 and $0.6 million in 2009 from the prior fiscal years.
Consolidated other income for fiscal year 2010 was $10.7 million, a decrease of $10.5 million from the prior fiscal year. Consolidated other income for fiscal year 2009 was $21.2 million, a decrease of $10.4 million from
24
Table of Contents
the prior fiscal year. Sales of emission credits associated with our Crestmore cement plant in Riverside, California resulted in gains of $3.4 million in 2010, $1.7 million in 2009 and $3.9 million in 2008. Sales of operating assets and real estate associated with our aggregate operations in north Texas and south Louisiana resulted in gains of $5.0 million in 2009 and $15.2 million in 2008. In addition, we have entered into various oil and gas lease agreements on property we own in north Texas. The terms of the agreements include the payment of a lease bonus and royalties on any oil and gas produced. Lease bonus payments received resulted in income of $4.7 million in 2009.
Consolidated operating profit for fiscal years 2010, 2009 and 2008 was $31.5 million, $27.2 million and $169.4 million, respectively. The following is a summary of operating results for our business segments and certain other information related to our principal products and non-operating income and expenses.
Cement Operations
| Year ended May 31, | ||||||||||||
| 2010 | 2009 | 2008 | ||||||||||
| In thousands except per unit | ||||||||||||
| Operating Results |
||||||||||||
| Total cement sales |
$ | 266,180 | $ | 364,386 | $ | 468,673 | ||||||
| Total other sales and delivery fees |
28,333 | 30,934 | 36,079 | |||||||||
| Total segment sales |
294,513 | 395,320 | 504,752 | |||||||||
| Cost of products sold |
270,763 | 342,824 | 391,687 | |||||||||
| Gross profit |
23,750 | 52,496 | 113,065 | |||||||||
| Selling, general and administrative |
(17,528 | ) | (19,343 | ) | (18,307 | ) | ||||||
| Goodwill impairment |
— | (58,395 | ) | — | ||||||||
| Other income |
7,774 | 9,301 | 7,419 | |||||||||
| Operating Profit (Loss) |
$ | 13,996 | $ | (15,941 | ) | $ | 102,177 | |||||
| Cement |
||||||||||||
| Shipments (tons) |
3,226 | 4,035 | 5,035 | |||||||||
| Prices ($/ton) |
$ | 82.51 | $ | 90.31 | $ | 93.07 | ||||||
| Cost of sales ($/ton) |
$ | 76.36 | $ | 78.02 | $ | 70.85 | ||||||
Fiscal Year 2010 Compared to Fiscal Year 2009
Cement operating profit for fiscal year 2010 was $14.0 million. Cement operating loss for fiscal year 2009 was $15.9 million including a goodwill impairment charge of $58.4 million associated with our California cement operation. Cement operating profit for fiscal year 2010 decreased $28.5 million from the prior fiscal year excluding the impairment charge. Lower shipments and sales prices reduced operating profit approximately $47 million. The effect of lower shipments and sales prices was offset in part by lower production costs.
Total segment sales for fiscal year 2010 were $294.5 million compared to $395.3 million for the prior fiscal year. Cement sales decreased $98.2 million as construction activity declined in both our Texas and California market areas. Abnormally inclement weather further impacted already depressed construction activity during the six-month and three-month periods ended February 28, 2010 in our Texas and California market areas, respectively. Our Texas market area accounted for approximately 71% of cement sales in the current fiscal year compared to 70% of cement sales in the prior fiscal year. Cement shipments decreased 21% in our Texas market area and 18% in our California market area from the prior fiscal year. Average prices decreased 7% in our Texas market area and 13% in our California market area from the prior fiscal year.
Cost of products sold for fiscal year 2010 decreased $72.1 million from the prior fiscal year primarily due to lower shipments and our efforts to manage costs. Cement unit costs decreased 2% from the prior fiscal year as the effect of lower shipments was offset by lower raw material, energy and supplies and maintenance costs. Supplies and maintenance costs related to scheduled maintenance at our three cement plants decreased approximately $14 million from the prior fiscal year.
25
Table of Contents
Selling, general and administrative expense for fiscal year 2010 decreased $1.8 million from the prior fiscal year. The decrease was primarily due to lower overall administrative expenses offset in part by a $1.1 million increase in provision for bad debts.
Goodwill resulting from the acquisition of Riverside Cement Company and identified with our California cement operations had a carrying value of $58.4 million at May 31, 2008. Based on an impairment test performed as of May 31, 2009 there was no implied fair value of the reporting unit goodwill, and therefore, an impairment charge of $58.4 million was recognized.
Other income for fiscal year 2010 decreased $1.5 million from the prior fiscal year. Other income includes gains of $3.4 million in fiscal year 2010 and $1.7 million in fiscal year 2009 from sales of emissions credits associated with our Crestmore cement plant in Riverside, California. In addition, other income in fiscal year 2009 includes $2.8 million in lease bonus payments received upon the execution of oil and gas lease agreements on property associated with our north Texas cement operations.
Fiscal Year 2009 Compared to Fiscal Year 2008
Cement operating loss of $15.9 million for fiscal year 2009 includes a goodwill impairment charge of $58.4 million associated with our California cement operation. Cement operating profit for fiscal year 2009, excluding the impairment charge, decreased $59.7 million from the prior fiscal year. Lower shipments and sales prices reduced operating profit approximately $42 million.
Total segment sales for fiscal year 2009 were $395.3 million compared to $504.8 million for the prior fiscal year. Cement sales decreased $104.3 million as construction activity declined in both our Texas and California market areas. Our Texas market area accounted for approximately 70% of cement sales in fiscal year 2009 compared to 67% of cement sales in the prior fiscal year. Cement shipments in both our market areas decreased 20% from the prior fiscal year. Average prices increased 2% in our Texas market area and decreased 14% in our California market area from the prior fiscal year.
Cost of products sold for fiscal year 2009 decreased $48.9 million from the prior fiscal year. The effects of lower shipments and lower variable costs including labor, energy, supply and maintenance costs were offset in part by higher fixed costs, primarily $12 million of depreciation at our Oro Grande, California cement plant. Cement unit costs increased 10% from the prior fiscal year primarily as a result of lower production levels.
Selling, general and administrative expense for fiscal year 2009 increased $1.0 million from the prior fiscal year. The increase was primarily the result of $2.5 million higher legal and other professional expenses offset in part by $1.7 million lower incentive compensation expense.
Goodwill resulting from the acquisition of Riverside Cement Company and identified with our California cement operations had a carrying value of $58.4 million at May 31, 2008. Based on an impairment test performed as of May 31, 2009 there was no implied fair value of the reporting unit goodwill, and therefore, an impairment charge of $58.4 million was recognized.
Other income for fiscal year 2009 increased $1.9 million from the prior fiscal year. Other income in fiscal year 2009 includes $2.8 million in lease bonus payments received upon the execution of oil and gas lease agreements on property associated with our north Texas cement operations. In addition, other income includes gains of $1.7 million in fiscal year 2009 and $3.9 million in fiscal year 2008 from sales of emissions credits associated with our Crestmore cement plant in Riverside, California.
26
Table of Contents
Aggregate Operations
| Year ended May 31, | ||||||||||||
| 2010 | 2009 | 2008 | ||||||||||
| In thousands except per unit | ||||||||||||
| Operating Results |
||||||||||||
| Total stone, sand and gravel sales |
$ | 88,019 | $ | 131,197 | $ | 162,582 | ||||||
| Total other sales and delivery fees |
76,928 | 106,294 | 122,748 | |||||||||
| Total segment sales |
164,947 | 237,491 | 285,330 | |||||||||
| Cost of products sold |
142,963 | 197,583 | 231,503 | |||||||||
| Gross profit |
21,984 | 39,908 | 53,827 | |||||||||
| Selling, general and administrative |
(9,602 | ) | (12,633 | ) | (15,178 | ) | ||||||
| Other income |
1,419 | 6,954 | 16,974 | |||||||||
| Operating Profit |
$ | 13,801 | $ | 34,229 | $ | 55,623 | ||||||
| Stone, sand and gravel |
||||||||||||
| Shipments (tons) |
11,363 | 16,470 | 21,851 | |||||||||
| Prices ($/ton) |
$ | 7.75 | $ | 7.97 | $ | 7.44 | ||||||
| Cost of sales ($/ton) |
$ | 6.91 | $ | 6.68 | $ | 6.13 | ||||||
Fiscal Year 2010 Compared to Fiscal Year 2009
Aggregate operating profit for fiscal year 2010 was $13.8 million, a decrease of $20.4 million from the prior fiscal year. Lower shipments and sales prices reduced operating profit approximately $27 million. The effect of lower shipments and sales prices was offset in part by lower production costs.
Total segment sales for fiscal year 2010 were $164.9 million compared to $237.5 million for the prior fiscal year. Stone, sand and gravel sales decreased $43.2 million on 3% lower average prices and 31% lower shipments.
Cost of products sold for fiscal year 2010 decreased $54.6 million from the prior fiscal year primarily due to lower shipments. Stone, sand and gravel unit costs increased 3% from the prior fiscal year as the effect of lower shipments was offset in part by approximately $16 million lower production costs.
Selling, general and administrative expense for fiscal year 2010 decreased $3.0 million from the prior fiscal year. The decrease was primarily due to lower overall expenses, including wages and benefits, marketing, travel and outside service expenses, as a result of our focus on reducing costs.
Other income for fiscal year 2010 decreased $5.5 million. Other income includes a gain of $5.0 million in fiscal year 2009 from the sale of real estate associated with our aggregate operations in north Texas.
Fiscal Year 2009 Compared to Fiscal Year 2008
Aggregate operating profit for fiscal year 2009 was $34.2 million, a decrease of $21.4 million from the prior fiscal year. Improvements in average prices for our stone, sand and gravel were offset by lower shipments and other income.
Total segment sales for fiscal year 2009 were $237.5 million compared to $285.3 million for the prior fiscal year. Stone, sand and gravel sales decreased $31.4 million on 7% higher average prices and 25% lower shipments.
Cost of products sold for fiscal year 2009 decreased $33.9 million from the prior fiscal year as labor hours were reduced in response to lower shipments and supplies and maintenance costs declined. Stone, sand and gravel unit costs increased 9% from the prior fiscal year primarily as a result of lower production levels.
Selling, general and administrative expense for fiscal year 2009 decreased $2.5 million from the prior fiscal year. The decrease was primarily the result of $1.9 million lower incentive compensation expense.
27
Table of Contents
Other income for fiscal year 2009 decreased $10.0 million. Other income includes gains of $5.0 million in fiscal year 2009 and $15.2 million in fiscal year 2008 from sales of property associated with our aggregate operations in north Texas and south Louisiana.
Consumer Products Operations
| Year ended May 31, | ||||||||||||
| 2010 | 2009 | 2008 | ||||||||||
| In thousands except per unit | ||||||||||||
| Operating Results |
||||||||||||
| Total ready-mix concrete sales |
$ | 175,712 | $ | 247,931 | $ | 310,652 | ||||||
| Total other sales and delivery fees |
55,671 | 61,490 | 58,581 | |||||||||
| Total segment sales |
231,383 | 309,421 | 369,233 | |||||||||
| Cost of products sold |
218,119 | 288,756 | 341,604 | |||||||||
| Gross profit |
13,264 | 20,665 | 27,629 | |||||||||
| Selling, general and administrative |
(10,193 | ) | (13,116 | ) | (19,314 | ) | ||||||
| Other income |
586 | 1,314 | 3,268 | |||||||||
| Operating Profit (Loss) |
$ | 3,657 | $ | 8,863 | $ | 11,583 | ||||||
| Ready-mix concrete |
||||||||||||
| Shipments (cubic yards) |
2,147 | 2,902 | 3,844 | |||||||||
| Prices ($/cubic yard) |
$ | 81.83 | $ | 85.46 | $ | 80.83 | ||||||
| Cost of sales ($/cubic yard) |
$ | 79.82 | $ | 81.41 | $ | 76.36 | ||||||
Fiscal Year 2010 Compared to Fiscal Year 2009
Consumer products operating profit for fiscal year 2010 was $3.7 million, a decrease of $5.2 million from the prior fiscal year. Lower shipments and sales prices reduced operating profit approximately $18 million. The effect of lower shipments and sales prices was offset in part by approximately $10 million lower ready-mix concrete raw material costs.
Total segment sales for fiscal year 2010 were $231.4 million compared to $309.4 million for the prior fiscal year. Ready-mix concrete sales decreased $72.2 million on 4% lower average prices and 26% lower shipments as construction activity continued to decline in our Texas market area. Abnormally inclement weather contributed to the decline in construction activity during the six-month period ended February 28, 2010.
Cost of products sold for fiscal year 2010 decreased $70.6 million from the prior fiscal year. Ready-mix concrete unit costs decreased 2% from the prior fiscal year primarily as a result of lower raw material costs offset in part by the effect of lower shipments on unit costs. Our raw material unit costs decreased approximately 9% from the prior fiscal year.
Selling, general and administrative expense for fiscal year 2010 decreased $2.9 million from the prior fiscal year. The decrease was primarily due to lower overall expenses, including wages and benefits, marketing, travel and outside service expenses, as a result of our focus on reducing costs.
Other income for fiscal year 2010 decreased $0.7 million from the prior fiscal year. Other income in fiscal year 2009 included $0.4 million higher gains from routine sales of surplus operating assets and lease bonus payments of $0.2 million received upon the execution of oil and gas lease agreements on property we own in north Texas.
Fiscal Year 2009 Compared to Fiscal Year 2008
Consumer products operating profit for fiscal year 2009 was $8.9 million, a decrease of $2.7 million from the prior fiscal year. Improvements in ready-mix concrete average prices were offset by lower shipments and higher raw material costs.
28
Table of Contents
Total segment sales for fiscal year 2009 were $309.4 million compared to $369.2 million for the prior fiscal year. Ready-mix concrete sales decreased $62.7 million on 6% higher average prices and 25% lower shipments.
Cost of products sold for fiscal year 2009 decreased $52.8 million from the prior fiscal year as labor hours were reduced in response to lower shipments and supplies and maintenance costs declined. Ready-mix concrete unit costs increased 7% from the prior fiscal year. The increase was primarily as a result of higher raw material costs, as well as higher distribution and transportation costs due to lower shipments. Our raw material unit costs increased approximately 4% from the prior fiscal year.
Selling, general and administrative expense for fiscal year 2009 decreased $6.2 million from the prior fiscal year. The decrease was primarily the result of $4.8 million lower incentive compensation expense and $1.6 million lower insurance expense.
Other income for fiscal year 2009 decreased $2.0 million from the prior fiscal year. Other income in fiscal year 2008 included a gain of $1.4 million from the sale of our license to produce and sell Sakrete branded products outside of the state of Texas.
Corporate
| Year ended May 31, | ||||||||||||
| 2010 | 2009 | 2008 | ||||||||||
| In thousands | ||||||||||||
| Other income |
$ | 887 | $ | 3,622 | $ | 3,902 | ||||||
| Selling, general and administrative |
(42,092 | ) | (27,001 | ) | (43,421 | ) | ||||||
| $ | (41,205 | ) | $ | (23,379 | ) | $ | (39,519 | ) | ||||
Fiscal Year 2010 Compared to Fiscal Year 2009
Corporate other income for fiscal year 2010 decreased $2.7 million from the prior fiscal year. In addition to lower interest income of $1.1 million, other income in the prior fiscal year included lease bonus payments of $1.7 million received upon the execution of oil and gas lease agreements on property we own in north Texas that is not associated with any business segment.
Corporate selling, general and administrative expense for fiscal year 2010 increased $15.1 million from the prior fiscal year. The increase was primarily the result of $9.1 million higher stock-based compensation and $7.5 million higher financial security plan postretirement benefit expense. Our stock-based compensation includes awards expected to be settled in cash, the expense for which is based on their fair value at the end of each period until the awards are paid. The impact of changes in our stock price on the fair value of these awards increased stock-based compensation $8.9 million from the prior fiscal year. The increase in the financial security plan postretirement benefit expense in 2010 was primarily the result of actuarial losses. In 2010, we recognized a charge of $4.4 million which includes an estimated $3.4 million that relates to years prior to 2010. Financial security plan postretirement benefit expense excluding this adjustment increased $3.1 million from the prior fiscal year.
Fiscal Year 2009 Compared to Fiscal Year 2008
Corporate other income for fiscal year 2009 decreased $0.3 million from the prior fiscal year. The decrease was primarily the result of $0.1 million lower interest income, $1.1 million lower real estate income offset in part by $1.0 million higher lease bonus payments received upon the execution of oil and gas lease agreements on property we own in north Texas that is not associated with our operations.
Corporate selling, general and administrative expense for fiscal year 2009 decreased $16.4 million from the prior fiscal year. The decrease was primarily the result of $9.3 million lower incentive compensation expense, $6.7 million lower stock-based compensation and $1.6 million lower financial security plan postretirement benefit expense. Our incentive plans are based on financial performance. Our stock-based compensation includes awards expected to be settled in cash, the expense for which is based on their fair value at the end of each period until the
29
Table of Contents
awards are paid. The impact of changes in our stock price on the fair value of these awards reduced stock-based compensation $5.8 million from the prior fiscal year. The decrease in the financial security plan postretirement benefit expense in 2009 was primarily the result of actuarial losses recognized in the prior fiscal year.
Interest
Interest expense incurred for fiscal year 2010 was $52.2 million, all of which was expensed. Interest expense incurred for fiscal year 2009 was $47.7 million, of which $14.4 million was capitalized in connection with our Hunter, Texas cement plant expansion project and $33.3 million was expensed. Interest expense incurred for fiscal year 2008 was $29.0 million, of which $26.5 million was capitalized in connection with our Hunter, Texas and Oro Grande, California cement plant expansion projects and $2.5 million was expensed.
Interest expense incurred for fiscal year 2010 increased $4.5 million from the prior fiscal year. The increase was primarily the result of higher average outstanding debt offset in part by the effect of the reduction in our capital lease obligation related to power facilities at our Oro Grande, California cement plant. Interest expense incurred for fiscal year 2009 increased $18.7 million from the prior fiscal year primarily as a result of higher average outstanding debt and borrowings on life insurance contracts.
We expect to resume construction of the Hunter, Texas cement plant expansion by November 2010 and to capitalize interest in connection with the project, currently estimated at approximately $14 million, during our fiscal year 2011.
Loss on Debt Retirements
On August 18, 2008, we sold $300 million aggregate principal amount of additional 7.25% senior notes due in 2013 at an offering price of $93.25. The net proceeds were used to repay our $150 million senior term loan and borrowings outstanding under our senior revolving credit facility in the amount of $29.5 million. We recognized a loss on debt retirement of $0.9 million representing a write-off of debt issuance costs associated with the mandatory prepayment of the term loan in fiscal year 2009.
Income Taxes
Our effective tax rate was 37.3% in 2010, 42.0% in 2009 and 31.2% in 2008. The primary reason that the effective tax rate differed from the 35% statutory corporate rate was due to additional percentage depletion that is tax deductible, the effect of qualified domestic production activities, state income taxes and nondeductible stock compensation.
As of May 31, 2010, we have an alternative minimum tax credit carryforward of $29.1 million. The credit, which does not expire, is available for offset against future regular federal income tax. We have a $4.8 million federal net operating loss carryforward. The net federal operating loss may be carried forward twenty years and offset against future federal taxable income. We also have a tax benefit of $2.0 million from state net operating losses that may be carried forward from five to twenty years. Management believes it is more likely than not that the deferred tax assets will be realized.
Under special tax rules (the Section 382 Limitation), cumulative stock ownership changes among material shareholders exceeding fifty percent during a three-year period can potentially limit a company’s future use of net operating losses, tax credits and certain “built-in losses” or deductions (tax attributes). The Section 382 Limitation may be increased by certain “built-in gains” as provided by current IRS guidance. We had an ownership change in 2009. However, the Section 382 Limitation does not impact the recorded value of deferred taxes or realization of our tax attributes.
The American Jobs Creation Act of 2004, among other things, allows a deduction for income from qualified domestic production activities, which will be phased in from 2005 through 2010. No benefit from the deduction was realized in 2008 and 2007 due to the carry back of 2010 and 2009 net operating losses.
In addition to our federal income tax return, we file income tax returns in various state jurisdictions. We are no longer subject to income tax examinations by federal tax authorities for years prior to 2007 and state tax
30
Table of Contents
authorities for years prior to 2007. The examination of our federal income tax returns for 2004 through 2006 was completed in February 2009. The results of this audit did not have a material effect on our financial position or results of operations.
CRITICAL ACCOUNTING POLICIES
The preparation of financial statements and accompanying notes in conformity with generally accepted accounting principles requires management to make estimates and assumptions that affect the amounts reported. Changes in the facts and circumstances could have a significant impact on the resulting financial statements. We believe the following critical accounting policies affect management’s more complex judgments and estimates.
Receivables. Management evaluates the ability to collect accounts receivable based on a combination of factors. A reserve for doubtful accounts is maintained based on the length of time receivables are past due or the status of a customer’s financial condition. If we are aware of a specific customer’s inability to make required payments, specific amounts are added to the reserve.
Environmental Liabilities. We are subject to environmental laws and regulations established by federal, state and local authorities, and make provision for the estimated costs related to compliance when it is probable that a reasonably estimable liability has been incurred.
Legal Contingencies. We are defendants in lawsuits which arose in the normal course of business, and make provision for the estimated loss from any claim or legal proceeding when it is probable that a reasonably estimable liability has been incurred.
Inventories. Inventories are stated at the lower of cost or market. We used the last-in, first out (“LIFO”) method to value finished products, work in process and raw material inventories excluding natural aggregate inventories. Natural aggregate inventories and parts and supplies inventories are valued using the average cost method. Our natural aggregate inventory excludes volumes in excess of an average twelve-month period of actual sales.
Long-lived Assets. Management reviews long-lived assets on a facility by facility basis for impairment whenever changes in circumstances indicate that the carrying amount of the assets may not be recoverable and would record an impairment charge if necessary. Such evaluations compare the carrying amount of an asset to future undiscounted net cash flows expected to be generated by the asset and are significantly impacted by estimates of future prices for our products, capital needs, economic trends and other factors.
In the fourth quarter of fiscal year 2010, management evaluated the Hunter, Texas cement plant, including the capitalized construction and interest costs associated with the expansion that is currently suspended. We expect the Texas market to recover to pre-recession levels and to complete the expansion project. While the specific timing of the completion has not been determined, we anticipate completing the project within 2-4 years. Based on historical margins, we believe the undiscounted cash flows over the remaining life of the Hunter plant after completion of the expansion will significantly exceed the current investment in the plant as well as the remaining costs of the expansion and future capital expenditures necessary to achieve these cash flows.
Goodwill and Goodwill Impairment. Management tests goodwill for impairment annually by reporting unit in the fourth quarter of our fiscal year using a two-step process. The first step of the impairment test identifies potential impairment by comparing the fair value of a reporting unit to its carrying value including goodwill. In applying a fair-value-based test, estimates are made of the expected future cash flows to be derived from the reporting unit. Similar to the review for impairment of other long-lived assets, the resulting fair value determination is significantly impacted by estimates of future prices for our products, capital needs, economic trends and other factors. If the carrying value of the reporting unit exceeds its fair value, the second step of the impairment test is performed to measure the amount of impairment loss, if any. The second step of the impairment test compares the implied fair value of the reporting unit goodwill with the carrying amount of that goodwill. If the carrying value of the reporting unit goodwill exceeds the implied fair value of the goodwill, an impairment loss is recognized in an amount equal to that excess. The implied fair value of goodwill is determined in the same manner as the amount of goodwill recognized in a business combination.
31
Table of Contents
Based on an impairment test performed as of May 31, 2009, an impairment charge of $58.4 million was recognized with respect to goodwill resulting from the acquisition of Riverside Cement Company and identified with our California cement operations. The fair value of the reporting unit declined compared to prior evaluations, the most recent of which was as of November 30, 2008, due to a change in assumptions regarding the timing of cash flows expected to be derived from the reporting unit. The extreme depth of the recession in California was better understood at this time and resulted in the expected timing of a full recovery in the California cement market to be later than previously anticipated. The resulting present value of the projected cash flows did not support the carrying value of the goodwill and a full impairment charge was recognized.
Goodwill resulting from the acquisition of ready-mix operations in Texas and Louisiana and identified with our consumer products operations has a carrying value of $1.7 million at both May 31, 2010 and May 31, 2009. Based on an impairment test performed as of March 31, 2010, the fair value of the reporting unit exceeds its carrying value.
RECENTLY ISSUED ACCOUNTING GUIDANCE
In September 2006, the Financial Accounting Standards Board issued new accounting guidance that defines fair value, establishes a framework for measuring fair value and expands disclosure requirements about fair value measurements. This accounting guidance was effective for our Company on June 1, 2008. However, in February 2008, the FASB delayed the effective date of the new guidance for all nonfinancial assets and nonfinancial liabilities, except those that are recognized or disclosed at fair value in the financial statements on a recurring basis (at least annually). The new guidance became effective for all nonfinancial assets and nonfinancial liabilities on June 1, 2009. The adoption of this new accounting policy for our nonfinancial assets and nonfinancial liabilities has not had a current material impact on our consolidated financial statements.
In February 2007, the Financial Accounting Standards Board issued new accounting guidance that permits entities to choose to measure many financial instruments and certain other items at fair value. Unrealized gains and losses on items for which the fair value option has been elected will be recognized in earnings at each subsequent reporting date. This new accounting guidance was effective for our Company on June 1, 2008. We did not elect the fair value option for any financial instruments or other items permitted under this guidance; therefore, its adoption had no impact on our consolidated financial statements.
LIQUIDITY AND CAPITAL RESOURCES
In addition to cash and cash equivalents of $74.9 million at May 31, 2010, our sources of liquidity include cash from operations and borrowings available under our senior secured revolving credit facility.
Senior Secured Revolving Credit Facility. On June 19, 2009, we amended and restated our credit agreement and the associated security agreement. The credit agreement continues to provide for a $200 million senior secured revolving credit facility with a $50 million sub-limit for letters of credit and a $15 million sub-limit for swing line loans. The credit facility matures on August 15, 2012. Amounts drawn under the credit facility bear annual interest either at the LIBOR rate plus a margin of 3.5% to 4.0% or at a base rate plus a margin of 2.5% to 3.0%. The base rate is the higher of the federal funds rate plus 0.5%, the prime rate established by Bank of America, N.A. or the rate for one-month LIBOR loans plus 1.0%. The interest rate margins are determined based on our leverage ratio. The commitment fee calculated on the unused portion of the credit facility ranges from 0.50% to 0.75% per year based on our leverage ratio. We may terminate the credit facility at any time.
The amount that can be borrowed under the credit facility is limited to an amount based on the value of our consolidated accounts receivable, inventory and mobile equipment. This amount, called the borrowing base, may be less than the $200 million stated principal amount of the credit facility. The borrowing base under our amended agreement was $157.7 million as of May 31, 2010. We are not required to maintain any financial ratios or covenants unless an event of default occurs or the unused portion of the borrowing base is less than $40 million, in which case we must maintain a fixed charge coverage ratio of at least 1.1 to 1.0. At May 31, 2010, our fixed charge coverage ratio was .7 to 1.0. Given this ratio, we may use only $117.7 million of the borrowing base as of such date. No borrowings were outstanding at May 31, 2010; however, $28.5 million of the borrowing base was used to support letters of credit. As a result, the maximum amount we could borrow as of May 31, 2010 was $89.2 million.
32
Table of Contents
All of our consolidated subsidiaries have guaranteed our obligations under the credit facility. The credit facility is secured by first priority security interests in all or most of our existing and future consolidated accounts, inventory, equipment, intellectual property and other personal property, and in all of our equity interests in present and future domestic subsidiaries and 66% of the equity interest in any future foreign subsidiaries, if any.
The credit agreement contains a number of covenants restricting, among other things, prepayment or redemption of our senior notes, distributions and dividends on and repurchases of our capital stock, acquisitions and investments, indebtedness, liens and affiliate transactions. We are permitted to pay cash dividends on our common stock as long as the credit facility is not in default, the fixed charge coverage ratio is greater than 1.1 to 1.0 and borrowing availability under the borrowing base is more than $50 million. On March 24, 2010 we amended our credit agreement such that, when our fixed charge coverage ratio is less than 1.1 to 1.0, we are permitted to pay cash dividends on our common stock not to exceed $2.5 million in any single instance (which shall not occur more than four times in any calendar year) or $10 million in the aggregate during any calendar year as long as the credit facility is not in default and borrowing availability is more than the greater of $60 million or 30% of the aggregate commitments of all lenders. For this purpose, borrowing availability is equal to the borrowing base less the amount of outstanding borrowings less the amount used to support letters of credit. We were in compliance with all of our loan covenants as of May 31, 2010.
7.25% Senior Notes. At May 31, 2010, we had $550 million aggregate principal amount of 7.25% senior notes outstanding. All of our consolidated subsidiaries have unconditionally guaranteed the 7.25% senior notes. The indenture governing the notes contains covenants that limit our ability and the ability of our subsidiaries to, among other things, incur additional indebtedness, pay dividends or make other distributions or repurchase or redeem our stock, make investments, sell assets, incur liens, enter into agreements restricting our subsidiaries’ ability to pay dividends, enter into transactions with affiliates and consolidate, merge or sell all or substantially all of our assets. We are not required to maintain any affirmative financial ratios or covenants. We were in compliance with all of our loan covenants as of May 31, 2010.
Contractual Obligations. The following is a summary of our estimated future payments under our material contractual obligations as of May 31, 2010.
| Future Payments by Period | ||||||||||||||||||
| Total | 2011 | 2012 | 2013 | 2014-2015 | After 2015 | |||||||||||||
| In thousands | ||||||||||||||||||
| Borrowings |
||||||||||||||||||
| Long-term debt excluding capital leases(1) |
$ | 550,268 | $ | — | $ | — | $ | — | $ | 550,000 | $ | 268 | ||||||
| Interest |
139,563 | 39,875 | 39,875 | 39,875 | 19,938 | — | ||||||||||||
| Operating leases(2) |
56,674 | 16,508 | 8,758 | 11,900 | 9,549 | 9,959 | ||||||||||||
| Supply and service contracts(3) |
19,370 | 9,502 | 8,080 | 1,788 | — | — | ||||||||||||
| Capital lease and maintenance service contract(4) |
6,791 | 399 | 400 | 399 | 799 | 4,794 | ||||||||||||
| Construction and equipment purchase obligations(5) |
5,000 | 5,000 | — | — | — | — | ||||||||||||
| Asset retirement obligations(6) |
18,289 | 1,679 | 225 | 275 | — | 16,110 | ||||||||||||
| Defined benefit plans(7)(8) |
144,125 | 3,287 | 3,089 | 3,530 | 8,599 | 125,620 | ||||||||||||
| $ | 940,080 | $ | 76,250 | $ | 60,427 | $ | 57,767 | $ | 588,885 | $ | 156,751 | |||||||
| (1) | See Note 3 of Notes to Consolidated Financial Statements in Item 8 of this Report for information regarding our long-term debt. Our outstanding letters of credit issued under the senior secured revolving credit facility only collateralize payment of recorded liabilities. |
| (2) | We lease certain mobile and other equipment, office space and other items used in our operations under operating leases that in the normal course of business may be renewed or replaced by subsequent leases. Future payments under leases exclude mineral rights which are insignificant and are generally required only for products produced. |
33
Table of Contents
| (3) | We purchase fuel and other materials for use in our operations under long-term supply contracts that, in certain cases, require minimum amounts of materials be purchased or are subject to minimum transportation charges. In addition, we purchase mining services at our north Texas cement plant under a long-term contract that contains provisions for minimum payments. We expect to utilize these required amounts of material and services in the normal course of business operations. |
| (4) | We entered into a long-term contract with a power supplier which included the construction of certain power facilities at our Oro Grande, California cement plant. We have recognized a capital lease obligation of $2.4 million related to payment obligations under the power supply contract related to these facilities. The total future commitment under the contract includes maintenance services to be provided by the power supplier. |
| (5) | We entered into construction and equipment purchase contracts in connection with the expansion of our Hunter, Texas cement plant. In light of current economic and market conditions we have delayed completion of the project. We expect to resume construction by November 2010. We have not entered into a new construction contract to complete the construction, so no schedule for completion has yet been determined. Until we determine the period over which the construction will occur, we cannot accurately estimate the cost of completing the project. |
| (6) | We incur legal obligations for asset retirement as part of our normal operations related to land reclamation, plant removal and Resource Conservation and Recovery Act closures. |
| (7) | We pay benefits under a series of non-qualified defined benefit plans. See Note 7 of Notes to Consolidated Financial Statements in Item 8 of this Report for information regarding our retirement plans. |
| (8) | We pay benefits under a health benefit plan covering approximately 600 employees and retirees of our California cement subsidiary. These employees are also covered by a qualified defined benefit pension plan. We contribute amounts sufficient to meet minimum funding requirements as set forth in employee benefit and tax laws plus additional amounts considered appropriate. We expect to make plan contributions of $3.1 million in fiscal year 2011. |
During October 2007, we commenced construction on a project to expand our Hunter, Texas cement plant. In May 2009 we temporarily halted construction on the project because we believed that economic and market conditions made it unlikely that current cement demand levels in Texas would permit the new kiln to operate profitably if the project was completed as originally scheduled. We expect to resume construction by November 2010. We have not entered into a new construction contract to complete the construction, so no schedule for completion has yet been determined. As of May 31, 2010, we have incurred approximately $293.9 million, excluding capitalized interest of approximately $16.3 million related to the project, of which $289.4 million has been expended. Until we determine the period over which the construction will occur, we cannot accurately estimate the cost of completing the project.
We expect cash and cash equivalents, cash from operations, and available borrowings under our senior secured revolving credit facility to be sufficient to provide funds for capital expenditure commitments currently estimated at $15 million to $25 million, capital expenditures for the Hunter plant expansion, scheduled debt payments, working capital needs and other general corporate purposes for at least the next year.
Cash Flows
Net cash provided by operating activities for fiscal years 2010, 2009 and 2008 was $48.2 million, $107.3 million and $101.6 million, respectively.
Net cash provided by operating activities for fiscal year 2010 decreased $59.1 million from fiscal year 2009. The decrease was primarily the result of lower income from operations excluding the charge for goodwill impairment in fiscal year 2009 which was partially offset by changes in working capital items including decreases in inventories and increases in accounts payable and accrued liabilities.
Net cash provided by operating activities for fiscal year 2009 increased $5.7 million from fiscal year 2008. The increase was primarily the result of changes in working capital items including decreases in receivables and
34
Table of Contents
accounts payable and accrued liabilities which offset lower income from operations excluding depreciation, depletion and amortization and the charge for goodwill impairment.
Net cash provided by investing activities for fiscal year 2010 was $17.0 million. Net cash used by investing activities for fiscal years 2009 and 2008 was $249.0 million and $207.0 million, respectively.
Capital expenditures, including capitalized interest, incurred in connection with the expansion of our Hunter, Texas cement plant for fiscal years 2010, 2009 and 2008 were $5.3 million, $222.1 million and $71.6 million, respectively. Capital expenditures, including capitalized interest, incurred in connection with the expansion and modernization of our Oro Grande, California cement plant for fiscal years 2009 and 2008 were $1.3 million and $176.0 million, respectively.
Capital expenditures for normal replacement and upgrades of existing equipment and acquisitions to sustain our existing operations for fiscal years 2010, 2009 and 2008 were $8.3 million, $65.1 million and $65.0 million, respectively. Capital expenditures in fiscal year 2009 include $25.3 million incurred to acquire aggregate operations in central Texas through a tax deferred like-kind-exchange transaction.
Proceeds from asset disposals in fiscal year 2010 include $19.2 million representing the outstanding principal amount of a note receivable we sold on December 18, 2009. The note was received in connection with sale of land associated with our expanded shale and clay operations in south Texas in 2006 and had been scheduled to mature May 31, 2010.
Proceeds from asset disposals in fiscal year 2008 include the proceeds from the sale of operating assets and real estate associated with our aggregate operations in north Texas and south Louisiana. In connection with these sales, proceeds of $28.7 million were held by a qualified intermediary trust for reinvestment in tax deferred like-kind-exchange transactions. Completion of our tax deferred like-kind-exchange transactions in fiscal year 2009 reduced the cash designated for property acquisitions that was being held by a qualified intermediary trust by $28.7 million.
We elected to receive distributions and policy surrender proceeds from life insurance contracts purchased in connection with certain of our benefit plans. The distributions and proceeds for fiscal years 2010, 2009 and 2008 were $10.6 million, $5.7 million and $103.9 million, respectively, which were offset in part by premiums and fees paid to maintain the policies.
Net cash used by financing activities for fiscal year 2010 was $10.0 million. Net cash provided by financing activities for fiscal years 2009 and 2008 was $122.0 million and $129.9 million, respectively.
We sold $300 million aggregate principal amount of additional 7.25% senior notes at an offering price of 93.25% in fiscal year 2009. The net proceeds were used to repay our $150 million senior term loan and borrowings outstanding under our senior secured revolving credit facility in the amount of $29.5 million, with additional proceeds available for general corporate purposes.
We entered into a term credit agreement that provided for an unsecured $150 million senior term loan in fiscal year 2008. A portion of the net proceeds was used to repay borrowings outstanding under our senior secured revolving credit facility in the amount of $85.0 million.
Proceeds from stock option exercises and the related tax benefits for fiscal years 2010, 2009 and 2008 were $1.1 million, $6.2 million and $6.6 million, respectively. Dividends paid on our common stock in fiscal years 2010, 2009 and 2008 were $8.3 million, $8.3 million and $8.2 million, respectively.
OTHER ITEMS
Environmental Matters
We are subject to federal, state and local environmental laws, regulations and permits concerning, among other matters, air emissions and wastewater discharge. We intend to comply with these laws, regulations and permits. However, from time to time we receive claims from federal and state environmental regulatory agencies and entities asserting that we are or may be in violation of certain of these laws, regulations and permits, or from private parties
35
Table of Contents
alleging that our operations have injured them or their property. See “Legal Proceedings” in Item 1, Business, for a description of certain claims. It is possible that we could be held liable for future charges which might be material but are not currently known or estimable. In addition, changes in federal or state laws, regulations or requirements or discovery of currently unknown conditions could require additional expenditures by us.
Market Risk
Historically, we have not entered into derivatives or other financial instruments for trading or speculative purposes. Because of the short duration of our investments, changes in market interest rates would not have a significant impact on their fair value. The fair value of fixed rate debt will vary as interest rates change.
The estimated fair value of each class of financial instrument as of May 31, 2010 and May 31, 2009 approximates its carrying value except for long-term debt having fixed interest rates. The fair value of our long-term debt is estimated based on broker/dealer quoted market prices. As of May 31, 2010, the fair value of our long-term debt, including the current portion, was approximately $534.8 million compared to the carrying amount of $538.9 million. As of May 31, 2009, the fair value of long-term debt, including the current portion, was approximately $476.8 million compared to the carrying amount of $541.8 million. With respect to borrowings under our senior secured revolving credit facility, which are variable rate debt, a 10 percent change in interest rates for the year ended May 31, 2010, would not have resulted in a significant annual change in our pretax earnings and cash flows.
Our operations require large amounts of energy and are dependent upon energy sources, including electricity and fossil fuels. Prices for energy are subject to market forces largely beyond our control. We have generally not entered into any long-term contracts to satisfy our fuel and electricity needs, with the exception of coal which we purchase from specific mines pursuant to long-term contracts. However, we continually monitor these markets and we may decide in the future to enter into long-term contracts. If we are unable to meet our requirements for fuel and electricity, we may experience interruptions in our production. Price increases or disruption of the uninterrupted supply of these products could adversely affect our results of operations.
Cautionary Statement for Purposes of the “Safe Harbor” Provisions of the Private Securities Litigation Reform Act of 1995
Certain statements contained in this annual report are “forward-looking statements” within the meaning of the Private Securities Litigation Reform Act of 1995. All statements other than statements of historical fact are forward looking statements. Forward looking statements may include the words “may,” “will,” “estimate,” “intend,” “continue,” “believe,” “expect,” “plan,” “anticipate,” and other similar words. Such statements are subject to risks, uncertainties and other factors, which could cause actual results to differ materially from future results expressed or implied by such forward-looking statements. Potential risks and uncertainties include, but are not limited to, the impact of competitive pressures and changing economic and financial conditions on our business, the cyclical and seasonal nature of our business, the level of construction activity in our markets, abnormal periods of inclement weather, unexpected periods of equipment downtime, unexpected operational difficulties, changes in the cost of raw materials, fuel and energy, changes in cost or availability of transportation, changes in interest rates, the timing and amount of federal, state and local funding for infrastructure, delays in announced capacity expansions, ongoing volatility and uncertainty in the capital or credit markets, the impact of environmental laws, regulations and claims, changes in governmental and public policy, and the risks and uncertainties described in Part I, Item 1A, “Risk Factors” of this Report. Forward-looking statements speak only as of the date hereof, and we assume no obligation to publicly update such statements.
36
Table of Contents
| ITEM 7A. | QUANTITATIVE AND QUALITATIVE DISCLOSURES ABOUT MARKET RISK |
The information required by this item is included in Item 7 of this Report.
| ITEM 8. | FINANCIAL STATEMENTS AND SUPPLEMENTARY DATA |
37
Table of Contents
TEXAS INDUSTRIES, INC. AND SUBSIDIARIES
| May 31, | ||||||||
| 2010 | 2009 | |||||||
| In thousands | ||||||||
| ASSETS |
||||||||
| CURRENT ASSETS |
||||||||
| Cash and cash equivalents |
$ | 74,946 | $ | 19,796 | ||||
| Receivables—net |
112,184 | 129,432 | ||||||
| Inventories |
142,419 | 155,724 | ||||||
| Deferred income taxes and prepaid expenses |
23,426 | 22,039 | ||||||
| TOTAL CURRENT ASSETS |
352,975 | 326,991 | ||||||
| PROPERTY, PLANT AND EQUIPMENT |
||||||||
| Land and land improvements |
158,367 | 156,917 | ||||||
| Buildings |
58,351 | 58,442 | ||||||
| Machinery and equipment |
1,220,021 | 1,247,931 | ||||||
| Construction in progress |
322,039 | 328,256 | ||||||
| 1,758,778 | 1,791,546 | |||||||
| Less depreciation and depletion |
604,269 | 572,195 | ||||||
| 1,154,509 | 1,219,351 | |||||||
| OTHER ASSETS |
||||||||
| Goodwill |
1,715 | 1,715 | ||||||
| Real estate and investments |
6,774 | 10,001 | ||||||
| Deferred charges and other |
15,774 | 14,486 | ||||||
| 24,263 | 26,202 | |||||||
| $ | 1,531,747 | $ | 1,572,544 | |||||
| LIABILITIES AND SHAREHOLDERS’ EQUITY |
||||||||
| CURRENT LIABILITIES |
||||||||
| Accounts payable |
$ | 56,214 | $ | 55,749 | ||||
| Accrued interest, compensation and other |
51,455 | 51,856 | ||||||
| Current portion of long-term debt |
234 | 243 | ||||||
| TOTAL CURRENT LIABILITIES |
107,903 | 107,848 | ||||||
| LONG-TERM DEBT |
538,620 | 541,540 | ||||||
| DEFERRED INCOME TAXES AND OTHER CREDITS |
123,976 | 120,011 | ||||||
| SHAREHOLDERS’ EQUITY |
||||||||
| Common stock, $1 par value; authorized 100,000 shares; issued and outstanding 27,796 and 27,718 shares, respectively |
27,796 | 27,718 | ||||||
| Additional paid-in capital |
475,584 | 469,908 | ||||||
| Retained earnings |
272,018 | 319,199 | ||||||
| Accumulated other comprehensive loss |
(14,150 | ) | (13,680 | ) | ||||
| 761,248 | 803,145 | |||||||
| $ | 1,531,747 | $ | 1,572,544 | |||||
See notes to consolidated financial statements.
38
Table of Contents
CONSOLIDATED STATEMENTS OF OPERATIONS
TEXAS INDUSTRIES, INC. AND SUBSIDIARIES
| Year Ended May 31, | ||||||||||||
| 2010 | 2009 | 2008 | ||||||||||
| In thousands except per share | ||||||||||||
| NET SALES |
$ | 621,064 | $ | 839,202 | $ | 1,028,854 | ||||||
| Cost of products sold |
562,066 | 726,133 | 834,333 | |||||||||
| GROSS PROFIT |
58,998 | 113,069 | 194,521 | |||||||||
| Selling, general and administrative |
79,415 | 72,093 | 96,220 | |||||||||
| Goodwill impairment |
— | 58,395 | — | |||||||||
| Interest |
52,240 | 33,286 | 2,505 | |||||||||
| Loss on debt retirements |
— | 907 | — | |||||||||
| Other income |
(10,666 | ) | (21,191 | ) | (31,563 | ) | ||||||
| 120,989 | 143,490 | 67,162 | ||||||||||
| INCOME (LOSS) BEFORE INCOME TAXES |
(61,991 | ) | (30,421 | ) | 127,359 | |||||||
| Income taxes (benefit) |
(23,138 | ) | (12,774 | ) | 39,728 | |||||||
| NET INCOME (LOSS) |
$ | (38,853 | ) | $ | (17,647 | ) | $ | 87,631 | ||||
| Net income (loss) per share |
||||||||||||
| Basic |
$ | (1.40 | ) | $ | (.64 | ) | $ | 3.20 | ||||
| Diluted |
$ | (1.40 | ) | $ | (.64 | ) | $ | 3.14 | ||||
| Average shares outstanding |
||||||||||||
| Basic |
27,744 | 27,614 | 27,383 | |||||||||
| Diluted |
27,744 | 27,614 | 27,860 | |||||||||
| Cash dividends per share |
$ | .30 | $ | .30 | $ | .30 | ||||||
See notes to consolidated financial statements.
39
Table of Contents
CONSOLIDATED STATEMENTS OF CASH FLOWS
TEXAS INDUSTRIES, INC. AND SUBSIDIARIES
| Year Ended May 31, | ||||||||||||
| 2010 | 2009 | 2008 | ||||||||||
| In thousands | ||||||||||||
| OPERATING ACTIVITIES |
||||||||||||
| Net income (loss) |
$ | (38,853 | ) | $ | (17,647 | ) | $ | 87,631 | ||||
| Adjustments to reconcile net income (loss) to cash provided by operating activities |
||||||||||||
| Depreciation, depletion and amortization |
63,925 | 68,192 | 55,577 | |||||||||
| Goodwill impairment |
— | 58,395 | — | |||||||||
| Gains on asset disposals |
(1,350 | ) | (6,759 | ) | (19,410 | ) | ||||||
| Deferred income taxes (benefit) |
(9,132 | ) | (1,938 | ) | 20,036 | |||||||
| Stock-based compensation expense (credit) |
5,097 | (4,400 | ) | 2,395 | ||||||||
| Excess tax benefits from stock-based compensation |
(250 | ) | (1,596 | ) | (3,299 | ) | ||||||
| Loss on debt retirements |
— | 907 | — | |||||||||
| Other—net |
13,998 | 5,931 | 2,475 | |||||||||
| Changes in operating assets and liabilities |
||||||||||||
| Receivables—net |
(5,421 | ) | 55,397 | (29,507 | ) | |||||||
| Inventories |
13,706 | (11,070 | ) | (9,400 | ) | |||||||
| Prepaid expenses |
387 | (1,894 | ) | (2,033 | ) | |||||||
| Accounts payable and accrued liabilities |
6,046 | (36,232 | ) | (2,910 | ) | |||||||
| Net cash provided by operating activities |
48,153 | 107,286 | 101,555 | |||||||||
| INVESTING ACTIVITIES |
||||||||||||
| Capital expenditures—expansions |
(5,337 | ) | (223,445 | ) | (247,552 | ) | ||||||
| Capital expenditures—other |
(8,322 | ) | (65,099 | ) | (64,973 | ) | ||||||
| Cash designated for property acquisitions |
— | 28,733 | (28,733 | ) | ||||||||
| Proceeds from asset disposals |
21,592 | 7,981 | 34,922 | |||||||||
| Investments in life insurance contracts |
6,967 | 2,876 | 99,203 | |||||||||
| Other—net |
2,079 | (21 | ) | 101 | ||||||||
| Net cash provided (used) by investing activities |
16,979 | (248,975 | ) | (207,032 | ) | |||||||
| FINANCING ACTIVITIES |
||||||||||||
| Long-term borrowings |
— | 327,250 | 366,000 | |||||||||
| Debt retirements |
(245 | ) | (197,772 | ) | (232,366 | ) | ||||||
| Debt issuance costs |
(2,552 | ) | (5,470 | ) | (2,160 | ) | ||||||
| Stock option exercises |
893 | 4,641 | 3,315 | |||||||||
| Excess tax benefits from stock-based compensation |
250 | 1,596 | 3,299 | |||||||||
| Common dividends paid |
(8,328 | ) | (8,287 | ) | (8,222 | ) | ||||||
| Net cash provided (used) by financing activities |
(9,982 | ) | 121,958 | 129,866 | ||||||||
| Increase (decrease) in cash and cash equivalents |
55,150 | (19,731 | ) | 24,389 | ||||||||
| Cash and cash equivalents at beginning of year |
19,796 | 39,527 | 15,138 | |||||||||
| Cash and cash equivalents at end of year |
$ | 74,946 | $ | 19,796 | $ | 39,527 | ||||||
See notes to consolidated financial statements.
40
Table of Contents
CONSOLIDATED STATEMENTS OF SHAREHOLDERS’ EQUITY
TEXAS INDUSTRIES, INC. AND SUBSIDIARIES
| Year Ended May 31, | ||||||||||||
| 2010 | 2009 | 2008 | ||||||||||
| In thousands | ||||||||||||
| COMMON STOCK ($1 par value) |
||||||||||||
| Balance at the beginning of the year |
$ | 27,718 | $ | 27,493 | $ | 27,323 | ||||||
| Stock issued to employees and non-employee directors related to stock compensation plans |
78 | 225 | 170 | |||||||||
| Balance at the end of the year |
27,796 | 27,718 | 27,493 | |||||||||
| ADDITIONAL PAID-IN CAPITAL |
||||||||||||
| Balance at the beginning of the year |
469,908 | 459,877 | 448,289 | |||||||||
| Stock-based compensation |
4,584 | 3,963 | 5,040 | |||||||||
| Tax benefits from stock-based compensation |
220 | 1,596 | 3,299 | |||||||||
| Stock issued to employees and non-employee directors related to stock compensation plans |
872 | 4,472 | 3,249 | |||||||||
| Balance at the end of the year |
475,584 | 469,908 | 459,877 | |||||||||
| RETAINED EARNINGS |
||||||||||||
| Balance at the beginning of the year |
319,199 | 345,133 | 265,724 | |||||||||
| Net income (loss) |
(38,853 | ) | (17,647 | ) | 87,631 | |||||||
| Common dividends paid—$.30 per share |
(8,328 | ) | (8,287 | ) | (8,222 | ) | ||||||
| Balance at the end of the year |
272,018 | 319,199 | 345,133 | |||||||||
| ACCUMULATED OTHER COMPREHENSIVE LOSS |
||||||||||||
| Balance at the beginning of the year |
(13,680 | ) | (7,136 | ) | (4,217 | ) | ||||||
| Postretirement benefit obligation adjustments—net of tax benefit of $270 in 2010, $3,727 in 2009 and $1,702 in 2008 |
(470 | ) | (6,544 | ) | (2,919 | ) | ||||||
| Balance at the end of the year |
(14,150 | ) | (13,680 | ) | (7,136 | ) | ||||||
| TOTAL SHAREHOLDERS’ EQUITY |
$ | 761,248 | $ | 803,145 | $ | 825,367 | ||||||
| COMPREHENSIVE INCOME (LOSS) |
||||||||||||
| Net income (loss) |
$ | (38,853 | ) | $ | (17,647 | ) | $ | 87,631 | ||||
| Net other comprehensive loss |
(470 | ) | (6,544 | ) | (2,919 | ) | ||||||
| Net comprehensive income (loss) |
$ | (39,323 | ) | $ | (24,191 | ) | $ | 84,712 | ||||
See notes to consolidated financial statements.
41
Table of Contents
NOTES TO CONSOLIDATED FINANCIAL STATEMENTS
Texas Industries, Inc. and subsidiaries is a leading supplier of heavy construction materials in the United States through our three business segments: cement, aggregates and consumer products. Our principal products are gray portland cement, produced and sold through our cement segment; stone, sand and gravel, produced and sold through our aggregates segment; and ready-mix concrete, produced and sold through our consumer products segment. Other products include expanded shale and clay lightweight aggregates, produced and sold through our aggregates segment, and packaged concrete mix, mortar, sand and related products, produced and sold through our consumer products segment. Our facilities are concentrated primarily in Texas, Louisiana and California. When used in these notes the terms “Company,” “we,” “us,” or “our” mean Texas Industries, Inc. and subsidiaries unless the context indicates otherwise.
1. Summary of Significant Accounting Policies
Principles of Consolidation. The consolidated financial statements include the accounts of Texas Industries, Inc. and all subsidiaries. The consolidated financial statements also include the accounts of a former qualified intermediary trust, in which we were the primary beneficiary. The trust accounts were established in connection with our tax deferred like-kind-exchange property acquisition transactions under Section 1031 of the Internal Revenue Code. Certain amounts in the prior period financial statements have been reclassified to conform to the current period presentation. In 2010, we recognized a charge of $4.4 million for an increase to one of our defined benefit liabilities, which includes an estimated $3.4 million that relates to years prior to 2010. See further discussion in Note 7.
Estimates. The preparation of financial statements and accompanying notes in conformity with generally accepted accounting principles requires management to make estimates and assumptions that affect the amounts reported. Actual results could differ from those estimates.
Fair Value of Financial Instruments. The estimated fair value of each class of financial instrument as of May 31, 2010 and May 31, 2009 approximates its carrying value except for long-term debt having fixed interest rates. The fair value of our long-term debt is estimated based on broker/dealer quoted market prices. As of May 31, 2010, the fair value of our long-term debt, including the current portion, was approximately $534.8 million compared to the carrying amount of $538.9 million. As of May 31, 2009, the fair value of long-term debt, including the current portion, was approximately $476.8 million compared to the carrying amount of $541.8 million.
Cash and Cash Equivalents. Investments with maturities of less than 90 days when purchased are classified as cash equivalents and consist primarily of money market funds and investment grade commercial paper issued by major corporations and financial institutions.
Receivables. Management evaluates the ability to collect accounts receivable based on a combination of factors. A reserve for doubtful accounts is maintained based on the length of time receivables are past due or the status of a customer’s financial condition. If we are aware of a specific customer’s inability to make required payments, specific amounts are added to the reserve.
Environmental Liabilities. We are subject to environmental laws and regulations established by federal, state and local authorities, and make provision for the estimated costs related to compliance when it is probable that a reasonably estimable liability has been incurred.
Legal Contingencies. We are a defendant in lawsuits which arose in the normal course of business, and make provision for the estimated loss from any claim or legal proceeding when it is probable that a reasonably estimable liability has been incurred.
Inventories. Inventories are stated at the lower of cost or market. We use the last-in, first out (“LIFO”) method to value finished products, work in process and raw material inventories excluding natural aggregate inventories. Natural aggregate inventories and parts and supplies inventories are valued using the average cost method. Our natural aggregate inventory excludes volumes in excess of an average twelve-month period of actual sales.
42
Table of Contents
Long-lived Assets. Management reviews long-lived assets on a facility by facility basis for impairment whenever changes in circumstances indicate that the carrying amount of the assets may not be recoverable and would record an impairment charge if necessary. Such evaluations compare the carrying amount of an asset to future undiscounted net cash flows expected to be generated by the asset and are significantly impacted by estimates of future prices for our products, capital needs, economic trends and other factors.
In the fourth quarter of our 2010 fiscal year, management evaluated the Hunter, Texas cement plant, including the capitalized construction and interest costs associated with the expansion that is currently suspended. We expect the Texas market to recover to pre-recession levels and to complete the expansion project. While the specific timing of the completion has not been determined, we anticipate completing the project within 2-4 years. Based on historical margins, we believe the undiscounted cash flows over the remaining life of the Hunter plant after completion of the expansion will significantly exceed the current investment in the plant as well as the remaining costs of the expansion and future capital expenditures necessary to achieve these cash flows.
Property, plant and equipment is recorded at cost. Costs incurred to construct certain long-lived assets include capitalized interest which is amortized over the estimated useful life of the related asset. Interest is capitalized during the construction period of qualified assets based on the average amount of accumulated expenditures and the weighted average interest rate applicable to borrowings outstanding during the period. If accumulated expenditures exceed applicable borrowings outstanding during the period, capitalized interest is allocated to projects under construction on a pro rata basis. Provisions for depreciation are computed generally using the straight-line method. Useful lives for our primary operating facilities range from 10 to 25 years with certain cement facility structures having useful lives of 40 years. Provisions for depletion of mineral deposits are computed on the basis of the estimated quantity of recoverable raw materials. The costs of all post-production stripping activity, which represents removing overburden and waste materials to access mineral deposits, is recognized as a cost of the inventory produced during the period the stripping costs are incurred. Maintenance and repairs are charged to expense as incurred.
Goodwill and Goodwill Impairment. Management tests goodwill for impairment annually by reporting unit in the fourth quarter of our fiscal year using a two-step process. The first step of the impairment test identifies potential impairment by comparing the face value of a reporting unit to its carrying value including goodwill. In applying a fair-value-based test, estimates are made of the expected future cash flows to be derived from the reporting unit. Similar to the review for impairment of other long-lived assets, the resulting fair value determination is significantly impacted by estimates of future prices for our products, capital needs, economic trends and other factors. If the carrying value of the reporting unit exceeds its fair value, the second step of the impairment test is performed to measure the amount of impairment loss, if any. The second step of the impairment test compares the implied fair value of the reporting unit goodwill with the carrying amount of that goodwill. If the carrying value of the reporting unit goodwill exceeds the implied fair value of the goodwill, an impairment loss is recognized in an amount equal to that excess. The implied fair value of goodwill is determined in the same manner as the amount of goodwill recognized in a business combination.
Based on an impairment test performed as of May 31, 2009, an impairment charge of $58.4 million was recognized with respect to goodwill resulting from the acquisition of Riverside Cement Company and identified with our California cement operations. The fair value of the reporting unit declined compared to prior evaluations, the most recent of which was as of November 30, 2008, due to a change in assumptions regarding the timing of cash flows expected to be derived from the reporting unit. The extreme depth of the recession in California was better understood at this time and resulted in the expected timing of a full recovery in the California cement market to be later than previously anticipated. The resulting present value of the projected cash flows did not support the carrying value of the goodwill and a full impairment charge was recognized.
Goodwill resulting from the acquisition of ready-mix operations in Texas and Louisiana and identified with our consumer products operations has a carrying value of $1.7 million at both May 31, 2010 and 2009. Based on an impairment test performed as of March 31, 2010, the fair value of the reporting unit exceeds its carrying value, and therefore, no potential impairment was identified.
43
Table of Contents
Real Estate and Investments. Surplus real estate and real estate acquired for development of high quality industrial or multi-use parks totaled $5.9 million at May 31, 2010 and $6.0 million at May 31, 2009.
Investments include life insurance contracts purchased in connection with certain of our benefit plans. The contracts, recorded at their net cash surrender value, totaled $0.8 million (net of distribution of $82.8 million plus accrued interest and fees) at May 31, 2010 and $4.0 million (net of distributions of $89.5 million plus accrued interest and fees) at May 31, 2009. We can elect to receive distributions chargeable against the cash surrender value of the policies in the form of borrowings or withdrawals or we can elect to surrender the policies and receive their net cash surrender value. Proceeds received from distributions and policy surrenders were $10.6 million in 2010, $5.7 million in 2009 and $103.9 million in 2008.
In addition, cash investments totaling $28.7 million were held in escrow by a qualified intermediary trust for reinvestment in tax deferred like-kind-exchange transactions as of May 31, 2008. During fiscal year 2009, the cash investments were used to complete designated property acquisitions totaling $25.5 million, after which the qualified intermediary trust was terminated and the remaining $3.2 million was no longer held in escrow.
Deferred Charges and Other. Deferred charges are composed primarily of debt issuance costs that totaled $8.8 million at May 31, 2010 and $9.0 million at May 31, 2009. The costs are amortized over the term of the related debt.
Other Credits. Other credits totaled $83.9 million at May 31, 2010 and $72.3 million at May 31, 2009 and are composed primarily of liabilities related to our retirement plans, deferred compensation agreements and asset retirement obligations. In 2010, we recognized a charge of $4.4 million for an increase to one of our defined benefit liabilities, which includes an estimated $3.4 million that relates to years prior to 2010. See further discussion in Note 7.
Asset Retirement Obligations. We record a liability for legal obligations associated with the retirement of our long-lived assets in the period in which it is incurred if a reasonable estimate of fair value of the obligation can be made. The discounted fair value of the obligation incurred in each period is added to the carrying amount of the associated assets and depreciated over the lives of the assets. The liability is accreted at the end of each period through a charge to operating expense. A gain or loss on settlement is recognized if the obligation is settled for other than the carrying amount of the liability.
We incur legal obligations for asset retirement as part of our normal operations related to land reclamation, plant removal and Resource Conservation and Recovery Act closures. Determining the amount of an asset retirement liability requires estimating the future cost of contracting with third parties to perform the obligation. The estimate is significantly impacted by, among other considerations, management’s assumptions regarding the scope of the work required, labor costs, inflation rates, market-risk premiums and closure dates.
Changes in asset retirement obligations are as follows:
| 2010 | 2009 | |||||||
| In thousands | ||||||||
| Balance at beginning of year |
$ | 4,415 | $ | 3,961 | ||||
| Additions |
— | 289 | ||||||
| Accretion expense |
311 | 296 | ||||||
| Settlements |
(252 | ) | (131 | ) | ||||
| Balance at end of year |
$ | 4,474 | $ | 4,415 | ||||
Net Sales. Sales are recognized when title has transferred and products are delivered. We include delivery fees in the amount we bill customers to the extent needed to recover our cost of freight and delivery. Net sales are presented as revenues including these delivery fees.
Other Income. Routine sales of operating assets and real estate resulted in gains of $1.4 million in 2010, $6.8 million in 2009 and $20.6 million in 2008. In addition, other income includes gains of $3.4 million in 2010, $1.7 million in 2009 and $3.9 million in 2008 from the sale of emissions credits associated with our Crestmore
44
Table of Contents
cement plant in Riverside, California. We have entered into various oil and gas lease agreements on property we own in north Texas. The terms of the agreements include the payment of a lease bonus and royalties on any oil and gas produced. However, we cannot guaranty what the level of royalties, if any, will be. Lease bonus payments received resulted in income of $0.1 million in 2010, $4.7 million in 2009 and $0.8 million in 2008.
Stock-based Compensation. We have provided stock-based compensation to employees and non-employee directors in the form of non-qualified and incentive stock options, restricted stock, stock appreciation rights, deferred compensation agreements and stock awards. We use the Black-Scholes option-pricing model to determine the fair value of stock options granted as of the date of grant. Options with graded vesting are valued as single awards and the related compensation cost is recognized using a straight-line attribution method over the shorter of the vesting period or required service period adjusted for estimated forfeitures. We use the average stock price on the date of grant to determine the fair value of restricted stock awards paid. A liability, which is included in other credits, is recorded for stock appreciation rights, deferred compensation agreements and stock awards expected to be settled in cash, based on their fair value at the end of each period until such awards are paid.
Financial-based Incentive Plans. All personnel employed as of May 31 and not participating in a production-based incentive awards plan share in our pretax income for the year then ended based on predetermined formulas. The duration of most of the plans is one year. Certain executives are additionally covered under a three-year plan. All plans are subject to annual review by the Compensation Committee of the Board of Directors. The amount of financial-based incentive compensation included in selling, general and administrative expense was none in 2010, $0.6 million in 2009 and $16.7 million in 2008.
Income Taxes. Accounting for income taxes uses the liability method of recognizing and classifying deferred income taxes. Texas Industries, Inc. (the parent company) joins in filing a consolidated return with its subsidiaries. Current and deferred tax expense is allocated among the members of the group based on a stand-alone calculation of the tax of the individual member. Accrued interest and penalties related to unrecognized tax benefits are recognized in income tax expense.
Earnings Per Share (“EPS”). Basic EPS is computed by adjusting net income for the participation in earnings of unvested restricted shares outstanding, then dividing by the weighted-average number of common shares outstanding during the period including contingently issuable shares and excluding outstanding unvested restricted shares.
Contingently issuable shares relate to vested shares under our former stock awards program and to deferred compensation agreements in which directors elected to defer their fees. Vested stock award shares are issued in the year in which the employee reaches age 60. The deferred compensation is denominated in shares of our common stock and issued in accordance with the terms of the agreement subsequent to retirement or separation from us. The shares are considered contingently issuable because the director has an unconditional right to the shares to be issued.
Diluted EPS adjusts net income and the outstanding shares for the dilutive effect of stock options, restricted shares and awards.
45
Table of Contents
Basic and Diluted EPS are calculated as follows:
| 2010 | 2009 | 2008 | ||||||||||
| In thousands except per share | ||||||||||||
| Basic earnings |
||||||||||||
| Net income (loss) |
$ | (38,853 | ) | $ | (17,647 | ) | $ | 87,631 | ||||
| Unvested restricted share participation |
16 | 14 | (48 | ) | ||||||||
| Basic income (loss) |
$ | (38,837 | ) | $ | (17,633 | ) | $ | 87,583 | ||||
| Diluted earnings |
||||||||||||
| Net income (loss) |
$ | (38,853 | ) | $ | (17,647 | ) | $ | 87,631 | ||||
| Unvested restricted share participation |
16 | 14 | (48 | ) | ||||||||
| Diluted income (loss) |
$ | (38,837 | ) | $ | (17,633 | ) | $ | 87,583 | ||||
| Shares |
||||||||||||
| Weighted-average shares outstanding |
27,752 | 27,620 | 27,391 | |||||||||
| Contingently issuable shares |
6 | 10 | 7 | |||||||||
| Unvested restricted shares |
(14 | ) | (16 | ) | (15 | ) | ||||||
| Basic weighted-average shares |
27,744 | 27,614 | 27,383 | |||||||||
| Stock option, restricted share and award dilution |
— | — | 477 | |||||||||
| Diluted weighted-average shares* |
27,744 | 27,614 | 27,860 | |||||||||
| Net income (loss) per share |
||||||||||||
| Basic |
$ | (1.40 | ) | $ | (.64 | ) | $ | 3.20 | ||||
| Diluted |
$ | (1.40 | ) | $ | (.64 | ) | $ | 3.14 | ||||
|
* Shares excluded due to antidilutive effect |
||||||||||||
| Stock options, restricted shares and awards |
978 | 853 | 99 | |||||||||
Recently Issued Accounting Guidance. In September 2006, the Financial Accounting Standards Board issued new accounting guidance that defines fair value, establishes a framework for measuring fair value and expands disclosure requirements about fair value measurements. This accounting guidance was effective for our Company on June 1, 2008. However, in February 2008, the FASB delayed the effective date of the new guidance for all nonfinancial assets and nonfinancial liabilities, except those that are recognized or disclosed at fair value in the financial statements on a recurring basis (at least annually). The new guidance became effective for all nonfinancial assets and nonfinancial liabilities on June 1, 2009. The adoption of this new accounting policy for our nonfinancial assets and nonfinancial liabilities has not had a current material impact on our consolidated financial statements.
In February 2007, the Financial Accounting Standards Board issued new accounting guidance that permits entities to choose to measure many financial instruments and certain other items at fair value. Unrealized gains and losses on items for which the fair value option has been elected will be recognized in earnings at each subsequent reporting date. This new accounting guidance was effective for our Company on June 1, 2008. We did not elect the fair value option for any financial instruments or other items permitted under this guidance; therefore, its adoption had no impact on our consolidated financial statements.
46
Table of Contents
2. Working Capital
Working capital totaled $245.1 million at May 31, 2010, compared to $219.1 million at May 31, 2009. Selected components of working capital are summarized below.
Receivables consist of:
| 2010 | 2009 | |||||
| In thousands | ||||||
| Trade notes and accounts receivable |
$ | 95,120 | $ | 92,622 | ||
| Other notes receivable, including accrued interest |
— | 19,197 | ||||
| Income tax receivable |
13,253 | 13,579 | ||||
| Refund claims and other |
3,811 | 4,034 | ||||
| $ | 112,184 | $ | 129,432 | |||
Trade notes and accounts receivable are presented net of allowances for doubtful receivables of $3.5 million at May 31, 2010 and $2.1 million at May 31, 2009. Provisions for bad debts charged to expense were $2.0 million in 2010, $1.2 million in 2009 and $1.3 million in 2008. Uncollectible accounts written off totaled $0.6 million in 2010, $1.2 million in 2009 and $0.5 million in 2008.
Other notes receivable at May 31, 2009 includes a note received in connection with the sale of land associated with our expanded shale and clay operations in south Texas in 2006 which was scheduled to mature May 31, 2010. On December 18, 2009, the note was sold for $19.9 million representing the outstanding principal amount plus accrued interest.
Inventories consist of:
| 2010 | 2009 | |||||
| In thousands | ||||||
| Finished products |
$ | 9,632 | $ | 10,873 | ||
| Work in process |
50,798 | 61,608 | ||||
| Raw materials |
13,985 | 17,513 | ||||
| Total inventories at LIFO cost |
74,415 | 89,994 | ||||
| Finished products |
19,955 | 16,575 | ||||
| Raw materials |
891 | 2,079 | ||||
| Parts and supplies |
47,158 | 47,076 | ||||
| Total inventories at average cost |
68,004 | 65,730 | ||||
| Total inventories |
$ | 142,419 | $ | 155,724 | ||
All inventories are stated at the lower of cost or market. Finished product, work in process and raw material inventories, excluding natural aggregate inventories, are valued using the last-in, first-out (“LIFO”) method. Natural aggregate finished product and raw material inventories and parts and supplies inventories are valued using the average cost method. If the average cost method (which approximates current replacement cost) had been used for all of these inventories, inventory values would have been higher by $43.1 million in 2010 and $47.0 million in 2009. In 2010 certain inventory quantities were reduced, which resulted in a liquidation of LIFO inventory layers carried at lower costs prevailing in prior years. The effect of the liquidation was to decrease cost of products sold by approximately $1.8 million.
Accrued interest, compensation and other consist of:
| 2010 | 2009 | |||||
| In thousands | ||||||
| Interest |
$ | 15,176 | $ | 15,271 | ||
| Compensation and employee benefits |
13,574 | 14,316 | ||||
| Casualty insurance |
12,595 | 14,332 | ||||
| Income taxes |
2,526 | 613 | ||||
| Property taxes and other |
7,584 | 7,324 | ||||
| $ | 51,455 | $ | 51,856 | |||
47
Table of Contents
3. Long-Term Debt
Long-term debt consists of:
| 2010 | 2009 | |||||||
| In thousands | ||||||||
| Senior secured revolving credit facility expiring in 2012 |
$ | — | $ | — | ||||
| 7.25% Senior notes due 2013 |
||||||||
| Notes issued July 6, 2005 at par value |
250,000 | 250,000 | ||||||
| Additional notes issued August 18, 2008, net of unamortized discount of $13.9 million at May 31, 2010 and $17.6 million at May 31, 2009 (effective interest rate 8.98%) |
286,143 | 282,448 | ||||||
| 536,143 | 532,448 | |||||||
| Capital lease obligations |
2,443 | 9,058 | ||||||
| Other contract obligations |
268 | 277 | ||||||
| 538,854 | 541,783 | |||||||
| Less current portion |
(234 | ) | (243 | ) | ||||
| $ | 538,620 | $ | 541,540 | |||||
Senior Secured Revolving Credit Facility. On June 19, 2009, we amended and restated our credit agreement and the associated security agreement. The credit agreement continues to provide for a $200 million senior secured revolving credit facility with a $50 million sub-limit for letters of credit and a $15 million sub-limit for swing line loans. The credit facility matures on August 15, 2012. Amounts drawn under the credit facility bear annual interest either at the LIBOR rate plus a margin of 3.5% to 4.0% or at a base rate plus a margin of 2.5% to 3.0%. The base rate is the higher of the federal funds rate plus 0.5%, the prime rate established by Bank of America, N.A. or the rate for one-month LIBOR loans plus 1.0%. The interest rate margins are determined based on our leverage ratio. The commitment fee calculated on the unused portion of the credit facility ranges from 0.50% to 0.75% per year based on our leverage ratio. We may terminate the credit facility at any time.
The amount that can be borrowed under the credit facility is limited to an amount based on the value of our consolidated accounts receivable, inventory and mobile equipment. This amount, called the borrowing base, may be less than the $200 million stated principal amount of the credit facility. The borrowing base under our amended agreement was $157.7 million as of May 31, 2010. We are not required to maintain any financial ratios or covenants unless an event of default occurs or the unused portion of the borrowing base is less than $40 million, in which case we must maintain a fixed charge coverage ratio of at least 1.1 to 1.0. At May 31, 2010, our fixed charge coverage ratio was .7 to 1.0. Given this ratio, we may use only $117.7 million of the borrowing base as of such date. No borrowings were outstanding at May 31, 2010; however, $28.5 million of the borrowing base was used to support letters of credit. As a result, the maximum amount we could borrow as of May 31, 2010 was $89.2 million.
All of our consolidated subsidiaries have guaranteed our obligations under the credit facility. The credit facility is secured by first priority security interests in all or most of our existing and future consolidated accounts, inventory, equipment, intellectual property and other personal property, and in all of our equity interests in present and future domestic subsidiaries and 66% of the equity interest in any future foreign subsidiaries, if any.
The credit agreement contains a number of covenants restricting, among other things, prepayment or redemption of our senior notes, distributions and dividends on and repurchases of our capital stock, acquisitions and investments, indebtedness, liens and affiliate transactions. We are permitted to pay cash dividends on our common stock as long as the credit facility is not in default, the fixed charge coverage ratio is greater than 1.1 to 1.0 and borrowing availability under the borrowing base is more than $50 million. On March 24, 2010 we amended our credit agreement such that, when our fixed charge coverage ratio is less than 1.1 to 1.0, we are permitted to pay cash dividends on our common stock not to exceed $2.5 million in any single instance (which
48
Table of Contents
shall not occur more than four times in any calendar year) or $10 million in the aggregate during any calendar year as long as the credit facility is not in default and borrowing availability is more than the greater of $60 million or 30% of the aggregate commitments of all lenders. For this purpose, borrowing availability is equal to the borrowing base less the amount of outstanding borrowings less the amount used to support letters of credit. We were in compliance with all of our loan covenants as of May 31, 2010.
7.25% Senior Notes. On August 18, 2008, we sold $300 million aggregate principal amount of additional 7.25% senior notes at an offering price of 93.25%. The additional notes were issued under our existing indenture dated July 6, 2005. The net proceeds were used to repay our $150 million senior term loan and borrowings outstanding under our senior secured revolving credit facility in the amount of $29.5 million, with additional proceeds available for general corporate purposes. We recognized a loss on debt retirement of $0.9 million representing a write-off of debt issuance costs associated with the mandatory prepayment of the term loan.
At May 31, 2010, we had $550 million aggregate principal amount of 7.25% senior notes outstanding. Under the indenture, we may redeem the notes at premiums of 103.625% beginning July 15, 2009, 101.813% beginning July 15, 2010 and 100% beginning July 15, 2011 and thereafter. If we experience a change of control, we may be required to offer to purchase the notes at a purchase price equal to 101% of the principal amount, plus accrued interest.
All of our consolidated subsidiaries have unconditionally guaranteed the 7.25% senior notes. The indenture governing the notes contains covenants that limit our ability and the ability of our subsidiaries to, among other things, incur additional indebtedness, pay dividends or make other distributions or repurchase or redeem our stock, make investments, sell assets, incur liens, enter into agreements restricting our subsidiaries’ ability to pay dividends, enter into transactions with affiliates and consolidate, merge or sell all or substantially all of our assets. We are not required to maintain any affirmative financial ratios or covenants. We were in compliance with all of our loan covenants as of May 31, 2010.
Other. We entered into a long-term contract with a power supplier in connection with our Oro Grande, California cement plant which included the construction of certain power facilities at the plant. In 2007 and 2008, we recorded additions to property, plant and equipment totaling $9.5 million, representing the fair value of the power facilities and the related capital lease obligation included in the power supply contract. In 2010, based on a review of the actual construction costs incurred by the power supplier, the total contract cost was reduced resulting in a corresponding reduction in the fair market value of the power facilities and the related capital lease obligation of $7.1 million.
Required principal payments on long-term debt, excluding capital lease obligations, for each of the five succeeding years, are none for 2011 through 2013, $550.0 million for 2014 and none for 2015. The total amount of interest paid was $46.4 million in 2010, $34.3 million in 2009 and $24.9 million in 2008. The total amount of interest incurred was $52.2 million in 2010, $47.7 million in 2009 and $29.0 million in 2008, of which none in 2010, $14.4 million in 2009 and $26.5 million in 2008 was capitalized.
4. Commitments
Operating Leases. We lease certain mobile and other equipment, office space and other items which in the normal course of business may be renewed or replaced by subsequent leases. Total expense for such operating leases (other than for mineral rights) amounted to $18.2 million in 2010, $21.7 million in 2009 and $20.1 million in 2008. Non-cancelable operating leases with an initial or remaining term of more than one year totaled $56.7 million at May 31, 2010. Estimated lease payments for each of the five succeeding years are $16.5 million, $8.8 million, $11.9 million, $5.7 million and $3.8 million.
Purchase Obligations. We purchase fuel and other materials for use in our operations under long-term supply contracts that, in certain cases, require minimum amounts of materials be purchased or are subject to minimum transportation charges. In addition, we purchase mining services at our north Texas cement plant under a long-term contract that contains provisions for minimum payments. We expect to utilize these required amounts of material and services in the normal course of business operations. Total cost incurred under contracts
49
Table of Contents
requiring minimum purchases or payments was $24.8 million in 2010, $58.9 million in 2009 and $39.2 million in 2008. Future minimum payments for each of the five succeeding years are $9.5 million for 2011, $8.1 million for 2012, $1.8 million for 2013 and none for 2014 and 2015.
We entered into a long-term contract with a power supplier in connection with our Oro Grande, California cement plant which included the construction of certain power facilities at the plant. We have recognized a capital lease obligation of $2.4 million related to payment obligations under the power supply contract related to these facilities. The total future commitment under the contract, including maintenance services to be provided by the power supplier, related to these facilities was $6.8 million at May 31, 2010. Payments for each of the five succeeding years are $0.4 million per year.
During October 2007, we commenced construction on a project to expand our Hunter, Texas cement plant. In May 2009 we temporarily halted construction on the project because we believed that economic and market conditions made it unlikely that current cement demand levels in Texas would permit the new kiln to operate profitably if the project was completed as originally scheduled. We expect to resume construction by November 2010. We have not entered into a new construction contract to complete the construction, so no schedule for completion has yet been determined. As of May 31, 2010, we have incurred approximately $293.9 million, excluding capitalized interest of approximately $16.3 million related to the project, of which $289.4 million has been expended. Until we determine the period over which the construction will occur, we cannot accurately estimate the cost of completing the project.
5. Shareholders’ Equity
There are authorized 100,000 shares of Cumulative Preferred Stock, no par value, of which 20,000 shares are designated $5 Cumulative Preferred Stock (Voting), redeemable at $105 per share and entitled to $100 per share upon dissolution. An additional 40,000 shares are designated Series B Junior Participating Preferred Stock. The Series B Preferred Stock is not redeemable and ranks, with respect to the payment of dividends and the distribution of assets, junior to (i) all other series of the Preferred Stock unless the terms of any other series shall provide otherwise and (ii) the $5 Cumulative Preferred Stock. No shares of $5 Cumulative Preferred Stock or Series B Junior Participating Preferred Stock were outstanding as of May 31, 2010. Pursuant to a Rights Agreement, in November 2006, we distributed a dividend of one preferred share purchase right for each outstanding share of our Common Stock. Each right entitles the holder to purchase from us one one-thousandth of a share of the Series B Junior Participating Preferred Stock at a price of $300, subject to adjustment. The Rights Agreement was amended effective July 19, 2010 to change the final expiration date of the rights to December 31, 2010, unless the rights are earlier redeemed or exchanged by us pursuant to the Rights Agreement.
6. Stock-Based Compensation Plans
The Texas Industries, Inc. 2004 Omnibus Equity Compensation Plan (the “2004 Plan”) provides that, in addition to other types of awards, non-qualified and incentive stock options to purchase Common Stock may be granted to employees and non-employee directors at market prices at date of grant. In addition, non-qualified and incentive stock options remain outstanding under our 1993 Stock Option Plan.
50
Table of Contents
Options become exercisable in installments beginning one year after the date of grant and expire ten years after the date of grant. The fair value of each option grant was estimated on the date of grant using the Black-Scholes option pricing model. Options with graded vesting are valued as single awards and the compensation cost recognized using a straight-line attribution method over the shorter of the vesting period or required service period adjusted for estimated forfeitures. The following table sets forth the information about the weighted-average grant date fair value of options granted during the three years ended May 31, 2010 and the weighted-average assumptions used for such grants.
| 2010 | 2009 | 2008 | ||||||||||
| Weighted average grant date fair value |
$ | 16.83 | $ | 9.26 | $ | 17.59 | ||||||
| Weighted average assumptions used: |
||||||||||||
| Expected volatility |
.469 | .398 | .317 | |||||||||
| Expected lives |
6.5 | 6.5 | 6.1 | |||||||||
| Risk-free interest rates |
3.20 | % | 1.60 | % | 3.21 | % | ||||||
| Expected dividend yields |
.83 | % | 1.21 | % | .59 | % | ||||||
Expected volatility is based on an analysis of historical volatility of our common stock. Expected lives of options is determined based on the historical share option exercise experience of our optionees. Risk-free interest rates are determined using the implied yield currently available for zero coupon U.S. treasury issues with a remaining term equal to the expected life of the options. Expected dividend yields are based on the approved annual dividend rate in effect and the market price of our common stock at the time of grant.
A summary of option transactions for the three years ended May 31, 2010, follows:
| Shares Under Option |
Weighted-Average Option Price | |||||
| Outstanding at May 31, 2007 |
1,483,035 | 36.31 | ||||
| Granted |
212,850 | 50.63 | ||||
| Exercised |
(212,821 | ) | 30.01 | |||
| Canceled |
(18,233 | ) | 54.49 | |||
| Outstanding at May 31, 2008 |
1,464,831 | 39.08 | ||||
| Granted |
397,700 | 25.15 | ||||
| Exercised |
(233,868 | ) | 22.09 | |||
| Canceled |
(33,906 | ) | 42.25 | |||
| Outstanding at May 31, 2009 |
1,594,757 | 38.03 | ||||
| Granted |
320,450 | 36.15 | ||||
| Exercised |
(122,884 | ) | 25.50 | |||
| Canceled |
(27,807 | ) | 39.20 | |||
| Outstanding at May 31, 2010 |
1,764,516 | $ | 38.54 | |||
Options exercisable at May 31 were 905,066 shares for 2010, 797,662 shares for 2009 and 892,271 shares for 2008 at a weighted-average option price of $39.09, $35.45 and $28.57, respectively. The following table summarizes information about stock options outstanding as of May 31, 2010.
| Range of Exercise Prices | |||||||||
| $16.04-$27.39 | $36.15-$48.60 | $50.63-$70.18 | |||||||
| Options outstanding |
|||||||||
| Shares outstanding |
688,768 | 491,148 | 584,600 | ||||||
| Weighted-average remaining life in years |
5.67 | 7.83 | 6.29 | ||||||
| Weighted-average exercise price |
$ | 22.12 | $ | 39.30 | $ | 57.26 | |||
| Options exercisable |
|||||||||
| Shares exercisable |
389,248 | 169,498 | 346,320 | ||||||
| Weighted-average remaining life in years |
3.47 | 4.47 | 6.09 | ||||||
| Weighted-average exercise price |
$ | 20.20 | $ | 44.92 | $ | 57.47 | |||
51
Table of Contents
Outstanding options expire on various dates to January 13, 2020. Shares reserved for future awards under the 2004 Plan totaled 939,815 at May 31, 2010.
As of May 31, 2010, the aggregate intrinsic value (the difference in the closing market price of our common stock of $36.30 and the exercise price to be paid by the optionee) of stock options outstanding was $9.8 million. The aggregate intrinsic value of exercisable stock options at that date was $6.3 million. The total intrinsic value for options exercised (the difference in the market price of our common stock on the exercise date and the price paid by the optionee to exercise the option) was $1.5 million in 2010, $2.4 million in 2009 and $6.9 million in 2008.
We have provided additional stock-based compensation to employees and directors under stock appreciation rights contracts, deferred compensation agreements, restricted stock payments and a former stock awards program. At May 31, 2010, outstanding stock appreciation rights totaled 133,315 shares, deferred compensation agreements to be settled in cash totaled 100,757 shares, deferred compensation agreements to be settled in common stock totaled 2,070 shares, unvested restricted stock payments totaled 14,667 shares and stock awards totaled 3,499 shares. Other credits included $6.0 million at both May 31, 2010 and May 31, 2009 representing accrued compensation which is expected to be settled in cash. Common stock totaling 2.7 million shares at May 31, 2010 and 2.9 million shares at May 31, 2009 have been reserved for the settlement of stock-based compensation.
Total stock-based compensation included in selling, general and administrative expense (credit) was $5.1 million in 2010, $(4.4) million in 2009 and $2.4 million in 2008. The impact of changes in our company’s stock price on stock-based awards accounted for as liabilities increased stock-based compensation $0.5 million in 2010 and reduced stock-based compensation $8.4 million in 2009 and $2.6 million in 2008. The total tax expense or benefit recognized in our statements of operations for stock-based compensation was a benefit of $1.0 million in 2010 and an expense of $2.4 million in 2009 and less than $0.1 million in 2008. The total tax benefit realized for stock-based compensation was $0.7 million in 2010, $2.0 million in 2009 and $3.7 million in 2008.
As of May 31, 2010, $10.5 million of total unrecognized compensation cost related to stock options, restricted stock payments and stock awards is expected to be recognized. We currently expect to recognize approximately $3.9 million of this stock-based compensation expense in 2011, $2.9 million in 2012, $1.9 million in 2013, $1.3 million in 2014 and $0.5 million in 2015.
7. Retirement Plans
Defined Benefit Plans. Approximately 600 employees and retirees of our subsidiary, Riverside Cement Company, are covered by a defined benefit pension plan and a postretirement health benefit plan. In addition, substantially all of our executive and certain managerial employees are covered by a series of financial security plans that are non-qualified defined benefit plans providing retirement and death benefits. We use a measurement date of May 31 for all of our pension and postretirement benefit plans.
The pension and other benefit obligations recognized on our consolidated balance sheets totaled $72.1 million at May 31, 2010 and $60.1 million at May 31, 2009, of which $3.3 million at May 31, 2010 and $3.7 million at May 31, 2009 were classified as current liabilities.
The cumulative postretirement benefit plan adjustment recognized as other comprehensive loss on our consolidated balance sheets totaled $14.2 million (net of tax of $8.2 million) at May 31, 2010 and $13.7 million (net of tax of $7.9 million) at May 31, 2009.
52
Table of Contents
The pretax changes in accumulated other comprehensive loss consist of the following:
| Pension Benefits | Other Benefits | |||||||||||||||
| 2010 | 2009 | 2010 | 2009 | |||||||||||||
| In thousands | ||||||||||||||||
| Net actuarial loss at beginning of year |
$ | 20,806 | $ | 10,628 | $ | 6,631 | $ | 7,405 | ||||||||
| Amortization of actuarial loss |
(2,000 | ) | (699 | ) | (603 | ) | (672 | ) | ||||||||
| Current period net actuarial loss (gain) |
2,215 | 10,877 | 354 | (102 | ) | |||||||||||
| Net actuarial loss at the end of year |
$ | 21,021 | $ | 20,806 | $ | 6,382 | $ | 6,631 | ||||||||
| Net prior service credit at beginning of year |
$ | — | $ | — | $ | (5,869 | ) | $ | (6,736 | ) | ||||||
| Amortization of prior service credit |
— | — | 774 | 785 | ||||||||||||
| Plan amendments |
— | — | — | 82 | ||||||||||||
| Net prior service credit at the end of year |
$ | — | $ | — | $ | (5,095 | ) | $ | (5,869 | ) | ||||||
The pretax amounts in accumulated other comprehensive loss expected to be recognized as components of net periodic postretirement benefit cost (credit) in 2011 are as follows:
| Pension Benefits |
Other Benefits |
||||||
| In thousands | |||||||
| Net actuarial loss |
$ | 2,068 | $ | 614 | |||
| Prior service credit |
— | (775 | ) | ||||
| $ | 2,068 | $ | (161 | ) | |||
Riverside Defined Benefit Plans. The amount of the defined benefit pension plan and postretirement health benefit plan expense charged to costs and expenses was as follows:
| Defined Pension Benefit | Health Benefit | |||||||||||||||||||||||
| 2010 | 2009 | 2008 | 2010 | 2009 | 2008 | |||||||||||||||||||
| In thousands | ||||||||||||||||||||||||
| Service cost |
$ | 457 | $ | 717 | $ | 576 | $ | 106 | $ | 87 | $ | 121 | ||||||||||||
| Interest cost |
3,166 | 3,165 | 2,780 | 466 | 438 | 398 | ||||||||||||||||||
| Expected return on plan assets |
(2,342 | ) | (3,251 | ) | (3,526 | ) | — | — | ||||||||||||||||
| Amortization of prior service credit |
— | — | — | (774 | ) | (785 | ) | (845 | ) | |||||||||||||||
| Amortization of net actuarial loss |
2,000 | 699 | 220 | 603 | 672 | 656 | ||||||||||||||||||
| Curtailments |
— | — | — | — | — | (436 | ) | |||||||||||||||||
| $ | 3,281 | $ | 1,330 | $ | 50 | $ | 401 | $ | 412 | $ | (106 | ) | ||||||||||||
| Weighted average assumptions used to |
||||||||||||||||||||||||
| Assumed discount rate |
6.80 | % | 6.70 | % | 6.15 | % | 6.80 | % | 6.71 | % | 6.15 | % | ||||||||||||
| Assumed long-term rate of return on pension plan assets |
8.25 | % | 8.25 | % | 8.50 | % | — | — | — | |||||||||||||||
| Average long-term pay progression |
3.00 | % | 3.00 | % | 3.00 | % | — | — | — | |||||||||||||||
Unrecognized prior service costs and credits and actuarial gains or losses for these plans are recognized in a systematic manner over the remaining service periods of active employees expected to receive benefits under these plans. During 2008, our defined benefit pension plan and postretirement health benefit plan were amended effective June 24, 2007, such that a union employee hired after June 24, 2007 is no longer eligible to participate in the pension plan and is not eligible for postretirement medical and/or life insurance benefits. For existing union employees retiring on or after June 24, 2007, the limit on the total annual cost of the retiree’s and dependent’s health insurance to be paid by us was increased by amendments effective on June 24, 2007 and April 1, 2009. In addition, work force reductions occurred in connection with the start up of our new Oro Grande cement plant resulting in a curtailment of pension and postretirement health plan benefits. Approximately $400,000 in prior service cost credits related to the postretirement health benefit plan was immediately recognized.
53
Table of Contents
We contribute amounts sufficient to meet minimum funding requirements as set forth in employee benefit and tax laws plus such additional amounts as are considered appropriate. We expect to make contributions of $3.1 million in 2011.
Obligation and asset data for the defined benefit pension plan and postretirement health benefit plan at May 31 were as follows:
| Defined Pension Benefit |
Health Benefit | |||||||||||||||
| 2010 | 2009 | 2010 | 2009 | |||||||||||||
| In thousands | ||||||||||||||||
| Change in projected benefit obligation |
||||||||||||||||
| Benefit obligation at beginning of year |
$ | 47,390 | $ | 47,699 | $ | 6,932 | $ | 6,625 | ||||||||
| Service cost |
457 | 717 | 106 | 87 | ||||||||||||
| Interest cost |
3,166 | 3,165 | 466 | 438 | ||||||||||||
| Participant contributions |
— | — | 201 | 194 | ||||||||||||
| Benefits paid |
(2,745 | ) | (2,340 | ) | (405 | ) | (392 | ) | ||||||||
| Actuarial loss (gain) |
5,299 | (1,851 | ) | 354 | (102 | ) | ||||||||||
| Plan amendments |
— | — | — | 82 | ||||||||||||
| Benefit obligation at end of year |
$ | 53,567 | $ | 47,390 | $ | 7,654 | $ | 6,932 | ||||||||
| Change in plan assets |
||||||||||||||||
| Fair value of plan assets at beginning of year |
$ | 29,063 | $ | 40,578 | $ | — | $ | — | ||||||||
| Actual return on plan assets |
5,426 | (9,478 | ) | — | — | |||||||||||
| Employer contributions |
1,336 | 303 | 204 | 198 | ||||||||||||
| Benefits paid |
(2,745 | ) | (2,340 | ) | (204 | ) | (198 | ) | ||||||||
| Fair value of plan assets at end of year |
$ | 33,080 | $ | 29,063 | $ | — | $ | — | ||||||||
| Benefit obligation/funded status at end of year |
$ | (20,487 | ) | $ | (18,327 | ) | $ | (7,654 | ) | $ | (6,932 | ) | ||||
| Weighted average assumptions used to determine benefit obligations |
||||||||||||||||
| Assumed discount rate |
5.60 | % | 6.80 | % | 5.60 | % | 6.80 | % | ||||||||
| Average long-term pay progression |
3.00 | % | 3.00 | % | — | — | ||||||||||
Accumulated benefit obligation for the defined benefit pension plan was $52.4 million at May 31, 2010 and $45.5 million at May 31, 2009.
The estimated future benefit payments under the defined benefit pension plan for each of the five succeeding years are $2.9 million, $3.1 million, $3.3 million, $3.4 million and $3.6 million and for the five-year period thereafter an aggregate of $19.5 million.
Authoritative accounting guidance for fair value measures provides a framework for measuring fair value. The framework establishes a three-level value hierarchy based on the nature of the information used to measure fair value. The fair value of all the defined benefit pension plan assets is based on quoted prices in active markets for identical assets which are considered Level 1 inputs within the hierarchy. The total estimated fair value of the plan assets at May 31 were as follows:
| 2010 | 2009 | |||||
| In thousands | ||||||
| Cash and cash equivalents |
$ | 978 | $ | 1,132 | ||
| Mutual funds |
||||||
| Equity |
18,603 | 17,554 | ||||
| Fixed income |
13,498 | 10,376 | ||||
| Other |
1 | 1 | ||||
| Fair value of plan assets at end of year |
$ | 33,080 | $ | 29,063 | ||
54
Table of Contents
The plan fiduciaries set the long-term strategic investment objectives for the defined benefit pension plan assets. The objectives include preserving the funded status of the trust and balancing risk and return. Investment performance and plan asset mix are periodically reviewed with external consultants. Plan assets are currently allocated to the fixed income and equity categories of investments in a manner that varies in the short term, but has a long term objective of averaging approximately 60% in equity securities and 40% in fixed income securities. Within these categories, investments are allocated to multiple asset classes. The expected long-term rate of return on plan assets of 8.25% for 2010 was determined by considering historical and expected returns for each asset class and the effect of periodic asset rebalancing and, for underperforming assets, reallocations. The current allocation of plan assets has a long-term historical rate of return that exceeds the plan objectives. While historical returns are not guarantees of future performance, these allocations are expected to meet the objectives of the plan.
The actual defined benefit pension plan asset allocation at May 31, 2010 and 2009, and the target asset allocation for 2011, by asset category were as follows
| % of Plan Assets |
2010 | 2009 | Target 2011 | ||||||
| Equity securities |
59 | % | 62 | % | 60 | % | |||
| Fixed income securities |
41 | % | 38 | % | 40 | % | |||
| 100 | % | 100 | % | 100 | % | ||||
The assumed health care cost trend rate for the next year attributed to all participant age groups is 8.5% declining to an ultimate trend rate of 6% in 2015. The effect of increasing or decreasing the health care cost trend rates by one percentage point would increase or decrease the health benefit obligation by approximately $330,000 and the plan expense by approximately $30,000.
The estimated future benefit payments under the postretirement health benefit plan for each of the five succeeding years are $0.4 million, $0.4 million, $0.4 million, $0.5 million and $0.5 million and for the five-year period thereafter an aggregate of $2.8 million.
Financial Security Defined Benefit Plans. The amount of financial security plan benefit expense and the projected financial security plan benefit obligation are determined using assumptions as of the end of the year. The weighted-average discount rate used was 5.34% in 2010 and 6.74% in 2009. Actuarial gains or losses are recognized when incurred, and therefore, the end of year benefit obligation is the same as the accrued benefit costs recognized in the consolidated balance sheet.
In 2010, it was discovered that our actuarial assumptions for certain participants failed to consider that these participants will receive their defined benefit for a minimum of 15 years or life. Previously, our calculations had incorrectly assumed that the payments to these participants ceased after 15 years. We have recomputed the defined benefit liability for these participants and have accordingly recognized a charge of $4.4 million in 2010 to record the additional liability. Management estimates that $3.4 million of this additional liability relates to years prior to 2010. This $3.4 million would have accumulated over time since the year 2000. The $1.0 million increase related to 2010 was primarily a function of the decreased discount rate in 2010 compared to the discount rate in 2009. Management determined that the amount related to prior years was not material to the financial statements and the entire change has been recognized in selling, general and administrative expense in 2010.
The amount of financial security plan benefit expense charged to costs and expenses was as follows:
| 2010 | 2009 | 2008 | ||||||||||
| In thousands | ||||||||||||
| Service cost |
$ | 1,673 | $ | 1,866 | $ | 3,045 | ||||||
| Interest cost |
2,289 | 2,196 | 1,950 | |||||||||
| Recognized actuarial loss (gain) |
3,854 | 617 | 1,337 | |||||||||
| Recognized actuarial loss adjustment |
4,441 | — | — | |||||||||
| Participant contributions |
(412 | ) | (380 | ) | (389 | ) | ||||||
| $ | 11,845 | $ | 4,299 | $ | 5,943 | |||||||
55
Table of Contents
The following provides a reconciliation of the financial security plan benefit obligation.
| 2010 | 2009 | |||||||
| In thousands | ||||||||
| Change in projected benefit obligation |
||||||||
| Benefit obligation at beginning of year |
$ | 34,868 | $ | 33,242 | ||||
| Service cost |
1,673 | 1,866 | ||||||
| Interest cost |
2,289 | 2,196 | ||||||
| Recognized actuarial loss (gain) |
3,854 | 617 | ||||||
| Recognized actuarial loss adjustment |
4,441 | — | ||||||
| Benefits paid |
(3,166 | ) | (3,069 | ) | ||||
| Other |
— | 16 | ||||||
| Benefit obligation/funded status at end of year |
$ | 43,959 | $ | 34,868 | ||||
The estimated future benefit payments under the financial security plans for each of the five succeeding years are $2.9 million, $2.7 million, $3.1 million, $3.7 million and $3.9 million and for the five-year period thereafter an aggregate of $22.2 million.
Defined Contribution Plans. Substantially all of our employees are covered by a series of defined contribution retirement plans. The amount of pension expense charged to costs and expenses for these plans was $2.8 million in 2010, $4.5 million in 2009 and $6.0 million in 2008. It is our policy to fund the plans to the extent of charges to income.
8. Income Taxes
The provisions (benefit) for income taxes are composed of:
| 2010 | 2009 | 2008 | |||||||||
| In thousands | |||||||||||
| Current |
$ | (14,006 | ) | $ | (10,836 | ) | $ | 19,692 | |||
| Deferred |
(9,132 | ) | (1,938 | ) | 20,036 | ||||||
| $ | (23,138 | ) | $ | (12,774 | ) | $ | 39,728 | ||||
A reconciliation of income taxes at the federal statutory rate to the preceding provisions (benefit) follows:
| 2010 | 2009 | 2008 | ||||||||||
| In thousands | ||||||||||||
| Taxes at statutory rate |
$ | (21,697 | ) | $ | (10,647 | ) | $ | 44,805 | ||||
| Additional depletion |
(3,128 | ) | (5,213 | ) | (6,603 | ) | ||||||
| State income taxes |
(862 | ) | 197 | 1,798 | ||||||||
| Nontaxable insurance benefits |
(1,012 | ) | (736 | ) | (463 | ) | ||||||
| Qualified domestic production activities |
2,085 | — | (1,225 | ) | ||||||||
| Stock-based compensation |
863 | 763 | 882 | |||||||||
| Goodwill |
— | 1,893 | — | |||||||||
| Other—net |
613 | 969 | 534 | |||||||||
| $ | (23,138 | ) | $ | (12,774 | ) | $ | 39,728 | |||||
56
Table of Contents
The components of the net deferred tax liability at May 31 are summarized below.
| 2010 | 2009 | |||||||
| In thousands | ||||||||
| Deferred tax assets |
||||||||
| Deferred compensation |
$ | 20,654 | $ | 16,964 | ||||
| Inventory costs |
4,764 | 2,737 | ||||||
| Accrued expenses not currently tax deductible |
8,775 | 8,222 | ||||||
| Goodwill |
3,271 | 4,351 | ||||||
| Other comprehensive income |
8,158 | 7,888 | ||||||
| Alternative minimum tax credit carryforward |
29,060 | 24,366 | ||||||
| Net operating loss carryforward |
3,676 | — | ||||||
| Other |
2,883 | 788 | ||||||
| Total deferred tax assets |
81,241 | 65,316 | ||||||
| Deferred tax liabilities |
||||||||
| Property, plant and equipment |
91,425 | 86,381 | ||||||
| Deferred real estate gains |
14,504 | 14,504 | ||||||
| Other |
3,088 | 1,637 | ||||||
| Total deferred tax liabilities |
109,017 | 102,522 | ||||||
| Net deferred tax liability |
27,776 | 37,206 | ||||||
| Less current deferred tax asset |
(12,341 | ) | (10,547 | ) | ||||
| Long-term deferred tax liability |
$ | 40,117 | $ | 47,753 | ||||
We made income tax payments of $0.4 million in 2010, $3.2 million in 2009 and $26.8 million in 2008, and received income tax refunds of $16.8 million in 2010, $13.5 million in 2009, and $0.6 million in 2008.
As of May 31, 2010, we had an alternative minimum tax credit carryforward of $29.1 million. The credit, which does not expire, is available for offset against future regular federal income tax. We have a $4.8 million federal net operating loss carryforward. The net federal operating loss may be carried forward twenty years and offset against future federal taxable income. We also have a tax benefit of $2.0 million from state net operating losses that may be carried forward from five to twenty years. Management believes it is more likely than not that the deferred tax assets will be realized.
Under special tax rules (the Section 382 Limitation), cumulative stock ownership changes among material shareholders exceeding fifty percent during a three-year period can potentially limit a company’s future use of net operating losses, tax credits and certain “built-in losses” or deductions (tax attributes). The Section 382 Limitation may be increased by certain “built-in gains” as provided by current IRS guidance. We had an ownership change in 2009. However, the Section 382 Limitation does not impact the recorded value of deferred taxes or realization of our tax attributes.
The American Jobs Creation Act of 2004, among other things, allows a deduction for income from qualified domestic production activities, which will be phased in from 2005 through 2010. No benefit from the deduction was realized in 2008 and 2007 due to the carry back of 2010 and 2009 net operating losses.
In addition to our federal income tax return, we file income tax returns in various state jurisdictions. We are no longer subject to income tax examinations by federal tax authorities for years prior to 2007 and state tax authorities for years prior to 2007. The examination of our federal income tax returns for 2004 through 2006 was completed in February, 2009. The results of this audit did not have a material effect on our financial position or results of operations.
9. Legal Proceedings and Contingent Liabilities
We are subject to federal, state and local environmental laws, regulations and permits concerning, among other matters, air emissions and wastewater discharge. We intend to comply with these laws, regulations and
57
Table of Contents
permits. However, from time to time we receive claims from federal and state environmental regulatory agencies and entities asserting that we are or may be in violation of certain of these laws, regulations and permits, or from private parties alleging that our operations have injured them or their property. It is possible that we could be held liable for future charges which might be material but are not currently known or estimable. In addition, changes in federal or state laws, regulations or requirements or discovery of currently unknown conditions could require additional expenditures by us.
In March 2008, the South Coast Air Quality Management District, or SCAQMD, informed one of our subsidiaries, Riverside Cement Company (Riverside), that it believed that operations at the Crestmore cement plant in Riverside, California caused the level of hexavalent chromium, or chrome 6, in the air in the vicinity of the plant to be elevated above ambient air levels. Chrome 6 has been identified by the State of California as a carcinogen. Riverside immediately began taking steps, in addition to its normal dust control procedures, to reduce dust from plant operations and eliminate the use of open clinker stockpiles. In February 2008, the SCAQMD placed an air monitoring station at the downwind property line closest to the open clinker stockpiles. In the SCAQMD’s first public report of the results of its monitoring, over the period of February 12 to April 9, 2008, the average level of chrome 6 was 2.43 nanograms per cubic meter, or ng/m³. Since that time, the average level has decreased. The average levels of chrome 6 reported by the SCAQMD at all of the air monitoring stations in areas around the plant, including the station at the property line, are below 1.0 ng/m³ over the entire period of time it has operated the stations. The SCAQMD compared the level of exposure at the air monitor on our property line with the following employee exposure standards established by regulatory agencies:
| Occupational Safety and Health Administration |
5,000 ng/m³ | |
| National Institute for Occupational Safety and Health |
1,000 ng/m³ | |
| California Environmental Protection Agency |
200 ng/m³ |
In public meetings conducted by the SCAQMD, it stated that the risk of long term exposure immediately adjacent to the plant is similar to living close to a busy freeway or rail yard, and it estimated an increased risk of 250 to 500 cancers per one million people, assuming continuous exposure for 70 years. Riverside has not determined how this particular risk number was calculated by SCAQMD. However, the Riverside Press Enterprise reported in a May 30, 2008 story that “John Morgan, a public health and epidemiology professor at Loma Linda University, said he looked at cancer cases reported from 1996 to 2005 in the … census [tract] nearest the [plant] and found no excess cases. That includes lung cancer, which is associated with exposure to hexavalent chromium.”
In late April 2008, a lawsuit was filed in Riverside County Superior Court of the State of California styled Virginia Shellman, et al. v. Riverside Cement Holdings Company, et al. The lawsuit against three of our subsidiaries purports to be a class action complaint for medical monitoring for a putative class defined as individuals who were allegedly exposed to chrome 6 emissions from our Crestmore cement plant. The complaint alleges an increased risk of future illness due to the exposure to chrome 6 and other toxic chemicals. The suit requests, among other things, establishment and funding of a medical testing and monitoring program for the class until their exposure to chrome 6 is no longer a threat to their health, as well as punitive and exemplary damages.
Since the Shellman lawsuit was filed, five additional putative class action lawsuits have been filed in the same court. The putative class in each of these cases is the same as or a subset of the putative class in the Shellman case, and the allegations and requests for relief are similar to those in the Shellman case. As a consequence, the court has stayed four of these lawsuits until the Shellman lawsuit is finally determined.
Since August 2008, 25 additional lawsuits have been filed in the same court against us or one or more of our subsidiaries containing allegations of personal injury and wrongful death by over 2,700 individual plaintiffs who were allegedly exposed to chrome 6 and other toxic or harmful substances in the air, water and soil caused by emissions from the Crestmore plant. The plaintiffs allege causes of action that vary somewhat from suit to suit, but typically include, among other things, negligence, intentional and negligent infliction of emotional distress, trespass, public and private nuisance, strict liability, willful misconduct, fraudulent concealment, wrongful death and loss of consortium. The plaintiffs generally request, among other things, general and punitive damages,
58
Table of Contents
medical expenses, loss of earnings, property damages and medical monitoring costs. Some of the suits include additional defendants, such as the owner of another cement plant located approximately four miles from the Crestmore plant.
Since January 2009, seven lawsuits have been filed against us or one or more of our subsidiaries in the same court involving similar allegations, causes of action and requests for relief, but with respect to our Oro Grande, California cement plant instead of the Crestmore plant. The suits involve approximately 300 individual plaintiffs. Prior to the filing of the lawsuits, the air quality management district in whose jurisdiction the plant lies conducted air sampling from locations around the plant. None of the samples contained chrome 6 levels above 1.0 ng/m³.
At the date of this report, none of the plaintiffs in these cases has alleged any specific amount or range of damages. We will vigorously defend all of these suits but we cannot predict what liability, if any, could arise from them. We also cannot predict whether any other suits may be filed against us alleging damages due to injuries to persons or property caused by claimed exposure to chrome 6.
We are defendants in other lawsuits that arose in the ordinary course of business. In our judgment the ultimate liability, if any, from such legal proceedings will not have a material effect on our consolidated financial position or results of operations.
59
Table of Contents
10. Business Segments
We have three business segments: cement, aggregates and consumer products. Our business segments are managed separately along product lines. Through the cement segment we produce and sell gray portland cement as our principal product, as well as specialty cements. Through the aggregates segment we produce and sell stone, sand and gravel as our principal products, as well as expanded shale and clay lightweight aggregates. Through the consumer products segment we produce and sell ready-mix concrete as our principal product, as well as packaged concrete mix, mortar, sand and related products. We account for intersegment sales at market prices. Segment operating profit consists of net sales less operating costs and expenses. Corporate includes those administrative, financial, legal, human resources, environmental and real estate activities which are not allocated to operations and are excluded from segment operating profit. Identifiable assets by segment are those assets that are used in each segment’s operation. Corporate assets consist primarily of cash and cash equivalents, real estate and other financial assets not identified with a business segment. We no longer report “Unallocated overhead and other income–net” as a separate part of total segment operating profit. Engineering and other income items previously reported in “Unallocated overhead and other income–net” are reported in our cement segment. Environmental and other remaining overhead items previously reported in “Unallocated overhead and other income–net” are reported in corporate. Prior period information has been reclassified to conform to the current period presentation.
The following is a summary of operating results and certain other financial data for our business segments.
| 2010 | 2009 | 2008 | ||||||||||
| In thousands | ||||||||||||
| Net sales |
||||||||||||
| Cement |
||||||||||||
| Sales to external customers |
$ | 249,366 | $ | 332,689 | $ | 424,199 | ||||||
| Intersegment sales |
45,147 | 62,631 | 80,553 | |||||||||
| Aggregates |
||||||||||||
| Sales to external customers |
143,045 | 200,623 | 239,494 | |||||||||
| Intersegment sales |
21,902 | 36,868 | 45,836 | |||||||||
| Consumer products |
||||||||||||
| Sales to external customers |
228,653 | 305,890 | 365,161 | |||||||||
| Intersegment sales |
2,730 | 3,531 | 4,072 | |||||||||
| Eliminations |
(69,779 | ) | (103,030 | ) | (130,461 | ) | ||||||
| Total net sales |
$ | 621,064 | $ | 839,202 | $ | 1,028,854 | ||||||
| Segment operating profit (loss) |
||||||||||||
| Cement |
$ | 13,996 | $ | (15,941 | ) | $ | 102,177 | |||||
| Aggregates |
13,801 | 34,229 | 55,623 | |||||||||
| Consumer products |
3,657 | 8,863 | 11,583 | |||||||||
| Total segment operating profit |
31,454 | 27,151 | 169,383 | |||||||||
| Corporate |
(41,205 | ) | (23,379 | ) | (39,519 | ) | ||||||
| Interest |
(52,240 | ) | (33,286 | ) | (2,505 | ) | ||||||
| Loss on debt retirements |
— | (907 | ) | — | ||||||||
| Income (loss) from continuing operations before income taxes |
$ | (61,991 | ) | $ | (30,421 | ) | $ | 127,359 | ||||
60
Table of Contents
| 2010 | 2009 | 2008 | |||||||
| In thousands | |||||||||
| Identifiable assets |
|||||||||
| Cement |
$ | 1,093,301 | $ | 1,149,320 | $ | 1,044,798 | |||
| Aggregates |
229,084 | 236,727 | 220,474 | ||||||
| Consumer products |
85,641 | 95,310 | 120,063 | ||||||
| Corporate |
123,721 | 91,187 | 146,199 | ||||||
| Total assets |
$ | 1,531,747 | $ | 1,572,544 | $ | 1,531,534 | |||
| Depreciation, depletion and amortization |
|||||||||
| Cement |
$ | 35,828 | $ | 37,799 | $ | 25,645 | |||
| Aggregates |
19,873 | 21,919 | 21,166 | ||||||
| Consumer products |
7,065 | 7,434 | 7,998 | ||||||
| Corporate |
1,159 | 1,040 | 768 | ||||||
| Total depreciation, depletion and amortization |
$ | 63,925 | $ | 68,192 | $ | 55,577 | |||
| Capital expenditures |
|||||||||
| Cement |
$ | 7,672 | $ | 242,148 | $ | 266,990 | |||
| Aggregates |
5,293 | 41,068 | 31,849 | ||||||
| Consumer products |
564 | 4,770 | 12,190 | ||||||
| Corporate |
130 | 558 | 1,496 | ||||||
| Total capital expenditures |
$ | 13,659 | $ | 288,544 | $ | 312,525 | |||
| Net sales by product |
|||||||||
| Cement |
$ | 221,068 | $ | 301,827 | $ | 388,136 | |||
| Stone, sand and gravel |
69,081 | 99,206 | 127,399 | ||||||
| Ready-mix concrete |
175,581 | 247,766 | 310,170 | ||||||
| Other products |
95,928 | 113,006 | 118,347 | ||||||
| Delivery fees |
59,406 | 77,397 | 84,802 | ||||||
| Total net sales |
$ | 621,064 | $ | 839,202 | $ | 1,028,854 | |||
All sales were made in the United States during the periods presented with no single customer representing more than 10 percent of sales. All of our identifiable assets are located in the United States.
Cement segment operating profit includes $3.4 million in 2010, $1.7 million in 2009 and $3.9 million in 2008 from sales of emission credits associated with our Crestmore cement plant in Riverside, Califonia. Operating profit in 2009 includes $2.8 million in lease bonus payments received upon the execution of oil and gas lease agreements on property we own in north Texas. In addition, operating profit includes the recognition as of May 31, 2009 of a goodwill impairment charge of $58.4 million.
Aggregates segment operating profit includes gains of $5.0 million in 2009 and $15.2 million in 2008 from sales of operating assets and real estate associated with our aggregate operations in north Texas and south Louisiana.
Cement capital expenditures, including capitalized interest, incurred in connection with the expansion of our Hunter, Texas cement plant were $5.3 million in 2010, $222.1 million in 2009 and $71.6 million in 2008. In addition, cement capital expenditures, including capitalized interest, incurred in connection with the expansion and modernization of our Oro Grande, California cement plant were $1.3 million in 2009 and $176.0 million in 2008. Other capital expenditures incurred represent normal replacement and upgrades of existing equipment and acquisitions to sustain existing operations in each segment.
61
Table of Contents
11. Condensed Consolidating Financial Information
On July 6, 2005 and August 18, 2008, Texas Industries, Inc. (the parent company) issued $250 million and $300 million aggregate principal amounts of its 7.25% Senior Notes, respectively. All existing consolidated subsidiaries of the parent company are 100% owned and provide a joint and several, full and unconditional guarantee of the securities. There are no significant restrictions on the parent company’s ability to obtain funds from any of the guarantor subsidiaries in the form of a dividend or loan. Additionally, there are no significant restrictions on a guarantor subsidiary’s ability to obtain funds from the parent company or its direct or indirect subsidiaries.
The following condensed consolidating balance sheets, statements of operations and statements of cash flows are provided for the parent company and all guarantor subsidiaries. The information has been presented as if the parent company accounted for its ownership of the guarantor subsidiaries using the equity method of accounting. Prior period information has been reclassified to conform to the current period presentation.
| Texas Industries, Inc. |
Guarantor Subsidiaries |
Eliminating Entries |
Consolidated | |||||||||||
| In thousands | ||||||||||||||
| Condensed consolidating balance sheet at May 31, 2010 |
|
|||||||||||||
| Cash and cash equivalents |
$ | 72,492 | $ | 2,454 | $ | — | $ | 74,946 | ||||||
| Receivables—net |
13,253 | 98,931 | — | 112,184 | ||||||||||
| Inventories |
— | 142,419 | — | 142,419 | ||||||||||
| Deferred income taxes and prepaid expenses |
152 | 23,274 | — | 23,426 | ||||||||||
| Total current assets |
85,897 | 267,078 | — | 352,975 | ||||||||||
| Property, plant and equipment—net |
— | 1,154,509 | — | 1,154,509 | ||||||||||
| Goodwill |
— | 1,715 | — | 1,715 | ||||||||||
| Real estate and investments |
767 | 6,007 | — | 6,774 | ||||||||||
| Deferred charges and other |
8,805 | 6,969 | — | 15,774 | ||||||||||
| Investment in subsidiaries |
945,210 | — | (945,210 | ) | — | |||||||||
| Long-term intercompany receivables |
288,174 | 18,755 | (306,929 | ) | — | |||||||||
| Total assets |
$ | 1,328,853 | $ | 1,455,033 | $ | (1,252,139 | ) | $ | 1,531,747 | |||||
| Accounts payable |
$ | 84 | $ | 56,130 | $ | — | $ | 56,214 | ||||||
| Accrued interest, compensation and other |
18,725 | 32,730 | — | 51,455 | ||||||||||
| Current portion of long-term debt |
— | 234 | — | 234 | ||||||||||
| Total current liabilities |
18,809 | 89,094 | — | 107,903 | ||||||||||
| Long-term debt |
536,411 | 2,209 | — | 538,620 | ||||||||||
| Long-term intercompany payables |
18,755 | 288,174 | (306,929 | ) | — | |||||||||
| Deferred income taxes and other credits |
(6,370 | ) | 130,346 | — | 123,976 | |||||||||
| Shareholders’ equity |
761,248 | 945,210 | (945,210 | ) | 761,248 | |||||||||
| Total liabilities and shareholders’ equity |
$ | 1,328,853 | $ | 1,455,033 | $ | (1,252,139 | ) | $ | 1,531,747 | |||||
62
Table of Contents
| Texas Industries, Inc. |
Guarantor Subsidiaries |
Eliminating Entries |
Consolidated | |||||||||||||
| In thousands | ||||||||||||||||
| Condensed consolidating balance sheet at May 31, 2009 |
|
|||||||||||||||
| Cash and cash equivalents |
$ | 17,226 | $ | 2,570 | $ | — | $ | 19,796 | ||||||||
| Receivables—net |
14,707 | 114,725 | — | 129,432 | ||||||||||||
| Inventories |
— | 155,724 | — | 155,724 | ||||||||||||
| Deferred income taxes and prepaid expenses |
426 | 21,613 | — | 22,039 | ||||||||||||
| Total current assets |
32,359 | 294,632 | — | 326,991 | ||||||||||||
| Property, plant and equipment—net |
— | 1,219,351 | — | 1,219,351 | ||||||||||||
| Goodwill |
— | 1,715 | — | 1,715 | ||||||||||||
| Real estate and investments |
3,965 | 6,036 | — | 10,001 | ||||||||||||
| Deferred charges and other |
8,997 | 5,489 | — | 14,486 | ||||||||||||
| Investment in subsidiaries |
940,982 | — | (940,982 | ) | — | |||||||||||
| Long-term intercompany receivables |
383,886 | 18,759 | (402,645 | ) | — | |||||||||||
| Total assets |
$ | 1,370,189 | $ | 1,545,982 | $ | (1,343,627 | ) | $ | 1,572,544 | |||||||
| Accounts payable |
$ | 74 | $ | 55,675 | $ | — | $ | 55,749 | ||||||||
| Accrued interest, compensation and other |
19,773 | 32,083 | — | 51,856 | ||||||||||||
| Current portion of long-term debt |
— | 243 | — | 243 | ||||||||||||
| Total current liabilities |
19,847 | 88,001 | — | 107,848 | ||||||||||||
| Long-term debt |
532,725 | 8,815 | — | 541,540 | ||||||||||||
| Long-term intercompany payables |
18,759 | 383,886 | (402,645 | ) | — | |||||||||||
| Deferred income taxes and other credits |
(4,287 | ) | 124,298 | — | 120,011 | |||||||||||
| Shareholders’ equity |
803,145 | 940,982 | (940,982 | ) | 803,145 | |||||||||||
| Total liabilities and shareholders’ equity |
$ | 1,370,189 | $ | 1,545,982 | $ | (1,343,627 | ) | $ | 1,572,544 | |||||||
| Condensed consolidating statement of operations for the year ended May 31, 2010 |
|
|||||||||||||||
| Net sales |
$ | — | $ | 621,064 | $ | — | $ | 621,064 | ||||||||
| Cost of products sold |
— | 562,066 | — | 562,066 | ||||||||||||
| Gross profit |
— | 58,998 | — | 58,998 | ||||||||||||
| Selling, general and administrative |
14,973 | 64,442 | — | 79,415 | ||||||||||||
| Goodwill impairment |
— | — | — | — | ||||||||||||
| Interest |
53,114 | 2,626 | (3,500 | ) | 52,240 | |||||||||||
| Loss on debt retirements |
— | — | — | — | ||||||||||||
| Other income |
(39 | ) | (10,627 | ) | — | (10,666 | ) | |||||||||
| Intercompany other income |
(3,500 | ) | — | 3,500 | — | |||||||||||
| 64,548 | 56,441 | — | 120,989 | |||||||||||||
| Income (loss) before the following items |
(64,548 | ) | 2,557 | — | (61,991 | ) | ||||||||||
| Income taxes (benefit) |
(21,247 | ) | (1,891 | ) | — | (23,138 | ) | |||||||||
| (43,301 | ) | 4,448 | — | (38,853 | ) | |||||||||||
| Equity in earnings (loss) of subsidiaries |
4,448 | — | (4,448 | ) | — | |||||||||||
| Net income (loss) |
$ | (38,853 | ) | $ | 4,448 | $ | (4,448 | ) | $ | (38,853 | ) | |||||
63
Table of Contents
| Texas Industries, Inc. |
Guarantor Subsidiaries |
Eliminating Entries |
Consolidated | |||||||||||||
| In thousands | ||||||||||||||||
| Condensed consolidating statement of operations for the year ended May 31, 2009 |
|
|||||||||||||||
| Net sales |
$ | — | $ | 839,202 | $ | — | $ | 839,202 | ||||||||
| Cost of products sold |
— | 726,133 | — | 726,133 | ||||||||||||
| Gross profit |
— | 113,069 | — | 113,069 | ||||||||||||
| Selling, general and administrative |
2,671 | 69,422 | — | 72,093 | ||||||||||||
| Goodwill impairment |
— | 58,395 | — | 58,395 | ||||||||||||
| Interest |
46,953 | — | (13,667 | ) | 33,286 | |||||||||||
| Loss on debt retirements |
907 | — | — | 907 | ||||||||||||
| Other income |
(435 | ) | (20,756 | ) | — | (21,191 | ) | |||||||||
| Intercompany other income |
(3,500 | ) | (10,167 | ) | 13,667 | — | ||||||||||
| 46,596 | 96,894 | — | 143,490 | |||||||||||||
| Income (loss) before the following items |
(46,596 | ) | 16,175 | — | (30,421 | ) | ||||||||||
| Income taxes (benefit) |
(16,454 | ) | 3,680 | — | (12,774 | ) | ||||||||||
| (30,142 | ) | 12,495 | — | (17,647 | ) | |||||||||||
| Equity in earnings (loss) of subsidiaries |
12,495 | — | (12,495 | ) | — | |||||||||||
| Net income (loss) |
$ | (17,647 | ) | $ | 12,495 | $ | (12,495 | ) | $ | (17,647 | ) | |||||
| Condensed consolidating statement of operations for the year ended May 31, 2008 |
|
|||||||||||||||
| Net sales |
$ | — | $ | 1,028,854 | $ | — | $ | 1,028,854 | ||||||||
| Cost of products sold |
— | 834,333 | — | 834,333 | ||||||||||||
| Gross profit |
— | 194,521 | — | 194,521 | ||||||||||||
| Selling, general and administrative |
8,663 | 87,557 | — | 96,220 | ||||||||||||
| Goodwill impairment |
— | — | — | — | ||||||||||||
| Interest |
28,159 | 3,500 | (29,154 | ) | 2,505 | |||||||||||
| Loss on debt retirements |
— | — | — | — | ||||||||||||
| Other income |
(503 | ) | (31,060 | ) | — | (31,563 | ) | |||||||||
| Intercompany other income |
(3,500 | ) | (25,654 | ) | 29,154 | — | ||||||||||
| 32,819 | 34,343 | — | 67,162 | |||||||||||||
| Income (loss) before the following items |
(32,819 | ) | 160,178 | — | 127,359 | |||||||||||
| Income taxes (benefit) |
(12,859 | ) | 52,587 | — | 39,728 | |||||||||||
| (19,960 | ) | 107,591 | — | 87,631 | ||||||||||||
| Equity in earnings (loss) of subsidiaries |
107,591 | — | (107,591 | ) | — | |||||||||||
| Net income (loss) |
$ | 87,631 | $ | 107,591 | $ | (107,591 | ) | $ | 87,631 | |||||||
64
Table of Contents
| Texas Industries, Inc. |
Guarantor Subsidiaries |
Eliminating Entries |
Consolidated | ||||||||||||
| In thousands | |||||||||||||||
| Condensed consolidating statement of cash flows for the year ended May 31, 2010 |
|
||||||||||||||
| Net cash provided by operating activities |
$ | (37,662 | ) | $ | 85,815 | $ | — | $ | 48,153 | ||||||
| Investing activities |
|||||||||||||||
| Capital expenditures—expansions |
— | (5,337 | ) | — | (5,337 | ) | |||||||||
| Capital expenditures—other |
— | (8,322 | ) | — | (8,322 | ) | |||||||||
| Cash designated for property acquisitions |
— | — | — | — | |||||||||||
| Proceeds from asset disposals |
— | 21,592 | — | 21,592 | |||||||||||
| Investments in life insurance contracts |
6,967 | — | — | 6,967 | |||||||||||
| Other—net |
— | 2,079 | — | 2,079 | |||||||||||
| Net cash provided (used) by investing activities |
6,967 | 10,012 | — | 16,979 | |||||||||||
| Financing activities |
|||||||||||||||
| Long-term borrowings |
— | — | — | — | |||||||||||
| Debt retirements |
(10 | ) | (235 | ) | — | (245 | ) | ||||||||
| Debt issuance costs |
(2,552 | ) | — | — | (2,552 | ) | |||||||||
| Stock option exercises |
893 | — | — | 893 | |||||||||||
| Excess tax benefits from stock-based compensation |
250 | — | — | 250 | |||||||||||
| Common dividends paid |
(8,328 | ) | — | — | (8,328 | ) | |||||||||
| Net intercompany financing activities |
95,708 | (95,708 | ) | — | — | ||||||||||
| Net cash provided (used) by financing activities |
85,961 | (95,943 | ) | — | (9,982 | ) | |||||||||
| Increase (decrease) in cash and cash equivalents |
55,266 | (116 | ) | — | 55,150 | ||||||||||
| Cash and cash equivalents at beginning of year |
17,226 | 2,570 | — | 19,796 | |||||||||||
| Cash and cash equivalents at end of year |
$ | 72,492 | $ | 2,454 | $ | — | $ | 74,946 | |||||||
| Condensed consolidating statement of cash flows for the year ended May 31, 2009 |
| ||||||||||||||
| Net cash provided by operating activities |
$ | (41,299 | ) | $ | 148,585 | $ | — | $ | 107,286 | ||||||
| Investing activities |
|||||||||||||||
| Capital expenditures—expansions |
— | (223,445 | ) | — | (223,445 | ) | |||||||||
| Capital expenditures—other |
— | (65,099 | ) | — | (65,099 | ) | |||||||||
| Cash designated for property acquisitions |
— | 28,733 | — | 28,733 | |||||||||||
| Proceeds from asset disposals |
— | 7,981 | — | 7,981 | |||||||||||
| Investments in life insurance contracts |
2,876 | — | — | 2,876 | |||||||||||
| Other—net |
— | (21 | ) | — | (21 | ) | |||||||||
| Net cash provided (used) by investing activities |
2,876 | (251,851 | ) | — | (248,975 | ) | |||||||||
| Financing activities |
|||||||||||||||
| Long-term borrowings |
327,250 | — | — | 327,250 | |||||||||||
| Debt retirements |
(197,547 | ) | (225 | ) | — | (197,772 | ) | ||||||||
| Debt issuance costs |
(5,470 | ) | — | — | (5,470 | ) | |||||||||
| Stock option exercises |
4,641 | — | — | 4,641 | |||||||||||
| Excess tax benefits from stock-based compensation |
1,596 | — | — | 1,596 | |||||||||||
| Common dividends paid |
(8,287 | ) | — | — | (8,287 | ) | |||||||||
| Net intercompany financing activities |
(101,209 | ) | 101,209 | — | — | ||||||||||
| Net cash provided (used) by financing activities |
20,974 | 100,984 | — | 121,958 | |||||||||||
| Increase (decrease) in cash and cash equivalents |
(17,449 | ) | (2,282 | ) | — | (19,731 | ) | ||||||||
| Cash and cash equivalents at beginning of year |
34,675 | 4,852 | — | 39,527 | |||||||||||
| Cash and cash equivalents at end of year |
$ | 17,226 | $ | 2,570 | $ | — | $ | 19,796 | |||||||
65
Table of Contents
| Texas Industries, Inc. |
Guarantor Subsidiaries |
Eliminating Entries |
Consolidated | ||||||||||||
| In thousands | |||||||||||||||
| Condensed consolidating statement of cash flows for the year ended May 31, 2008 |
|
||||||||||||||
| Net cash provided by operating activities |
$ | (18,302 | ) | $ | 119,857 | $ | — | $ | 101,555 | ||||||
| Investing activities |
|||||||||||||||
| Capital expenditures—expansions |
— | (247,552 | ) | — | (247,552 | ) | |||||||||
| Capital expenditures—other |
— | (64,973 | ) | — | (64,973 | ) | |||||||||
| Cash designated for property acquisitions |
— | (28,733 | ) | — | (28,733 | ) | |||||||||
| Proceeds from asset disposals |
— | 34,922 | — | 34,922 | |||||||||||
| Investments in life insurance contracts |
99,203 | — | — | 99,203 | |||||||||||
| Other—net |
— | 101 | — | 101 | |||||||||||
| Net cash provided (used) by investing activities |
99,203 | (306,235 | ) | — | (207,032 | ) | |||||||||
| Financing activities |
|||||||||||||||
| Long-term borrowings |
366,000 | — | — | 366,000 | |||||||||||
| Debt retirements |
(232,170 | ) | (196 | ) | — | (232,366 | ) | ||||||||
| Debt issuance costs |
(2,160 | ) | — | — | (2,160 | ) | |||||||||
| Stock option exercises |
3,315 | — | — | 3,315 | |||||||||||
| Excess tax benefits from stock-based compensation |
3,299 | — | — | 3,299 | |||||||||||
| Common dividends paid |
(8,222 | ) | — | — | (8,222 | ) | |||||||||
| Net intercompany financing activities |
(182,383 | ) | 182,383 | — | — | ||||||||||
| Net cash provided (used) by financing activities |
(52,321 | ) | 182,187 | — | 129,866 | ||||||||||
| Increase (decrease) in cash and cash equivalents |
28,580 | (4,191 | ) | — | 24,389 | ||||||||||
| Cash and cash equivalents at beginning of year |
6,095 | 9,043 | — | 15,138 | |||||||||||
| Cash and cash equivalents at end of year |
$ | 34,675 | $ | 4,852 | $ | — | $ | 39,527 | |||||||
66
Table of Contents
QUARTERLY FINANCIAL INFORMATION (Unaudited)
The following is a summary of quarterly financial information (in thousands except per share). In the May 2010 quarter, we recognized a charge of $4.4 million for an increase to one of our defined benefit liabilities, which includes an estimated $3.4 million that relates to years prior to 2010. See further discussion in Note 7 of Notes to Consolidated Financial Statements.
| 2010 |
Aug. | Nov. | Feb. | May | |||||||||||
| Net sales |
$ | 183,957 | $ | 142,935 | $ | 117,829 | $ | 176,343 | |||||||
| Gross profit |
34,105 | 16,872 | (13,297 | ) | 21,318 | ||||||||||
| Net income (loss)(1) |
1,715 | (3,702 | ) | (27,105 | ) | (9,761 | ) | ||||||||
| Basic earnings (loss) per share |
.06 | (.13 | ) | (.98 | ) | (.35 | ) | ||||||||
| Diluted earnings (loss) per share |
.06 | (.13 | ) | (.98 | ) | (.35 | ) | ||||||||
| 2009 |
Aug. | Nov. | Feb. | May | |||||||||||
| Net sales |
$ | 256,392 | $ | 221,799 | $ | 178,659 | $ | 182,352 | |||||||
| Gross profit |
32,627 | 26,654 | 29,644 | 24,144 | |||||||||||
| Net income (loss)(2)(3)(4) |
10,652 | 3,134 | 10,921 | (42,354 | ) | ||||||||||
| Basic earnings (loss) per share |
.39 | .11 | .39 | (1.53 | ) | ||||||||||
| Diluted earnings (loss) per share |
.38 | .11 | .39 | (1.53 | ) | ||||||||||
| (1) | During the November 2009 quarter, we sold emission credits associated with our Crestmore cement plant in Riverside, California for a pretax gain of $3.4 million. |
| (2) | During the August 2008 quarter, we recorded pretax income of $4.6 million representing lease bonus payments received upon the execution of oil and gas lease agreements on property we own in north Texas. We also sold emission credits associated with our Crestmore cement plant in Riverside, California for a pretax gain of $1.7 million. |
| (3) | During the February 2009 quarter, we sold operating assets and real estate associated with our aggregate operations in north Texas for a total pretax gain of $5.0 million. |
| (4) | During the May 2009 quarter, we recognized a goodwill impairment charge of $58.4 million associated with our California cement operations. |
67
Table of Contents
REPORT OF INDEPENDENT REGISTERED PUBLIC ACCOUNTING FIRM
The Board of Directors and Stockholders
Texas Industries, Inc.
We have audited the accompanying consolidated balance sheets of Texas Industries, Inc. and subsidiaries (the Company) as of May 31, 2010 and 2009, and the related consolidated statements of operations, cash flows and shareholders’ equity for each of the three years in the period ended May 31, 2010. These financial statements are the responsibility of the Company’s management. Our responsibility is to express an opinion on these financial statements based on our audits.
We conducted our audits in accordance with the standards of the Public Company Accounting Oversight Board (United States). Those standards require that we plan and perform the audit to obtain reasonable assurance about whether the financial statements are free of material misstatement. An audit includes examining, on a test basis, evidence supporting the amounts and disclosures in the financial statements. An audit also includes assessing the accounting principles used and significant estimates made by management, as well as evaluating the overall financial statement presentation. We believe that our audits provide a reasonable basis for our opinion.
In our opinion, the financial statements referred to above present fairly, in all material respects, the consolidated financial position of Texas Industries, Inc. and subsidiaries at May 31, 2010 and 2009, and the consolidated results of their operations and their cash flows for each of the three years in the period ended May 31, 2010, in conformity with U.S. generally accepted accounting principles.
We also have audited, in accordance with the standards of the Public Company Accounting Oversight Board (United States), Texas Industries, Inc. and subsidiaries’ internal control over financial reporting as of May 31, 2010, based on criteria established in Internal Control—Integrated Framework issued by the Committee of Sponsoring Organizations of the Treadway Commission and our report dated July 21, 2010 expressed an unqualified opinion thereon.
/s/ Ernst & Young LLP
Ft. Worth, Texas
July 21, 2010
68
Table of Contents
| ITEM 9. | CHANGES IN AND DISAGREEMENTS WITH ACCOUNTANTS ON ACCOUNTING AND FINANCIAL DISCLOSURE |
None.
| ITEM 9A. | CONTROLS AND PROCEDURES |
We maintain disclosure controls and procedures designed to ensure that information required to be disclosed in reports filed under the Securities Exchange Act of 1934, as amended, is recorded, processed, summarized and reported within the specified time periods. As of the end of the period covered by this Annual Report on Form 10-K, our Chief Executive Officer and Chief Financial Officer evaluated, with the participation of our management, the effectiveness of our disclosure controls and procedures (as defined in Exchange Act Rules 13a-15(e) and 15d-15(e)). Based on the evaluation, our Chief Executive Officer and Chief Financial Officer concluded that our disclosure controls and procedures are effective as of May 31, 2010.
There were no changes in our internal control over financial reporting that occurred during our most recent fiscal quarter that have materially affected or are reasonably likely to materially affect our internal control over financial reporting.
MANAGEMENT’S REPORT ON INTERNAL CONTROL OVER FINANCIAL REPORTING
The Company’s management is responsible for establishing and maintaining a system of internal control over financial reporting that is designed to provide reasonable assurance, in a cost-effective manner, that financial statements are prepared in accordance with generally accepted accounting principles, assets are safeguarded and transactions occur and are recorded in accordance with management’s authorization. Internal control systems over financial reporting have inherent limitations and may not prevent or detect all material misstatements. Therefore, even those systems determined to be effective can provide only reasonable assurance that the internal control objectives are met.
With the participation of the Chief Executive Officer and the Chief Financial Officer, the Company’s management assessed the effectiveness of the Company’s internal control over financial reporting as of May 31, 2010. The criteria set forth by the Committee of Sponsoring Organizations of the Treadway Commission (COSO) in Internal Control—Integrated Framework were used by management in its assessment. Based on the assessment, management concluded that the Company’s internal control over financial reporting was effective as of May 31, 2010.
Ernst & Young LLP, the Company’s Independent Registered Public Accounting Firm, has issued an attestation report on the effectiveness of the Company’s internal control over financial reporting. It appears immediately following this report.
69
Table of Contents
REPORT OF INDEPENDENT REGISTERED PUBLIC ACCOUNTING FIRM
The Board of Directors and Stockholders
Texas Industries, Inc.
We have audited Texas Industries, Inc. and subsidiaries’ (the Company) internal control over financial reporting as of May 31, 2010, based on criteria established in Internal Control—Integrated Framework issued by the Committee of Sponsoring Organizations of the Treadway Commission (the COSO criteria). The Company’s management is responsible for maintaining effective internal control over financial reporting, and for its assessment of the effectiveness of internal control over financial reporting included in the accompanying Management’s Report on Internal Control over Financial Reporting. Our responsibility is to express an opinion on the Company’s internal control over financial reporting based on our audit.
We conducted our audit in accordance with the standards of the Public Company Accounting Oversight Board (United States). Those standards require that we plan and perform the audit to obtain reasonable assurance about whether effective internal control over financial reporting was maintained in all material respects. Our audit included obtaining an understanding of internal control over financial reporting, assessing the risk that a material weakness exists, testing and evaluating the design and operating effectiveness of internal control based on the assessed risk, and performing such other procedures as we considered necessary in the circumstances. We believe that our audit provides a reasonable basis for our opinion.
A company’s internal control over financial reporting is a process designed to provide reasonable assurance regarding the reliability of financial reporting and the preparation of financial statements for external purposes in accordance with generally accepted accounting principles. A company’s internal control over financial reporting includes those policies and procedures that (1) pertain to the maintenance of records that, in reasonable detail, accurately and fairly reflect the transactions and dispositions of the assets of the company; (2) provide reasonable assurance that transactions are recorded as necessary to permit preparation of financial statements in accordance with generally accepted accounting principles, and that receipts and expenditures of the company are being made only in accordance with authorizations of management and directors of the company; and (3) provide reasonable assurance regarding prevention or timely detection of unauthorized acquisition, use, or disposition of the company’s assets that could have a material effect on the financial statements.
Because of its inherent limitations, internal control over financial reporting may not prevent or detect misstatements. Also, projections of any evaluation of effectiveness to future periods are subject to the risk that controls may become inadequate because of changes in conditions, or that the degree of compliance with the policies or procedures may deteriorate.
In our opinion, Texas Industries, Inc. and subsidiaries maintained, in all material respects, effective internal control over financial reporting as of May 31, 2010, based on the COSO criteria.
We also have audited, in accordance with the standards of the Public Company Accounting Oversight Board (United States), the consolidated balance sheets of Texas Industries, Inc. and subsidiaries as of May 31, 2010 and 2009, and the related consolidated statements of operations, cash flows, and shareholders’ equity for each of the three years in the period ended May 31, 2010 of Texas Industries, Inc. and subsidiaries and our report dated July 21, 2010 expressed an unqualified opinion thereon.
/s/ Ernst & Young LLP
Ft. Worth, Texas
July 21, 2010
70
Table of Contents
| ITEM 9B. | OTHER INFORMATION |
None.
71
Table of Contents
PART III
| ITEM 10. | DIRECTORS, EXECUTIVE OFFICERS AND CORPORATE GOVERNANCE |
Information about our executive officers is incorporated by reference to the “Executive Officers” section in Item 1 of this Report. Information about our directors is incorporated by reference to the “Election of Directors” section in our Proxy Statement for the 2010 Annual Meeting of Shareholders to be filed with the Securities and Exchange Commission within 120 days after May 31, 2010 (the “Proxy Statement”). Information about changes in the procedures by which shareholders may recommend director nominees is incorporated by reference to the “Corporate Governance—Director Nominations” section of the Proxy Statement. Information about the Audit Committee and an audit committee financial expert is incorporated by reference to the “Board of Directors and Its Standing Committees—Audit Committee” section of the Proxy Statement.
Information about Section 16 reports is incorporated by reference to the “Section 16(a) Beneficial Ownership Reporting Compliance” section of the Proxy Statement.
Information about our Code of Ethics applicable to our chief executive officer, chief financial officer and principal accounting officers is incorporated by reference to the “Available Information” section in Item 1 of this Report and to the “Corporate Governance—Codes of Ethics, Corporate Governance Guidelines and Committee Charters” section of the Proxy Statement.
| ITEM 11. | EXECUTIVE COMPENSATION |
Information about executive and director compensation is incorporated by reference to the “Compensation Discussion and Analysis,” “Compensation Tables and Information,” “Compensation Committee Report,” and “Director Compensation” sections of the Proxy Statement. Information about compensation committee interlocks and insider participation is incorporated by reference to the “Corporate Governance—Compensation Committee Interlocks and Insider Participation” section of the Proxy Statement.
| ITEM 12. | SECURITY OWNERSHIP OF CERTAIN BENEFICIAL OWNERS AND MANAGEMENT AND RELATED STOCKHOLDER MATTERS |
Information about equity compensation plans is incorporated by reference to the “Equity Compensation Plan Information” section in Item 5 of this Report. Information about security ownership of certain beneficial owners and management is incorporated by reference to the “Security Ownership of Certain Beneficial Owners and Management” section of the Proxy Statement.
| ITEM 13. | CERTAIN RELATIONSHIPS AND RELATED TRANSACTIONS, AND DIRECTOR INDEPENDENCE |
Information about certain relationships and related transactions is incorporated by reference to the “Corporate Governance—Related Person Transactions and Other Relationships” section of the Proxy Statement. Information about director independence is incorporated by reference to the “Corporate Governance—Director Independence” section of the Proxy Statement.
| ITEM 14. | PRINCIPAL ACCOUNTANT FEES AND SERVICES |
Information about principal accountant fees and services is incorporated by reference to the “Audit Committee Report” and “Fees Paid to Independent Auditors” sections of the Proxy Statement.
72
Table of Contents
PART IV
| ITEM 15. | EXHIBITS AND FINANCIAL STATEMENT SCHEDULES |
| (a) | Documents filed as a part of this report. |
| (1) | Financial Statements and Supplementary Data |
Consolidated Balance Sheets—May 31, 2010 and 2009
Consolidated Statements of Operations—Years ended May 31, 2010, 2009 and 2008
Consolidated Statements of Cash Flows—Years ended May 31, 2010, 2009 and 2008
Consolidated Statements of Shareholders’ Equity—Years ended May 31, 2010, 2009 and 2008
Notes to Consolidated Financial Statements
Report of Independent Registered Public Accounting Firm
| (2) | Financial Statement Schedules |
Financial statement schedules have been omitted because they are not applicable or the information required therein is included elsewhere in the financial statements or notes thereto.
| (3) | Listing of Exhibits |
| 3.1 | Composite Certificate of Incorporation | |
| 3.2 | Bylaws (incorporated by reference to Exhibit 3.1 to Current Report on Form 8-K filed on January 14, 2010) | |
| 3.3 | Amended and Restated Certificate of Designations of Series B Junior Participating Preferred Stock (incorporated by reference to Exhibit 3.1 to Current Report on Form 8-K filed on November 1, 2006) | |
| 4.1 | Form of Rights Agreement dated as of November 1, 2006, between Texas Industries, Inc. and Mellon Investor Services, LLC (incorporated by reference to Exhibit 4.1 to Current Report on Form 8-K filed on October 20, 2006) | |
| 4.2 | Amendment No. 1 to Rights Agreement executed on February 2, 2010 (incorporated by reference to Exhibit 4.1 to Current Report on Form 8-K filed on February 8, 2010) | |
| 4.3 | Amendment No. 2 to Rights Agreement dated July 19, 2010 (incorporated by reference to Exhibit 4.1 to Current Report on Form 8-K filed on July 20, 2010) | |
| 4.4 | Form of the Company’s 7 1/4% Senior Note due 2013 (CUSIP 882491 AK9) (incorporated by reference to Exhibit 4.1 to Current Report on Form 8-K filed on July 8, 2005) | |
| 4.5 | Form of the Company’s Notation of Guarantee (incorporated by reference to Exhibit 4.2 to Current Report on Form 8-K filed on July 8, 2005) | |
| 4.6 | Form of the Company’s 7 1/4% Senior Note due 2013 (CUSIP 882491 AM5) and Notation of Guarantee (incorporated by reference to Exhibit 4.1 to Current Report on Form 8-K filed on August 19, 2008) | |
| 4.7 | Form of the Company’s 7 1/4% Senior Note due 2013 (CUSIP U88244 AC9) and Notation of Guarantee (incorporated by reference to Exhibit 4.2 to Current Report on Form 8-K filed on August 19, 2008) | |
| 4.8 | Registration Rights Agreement, dated July 6, 2005, among the Company and the Initial Purchasers (incorporated by reference to Exhibit 4.3 to Current Report on Form 8-K filed on July 8, 2005) | |
73
Table of Contents
| 4.9 | Registration Rights Agreement, dated August 18, 2008, among the Company, the Guarantors and the Initial Purchasers (incorporated by reference to Exhibit 4.3 to Current Report on Form 8-K filed on August 19, 2008) | |
| 4.10 | Indenture, dated July 6, 2005, among the Company, the Guarantors and Wells Fargo, National Association, as Trustee (incorporated by reference to Exhibit 4.4 to Current Report on Form 8-K filed on July 8, 2005) | |
| 4.11 | First Supplemental Indenture dated August 18, 2008 among the Company, the Guarantors and the Trustee (incorporated by reference to Exhibit 4.4 to Current Report on Form 8-K filed on August 19, 2008) | |
| 4.12 | Second Supplemental Indenture dated August 18, 2008 among the Company, the Guarantors and the Trustee (incorporated by reference to Exhibit 4.5 to Current Report on Form 8-K filed on August 19, 2008) | |
| 10.1 | Purchase Agreement, dated June 29, 2005, among the Company and the Initial Purchasers (incorporated by reference to Exhibit 10.1 to Current Report on Form 8-K filed on July 8, 2005) | |
| 10.2 | Purchase Agreement, dated August 7, 2008, among the Company, the Guarantors and the Initial Purchasers (incorporated by reference to Exhibit 10.1 to Current Report on Form 8-K filed on August 13, 2008) | |
| 10.3 | Second Amended and Restated Credit Agreement, dated June 19, 2009, among the Company, Bank of America, N.A., as Administrative Agent, Swing Line Lender and L/C Issuer and the lenders that are parties thereto (incorporated by reference to Exhibit 10.3 to Quarterly Report on Form 10-Q filed on January 7, 2010) | |
| 10.4 | First Amendment to Second Amended and Restated Credit Agreement, dated June 19, 2009, among the Company, Bank of America, N.A., as Administrative Agent, Swing Line Lender and L/C Issuer, and the lenders that are parties thereto (incorporated by reference to Exhibit 10.2 to Report on Form 8-K filed on June 25, 2009) | |
| 10.5 | Second Amendment to Second Amended and Restated Credit Agreement, dated March 24, 2010, among the Company, Bank of America, N.A., as Administrative Agent, Swing Line Lender and L/C Issuer, and the lenders that are parties thereto (incorporated by reference to Exhibit 10.33 to Quarterly Report on Form 10-Q filed on March 26, 2010) | |
| 10.6 | Third Amendment to Second Amended and Restated Credit Agreement, dated April 12, 2010, among the Company, Bank of America, N.A., as Administrative Agent, Swing Line Lender and L/C Issuer, and the lenders that are parties thereto (incorporated by reference to Exhibit 10.1 to Report on Form 8-K filed on April 23, 2010) | |
| 10.7 | Amended and Restated Security Agreement, dated June 19, 2009, among the Company, the Guarantors and Bank of America, N. A., as Administrative Agent (incorporated by reference to Exhibit 10.5 to Quarterly Report on Form 10-Q filed on January 7, 2010) | |
| 10.8 | Separation and Distribution Agreement, dated July 6, 2005, between the Company and Chaparral Steel Company (incorporated by reference to Exhibit 10.3 to Current Report on Form 8-K filed on July 8, 2005) | |
| 10.9 | Amendment No. 1 to Separation and Distribution Agreement dated as of July 27, 2005 (incorporated by reference to Exhibit 10.1 to Current Report on Form 8-K filed on August 1, 2005) | |
| 10.10 | Tax Sharing and Indemnification Agreement, dated July 6, 2005, between the Company and Chaparral Steel Company (incorporated by reference to Exhibit 10.4 to Current Report on Form 8-K filed on July 8, 2005) | |
74
Table of Contents
| 10.11 | Employment Agreement of Mel G. Brekhus dated as of April 14, 2010 (incorporated by reference to Exhibit 10.1 to Current Report on Form 8-K filed on April 16, 2010) | |
| 10.12 | Texas Industries, Inc. 1993 Stock Option Plan (incorporated by reference to Exhibit 4.1 to Registration Statement on Form S-8 filed on May 19, 1994) | |
| 10.13 | Texas Industries, Inc. 2004 Omnibus Equity Compensation Plan, as amended (incorporated by reference to Exhibit 10.9 to Quarterly Report on Form 10-Q filed on January 5, 2007) | |
| 10.14 | Form of Stock Option Agreement under Texas Industries, Inc. 2004 Omnibus Equity Compensation Plan (incorporated by reference to Exhibit 10.10 to Annual Report on Form 10-K filed on July 25, 2006) | |
| 10.15 | Form of Non-Employee Directors Restricted Stock Agreement (incorporated by reference to Exhibit 10.1 to Current Report on Form 8-K filed on January 16, 2009) | |
| 10.16 | TXI Annual Incentive Plans-Fiscal Year 2011 | |
| 10.17 | TXI Three Year Incentive Plan for the Three Consecutive Fiscal Year Periods Ending May 31, 2011 (incorporated by reference to Exhibit 10.14 to Annual Report on Form 10-K filed on July 11, 2008) | |
| 10.18 | TXI Three Year Incentive Plan for the Three Consecutive Fiscal Year Periods Ending May 31, 2012 (incorporated by reference to Exhibit 10.17 to Annual Report on Form 10-K filed on July 17, 2009) | |
| 10.19 | TXI Three Year Incentive Plan for the Three Consecutive Fiscal Year Periods Ending May 31, 2013 | |
| 10.20 | Master Performance-Based Incentive Plan (incorporated by reference to Appendix A to definitive proxy statement filed on August 25, 2006) | |
| 10.21 | Texas Industries, Inc. 2003 Share Appreciation Rights Plan (incorporated by reference to Exhibit 10.15 to Annual Report on Form 10-K filed on August 12, 2005) | |
| 10.22 | Form of SAR Agreement for Non-Employee Directors under Texas Industries, Inc. 2003 Share Appreciation Rights Plan (incorporated by reference to Exhibit 10.16 to Annual Report on Form 10-K filed on August 12, 2005) | |
| 10.23 | Form of Amendment No. 1 to SAR Agreement for Non-Employee Directors Under Texas Industries, Inc. 2003 Stock Appreciation Rights Plan (incorporated by reference to Exhibit 10.6 to Current Report on Form 8-K filed on April 25, 2006) | |
| 10.24 | SAR Agreement for Employee Directors Under Texas Industries, Inc. 2003 Stock Appreciation Rights Plan between Texas Industries, Inc. and Mel G. Brekhus, dated June 1, 2004 (incorporated by reference to Exhibit 10.22 to Annual Report on Form 10-K filed on July 25, 2006) | |
| 10.25 | Amendment No. 1 to SAR Agreement for Employee Directors Under Texas Industries, Inc. 2003 Stock Appreciation Rights Plan, by and between Texas Industries, Inc. and Mel G. Brekhus dated April 24, 2006 (incorporated by reference to Exhibit 10.23 to Annual Report on Form 10-K filed on July 25, 2006) | |
| 10.26 | Contract, dated September 27, 2005, between Riverside Cement Company and Oro Grande Contractors (incorporated by reference to Exhibit 10.1 to Current Report on Form 8-K filed on September 30, 2005, noting that portions of the exhibit were omitted pursuant to a request for confidential treatment) | |
| 10.27 | Deferred Compensation Plan for Directors of Texas Industries, Inc. (incorporated by reference to Exhibit 10.1 to Current Report on Form 8-K filed on January 24, 2006) | |
75
Table of Contents
| 10.28 | Form of 2005 Executive Financial Security Plan (Annuity Formula), as amended (incorporated by reference to Exhibit 10.26 to Quarterly Report on Form 10-Q filed on January 7, 2010) | |
| 10.29 | Form of 2005 Executive Financial Security Plan (Lump Sum Formula), as amended (incorporated by reference to Exhibit 10.27 to Quarterly Report Form 10-Q filed on January 7, 2010) | |
| 10.30 | Form of Change in Control Severance Agreement (incorporated by reference to Exhibit 10.3 to Current Report on Form 8-K filed on April 25, 2006) | |
| 10.31 | Amendment No. 2 to SAR Agreement for Employee Directors Under Texas Industries, Inc. 2003 Stock Appreciation Rights Plan, between Texas Industries, Inc. and Mel G. Brekhus dated July 11, 2007 (incorporated by reference to Exhibit 10.27 to Annual Report on Form 10-K filed on July 13, 2007) | |
| 10.32 | Contract, signed September 21, 2007, between TXI Operations, LP and Amec-Zachry Contractors (incorporated by reference to Exhibit 10.28 to Quarterly Report on Form 10-Q filed on September 27, 2007, noting that portions of the exhibit have been omitted pursuant to a request for confidential treatment) | |
| 10.33 | Contract Amendment No. 1, executed August 17, 2009, between TXI Operations, LP and Amec-Zachry Contractors (incorporated by reference to Exhibit 10.1 to Current Report on Form 8-K filed August 21, 2009) | |
| 10.34 | Standstill Agreement dated July 16, 2010 among the Company, NNS Holding and Mr. Nassef Sawiris (incorporated by reference to Exhibit 10.1 to Current Report on Form 8-K filed on July 20, 2010) | |
| 12.1 | Computation of Ratios of Earnings to Fixed Charges | |
| 21.1 | Subsidiaries of the Registrant as of May 31, 2009 | |
| 23.1 | Consent of Independent Registered Public Accounting Firm | |
| 24.1 | Power of Attorney for certain members of the Board of Directors | |
| 31.1 | Certification of Chief Executive Officer | |
| 31.2 | Certification of Chief Financial Officer | |
| 32.1 | Section 1350 Certification of Chief Executive Officer | |
| 32.2 | Section 1350 Certification of Chief Financial Officer | |
76
Table of Contents
Pursuant to the requirements of Section 13 or 15(d) of the Securities Exchange Act of 1934, the Registrant has duly caused this report to be signed on its behalf by the undersigned, thereunto duly authorized on the 21st day of July, 2010.
| TEXAS INDUSTRIES, INC. | ||
| By | /S/ MEL G. BREKHUS | |
| Mel G. Brekhus, President and Chief Executive Officer | ||
Pursuant to the requirements of the Securities Exchange Act of 1934, this report has been signed below by the following persons on behalf of the Registrant and in the capacities and on the dates indicated.
| Signature |
Title |
Date | ||
| /S/ MEL G. BREKHUS Mel G. Brekhus |
Director, President and Chief Executive Officer (Principal Executive Officer) | July 21, 2010 | ||
| /S/ KENNETH R. ALLEN Kenneth R. Allen |
Vice President—Finance, Chief Financial Officer and Treasurer (Principal Financial Officer) | July 21, 2010 | ||
| /S/ T. LESLEY VINES T. Lesley Vines |
Vice President—Corporate Controller and Assistant Treasurer (Principal Accounting Officer) | July 21, 2010 | ||
| /S/ EUGENIO CLARIOND* Eugenio Clariond |
Director | July 21, 2010 | ||
| /S/ SAM COATS* Sam Coats |
Director | July 21, 2010 | ||
| /S/ GARY L. PECHOTA * Gary L. Pechota |
Director | July 21, 2010 | ||
| /S/ THOMAS RANSDELL* Thomas Ransdell |
Director | July 21, 2010 | ||
| /S/ ROBERT D. ROGERS* Robert D. Rogers |
Director | July 21, 2010 | ||
| /S/ RONALD G. STEINHART* Ronald G. Steinhart |
Director | July 21, 2010 | ||
| * By | /S/ T. LESLEY VINES | |
| T. Lesley Vines Attorney-in-Fact | ||
77
Table of Contents
INDEX TO EXHIBITS
| Exhibit |
||
| 3.1 | Composite Certificate of Incorporation | |
| 3.2 | Bylaws (incorporated by reference to Exhibit 3.1 to Current Report on Form 8-K filed on January 14, 2010) | |
| 3.3 | Amended and Restated Certificate of Designations of Series B Junior Participating Preferred Stock (incorporated by reference to Exhibit 3.1 to Current Report on Form 8-K filed on November 1, 2006) | |
| 4.1 | Form of Rights Agreement dated as of November 1, 2006, between Texas Industries, Inc. and Mellon Investor Services, LLC (incorporated by reference to Exhibit 4.1 to Current Report on Form 8-K filed on October 20, 2006) | |
| 4.2 | Amendment No. 1 to Rights Agreement executed on February 2, 2010 (incorporated by reference to Exhibit 4.1 to Current Report on Form 8-K filed on February 8, 2010) | |
| 4.3 | Amendment No. 2 to Rights Agreement dated July 19, 2010 (incorporated by reference to Exhibit 4.1 to Current Report on Form 8-K filed on July 20, 2010) | |
| 4.4 | Form of the Company’s 7 1/4% Senior Note due 2013 (CUSIP 882491 AK9) (incorporated by reference to Exhibit 4.1 to Current Report on Form 8-K filed on July 8, 2005) | |
| 4.5 | Form of the Company’s Notation of Guarantee (incorporated by reference to Exhibit 4.2 to Current Report on Form 8-K filed on July 8, 2005) | |
| 4.6 | Form of the Company’s 7 1/4% Senior Note due 2013 (CUSIP 882491 AM5) and Notation of Guarantee (incorporated by reference to Exhibit 4.1 to Current Report on Form 8-K filed on August 19, 2008) | |
| 4.7 | Form of the Company’s 7 1/4% Senior Note due 2013 (CUSIP U88244 AC9) and Notation of Guarantee (incorporated by reference to Exhibit 4.2 to Current Report on Form 8-K filed on August 19, 2008) | |
| 4.8 | Registration Rights Agreement, dated July 6, 2005, among the Company and the Initial Purchasers (incorporated by reference to Exhibit 4.3 to Current Report on Form 8-K filed on July 8, 2005) | |
| 4.9 | Registration Rights Agreement, dated August 18, 2008, among the Company, the Guarantors and the Initial Purchasers (incorporated by reference to Exhibit 4.3 to Current Report on Form 8-K filed on August 19, 2008) | |
| 4.10 | Indenture, dated July 6, 2005, among the Company, the Guarantors and Wells Fargo, National Association, as Trustee (incorporated by reference to Exhibit 4.4 to Current Report on Form 8-K filed on July 8, 2005) | |
| 4.11 | First Supplemental Indenture dated August 18, 2008 among the Company, the Guarantors and the Trustee (incorporated by reference to Exhibit 4.4 to Current Report on Form 8-K filed on August 19, 2008) | |
| 4.12 | Second Supplemental Indenture dated August 18, 2008 among the Company, the Guarantors and the Trustee (incorporated by reference to Exhibit 4.5 to Current Report on Form 8-K filed on August 19, 2008) | |
| 10.1 | Purchase Agreement, dated June 29, 2005, among the Company and the Initial Purchasers (incorporated by reference to Exhibit 10.1 to Current Report on Form 8-K filed on July 8, 2005) | |
| 10.2 | Purchase Agreement, dated August 7, 2008, among the Company, the Guarantors and the Initial Purchasers (incorporated by reference to Exhibit 10.1 to Current Report on Form 8-K filed on August 13, 2008) | |
78
Table of Contents
| Exhibit |
||
| 10.3 | Second Amended and Restated Credit Agreement, dated June 19, 2009, among the Company, Bank of America, N.A., as Administrative Agent, Swing Line Lender and L/C Issuer and the lenders that are parties thereto (incorporated by reference to Exhibit 10.3 to Quarterly Report on Form 10-Q filed on January 7, 2010) | |
| 10.4 | First Amendment to Second Amended and Restated Credit Agreement, dated June 19, 2009, among the Company, Bank of America, N.A., as Administrative Agent, Swing Line Lender and L/C Issuer, and the lenders that are parties thereto (incorporated by reference to Exhibit 10.2 to Report on Form 8-K filed on June 25, 2009) | |
| 10.5 | Second Amendment to Second Amended and Restated Credit Agreement, dated March 24, 2010, among the Company, Bank of America, N.A., as Administrative Agent, Swing Line Lender and L/C Issuer, and the lenders that are parties thereto (incorporated by reference to Exhibit 10.33 to Quarterly Report on Form 10-Q filed on March 26, 2010) | |
| 10.6 | Third Amendment to Second Amended and Restated Credit Agreement, dated April 12, 2010, among the Company, Bank of America, N.A., as Administrative Agent, Swing Line Lender and L/C Issuer, and the lenders that are parties thereto (incorporated by reference to Exhibit 10.1 to Report on Form 8-K filed on April 23, 2010) | |
| 10.7 | Amended and Restated Security Agreement, dated June 19, 2009, among the Company, the Guarantors and Bank of America, N. A., as Administrative Agent (incorporated by reference to Exhibit 10.5 to Quarterly Report on Form 10-Q filed on January 7, 2010) | |
| 10.8 | Separation and Distribution Agreement, dated July 6, 2005, between the Company and Chaparral Steel Company (incorporated by reference to Exhibit 10.3 to Current Report on Form 8-K filed on July 8, 2005) | |
| 10.9 | Amendment No. 1 to Separation and Distribution Agreement dated as of July 27, 2005 (incorporated by reference to Exhibit 10.1 to Current Report on Form 8-K filed on August 1, 2005) | |
| 10.10 | Tax Sharing and Indemnification Agreement, dated July 6, 2005, between the Company and Chaparral Steel Company (incorporated by reference to Exhibit 10.4 to Current Report on Form 8-K filed on July 8, 2005) | |
| 10.11 | Employment Agreement of Mel G. Brekhus dated as of April 14, 2010 (incorporated by reference to Exhibit 10.1 to Current Report on Form 8-K filed on April 16, 2010) | |
| 10.12 | Texas Industries, Inc. 1993 Stock Option Plan (incorporated by reference to Exhibit 4.1 to Registration Statement on Form S-8 filed on May 19, 1994) | |
| 10.13 | Texas Industries, Inc. 2004 Omnibus Equity Compensation Plan, as amended (incorporated by reference to Exhibit 10.9 to Quarterly Report on Form 10-Q filed on January 5, 2007) | |
| 10.14 | Form of Stock Option Agreement under Texas Industries, Inc. 2004 Omnibus Equity Compensation Plan (incorporated by reference to Exhibit 10.10 to Annual Report on Form 10-K filed on July 25, 2006) | |
| 10.15 | Form of Non-Employee Directors Restricted Stock Agreement (incorporated by reference to Exhibit 10.1 to Current Report on Form 8-K filed on January 16, 2009) | |
| 10.16 | TXI Annual Incentive Plans-Fiscal Year 2011 | |
| 10.17 | TXI Three Year Incentive Plan for the Three Consecutive Fiscal Year Periods Ending May 31, 2011 (incorporated by reference to Exhibit 10.14 to Annual Report on Form 10-K filed on July 11, 2008) | |
| 10.18 | TXI Three Year Incentive Plan for the Three Consecutive Fiscal Year Periods Ending May 31, 2012 (incorporated by reference to Exhibit 10.17 to Annual Report on Form 10-K filed on July 17, 2009) | |
79
Table of Contents
| Exhibit |
||
| 10.19 | TXI Three Year Incentive Plan for the Three Consecutive Fiscal Year Periods Ending May 31, 2013 | |
| 10.20 | Master Performance-Based Incentive Plan (incorporated by reference to Appendix A to definitive proxy statement filed on August 25, 2006) | |
| 10.21 | Texas Industries, Inc. 2003 Share Appreciation Rights Plan (incorporated by reference to Exhibit 10.15 to Annual Report on Form 10-K filed on August 12, 2005) | |
| 10.22 | Form of SAR Agreement for Non-Employee Directors under Texas Industries, Inc. 2003 Share Appreciation Rights Plan (incorporated by reference to Exhibit 10.16 to Annual Report on Form 10-K filed on August 12, 2005) | |
| 10.23 | Form of Amendment No. 1 to SAR Agreement for Non-Employee Directors Under Texas Industries, Inc. 2003 Stock Appreciation Rights Plan (incorporated by reference to Exhibit 10.6 to Current Report on Form 8-K filed on April 25, 2006) | |
| 10.24 | SAR Agreement for Employee Directors Under Texas Industries, Inc. 2003 Stock Appreciation Rights Plan between Texas Industries, Inc. and Mel G. Brekhus, dated June 1, 2004 (incorporated by reference to Exhibit 10.22 to Annual Report on Form 10-K filed on July 25, 2006) | |
| 10.25 | Amendment No. 1 to SAR Agreement for Employee Directors Under Texas Industries, Inc. 2003 Stock Appreciation Rights Plan, by and between Texas Industries, Inc. and Mel G. Brekhus dated April 24, 2006 (incorporated by reference to Exhibit 10.23 to Annual Report on Form 10-K filed on July 25, 2006) | |
| 10.26 | Contract, dated September 27, 2005, between Riverside Cement Company and Oro Grande Contractors (incorporated by reference to Exhibit 10.1 to Current Report on Form 8-K filed on September 30, 2005, noting that portions of the exhibit were omitted pursuant to a request for confidential treatment) | |
| 10.27 | Deferred Compensation Plan for Directors of Texas Industries, Inc. (incorporated by reference to Exhibit 10.1 to Current Report on Form 8-K filed on January 24, 2006) | |
| 10.28 | Form of 2005 Executive Financial Security Plan (Annuity Formula), as amended (incorporated by reference to Exhibit 10.26 to Quarterly Report on Form 10-Q filed on January 7, 2010) | |
| 10.29 | Form of 2005 Executive Financial Security Plan (Lump Sum Formula), as amended (incorporated by reference to Exhibit 10.27 to Quarterly Report Form 10-Q filed on January 7, 2010) | |
| 10.30 | Form of Change in Control Severance Agreement (incorporated by reference to Exhibit 10.3 to Current Report on Form 8-K filed on April 25, 2006) | |
| 10.31 | Amendment No. 2 to SAR Agreement for Employee Directors Under Texas Industries, Inc. 2003 Stock Appreciation Rights Plan, between Texas Industries, Inc. and Mel G. Brekhus dated July 11, 2007 (incorporated by reference to Exhibit 10.27 to Annual Report on Form 10-K filed on July 13, 2007) | |
| 10.32 | Contract, signed September 21, 2007, between TXI Operations, LP and Amec-Zachry Contractors (incorporated by reference to Exhibit 10.28 to Quarterly Report on Form 10-Q filed on September 27, 2007, noting that portions of the exhibit have been omitted pursuant to a request for confidential treatment) | |
| 10.33 | Contract Amendment No. 1, executed August 17, 2009, between TXI Operations, LP and Amec-Zachry Contractors (incorporated by reference to Exhibit 10.1 to Current Report on Form 8-K filed August 21, 2009) | |
| 10.34 | Standstill Agreement dated July 16, 2010 among the Company, NNS Holding and Mr. Nassef Sawiris (incorporated by reference to Exhibit 10.1 to Current Report on Form 8-K filed on July 20, 2010) | |
80
Table of Contents
| Exhibit |
||
| 12.1 | Computation of Ratios of Earnings to Fixed Charges | |
| 21.1 | Subsidiaries of the Registrant as of May 31, 2009 | |
| 23.1 | Consent of Independent Registered Public Accounting Firm | |
| 24.1 | Power of Attorney for certain members of the Board of Directors | |
| 31.1 | Certification of Chief Executive Officer | |
| 31.2 | Certification of Chief Financial Officer | |
| 32.1 | Section 1350 Certification of Chief Executive Officer | |
| 32.2 | Section 1350 Certification of Chief Financial Officer | |
81