Attached files
| file | filename |
|---|---|
| 8-K - FORM 8-K - ManpowerGroup Inc. | form_8k.htm |
| EX-99.1 - PRESS RELEASE DATED JULY 21, 2010 - ManpowerGroup Inc. | exhibit_99-1.htm |
Exhibit 99.2

2010 July 21
2010 2nd Quarter
Results
Results
Manpower Inc.

Manpower Inc. 2010 2nd Quarter Results
July 2010
2
This presentation includes forward-looking
statements, including earnings projections
which are subject to risks and uncertainties.
Actual results might differ materially from
those projected in the forward-looking
statements. Additional information
concerning factors that could cause actual
results to materially differ from those in the
forward-looking statements is contained in
the Company’s Annual Report on Form 10-K
dated December 31, 2009, which information
is incorporated herein by reference, and
such other factors as may be described from
time to time in the Company’s SEC filings.
Forward-Looking Statement
Manpower Inc. 2010 2nd Quarter Results
July 2010
3
315%
90%
157% CC
21%
24% CC
120 bps
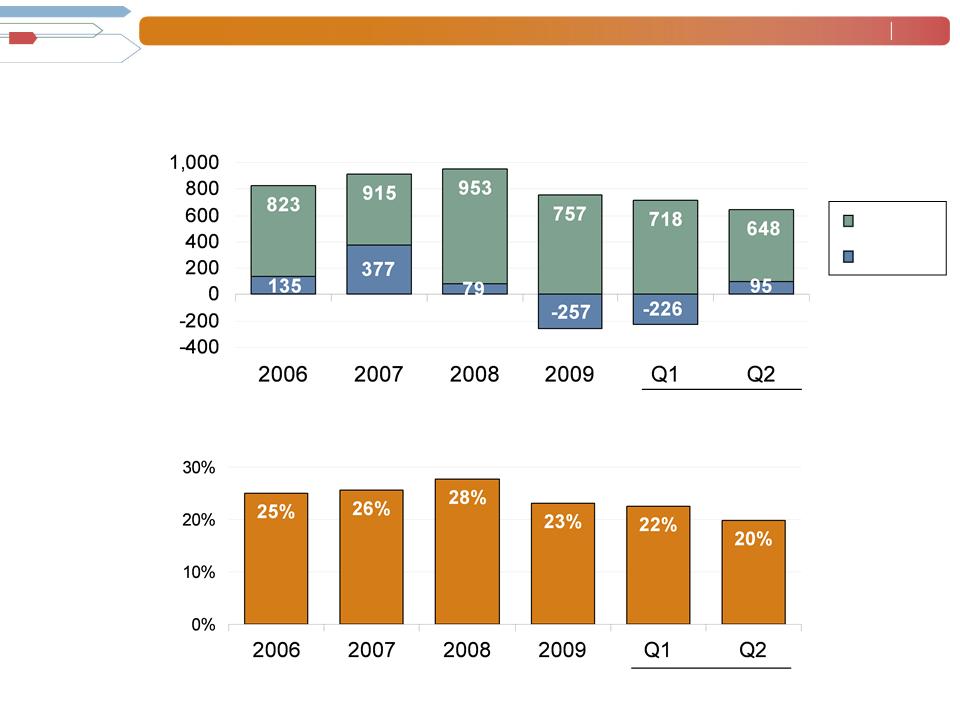
Operating Profit $79M
OP Margin 1.7%
Revenue $4.6B
Gross Margin 17.4%
EPS $.40
90 bps
331% CC
Q1 Highlights
Throughout this presentation, the difference between reported variances and Constant Currency (CC) variances
represents the impact of currency on our financial results. Constant Currency is further explained on our Web site.
represents the impact of currency on our financial results. Constant Currency is further explained on our Web site.
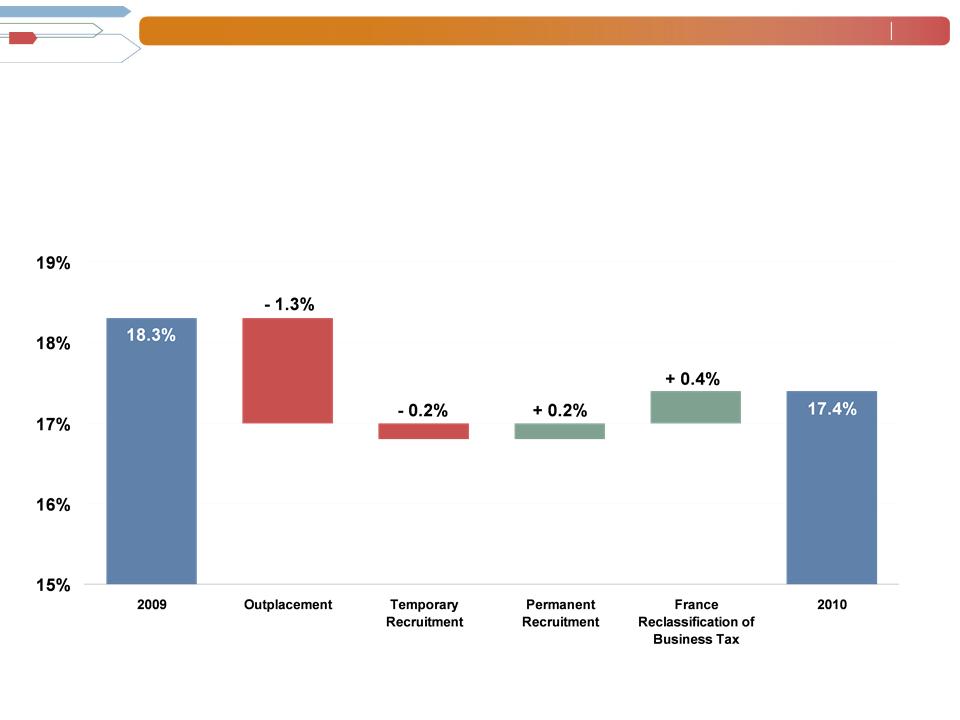
Consolidated Financial Highlights
(1) 2009 results include reorganization charges of $13M.
(1)
Manpower Inc. 2010 2nd Quarter Results
July 2010
4
Consolidated Gross Margin Change
Manpower Inc. 2010 2nd Quarter Results
July 2010
5
64% CC
Americas Segment
(22% of Revenue)
(22% of Revenue)
Q2 Financial Highlights
67%
OUP Margin
1.8%
210 bps
Revenue
$992M
OUP
$18M
Operating Unit Profit (OUP) is the measure that we use to evaluate segment
performance. OUP is equal to segment revenues less direct costs and branch and
national headquarters operating costs.
performance. OUP is equal to segment revenues less direct costs and branch and
national headquarters operating costs.
(1) Included in these amounts is the US, which had revenue of $686M (+83%) and OUP of $10M. On an
organic basis, US revenue was $504M (+35%) and OUP was $10M.
organic basis, US revenue was $504M (+35%) and OUP was $10M.
(2) On an organic basis, Americas revenue increased 36% in USD (33% in CC).
(1)
N/A
N/A
(2)
(2)
Manpower Inc. 2010 2nd Quarter Results
July 2010
6
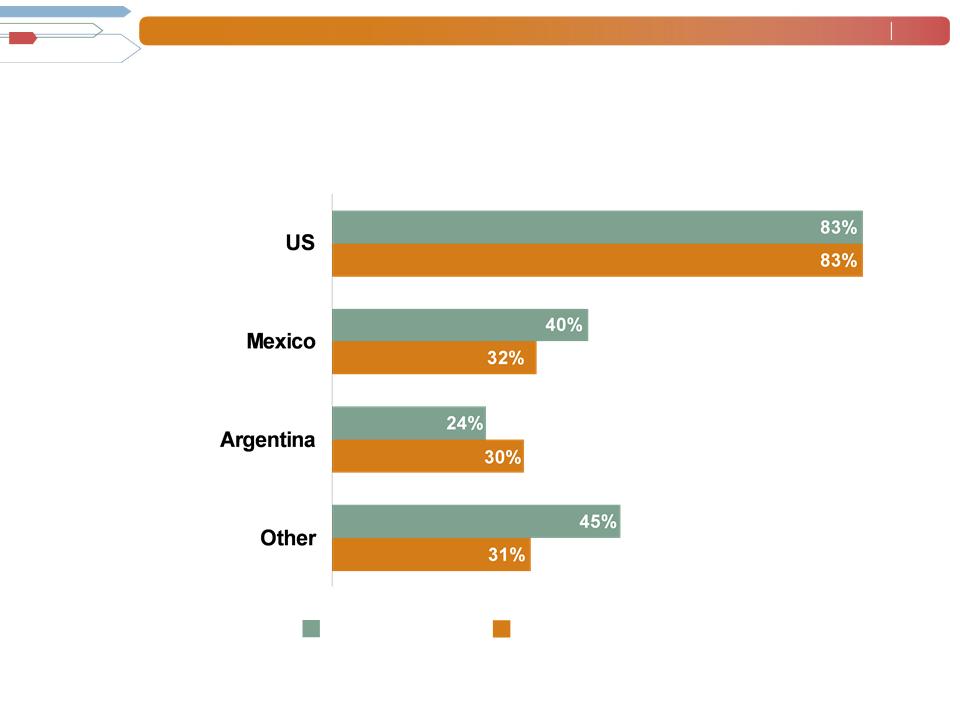
Americas - Q2 Revenue Growth YoY
Revenue Growth - CC
Revenue Growth
% of Segment
Revenue
69%
11%
6%
14%
(1) On an organic basis, US revenue was $504M (+35%).
(1)
Manpower Inc. 2010 2nd Quarter Results
July 2010
7
France Segment
(27% of Revenue)
(27% of Revenue)
Q2 Financial Highlights
OUP Margin
0.8%
Revenue
$1.3B
OUP
$10M
14%
23% CC
40 bps
140%
169% CC

Manpower Inc. 2010 2nd Quarter Results
July 2010
8
(1) Included in these amounts is Italy, which had revenue of $259M (+12% in USD, 21% in CC) and OUP of
$14M (+99% in USD, +115% in CC).
$14M (+99% in USD, +115% in CC).
(2) 2009 includes reorganization charges of $5.5M.
EMEA Segment
(37% of Revenue)
(37% of Revenue)
Q2 Financial Highlights
OUP Margin
2.5%
Revenue
$1.7B
OUP
$43M
14%
18% CC
250 bps
N/A
N/A
(1)
(2)

Manpower Inc. 2010 2nd Quarter Results
July 2010
9
EMEA - Q2 Revenue Growth YoY
Revenue Growth - CC
Revenue Growth
% of Segment
Revenue
15%
14%
14%
11%
10%
5%
23%
8%
Manpower Inc. 2010 2nd Quarter Results
July 2010
10
Asia Pacific Segment
(11% of Revenue)
(11% of Revenue)
Q2 Financial Highlights
OUP Margin
2.3%
Revenue
$506M
OUP
$12M
25%
15% CC
140 bps
237%
215% CC
(1)
(1)
(1)
(1) 2009 includes reorganization charges of $1.5M.
Manpower Inc. 2010 2nd Quarter Results
July 2010
11
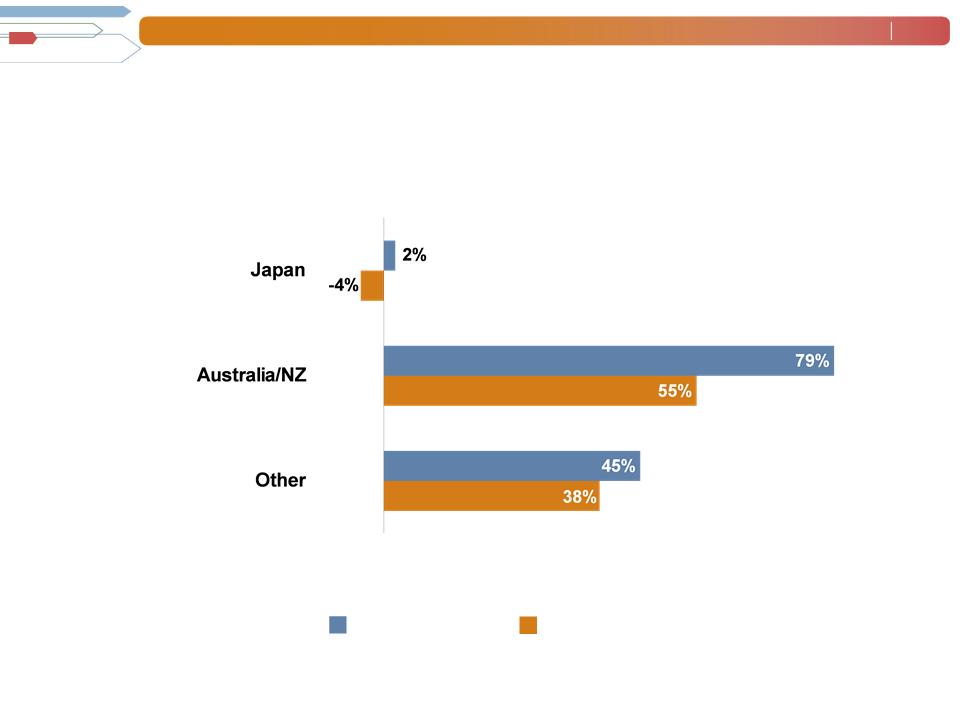
Asia Pacific - Q2 Revenue Growth YoY
Revenue Growth - CC
Revenue Growth
% of Segment
Revenue
50%
26%
24%
Manpower Inc. 2010 2nd Quarter Results
July 2010
12
82%
82% CC
Right Management Segment
(2% of Revenue)
(2% of Revenue)
Q2 Financial Highlights
OUP Margin
7.9%
Revenue
$99M
OUP
$8M
38%
38% CC
1890 bps
Manpower Inc. 2010 2nd Quarter Results
July 2010
13
Jefferson Wells Segment
(1% of Revenue)
(1% of Revenue)
Q2 Financial Highlights
OUP Margin
- 7.5%
Revenue
$41M
OUP
$(3M)
1370 bps
16%
N/A
(1)
(1) 2009 includes reorganization charges of $5.9M.
Manpower Inc. 2010 2nd Quarter Results
July 2010
14
Other
(12)
Change in Cash
(462)
233
(21)
Cash Flow Summary - First Half
2010
2009
Cash from Operations
(66)
379
Capital Expenditures
(28)
(17)
Free Cash Flow
(94)
362
Change in Debt
(259)
(85)
($ in millions)
Effect of Exchange Rate Changes
(92)
(1)
Acquisitions of Businesses,
net of cash acquired
(22)
(5)
Manpower Inc. 2010 2nd Quarter Results
July 2010
15
COMSYS Acquisition Summary
Closing date:
April 5, 2010
Consideration:
Cash
$192M
Stock
188M
(3.2M shares @ $58.94 per share)
Debt Retired
47M
$427M
(1)
(1) Represents the closing stock price on April 5, which is higher than the average stock price of $57.98 used
to determine the conversion ratio for the tender offer.
to determine the conversion ratio for the tender offer.
Manpower Inc. 2010 2nd Quarter Results
July 2010
16
Balance Sheet Highlights
Total Debt
($ in millions)
Total Debt to
Total Capitalization
Total Debt
Net Debt
2010
2010
Manpower Inc. 2010 2nd Quarter Results
July 2010
17
(b)
(b)
Credit Facilities as of June 30, 2010
($ in millions)
($ in millions)
(a)
(a)
This $400M agreement requires, as of June 30, that we comply with a Debt-to-EBITDA ratio of less than 6.00 to 1 and a fixed charge coverage
ratio of greater than 1.25 to 1. As defined in the agreement, we had a Debt-to-EBITDA ratio of 2.13 and a fixed charge coverage ratio of 1.84
as of June 30, 2010.
ratio of greater than 1.25 to 1. As defined in the agreement, we had a Debt-to-EBITDA ratio of 2.13 and a fixed charge coverage ratio of 1.84
as of June 30, 2010.
As of June 30, there were $4.0M of standby letters of credit issued under the agreement.
Interest
Rate
Maturity
Date
Total
Outstanding
Remaining
Available
Euro Notes:
- Euro 200M
4.86%
June 2013
244
-
- Euro 300M
4.58%
June 2012
367
-
Revolving Credit Agreement
2.90%
Nov 2012
-
396
346
Uncommitted lines and Other
Various
Various
37
Total Debt
648
742
Manpower Inc. 2010 2nd Quarter Results
July 2010
18
Third Quarter Outlook
Revenue
Americas
Up 60-62%
France
Up 2-4%
(Up 14-16% CC)
Up 18-20%
Asia Pacific
(Up 14-16% CC)
Jefferson Wells
Right Management
Down 34-36%
(Down 32-34% CC)
Up 13-15%
(Up 20-22% CC)
Total
Gross Profit Margin
16.8-17.0%
Operating Profit Margin
1.8-2.0%
Tax Rate
52%
EPS
$0.41-$0.51 (Neg. $.04 Currency)
Down 10-12%
EMEA
(Up 17-19% CC)
Up 8-10%
(Up 56-58% CC)

2010 2nd Quarter
Results
Results
Manpower Inc.