Attached files
| file | filename |
|---|---|
| 8-K - POLARIS INDUSTRIES INC. 8-K - Polaris Inc. | a6365223.htm |
| EX-99.1 - EXHIBIT 99.1 - Polaris Inc. | a6365223_ex991.htm |
Exhibit 99.2

Polaris Industries Inc. Second Quarter 2010 Earnings Results July 20, 2010
1Safe Harbor Except for historical information contained herein, the matters set forth in this document, including but not limited to management’s expectations regarding 2010 sales, shipments, net income, cash flow, and manufacturing realignment transition costs and savings, are forward-looking statements that involve certain risks and uncertainties that could cause actual results to differ materially from those forward-looking statements. Potential risks and uncertainties include such factors as product offerings, promotional activities and pricing strategies by competitors; manufacturing realignment transition costs, warranty expenses; foreign currency exchange rate fluctuations; effects of the KTM relationship; environmental and product safety regulatory activity; effects of weather; commodity costs; uninsured product liability claims; uncertainty in the retail and wholesale credit markets; changes in tax policy and overall economic conditions, including inflation, consumer confidence and spending and relationships with dealers and suppliers. Investors are also directed to consider other risks and uncertainties discussed in our 2009 annual report and Form 10-K filed by the Company with the Securities and Exchange Commission. The Company does not undertake any duty to any person to provide updates to its forward-looking statements.The data source for retail sales figures included in this presentation is registration information provided by Polaris dealers in North America and compiled by the Company or Company estimates. The Company must rely on information that its dealers supply concerning retail sales, and other retail sales data sources and this information is subject to revision.
Polaris Industries Inc. 2nd Quarter 2010 Earnings Results Scott Wine CEO
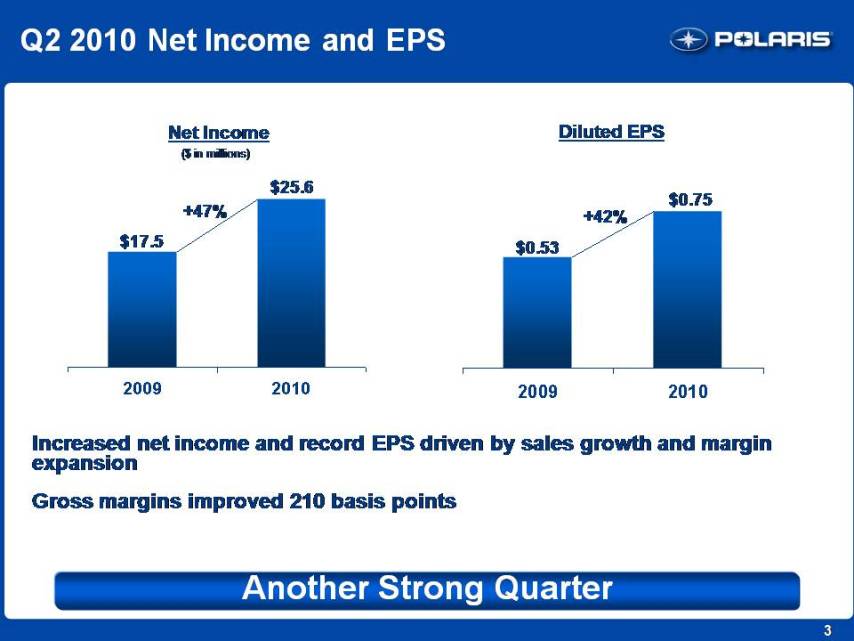
3 Q2 2010 Net Income and EPS Diluted EPS $0.53 $0.75 +42% Net Income ($ in millions) $17.5 $25.6 +47% 2009 2010 Increased net income and record EPS driven by sales growth and margin expansion Gross margins improved 210 basis points Another Strong Quarter
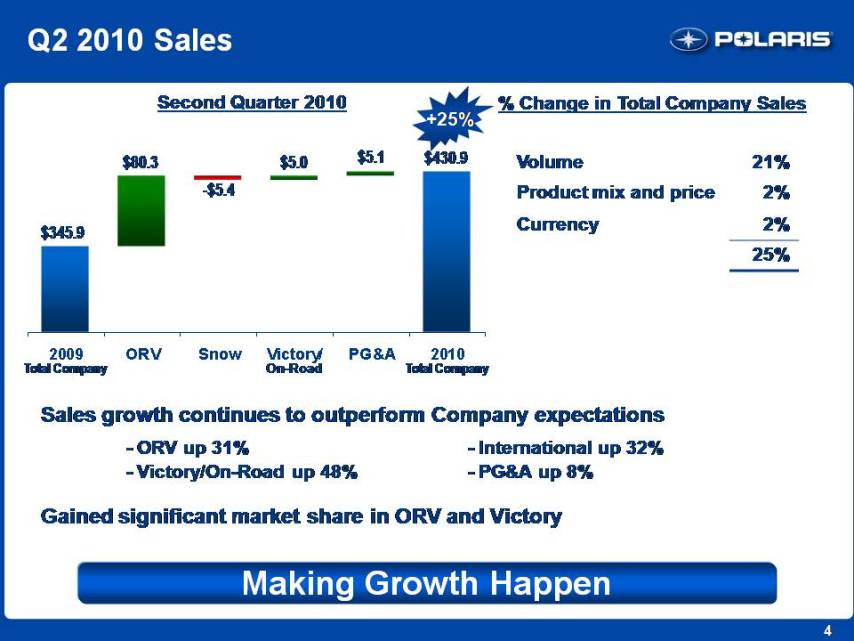
4 Q2 2010 Sales Second Quarter 2010 $345.9 $80.3 -$5.4 $5.0 $5.1 $430.9 Total Company Total Company +25% % Change in Total Company Sales 2009 ORV Snow Victory/On-Road PG&A 2010 Sales growth continues to outperform Company expectations - ORV up 31% - International up 32% - Victory/On-Road up 48% - PG&A up 8% Gained significant market share in ORV and Victory Volume 21% Product mix and price 2% Currency 2% 25% Making Growth Happen
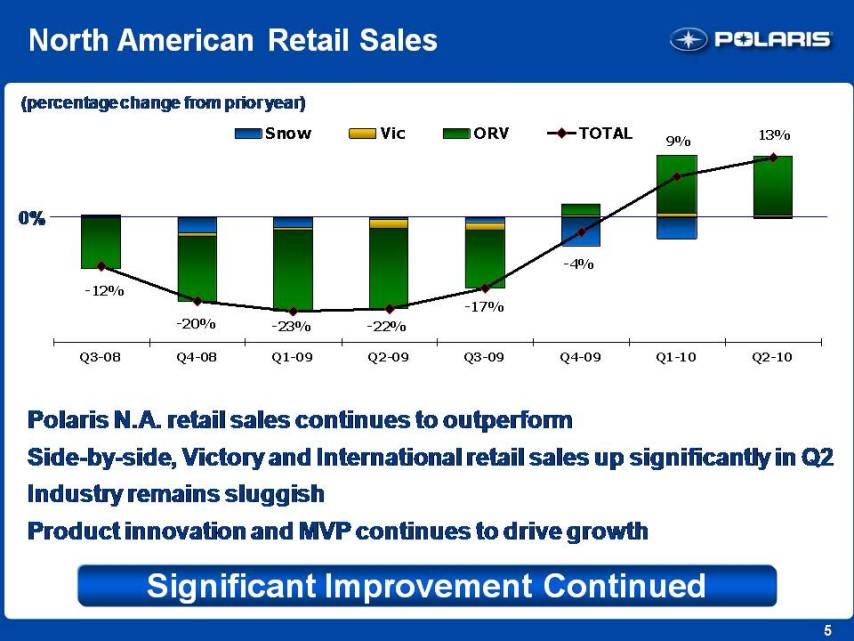
5 North American Retail Sales Polaris N.A. retail sales continues to outperform Side-by-side, Victory and International retail sales up significantly in Q2 Industry remains sluggish Product innovation and MVP continues to drive growth 0% (percentage change from prior year) Significant Improvement Continued Snow Vic ORV Total -12% -20% -23% -22% -17% -4% 9% 13% Q3-08 Q4-08 Q1-09 Q2-09 Q3-09 Q4-09 Q1-10 Q2-10
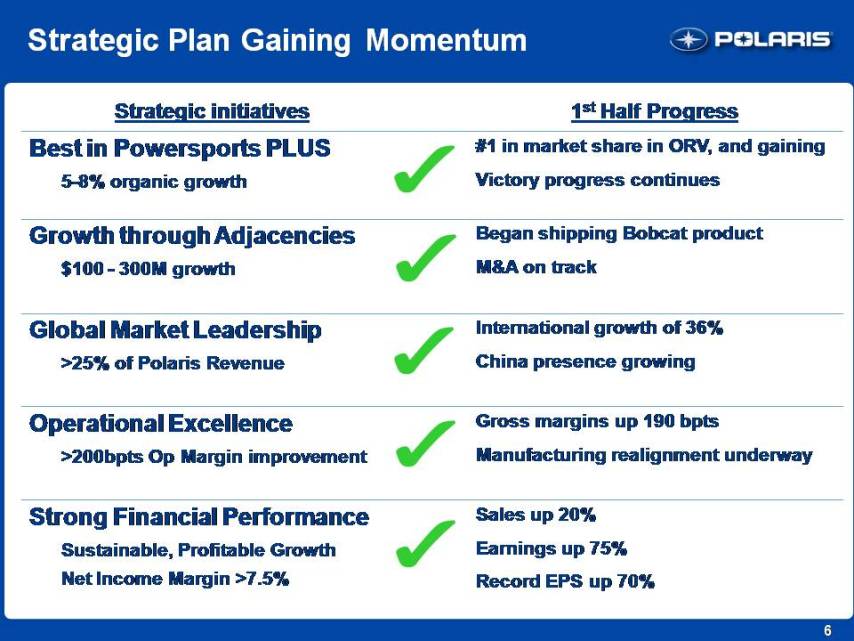
6 Strategic Plan Gaining Momentum Strategic initiatives 1st Half Progress Best in Powersports PLUS 5-8% organic growth #1 in market share in ORV, and gaining Victory progress continues Growth through Adjacencies $100 - 300M growth Began shipping Bobcat product M&A on track Global Market Leadership >25% of Polaris Revenue International growth of 36% China presence growing Operational Excellence >Gross margins up 190 bpts >200bpts Op Margin improvement Manufacturing realignment underway Strong Financial Performance Sustainable, Profitable Growth Sales up 20% Earnings up 75% Net Income Margin >7.5% Record EPS up 70%
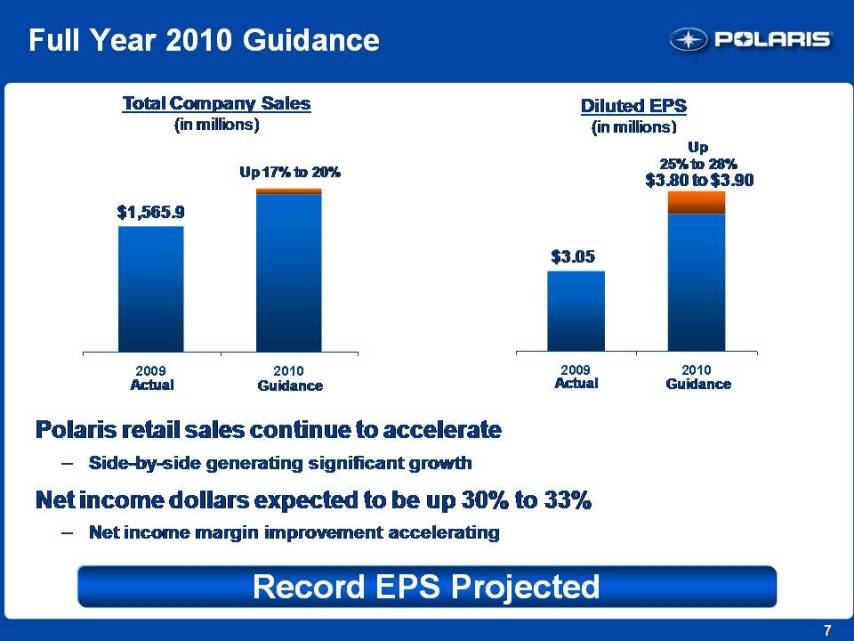
7 Full Year 2010 Guidance Polaris retail sales continue to accelerate Side-by-side generating significant growth Net income dollars expected to be up 30% to 33% Net income margin improvement accelerating Total Company Sales(in millions) Diluted EPS(in millions) $1,565.9 Up 17% to 20% Actual Guidance 2009 2010 $3.05 Up25% to 28% $3.80 to $3.90 Actual Guidance 2009 2010 Record EPS Projected
Polaris Industries Inc. 2nd Quarter 2010 Earnings Results Bennett Morgan President & COO
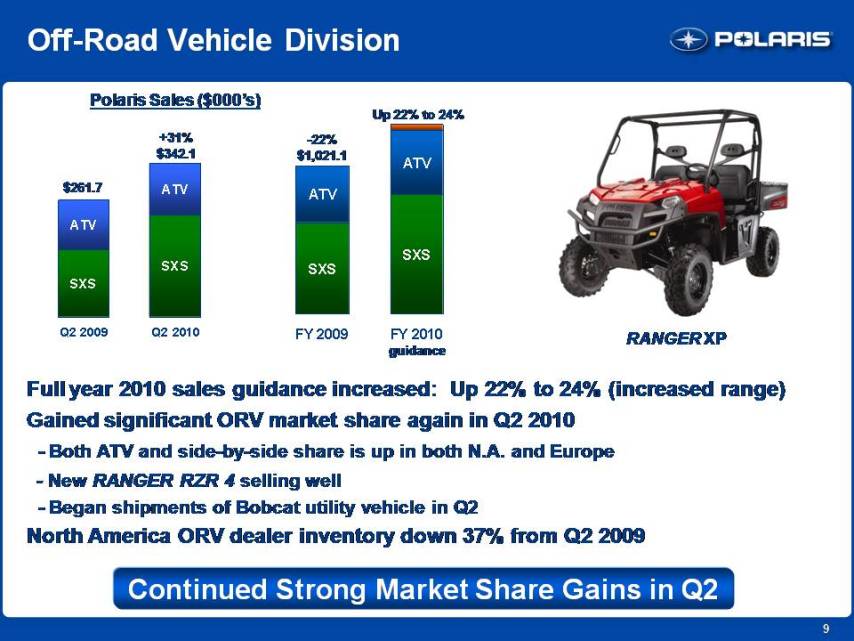
9 Off-Road Vehicle Division Polaris Sales ($000’s) $261.7 +31% Full year 2010 sales guidance increased: Up 22% to 24% (increased range) Gained significant ORV market share again in Q2 2010 - Both ATV and side-by-side share is up in both N.A. and Europe - New RANGER RZR 4 selling well - Began shipments of Bobcat utility vehicle in Q2 North America ORV dealer inventory down 37% from Q2 2009 Continued Strong Market Share Gains in Q2 RANGER XP $342.1 guidance -22% $1,021.1 Up 22% to 24% Q2 2009 Q2 2010 FY 2009 FY 2010 ATV SXS
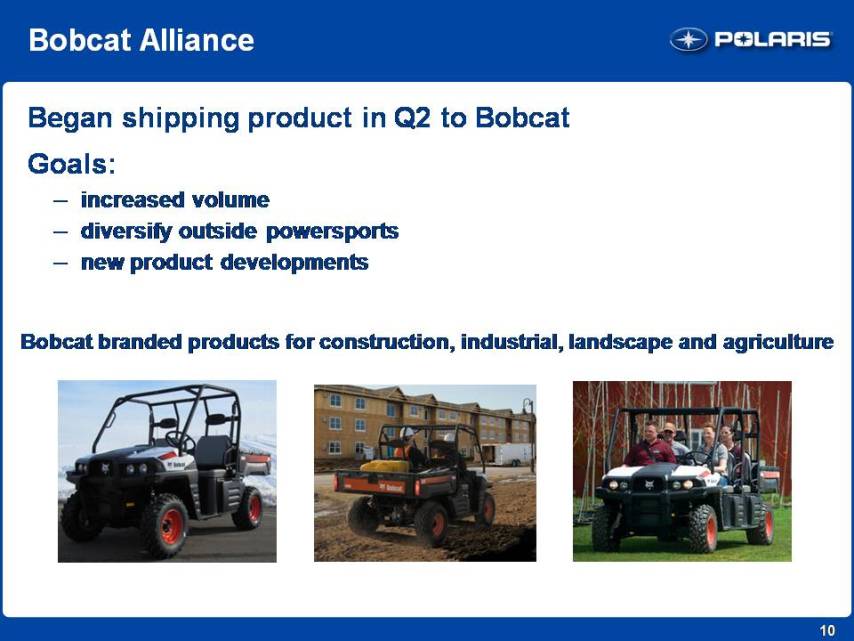
10 Bobcat branded products for construction, industrial, landscape and agriculture Bobcat Alliance Began shipping product in Q2 to Bobcat Goals: increased volume diversify outside powersports new product developments
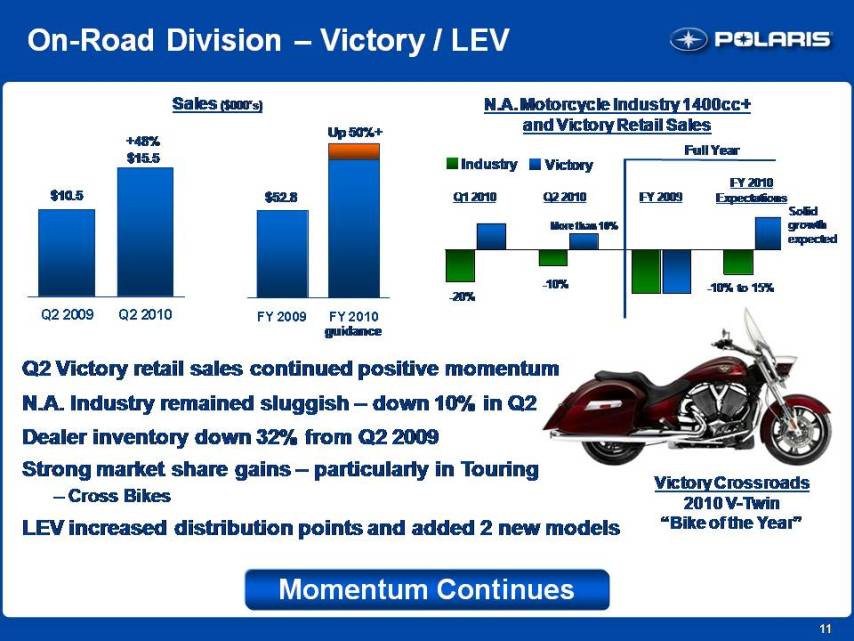
11 On-Road Division – Victory / LEV Sales ($000’s) $10.5 +48% $15.5 Momentum Continues N.A. Motorcycle Industry 1400cc+ and Victory Retail Sales guidance $52.8 Up 50%+ Victory Crossroads 2010 V-Twin “Bike of the Year” Q1 2010 Full Year Q2 2010 Victory Industry FY 2009 FY2010 Expectations Solid growth expected -20% -10% More than 10% -10% to 15% Q2 Victory retail sales continued positive momentum N.A. Industry remained sluggish – down 10% in Q2 Dealer inventory down 32% from Q2 2009 Strong market share gains – particularly in Touring – Cross Bikes LEV increased distribution points and added 2 new models
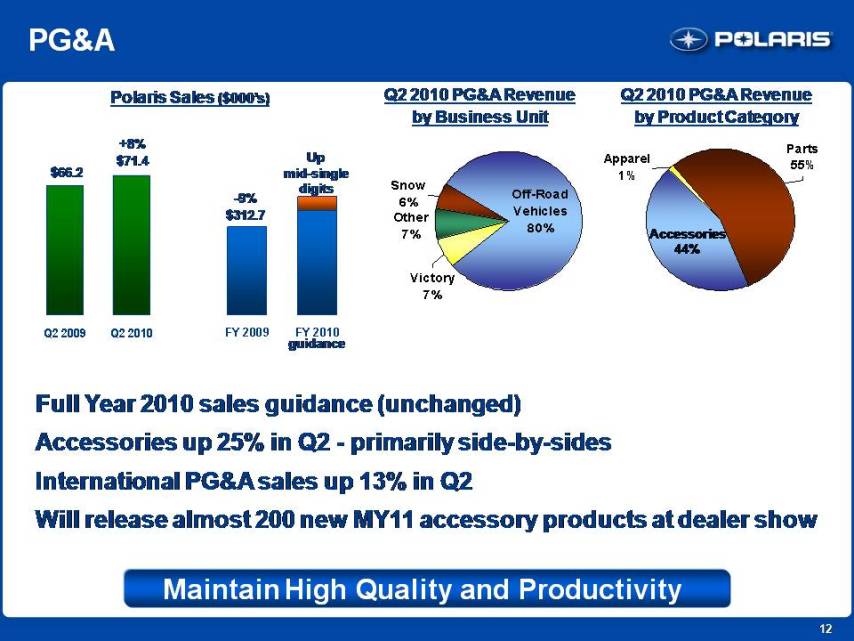
12 PG&A Polaris Sales ($000’s) $66.2 +8% $71.4 Q2 2010 PG&A Revenue by Business Unit Q2 2010 PG&A Revenue by Product Category Accessories 44% Full Year 2010 sales guidance (unchanged) Accessories up 25% in Q2 - primarily side-by-sides International PG&A sales up 13% in Q2 Will release almost 200 new MY11 accessory products at dealer show Maintain High Quality and Productivity -9% $312.7 Up mid-single digits guidance Q2 2009 FY 2009 FY 2010 Snow 6% Other 7% Victory 7% Off-Road Vehicles 80% Apparel 1% Parts 55%
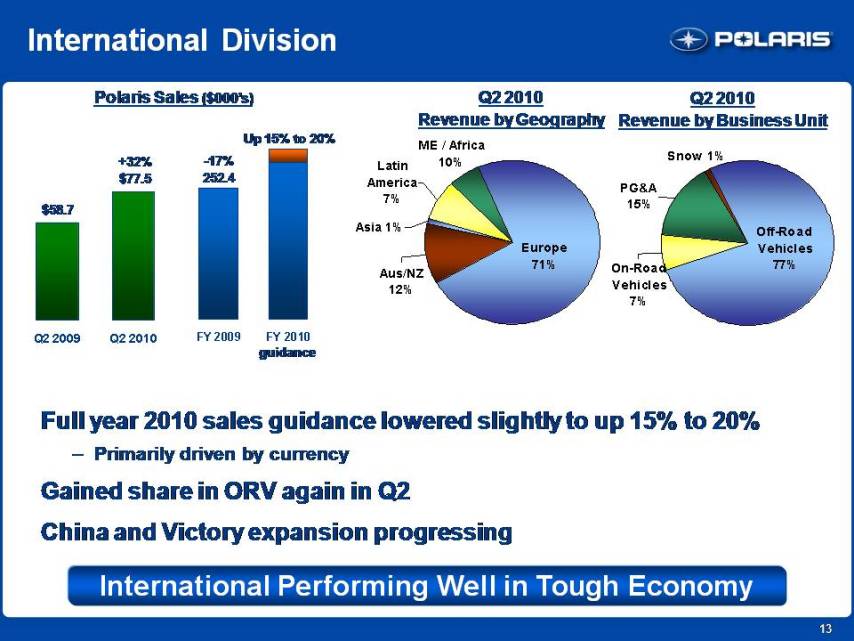
13 International Division Polaris Sales ($000’s) $58.7 +32% $77.5 Q2 2010 Revenue by Geography Q2 2010 Revenue by Business Unit Full year 2010 sales guidance lowered slightly to up 15% to 20% - Primarily driven by currency Gained share in ORV again in Q2 China and Victory expansion progressing International Performing Well in Tough Economy -17% 252.4 Up 15% to 20% guidance Q2 2009 FY 2009 FY 2010 ME / Africa 10% Latin America 7% Asia 1% Aus/NZ 12% Europe 71% Snow 1% PG&A 15% On-Road Vehicles 7% Off-Road Vehicles 77%
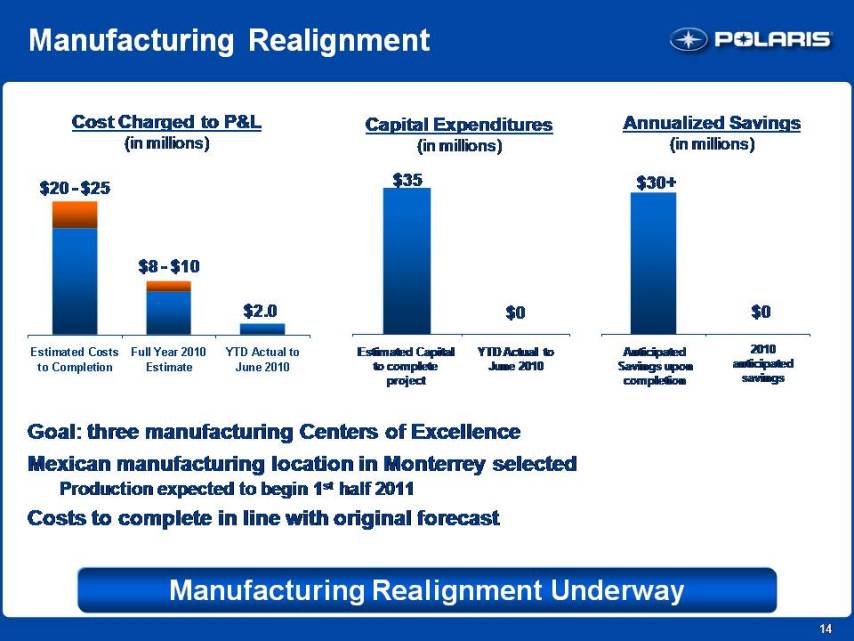
14 Manufacturing Realignment Goal: three manufacturing Centers of Excellence Mexican manufacturing location in Monterrey selected Production expected to begin 1st half 2011Costs to complete in line with original forecast Cost Charged to P&L(in millions) Annualized Savings(in millions) Manufacturing Realignment Underway $20 - $25 $8 - $10 $2.0 Anticipated Savings upon completion $30+ Capital Expenditures(in millions) $35 Estimated Capital to complete project YTD Actual to June 2010 $0 2010 anticipated savings $0 Estimated Costs to Completion Full Year 2010 Estimate YTD Actual to June 2010
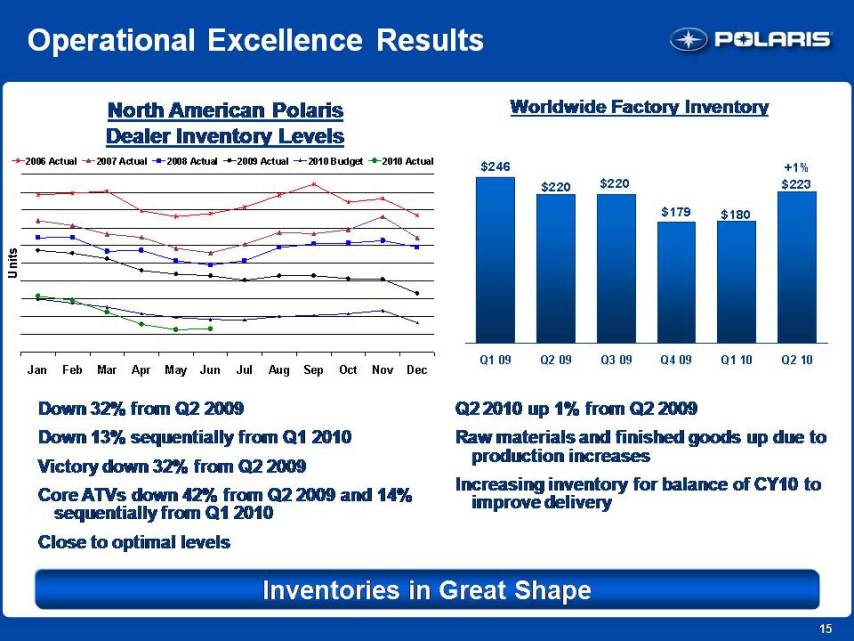
15 Operational Excellence Results Q2 2010 up 1% from Q2 2009 Raw materials and finished goods up due to production increases Increasing inventory for balance of CY10 to improve delivery Worldwide Factory Inventory Inventories in Great Shape North American Polaris Dealer Inventory Levels Down 32% from Q2 2009 Down 13% sequentially from Q1 2010 Victory down 32% from Q2 2009 Core ATVs down 42% from Q2 2009 and 14% sequentially from Q1 2010 Close to optimal levels +1% $223 $246 $220 $220 2006 Actual 2007 Actual 2008 Actual 2009 Actual 2010 Budget 2010 Actual $180 $179 Units Q1 09 Q2 09 Q3 09 Q4 09 Q1 10 Q2 10 Jan Feb Mar Apr May Jun Jul Aug Sep Oct Nov Dec
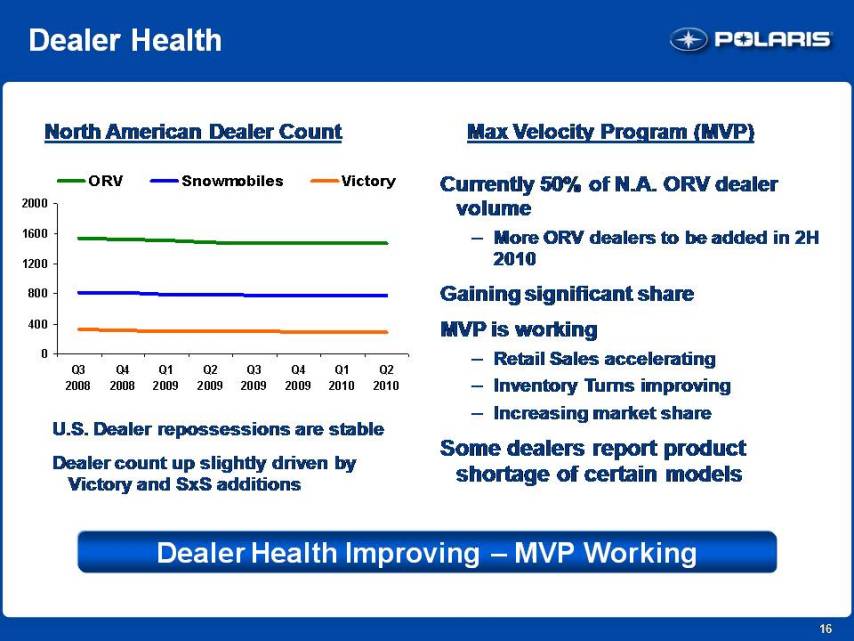
16 Dealer Health North American Dealer Count U.S. Dealer repossessions are stable Dealer count up slightly driven by Victory and SxS additions Dealer Health Improving – MVP Working Currently 50% of N.A. ORV dealer volume - More ORV dealers to be added in 2H 2010 Gaining significant share MVP is working - Retail Sales accelerating - Inventory Turns improving - Increasing market share Some dealers report product shortage of certain models Max Velocity Program (MVP) ORV Snowmobiles Victory 2000 1600 1200 800 400 0 Q3 2008 Q4 2008 Q1 2009 Q2 2009 Q3 2009 Q4 2009 Q1 2010 Q2 2010
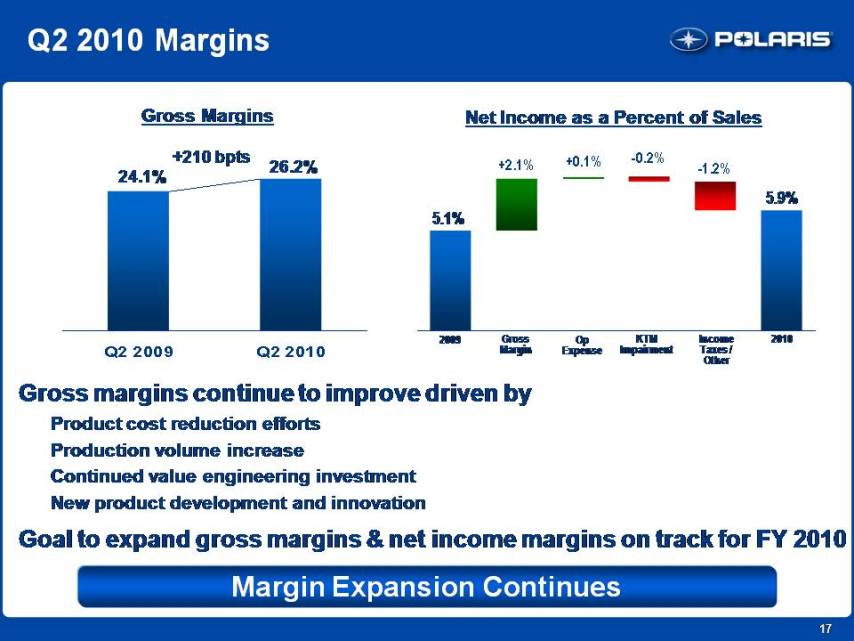
17 24.1% 26.2% +210 bpts Q2 2010 Margins Net Income as a Percent of Sales Gross Margins Gross Margin Op Expense KTM Impairment IncomeTaxes /Other 5.1% 5.9% 2009 2010 Margin Expansion Continues Gross margins continue to improve driven by Product cost reduction efforts Production volume increase Continued value engineering investment New product development and innovation Goal to expand gross margins & net income margins on track for FY 2010 Q2 2009 Q2 2010
Polaris Industries Inc. 2nd Quarter 2010 Earnings Results Mike Malone V.P. Finance and CFO
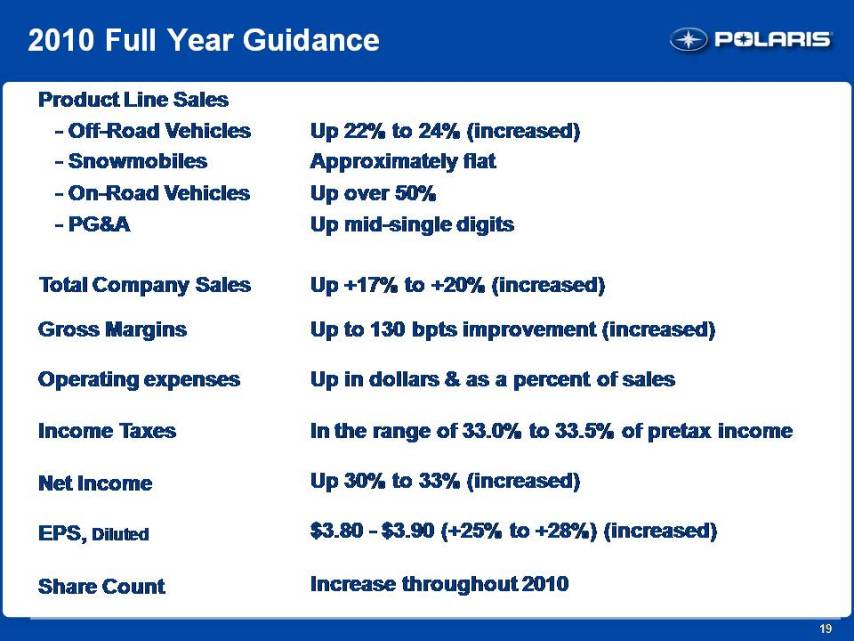
19 2010 Full Year Guidance Product Line Sales - Off-Road Vehicles Up 22% to 24% (increased) – Snowmobiles Approximately flat - On-Road Vehicles Up over 50% - PG&A Up mid-single digits Total Company Sales Up 17% to +20% (increased) Gross Margins Up to 130 bpts improvement (increased) Operating expenses Up in dollars & as a percent of sales Income Taxes In the range of 33.0% to 33.5% of pretax income Net Income Up 30% to 33% (increased) EPS, Diluted $3.80 - $3.90 (+25% to +28%) (increased) Share Count Increase throughout 2010
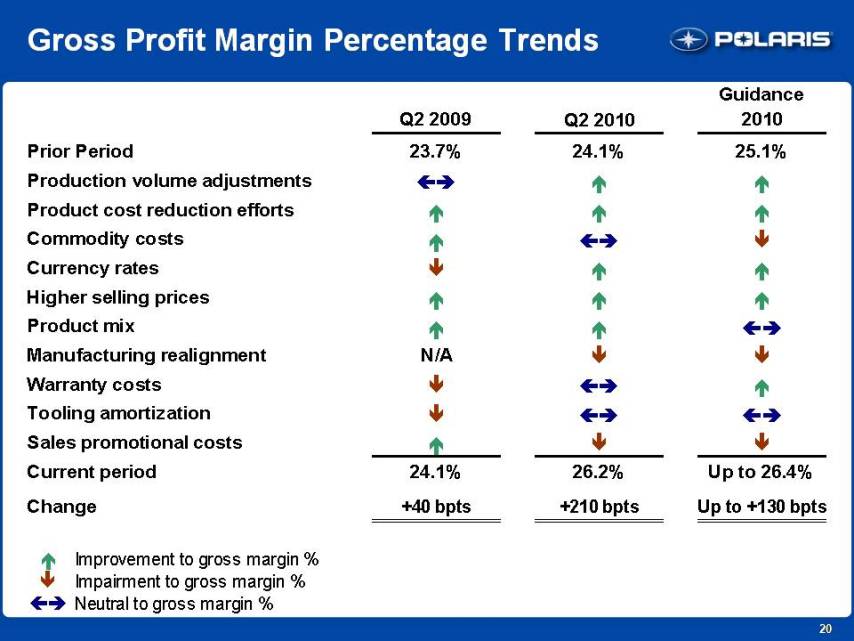
20 Gross Profit Margin Percentage Trends Guidance Q2 2009 Q2 2010 2010 Prior Period 23.7% 24.1% 25.1% Production volume adjustments Product cost reduction efforts Commodity costs Currency rates Higher selling prices Product mix Manufacturing realignment N/A Warranty costs Tooling amortization Sales promotional costs Current period 24.1% 26.2% Up to 26.4% Change +40 bpts +210 bpts Up to +130 bpts Improvement to gross margin % Impairment to gross margin % Neutral to gross margin %
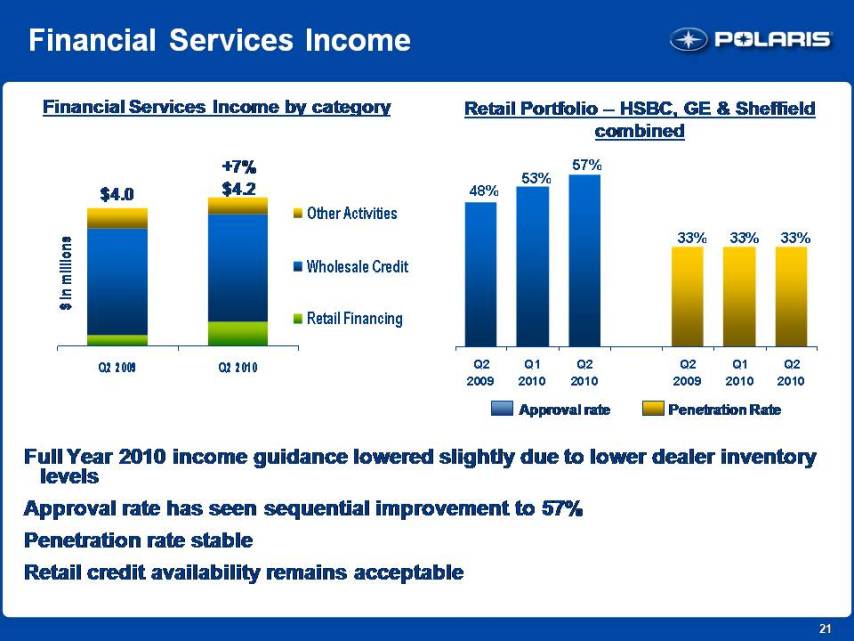
21 Financial Services Income Full Year 2010 income guidance lowered slightly due to lower dealer inventory levels Approval rate has seen sequential improvement to 57% Penetration rate stable Retail credit availability remains acceptable Financial Services Income by category Retail Portfolio – HSBC, GE & Sheffield combined Penetration Rate Approval rate +7% $4.2 $4.0 $ in millions Other Activities Wholesale Credit Retail Financing Q2 2009 Q2 2010 48% 53% 57% 33% 33% 33% Q1 2010
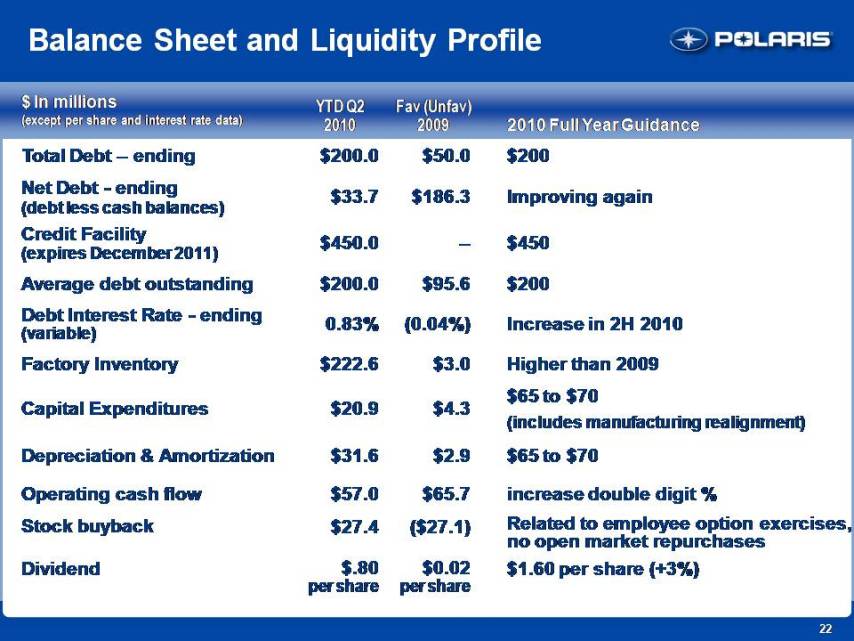
22 Balance Sheet and Liquidity Total Debt – ending $200.0 $50.0 $200 Net Debt – ending (debt less cash balances) $33.7 $186.3 Improving again Credit Facility (expires December 2011) $450.0 – $450 Average debt outstanding $200.0 $95.6 $200 Debt Interest Rate – ending (variable) 0.83% (0.04%) Increase in 2H 2010 Factory Inventory $222.6 $3.0 Higher than 2009 Capital Expenditures $20.9 $4.3 $65 to $70 (includes manufacturing realignment) Depreciation & Amortization $31.6 $2.9 $65 to $70 Operating cash flow $57.0 $65.7 increase double digit % Stock buyback $27.4 ($27.1) Related to employee option exercises, no open market repurchases Dividend $.80 per share $0.02 per share $1.60 per share (+3%) $ In Millions (except per share and interest rate data) YTD Q2 2010 Fav (Unfav) 2009 2010 Full Year Guidance
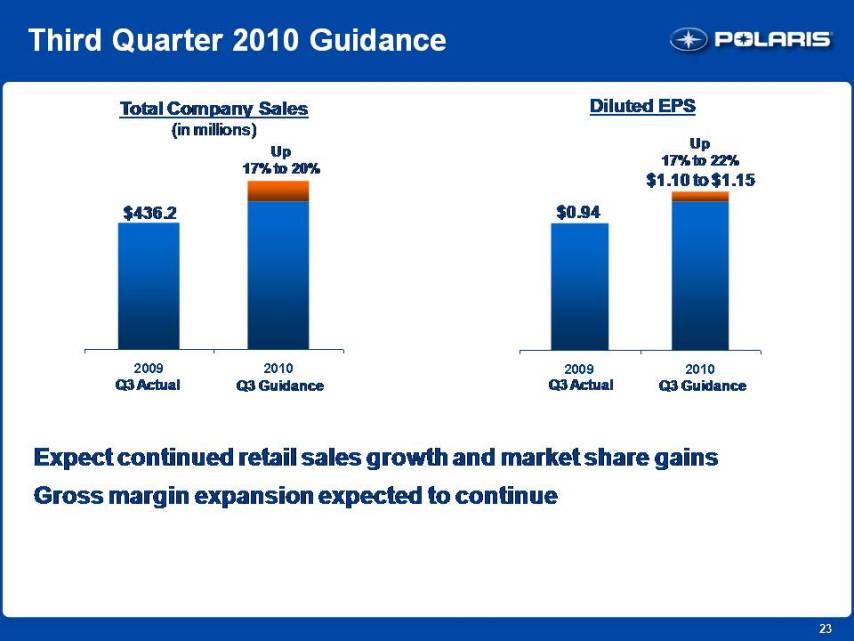
23 Up17% to 20% Third Quarter 2010 Guidance Expect continued retail sales growth and market share gains Gross margin expansion expected to continue Total Company Sales(in millions) Diluted EPS $436.2 Q3 Actual Q3 Guidance $0.94 $1.10 to $1.15 Up17% to 22% Q3 Actual Q3 Guidance 2009 2010

Polaris Industries Inc. 2nd Quarter 2010 Earnings Results Scott Wine CEO
25 Priorities for 2nd Half 2010 Make growth happen Ramp up production to meet demand Expand & improve MVP Execute manufacturing realignment plan Great Dealer Show – New Product Introductions Maintaining Momentum, Staying on Strategy
26 Polaris Industries Inc. Thank you. Q & A