Attached files
| file | filename |
|---|---|
| EX-21.1 - EXHIBIT 21.1 TO FORM 10-K - NATIONAL SEMICONDUCTOR CORP | exhibit_211.htm |
| EX-32.1 - EXHIBIT 32.1 TO FORM 10-K - NATIONAL SEMICONDUCTOR CORP | exhibit_321.htm |
| EX-24.1 - EXHIBIT 24.1 TO FORM 10-K - NATIONAL SEMICONDUCTOR CORP | exhibit_241.htm |
| EX-10.24 - EXHIBIT 10.25 TO FORM 10-K - NATIONAL SEMICONDUCTOR CORP | exhibit_1025.htm |
| EX-10.24 - EXHIBIT 10.24 TO FORM 10-K - NATIONAL SEMICONDUCTOR CORP | exhibit_1024.htm |
| EX-31.1 - EXHIBIT 31.1 TO FORM 10-K - NATIONAL SEMICONDUCTOR CORP | exhibit_311.htm |
Washington,
D.C. 20549
FORM
10-K
|
|
X ANNUAL
REPORT PURSUANT TO SECTION 13 OR 15(d) OF THE SECURITIES EXCHANGE ACT OF
1934
|
For
the fiscal year ended May 30, 2010.
or
|
|
TRANSITION
REPORT PURSUANT TO SECTION 13 OR 15(d) OF THE SECURITIES EXCHANGE ACT OF
1934
|
For
the transition period from _________ to _________.
Commission
File Number: 1-6453
NATIONAL
SEMICONDUCTOR CORPORATION
(Exact
name of registrant as specified in its charter)
|
DELAWARE
|
95-2095071
|
|
(State
of Incorporation)
|
(I.R.S.
Employer
Identification
Number)
|
2900
SEMICONDUCTOR DRIVE, P.O. BOX 58090
SANTA CLARA, CALIFORNIA
95052-8090
(Address
of principal executive offices)
Registrant’s
telephone number, including area code: (408) 721-5000
Securities
registered pursuant to Section 12(b) of the Act:
|
Title of Each Class
|
Name of Each Exchange on Which
Registered
|
|
|
Common
stock, par value $0.50 per share
|
New
York Stock Exchange
|
Securities
registered pursuant to Section 12(g) of the Act:
|
None
|
||
|
(Title
of class)
|
Page 1 of
98
Indicate
by check mark if the registrant is a well-known seasoned issuer, as defined in
Rule 405 of the Securities Act.
|
Yes
S
|
No
£
|
Indicate
by check mark if the registrant is not required to file reports pursuant to
Section 13 or Section 15(d) of the Act.
|
Yes
£
|
No
S
|
Indicate
by check mark whether the registrant: (1) has filed all reports
required to be filed by Section 13 or 15(d) of the Securities Exchange Act of
1934 during the preceding 12 months (or for such shorter period that the
registrant was required to file such reports), and (2) has been subject to such
filing requirements for the past 90 days.
|
Yes
S
|
No
£
|
Indicate
by check mark whether the registrant has submitted electronically and posted on
its corporate Web site, if any, every Interactive Data File required to be
submitted and posted pursuant to Rule 405 of Regulation S-T (§ 232.405 of this
chapter) during the preceding 12 months (or for such shorter period that the
registrant was required to submit and post such files).
|
Yes
£
|
No
£
|
Indicate
by check mark if disclosure of delinquent filers pursuant to Item 405 of
Regulation S-K (§ 229.405 of this chapter) is not contained herein, and will not
be contained, to the best of registrant’s knowledge, in definitive proxy or
information statements incorporated by reference in Part III of this Form 10-K
or any amendment to this Form 10-K. £
Indicate
by check mark whether the registrant is a large accelerated filer, an
accelerated filer, a non-accelerated filer, or a smaller reporting
company. See the definitions of “large accelerated filer,”
“accelerated filer,” and “smaller reporting company” in Rule 12b-2 of the
Exchange Act (check one):
|
Large
Accelerated filer S
|
Non-accelerated
filer £
|
||
|
Accelerated
filer £
|
Smaller
reporting company £
|
Indicate
by check mark whether the registrant is a shell company (as defined in Rule
12b-2 of the Exchange Act).
|
Yes
£
|
No
S
|
The
aggregate market value of our common stock held by non-affiliates of the
registrant as of November 29, 2009, was approximately $2,894,742,461 based on
the last reported sale price on the last trading date prior to that date. Shares
of common stock held by each officer and director and by each person who owns 5
percent or more of the outstanding common stock have been excluded because these
persons may be considered to be affiliates. This determination of affiliate
status for purposes of this calculation is not necessarily a conclusive
determination for other purposes.
The
number of shares outstanding of the registrant’s common stock, $0.50 par value,
as of June 27, 2010 was 239,324,550 shares.
DOCUMENTS
INCORPORATED BY REFERENCE
|
Document
|
Location in Form 10-K
|
|
|
Portions
of the Proxy Statement for the Annual Meeting of Stockholders to be held
on or about September 24, 2010
|
Part
III
|
|
Page 2 of
98
NATIONAL
SEMICONDUCTOR CORPORATION
TABLE
OF CONTENTS
|
PART
I
|
Page No
|
|
|
Item
1.
|
Business
|
4
|
|
Item
1A.
|
Risk
Factors
|
12
|
|
Item
1B.
|
Unresolved
Staff Comments
|
18
|
|
Item
2.
|
Properties
|
19
|
|
Item
3.
|
Legal
Proceedings
|
20
|
|
Item
4.
|
[REMOVED
AND RESERVED]
|
20
|
|
Executive
Officers of the Registrant
|
21
|
|
|
PART
II
|
||
|
Item
5.
|
Market
for Registrant’s Common Equity, Related Stockholder Matters and Issuer
Purchases of Equity Securities
|
23
|
|
Item
6.
|
Selected
Financial Data
|
25
|
|
Item
7.
|
Management’s
Discussion and Analysis of Financial Condition and Results of
Operations
|
26
|
|
Item
7A.
|
Quantitative
and Qualitative Disclosures about Market Risk
|
40
|
|
Item
8.
|
Financial
Statements and Supplementary Data
|
41
|
|
Item
9.
|
Changes
in and Disagreements with Accountants on Accounting and Financial
Disclosure
|
87
|
|
Item
9A.
|
Controls
and Procedures
|
87
|
|
Item
9B.
|
Other
Information
|
88
|
|
PART
III
|
||
|
Item
10.
|
Directors,
Executive Officers and Corporate Governance
|
89
|
|
Item
11.
|
Executive
Compensation
|
89
|
|
Item
12.
|
Security
Ownership of Certain Beneficial Owners and Management and Related
Stockholder Matters
|
90
|
|
Item
13.
|
Certain
Relationships and Related Transactions, and Director
Independence
|
91
|
|
Item
14.
|
Principal
Accountant Fees and Services
|
91
|
|
PART
IV
|
||
|
Item
15.
|
Exhibits
and Financial Statement Schedules
|
92
|
|
Signatures
|
94
|
|
Page 3 of
98
PART I
ITEM
1. BUSINESS
This
Annual Report on Form 10-K contains forward-looking statements within the
meaning of Section 27A of the Securities Act of 1933 and Section 21E
of the Securities Exchange Act of 1934. These statements are based on our
current expectations and could be affected by the uncertainties and risk factors
described throughout this filing and particularly in Part I “Item 1A. Risk
Factors” and the “Outlook” section in Part II, “Item 7. Management’s Discussion
and Analysis of Financial Condition and Results of Operations,” of this Form
10-K. These statements relate to, among other things, sales, gross margins,
operating expenses, capital expenditures, economic and market conditions,
research and development efforts, asset dispositions, and acquisitions of and
investments in other companies, and are indicated by words or phrases such as
“anticipate,” “expect,” “outlook,” “foresee,” “believe,” “could,” “intend,”
“will,” and similar words or phrases. These statements involve risks and
uncertainties that could cause actual results to differ materially from
expectations. These forward-looking statements should not be relied upon as
predictions of future events as we cannot assure you that the events or
circumstances reflected in these statements will be achieved or will occur. For
a discussion of some of the factors that could cause actual results to differ
materially from our forward-looking statements, see the discussion on risk
factors that appears in Part I, Item 1A of this Form 10-K and other risks and
uncertainties detailed in this and our other reports and filings with the
Securities and Exchange Commission (SEC). We undertake no obligation to update
forward-looking statements to reflect developments or information obtained after
the date hereof and disclaim any obligation to do so.
Overview
We are
one of the world's leading semiconductor companies focused on analog and
mixed-signal integrated circuits and sub-systems, particularly in the area of
power management. Founded in 1959, we design, develop, manufacture and market
high-value, high-performance, analog-intensive solutions that improve
performance and energy efficiency in electronic systems. We have a diversified
product portfolio which includes power management circuits, audio and
operational amplifiers, communication interface products and data conversion
solutions. Our portfolio of over 13,000 products is sold to a diversified group
of end-customers, ranging from smaller customers serviced by an extensive
distribution network to large original equipment manufacturers (OEMs).
Energy-efficiency is our overarching theme and our PowerWise® products enable
systems that consume less power, extend battery life and generate less heat. We
target a broad range of markets and applications such as:
|
·
|
wireless
handsets (including smart phones) and other
portable
applications
|
·
|
automotive
applications
|
|
·
|
factory
and office automation
|
||
|
·
|
wireless
basestations
|
·
|
medical
applications
|
|
·
|
network
infrastructure
|
·
|
photovoltaic
systems
|
|
·
|
industrial
and sensing applications
|
We
benefit from an extensive intellectual property portfolio that includes more
than 3,000 patents. We are focused on supporting the innovation needed for a
strong new product development pipeline.
For
fiscal 2010, our net sales were $1.4 billion, our operating income was
$325.8 million and our net income was $209.2 million. A large portion
of our sales come from analog products that are classified within the general
purpose analog categories (as defined by the World Semiconductor Trade
Statistics or WSTS). General purpose analog products are defined by WSTS as
amplifiers, signal conversion, power management and interface products,
representing the fundamental circuits that electronic systems need in order to
deal with continuously varying signals of the real world, such as light, sound,
pressure, temperature and speed. Within the general purpose analog market, our
strengths have historically been in the power management, amplifier and
interface areas where higher performance coupled with ease of use typically
result in higher gross margins. In addition to general purpose analog products,
we also develop application-specific analog sub-systems that typically carry
higher values and are often targeted at high-growth markets.
Approximately
94 percent of our revenue in fiscal 2010 was generated from Analog segment
products. Our product line operations are organized under one group called the
Product Group, which is responsible for designing and developing a wide range of
analog integrated circuits, many of which convert and regulate voltages to
ensure that electronic systems operate to their fullest potential with the
lowest overall power consumption or the highest energy efficiency. It also
designs and develops integrated circuits that handle the requisite analog
technology for information or data as it travels from the point where it enters
the electronic system, is conditioned, converted and processed to the point
where it is sent out. In addition to
Page 4 of
98
providing
real world interfaces, these products are used extensively in signal
conditioning, signal conversion (from analog to digital and vice versa) and
high-speed interfacing applications.
National Semiconductor Corporation was
incorporated in the state of Delaware in 1959 and our headquarters have been in
Santa Clara, California since 1967. Our common stock is listed on the New York
Stock Exchange under the trading symbol "NSM." Our fiscal year ends on the last
Sunday of May and references in this document to fiscal 2010 refer to our fiscal
year ended May 30, 2010. References to fiscal 2009 refer to our fiscal year
ended May 31, 2009 and references to fiscal 2008 refer to our fiscal year
ended May 25, 2008. Fiscal 2010 was a 52-week year, while fiscal 2009 was a
53-week year. Operating results for this additional week in fiscal 2009 were
considered immaterial to our consolidated results of operations in fiscal 2009.
Fiscal 2008 was a 52-week year. Our internet address is www.national.com. We
post the following filings in the “Investor Relations” section of our website as
soon as reasonably practicable after they are electronically filed with or
furnished to the SEC: our annual report on Form 10-K, our quarterly reports
on Form 10-Q, our current reports on Form 8-K, our proxy statement and
any amendments to those reports filed or furnished pursuant to
Section 13(a) or 15(d) of the Exchange Act. All of the filings on our
website are available free of charge. We also maintain certain corporate
governance documents on our website, including our Code of Business Conduct and
Ethics, Governance Committee Charter, Compensation Committee Charter, Audit
Committee Charter and other governance policies. We do not intend for
information found on our website to be part of this document or part of any
other report or filing with the SEC.
References in this report to
“National,” “we”, “us,” “our” and “the company” mean National Semiconductor
Corporation and its consolidated subsidiaries.
Recent
Highlights
Throughout
fiscal 2010, we experienced sequential revenue growth in each quarter from our
core analog product areas, consistent with improved business conditions in the
industry. As a part of our business focus, we periodically identify
opportunities to improve our cost structure or to divest or reduce involvement
in product areas that are not in line with our business objectives, as well as
pursue acquisitions or business investments to gain access to key technologies
that we believe augment our existing technical capability and support our
business objectives. Those activities in fiscal 2010 included the realignment of
certain product line business units in May 2010, which resulted in a workforce
reduction due to the related exit activities (See Note 6 to the Consolidated
Financial Statements). We completed the closure of our China assembly and test
plant in August 2009 and our Texas wafer fabrication facility in May 2010 (See
Note 6 to the Consolidated Financial Statements).
In April
2010, we repaid in full the then outstanding balance of $203.1 million on our
unsecured term loan. Subsequent to the fiscal year end, we repaid in full the
$250 million principal amount of senior floating rate notes that became due in
June 2010. We also issued $250 million principal amount of senior unsecured
notes in a public offering in April 2010. We used part of the proceeds from this
offering to repay our unsecured term loan prior to its original maturity of June
2012 and we ended fiscal 2010 with a cash balance of $1.0 billion.
Products
Semiconductors
are integrated circuits (in which a number of transistors and other elements are
combined to form a more complicated circuit) or discrete devices (such as
individual transistors). In an integrated circuit, various components are
fabricated in a small area or “chip” of silicon, which is then encapsulated in
plastic, ceramic or other advanced forms of packaging and can then be connected
to a circuit board or substrate.
We
manufacture an extensive range of analog intensive and mixed-signal integrated
circuits, which are used in numerous applications. While no precise industry
definition exists for analog and mixed-signal devices, we consider products
which process analog information or convert analog-to-digital or
digital-to-analog as analog and mixed-signal devices.
We are a
leading supplier of analog and mixed-signal products, serving both broad-based
markets such as the consumer, industrial, medical, automotive and
communications, and more narrowly defined markets such as wireless handsets
(including smart phones) and other portable applications, LED lighting,
renewable energy, portable medical and communications infrastructure. Our analog
and mixed-signal devices include:
|
·
|
operational
and audio amplifiers
|
·
|
lighting
and display circuits
|
|
·
|
power
references, regulators and switches
|
·
|
adaptive
voltage scaling circuits
|
|
·
|
analog-to-digital
or digital-to-analog converters
|
·
|
radio
frequency integrated circuits
|
|
·
|
communication
interface circuits
|
Page 5 of
98
Other
product offerings that are not analog or mixed-signal include microcontrollers
and embedded BluetoothTM
solutions that collectively serve a wide variety of applications in the
wireless, personal computer, industrial, automotive, consumer and communication
markets. These products represent our older products that we no longer invest
research and development effort in.
Our
diverse portfolio of intellectual property enables us to develop building block
products, application-specific standard products and custom large-scale
integrations for our customers. Our high-performance building blocks and
application-specific standard products allow our customers to solve challenging
technical problems and to differentiate their systems in a way that is
beneficial to the end user.
With our
leadership in innovative packaging and analog process technology, we can address
growth opportunities that depend upon the critical elements of efficiency,
physical size and performance. We directly service top-tier OEMs in a number of
markets, and we reach a broader range of customers through our franchised
distributors.
Corporate
Organization
Our
product line operations are organized under one group called the Product Group.
Within this group are all of our various product line business units. Many of
our products are part of our PowerWise® portfolio of products, which are parts
that are deemed to be highly energy efficient relative to the function they are
performing.
In addition to our Product Group, our
corporate organization in fiscal 2010 included the Worldwide Marketing and Sales
Group, Key Market Segments Group, the Technology Development Group and the
Manufacturing Operations Group.
Product
Group
The
Product Group is organized by various product line business units that include
custom solutions, high speed products, infrastructure power, mobile devices
power, performance power products and precision signal path business units.
During fiscal 2010, our former advanced power business unit was merged into the
infrastructure power business unit.
We have
three different business units that address the power management area:
infrastructure power, mobile devices power and performance power products. Power
management refers to the conversion and management of power consumption in
electronic systems. Integrated circuits such as digital processors,
analog-to-digital converters and light emitting diodes each require different
power sources to operate efficiently. Power management integrated circuits
convert and regulate voltages to ensure that electronic systems operate
properly. Our high-performance power management portfolio provides valuable
solutions to our customers to solve design problems in space and
energy-constrained applications from feature-rich portable devices to large
line-powered systems.
The three
business units that address power management design, develop and manufacture a
wide range of products including:
|
·
|
high-efficiency
switching voltage regulators and controllers
|
|
·
|
high-performance
low drop-out voltage regulators
|
|
·
|
accurate
LED drivers
|
|
·
|
precision
voltage references
|
|
·
|
battery
management integrated circuits
|
|
·
|
photovoltaic
power optimizer solutions
|
We are
targeting growth in our power management business by balancing our focus between
broad customer needs and specific target markets. We continue to strengthen our
broad portfolio of power management integrated circuits which can address
customer needs in a variety of end markets such as consumer, industrial,
medical, automotive and communications infrastructure. At the same time, we
focus on markets, such as personal mobile devices or high-power LEDs, which can
provide more rapid growth opportunities from customers that value the
performance our products deliver, such as energy efficiency and size or heat
reduction.
Page 6 of
98
We
continue to enhance the performance of power management building blocks in terms
of providing greater efficiency, increased power density, tighter accuracy and
wider voltage ranges. These building block products can also be leveraged into
the development of highly integrated application-specific standard products for
high volume applications.
There are also two business units that
address the signal path area: precision signal path and high speed
products. Signal path refers to the analog technology that is applied
to the path that information or data travels along from the point where it
enters the electronic equipment and is conditioned, converted and processed to
the point where it is sent out. Our signal path products provide a vital
technology link that allows the user to connect to digital information and are
used to enable and enrich the user experience of sight and sound from many
electronic applications. In addition to providing the real-world interfaces,
signal path products are used extensively in signal conditioning, signal
conversion (from analog-to-digital and vice versa) and high-speed signal
interfacing applications.
The
two business units that focus on signal path design, develop and manufacture a
wide range of products including:
|
·
|
high-speed
and precision operational amplifiers
|
|
·
|
high-fidelity,
low-power audio amplifiers
|
|
·
|
high-speed
and power efficient analog-to-digital converters and digital-to-analog
converters
|
|
·
|
precision
timing products
|
|
·
|
high-speed
communication interface and signal-conditioning
products
|
|
·
|
thermal
management products
|
We
continually develop more high-performance analog products that can address
applications in the portable, consumer, industrial, medical, automotive and
communications infrastructure markets. With our growing product portfolio of
high-performance building blocks, we continue to improve performance by
providing greater precision, higher speed and lower power which our customers
value. These building block products can also be leveraged into the development
of highly integrated application-specific standard products for high volume
applications.
The high
speed products business unit also includes Hi-Rel products that supply
integrated circuits to the high reliability market, which includes avionics,
defense and aerospace customers.
There is
also a custom solutions business unit within the Product Group, which supplies
user-designed application-specific products in the form of standard cells, gate
arrays and full custom devices. This business unit also supplies key
telecommunications components for analog and digital line cards, as well as
8-bit and 16-bit microcontrollers. Although this business unit supplies these
products, it no longer develops new products.
The
Product Group organization is also responsible for technology infrastructure
which provides a range of process libraries, product cores and software, and the
selection and support of computer aided design tools used in the design, layout
and simulation of our products.
Worldwide
Marketing and Sales Group, Key Market Segments Group, Technology Research Group
and Manufacturing Operations Group
The
Worldwide Marketing and Sales Group is our global sales and marketing
organization organized around the four major regions of the world where we
operate. We define our four major regions as the Americas, Asia Pacific (which
excludes Japan), Europe and Japan. Reference to these regions elsewhere in this
document is based on this definition.
As part
of our overall marketing and business development effort, we have a separate
dedicated group that concentrates solely on key market segments that the company
has identified and targeted for future growth. The Key Market Segments
organization includes industry experts, technologists and business development
staff who work closely with our product lines to accelerate the penetration of
our analog solutions in these specific markets with high growth
potential.
The
Technology Research Group is a centralized worldwide organization primarily
responsible for advanced process development.
The
Manufacturing Operations Group is a centralized worldwide organization that
manages all production, including outsourced manufacturing, global logistics,
and is responsible for quality assurance, purchasing and supply
chain
Page 7 of
98
management.
The Manufacturing Operations Group is also responsible for incremental process
development and packaging technology.
Segment
Financial Information and Geographic Information
Under the
criteria defined by generally accepted accounting principles (GAAP), Analog is
our only reportable segment for fiscal 2010. The remaining business units that
are not included in the Analog reportable segment are grouped as “All
Others.”
Our
business is dependent on the success of our Analog segment, which represented
approximately 94 percent of our sales in fiscal 2010. Consequently, the Analog
segment faces the same risks as those for the company as a whole, including
risks attendant to our foreign operations. For a more complete discussion of
those risks, see the discussion that appears in Part I, “Item 1A. Risk Factors,”
of this Form 10-K.
For
further financial information on the Analog reportable segment, as well as
geographic information, refer to the information contained in Note 16, “Segment
and Geographic Information,” in the Notes to the Consolidated Financial
Statements included in Item 8.
Marketing
and Sales
We market
our products globally to OEMs and original design manufacturers (ODMs) through a
direct sales force. Some of our major OEMs include:
|
·
|
Apple
|
·
|
Nokia
|
·
|
Robert
Bosch
|
|
·
|
Continental
|
·
|
Nokia
Siemens Network
|
·
|
Samsung
|
|
·
|
LG
Electronics
|
·
|
Novero
|
·
|
Siemens
|
|
·
|
L.M.
Ericsson
|
·
|
Panasonic
|
·
|
Sony
Ericsson Mobile Communications
|
|
·
|
Motorola
|
·
|
Research
in Motion Ltd
|
·
|
Triquint
|
It is
common in the technology industry for OEMs to use contract manufacturers to
build their products and ODMs to design and build products. As a result, our
design wins with major OEMs, particularly in the computing and cellular phone
markets, can ultimately result in sales to a third party contract manufacturer
or ODM.
In
addition to our direct sales force, we use distributors in our four geographic
business regions, and approximately 64 percent of our fiscal 2010 net sales were
made to distributors, which includes approximately 9 percent of sales made
through dairitens in Japan under local business practices. In line with industry
practices, we generally credit distributors for the effect of price reductions
on their inventory of our products and, under specific conditions, we repurchase
products that we have discontinued. Distributors do not have the right to return
product except under customary warranty provisions. The programs we offer to our
distributors include the following:
|
·
|
Allowances involving pricing
and volume. We refer to this as the “contract sales debit”
program.
|
|
·
|
Allowances for inventory
scrap. We refer to this as the “scrap allowance”
program.
|
Under the
contract sales debit program, products are sold to distributors at standard
prices published in price books that are broadly provided to our various
distributors. Distributors are required to pay for this product within our
standard commercial terms. After the initial purchase of the product, the
distributor has the opportunity to request a price allowance for a particular
part number depending on the current market conditions for that specific part as
well as volume considerations. This request is made prior to the distributor
reselling the part. Once we have approved an allowance to the distributor, the
distributor proceeds with the resale of the product and credits are issued to
the distributor in accordance with the specific allowance that we approved.
Periodically, we issue new distributor price books. For those parts for which
the standard prices have been reduced, we provide an immediate credit to
distributors for inventory quantities they have on hand.
Under the
scrap allowance program, certain distributors are given a contractually defined
allowance to cover the cost of any scrap they might incur. The amount of the
allowance is specifically agreed upon with each distributor.
Our regional facilities in the United
States, Europe, Japan and Asia Pacific handle local customer support. These
customer support centers respond to inquiries on product pricing and
availability, pre-sale customer technical support requests, order entry and
scheduling, and post-sale support under our product warranty provisions. The
technical support provided to our customers consists of marketing activities
that occur prior to sale of product to our customers and for which we have
no
Page 8 of
98
contractual
obligation and no fees are charged. Technical support consists primarily of
aiding customers in product selection and answering questions about our
products.
We augment our sales effort with
application engineers based in the field. These engineers are specialists in
various aspects of our product portfolio and work with customers to identify and
design our integrated circuits into customers’ products and applications. These
engineers also help identify emerging markets for new products and are supported
by our design centers in the field or at manufacturing sites.
We also provide web-based, on-line
tools that allow customers and potential customers to select our devices, create
a design using our parts, and simulate performance of that design.
Customers
Our top
ten customers
combined represented approximately 58 percent of total accounts receivable at
May 30, 2010 and approximately 60 percent at May 31, 2009.
Net sales to major customers as a
percentage of total net sales were as follows:
|
2010
|
2009
|
2008
|
|||||||
|
Distributor:
|
|||||||||
|
Avnet
|
17%
|
15%
|
15%
|
||||||
|
Arrow
|
15%
|
13%
|
12%
|
||||||
|
OEM:
|
|||||||||
|
Nokia
|
*
|
*
|
11%
|
||||||
*
less than 10%
Although
we do not have any other customers with sales greater than 10 percent, we do
have several other large customers that manufacture and market wireless handsets
and other electronic products. All of these customers typically purchase a range
of different products from us. If any one of these customers were to cease
purchasing products from us within a very short timeframe, such as within one
quarter, it could have a negative impact on our financial results for that
period.
Backlog
In
accordance with industry practice, we frequently revise semiconductor backlog
quantities and shipment schedules under outstanding purchase orders to reflect
changes in customer needs. We rarely formally enforce binding agreements for the
sale of specific quantities at specific prices that are contractually subject to
price or quantity revisions, consistent with industry practice. For these
reasons, we believe it would not be meaningful to disclose the amount of backlog
at any particular date.
Seasonality
We are
affected by the seasonal trends in the semiconductor and related industries. We
typically experience sequentially lower sales in our first and third fiscal
quarters, primarily due to customer vacation and holiday schedules. Sales
usually reach a seasonal peak in our fourth fiscal quarter. This seasonal trend
did not occur during fiscal 2010 as the global economy has slowly begun to
recover from the significant deterioration that was experienced during our
fiscal 2009. As a result of this improvement, sales in our first quarter of
fiscal 2010 were up 12 percent over sales in the preceding fourth quarter of
fiscal 2009 and sales in our third quarter of fiscal 2010 were up 5 percent over
sales in the preceding second quarter of fiscal 2010. Consistent with our
previous experience, our sales peaked in the fourth quarter of fiscal
2010.
Page 9 of
98
Manufacturing
The
design of semiconductor and integrated circuit products is shaped by general
market needs and customer requirements. Following product design and
development, we generally produce integrated circuits in the following
steps:
|
·
|
Wafer Fabrication.
Product designs are compiled and digitized by state of the art
design equipment and then transferred to silicon wafers in a series of
complex precision processes that include oxidation, lithography, chemical
etching, diffusion, deposition, implantation and
metallization.
|
|
·
|
Wafer Sort. The silicon
wafers are tested and separated into individual circuit
devices.
|
|
·
|
Product Assembly. Tiny
wires are used to connect the electronic circuits on the device to the
stronger metal leads of the package in which the device is encapsulated
for protection.
|
|
·
|
Final Test. The devices
are subjected to a series of rigorous tests using computerized circuit
testers and, for certain applications, environmental testers such as
burn-in ovens, centrifuges, temperature cycle or moisture resistance
testers, salt atmosphere testers and thermal shock
testers.
|
|
·
|
Coating. Certain
devices in the analog portfolio are designed to be used without
traditional packaging. In this case, the integrated circuit is coated with
a protective material to allow mounting directly onto a circuit
board.
|
Our product line business units are
supported by our global manufacturing infrastructure. We have developed a number
of proprietary manufacturing processes and packaging technologies to support our
broad portfolio of analog products. In March 2009, we announced the closure of
our wafer fabrication facility in Texas and our assembly and test plant in
China. Production activity in these two facilities ceased by the end of fiscal
2010 and their production volume was consolidated into our remaining
manufacturing facilities in Maine, Scotland and Malaysia. Substantially all of
our products are manufactured in our two wafer fabrication facilities in Maine
and Scotland, and our assembly and test facility in Malaysia. However, at times
and as needed, we outsource certain manufacturing functions to address capacity,
capability or other economic issues.
Our wafer manufacturing processes
include Bipolar, Metal Oxide Silicon, Complementary Metal Oxide Silicon and
Bipolar Complementary Metal Oxide Silicon technologies, including Silicon
Germanium. Our efforts are heavily focused on proprietary processes that support
our analog portfolio of products, which address wireless handsets, other
personal mobile devices and a broad variety of other electronic applications.
The feature size of the individual transistors on a chip is measured in microns;
one micron equals one millionth of a meter. As products decrease in size and
increase in functionality, our wafer fabrication facilities must be able to
manufacture integrated circuits with sub-micron circuit pattern widths. This
precision fabrication carries over to assembly and test operations, where
advanced packaging technology and comprehensive testing are required to address
the ever increasing performance and complexity embedded in integrated
circuits.
Raw
Materials
Our
manufacturing processes use certain key raw materials critical to our products.
These include silicon wafers, certain chemicals and gases, ceramic and plastic
packaging materials and various precious metals. We also rely on subcontractors
to supply finished or semi-finished products which we then market through our
sales channels. We obtain raw materials and semi-finished or finished products
from various sources, although the number of sources for any particular material
or product is relatively limited. We believe our current supply of essential
materials is sufficient to meet our needs. However, shortages have occurred from
time to time and could occur again. Significant increases in demand, rapid
product mix changes or natural disasters could affect our ability to procure
materials or goods.
Research
and Development
Our
research and development efforts consist of research in metallurgical,
electro-mechanical and solid-state sciences, manufacturing process development
and product design. Total research and development expenses were $272.7 million
for fiscal 2010, or 19 percent of net sales, compared to $306.0 million for
fiscal 2009, or 21 percent of net sales, and $363.0 million for fiscal 2008, or
19 percent of net sales.
The decrease in research and
development expenses in fiscal 2010 compared to fiscal 2009 primarily reflects
cost savings associated with the cost reduction actions announced in fiscal
2009, including lower payroll and employee benefit expenses. Share-based
compensation expense included in R&D expense for fiscal 2010 was $17.8
million compared to $24.3 million in fiscal 2009. We are continuing to
concentrate our research and development spending on analog products and
underlying analog capabilities with particular emphasis on circuits that enable
greater energy efficiency. We continue to invest in the
development of new analog products that can serve applications in a wide variety
of end markets such as portable electronics, industrial, communications
infrastructure, renewable energy products, medical, and sensing
and
Page 10
of 98
detection applications.
Because of our focus on markets that require or involve greater energy
efficiency, a significant portion of our research and development is directed at
power management technology.
Patents
We own
numerous United States and non-U.S. patents and have many patent applications
pending. We consider the development of patents and the maintenance of an active
patent program advantageous to the conduct of our business. However, we believe
that continued success will depend more on engineering, production, marketing,
financial and managerial skills than on our patent program. We license certain
of our patents to other manufacturers and participate in a number of cross
licensing arrangements and agreements with other parties. Each license agreement
has unique terms and conditions, with variations as to length of term, royalties
payable, permitted uses and scope. The majority of these agreements are
cross-licenses in which we grant a broad license to our intellectual property in
exchange for receiving a similar corresponding license from the other party, and
none are exclusive. The amount of income we have received from licensing
agreements has varied in the past, and we cannot precisely forecast the amount
and timing of future income from licensing agreements. On an overall basis, we
believe that no single license agreement is material to us, either in terms of
royalty payments due or payable or intellectual property rights granted or
received.
Employees
At May
30, 2010, we employed approximately 5,800 people of whom approximately 2,400
were employed in the United States, 500 in Europe, 2,700 in Southeast Asia, 100
in China and 100 in other areas. We believe that our future success depends
fundamentally on our ability to recruit and retain skilled technical and
professional personnel. Our employees in the United States are not covered by
collective bargaining agreements. We consider our employee relations worldwide
to be favorable.
Competition
Competition
in the semiconductor industry is intense. With our focus on high-value analog,
our major competitors include Analog Devices, Intersil Corporation, Linear
Technology, Maxim Integrated Products and Texas Instruments. In some cases, we
may also compete with our customers. Competition is based on design and quality
of products, product performance, price and service, with the relative
importance of these factors varying among products and markets. We cannot assure
you that we will be able to compete successfully in the future against existing
or new competitors or that our operating results will not be adversely affected
by increased competition.
Environmental
Regulations
To date,
our compliance with foreign, federal, state and local laws and regulations that
have been enacted to regulate the environment has not had a material adverse
effect on our capital expenditures, earnings, competitive or financial position.
For more information, see Item 3, “Legal Proceedings” and Note 15, “Commitments
and Contingencies” to the Consolidated Financial Statements in Item 8. However,
we could be subject to fines, suspension of production, alteration of our
manufacturing processes or cessation of our operations if we fail to comply with
present or future statutes and regulations governing the use, storage, handling,
discharge or disposal of toxic, volatile or otherwise hazardous chemicals used
in our manufacturing processes.
Page 11
of 98
ITEM
1A. RISK FACTORS
A
description of the risk factors associated with our business is set forth below.
The risks described below are not the only ones facing us. Additional risks not
currently known to us or that we currently believe are immaterial may also
impair our business operations, results or financial condition.
RISK
FACTORS RELATING TO GENERAL BUSINESS CONDITIONS
Significant
deterioration in the global economy has reduced demand for our products, and our
business has been and may continue to be adversely affected.
As a
result of the credit market crisis (including uncertainties with respect to
financial institutions and the global capital markets) and other macro-economic
challenges affecting the economy of the United States and other parts of the
world, customers have modified, delayed and cancelled plans to purchase our
products. During fiscal 2009, we experienced a significant reduction in order
rates due to the weak global economy. While near-term market conditions in
fiscal 2010 have shown some improvement, it is not clear that this improvement
will continue. It is possible that current conditions could remain or
worsen.
A
large portion of our revenues is dependent on the wireless handset
market.
The
wireless handset market (including smart phones) is a significant source of our
overall sales. Global economic difficulties have resulted in a slowdown in the
sales of handsets and have adversely affected our revenues and profitability.
This environment may continue even though we continue to develop new products to
address new features and functionality in handsets. The worldwide handset market
is large and future trends and other variables are difficult to predict. As a
consumer-driven market, changes in the economy that adversely affect consumer
demand for wireless handsets will impact demand for our products and adversely
affect our business and operating results.
Conditions
inherent in the semiconductor industry may cause periodic fluctuations in our
operating results.
Rapid
technological change and frequent introduction of new technology leading to more
complex and integrated products characterize the semiconductor industry. The
result is a cyclical environment with potentially short product life cycles,
characterized by significant and rapid increases and decreases in product
demand. Substantial capital and R&D investment are required to support
products and manufacturing processes in the semiconductor industry, which
amplify the effect of this cyclicality. As a result of this environment, we may
experience rapid and significant fluctuations in our operating
results. Market or other shifts in our product mix toward or away
from higher margin products, including analog products, or reductions in our
product margins may also have a significant impact on our operating
results.
Page 12
of 98
Our
business will be harmed if we are unable to compete successfully in our
markets.
Competition
in the semiconductor industry is intense. Our major competitors include Analog
Devices, Intersil Corporation, Linear Technology, Maxim Integrated Products and
Texas Instruments. In some cases, we may also compete with our customers.
Competition is based on design and quality of products, product performance,
price and service, with the relative importance of these factors varying among
products, markets and customers. We cannot assure you that we will be able to
compete successfully in the future against existing or new competitors or that
our operating results will not be adversely affected by increased
competition.
RISK
FACTORS RELATING TO INTERNATIONAL OPERATIONS
We
operate in the global marketplace and face risks associated with worldwide
operations.
During
fiscal 2010, approximately 76 percent of our sales were derived from customers
in international markets. We expect that international sales will continue to
account for a significant majority of our total revenue in future years. We have
manufacturing facilities outside the United States in Scotland and Malaysia. We
are subject to the economic and political risks inherent in international
operations, including the risks associated with ongoing uncertainties and
political and economic instability in many countries around the world. In
addition, the management of global operations subjects us to risks associated
with legal and regulatory requirements, trade balance issues, currency controls,
differences in local business and cultural factors, fluctuations in interest and
currency exchange rates, and difficulties in staffing and managing foreign
operations.
Global
disruptions and events could adversely affect our financial performance and
operating results.
Terrorist
activities worldwide and hostilities in and between nation states, including the
continuing hostilities and violence in Iraq and Afghanistan and the threat of
future hostilities involving the United States and other countries, may cause
uncertainty and instability in the overall state of the global economy or in the
industries in which we operate. We have no assurance that the consequences from
these events will not disrupt our operations in either the United States or
other regions of the world. Significant destabilization of relations between the
United States and other countries where we operate or between the countries
where we operate and other countries could result in restrictions and
prohibitions in the countries where we operate. Continued increases in oil
prices, as well as spreading subprime mortgage failures, could also affect our
operations. Pandemic illnesses that spread globally and/or substantial natural
disasters, as well as geopolitical events, may also affect our future costs,
operating capabilities and revenues.
We
have significant manufacturing operations in Malaysia and, as a result, are
subject to risks.
We have
significant assembly and test facilities in Melaka, Malaysia. We may be
adversely affected by laws and regulations, including those relating to
taxation, import and export tariffs, environmental regulations, land use rights,
property and other matters. We cannot assure you that we will be able
to maintain compliance with all of these laws and regulations, that new,
stricter laws or regulations will not be imposed or that interpretations of
existing regulations will not be changed, each of which would require additional
expenditures or result in other adverse effects. Changes in the political
environment or government policies could result in laws or regulations that
impact us adversely. A significant destabilization of relations between the
United States and Malaysia or with either of these countries and other countries
could result in restrictions or prohibitions on our operations in that
country.
We
are subject to fluctuations in the exchange rate of the U.S. dollar and foreign
currencies.
While we
transact business primarily in U.S. dollars, and most of our revenues are
denominated in U.S. dollars, a portion of our costs and revenues is denominated
in other currencies, such as the euro, the Japanese yen, pound sterling and
certain other Asian currencies. As a result, changes in the exchange rates of
these or any other applicable currencies to the U.S. dollar will affect our net
sales, costs of goods sold and operating margins. We have a program to hedge our
exposure to currency rate fluctuations, but our hedging program may not be fully
effective in preventing foreign exchange losses.
Page 13
of 98
We
are subject to export restrictions and laws affecting trade and
investments.
As a
global company headquartered in the United States, we are subject to U.S. laws
and regulations that limit and restrict the export of some of our products and
related product information. Compliance with these laws has limited our
operations and sales in the past and could significantly limit them in the
future. We maintain a compliance program but there are risks of noncompliance
exposing us to significant legal liabilities. We must also comply with export
restrictions and laws imposed by other countries affecting trade and investments
which may conflict with the laws and regulations in the United States or other
countries in which we do business. There is a risk that these restrictions and
laws could significantly restrict our operations in the future.
RISK
FACTORS RELATING TO SALES AND OPERATIONS
Our
increased focus on revenue growth could adversely impact margins over
time.
Our
current priority is to grow revenues at a rate greater than the rate of growth
we have achieved in recent fiscal years. During those recent fiscal years our
rate of revenue growth was consistently below that of our competitors, as we
directed more of our efforts on maintaining and increasing our profit
margins. By focusing on our relationship with our customers and delivering
exceptional value to our customers we hope to increase sales while retaining our
overall profitability. It is possible, however, that elevating our
priority on increasing sales could come at the expense of gross margin. If a
decrease in gross margin is not offset by sufficient increased revenue it would
adversely affect our overall profitability.
Our
performance depends on the availability and cost of raw materials, utilities,
critical manufacturing equipment and third-party manufacturing
services.
Our
manufacturing processes and critical manufacturing equipment require that
certain key raw materials and utilities be available. Limited or delayed access
to or increases in the cost of these items, or the inability to implement new
manufacturing technologies or install manufacturing equipment on a timely basis,
could adversely affect our results of operations. We subcontract a portion of
our wafer fabrication and assembly and testing of our integrated circuits. We
depend on a limited number of third parties, most of whom are located outside of
the United States, to perform these subcontracted functions. We do not have
long-term contracts with all of these third parties. Reliance on these third
parties involves risks, including possible shortages of capacity in periods of
high demand. We have had difficulties in the past with supplies and
subcontractors and could experience them in the future, including as a result of
weak global economic conditions.
A
substantial portion of our sales are made to distributors and the termination of
an agreement with one or more distributors could result in a negative impact on
our business.
In fiscal
2010, our distributors accounted for approximately 64 percent of our sales,
which includes approximately 9 percent of sales made through dairitens in Japan
under local business practices. Two of our distributors together accounted for
32 percent of total sales. Distributors typically sell products from several of
our competitors along with our products. A significant reduction of effort to
sell our products, the termination of our relationship with one or more
distributors or distributor cash flow problems or other financial difficulties
could reduce our access to certain end-customers and adversely impact our
ability to sell our products. The termination of the distributor relationship
agreement with a specific distributor could also result in the return of our
inventory held by the distributor.
Our
profit margins may vary over time.
Our
profit margins may be adversely affected by a number of factors, including
decreases in our shipment volume, reductions in, or obsolescence of our
inventory, and shifts in our product mix or strategy. Because we own most of our
manufacturing capacity, a significant portion of our operating costs is fixed,
including costs associated with depreciation expense. In general, these costs do
not decline with reductions in customer demand or utilization of our
manufacturing capacity or increase as volume increases. Failure to maintain
utilization rates of our manufacturing facilities or maintain the fixed costs
associated with these facilities at current levels will result in higher average
unit costs and lower gross margins.
We
make forecasts of customer demand that may be inaccurate.
Our
ability to match inventory and production mix with the product mix needed to
fill current orders and orders to be delivered in any given quarter may affect
our ability to meet that quarter’s revenue forecast. To be able to accommodate
customer requests for shorter shipment lead times, we manufacture product based
on customer forecasts. These forecasts are based on multiple assumptions. While
we believe our relationships with our customers, combined with
our
Page 14
of 98
understanding
of the end markets we serve, provide us with the ability to make reliable
forecasts, if we inaccurately forecast customer demand, it could result in
inadequate, excess or obsolete inventory that would reduce our profit
margins.
We
are subject to warranty claims, product recalls and product
liability.
We could
be subject to warranty or product liability claims that could lead to
significant expenses as we defend such claims or pay damage awards. In the event
of a warranty claim, we may also incur costs if we compensate the affected
customer. We maintain product liability insurance, but there is no guarantee
that such insurance will be available or adequate to protect against all such
claims. We may incur costs and expenses relating to a recall of one of our
customers’ products containing one of our devices. Any future costs or payments
made in connection with warranty claims or product recalls could materially
affect our results of operations and financial condition in future
periods.
We
may be harmed by natural disasters and other disruptions.
Our
worldwide operations could be subject to natural disasters and other
disruptions. Our corporate headquarters are located near major earthquake fault
lines in California. In the event of a major earthquake, or other natural or
manmade disaster, we could experience loss of life of our employees, destruction
of facilities or other business interruptions. The operations of our suppliers
could also be subject to natural disasters and other disruptions, which could
cause shortages and price increases in various essential materials. We use third
party freight firms for nearly all of our shipments from vendors and from our
wafer manufacturing facilities to assembly and test sites and for shipments to
customers of our final product. This includes ground, sea and air freight. Any
significant disruption of our freight shipments globally or in certain parts of
the world, particularly where our operations are concentrated, would materially
affect our operations. We maintain property and business interruption insurance,
but there is no guarantee that such insurance will be available or adequate to
protect against all costs associated with such disasters and
disruptions.
We
may incur losses in connection with the sale of, or we may be unable to sell,
our manufacturing facilities in China and Texas.
In March
2009, we announced the eventual closure of our wafer fabrication facility in
Texas and our assembly and test plant in China. We have since ceased production
activity in these two facilities. We are actively engaged in locating buyers to
purchase each of these manufacturing facilities and the machinery and equipment
located in these facilities. In selling these properties, we are faced with the
inherent volatility in the industrial real estate market, which is a function of
the supply and demand for industrial properties in the micro-markets where our
facilities are located. Although we believe we will be able to sell these
facilities in the next fiscal year, it may take longer than we currently expect.
If we must incur additional costs to maintain the facilities over a longer time
frame than we currently expect, if we are forced to accept a lower price than we
originally estimated, or if we are unable to locate a buyer for either or both
of these facilities, our operating results will be negatively
affected.
RISK
FACTORS RELATING TO R&D, INTELLECTUAL PROPERTY AND LITIGATION
We
may experience delays in introducing new products or market acceptance of new
products may be below our expectations.
Rapidly
changing technologies and industry standards, along with frequent new product
introductions, characterize the industries in which our primary customers
operate. As our customers evolve and introduce new products, our success depends
on our ability to anticipate and adapt to these changes in a timely and
cost-effective manner by developing and introducing into the market new products
that meet the needs of our customers. We are also directing efforts to develop
new and different types of products to serve emerging mega trends such as energy
efficiency. We believe that continued focused investment in research and
development, especially the timely development, introduction and market
acceptance of new products, is a key factor to successful growth and the ability
to achieve strong financial performance. Successful development and introduction
of these new products are critical to our ability to maintain a competitive
position in the marketplace. We cannot assure you, however, that we will be
successful in timely developing and introducing successful new products demanded
by the market, or in achieving anticipated revenues from new products, and a
failure to bring new products to market or achieve market success with them may
harm our operating results. We also cannot assure you that products that may be
developed in the future by our competitors will not render our products obsolete
or non-competitive.
Our products are dependent on the use
of intellectual property that we need to protect.
We rely
on patents, trade secrets, trademarks, mask works and copyrights to protect our
products and technologies, and have a program to file applications for and
obtain patents, trademarks, mask works and copyrights in the United States
and
Page 15
of 98
in
selected foreign countries where we believe filing for such protection is
appropriate. Effective patent, trademark, copyright and trade secret protection
may be unavailable, limited or not applied for by us in some countries. Some of
our products and technologies are not covered by any patent or patent
application. In addition, we cannot assure you that:
|
·
|
the
patents owned by us or numerous other patents which third parties license
to us will not be invalidated, circumvented, challenged or licensed to
other companies; or
|
|
·
|
any
of our pending or future patent applications will be issued within the
scope of the claims sought by us, if at all;
or
|
|
·
|
our
products will not be held to infringe patents of
others.
|
We also
seek to protect our proprietary technologies, including technologies that may
not be patented or patentable, in part by confidentiality agreements and, if
applicable, inventors’ rights agreements with our collaborators, advisors,
employees and consultants. We cannot assure you that these agreements will not
be breached, that we will have adequate remedies for any breach or that our
collaborators will not assert rights to intellectual property arising out of our
research collaborations. In addition, we may not be able to enforce these
agreements globally. Some of our technologies have been licensed on a
non-exclusive basis from other companies, which may license such technologies to
others, including our competitors. If necessary or desirable, we may seek
licenses under patents or intellectual property rights claimed by others.
However, we cannot assure you that we will obtain such licenses or that the
terms of any offered licenses will be acceptable to us. The failure to obtain a
license from a third party for technologies we use could cause us to incur
substantial liabilities and to suspend the manufacture or shipment of products
or our use of processes requiring the technologies.
The
protection of our intellectual property is essential in preventing unauthorized
third parties from copying or otherwise obtaining and using our technologies.
Despite our efforts, we cannot assure you that we will be able to adequately
prevent misappropriation or improper use of our protected
technologies.
We
may be subject to information technology system failures, network disruptions
and breaches in data security.
Information
technology system failures, network disruptions and breaches of data security
could disrupt our operations by causing delays or cancellation of customer
orders, impeding the manufacture or shipment of products, preventing the
processing of transactions and reporting of financial results. They could also
result in the unintentional disclosure of confidential information about the
company or with respect to our customers and employees. While management has
taken steps to address these concerns by implementing sophisticated network
security and internal control measures, there can be no assurance that a system
failure or data security breach will not have a material adverse effect on our
financial condition and operating results.
We
are subject to litigation risks.
All
industries, including the semiconductor industry, are subject to legal claims.
We are involved in a variety of routine legal matters that arise in the normal
course of business. Further discussion of certain specific material legal
proceedings in which we are involved is contained in Note 15 to the Consolidated
Financial Statements. We believe it is unlikely that the final outcome of these
legal claims will have a material adverse effect on our consolidated financial
position or results of operations. However, litigation is inherently uncertain
and unpredictable. An unfavorable resolution of any particular legal claim or
proceeding could have a material adverse effect on our consolidated financial
position or results of operations.
RISK
FACTORS RELATED TO OUR DEBT
Increased
leverage may harm our financial condition and results of
operations.
Our total
liabilities at the end of fiscal 2010 were $1.8 billion. Of total liabilities,
$1.0 billion was debt incurred in connection with the accelerated stock
repurchase program announced in June 2007 when we announced that we would incur
$1.5 billion of indebtedness under a bridge credit facility to purchase shares
of our common stock through an accelerated stock repurchase program. We
subsequently issued $1.0 billion in senior unsecured notes and entered into a
bank loan in the aggregate principal amount of $0.5 billion to fully repay the
indebtedness under the bridge credit facility. We have since repaid in full the
outstanding principal on the bank loan prior to its original maturity of June
2012. Subsequent to the fiscal year end, we also repaid in full our senior
floating rate notes with an aggregate principal amount of $250 million due in
June 2010. We issued $250 million principal amount of senior unsecured notes
through a public offering in April 2010. Our long-term debt will have important
effects on our future operations, including, without
limitation:
Page 16
of 98
|
·
|
we
will have additional cash requirements in order to support the payment of
principal and interest on our outstanding
indebtedness;
|
|
·
|
increases
in our outstanding indebtedness and leverage may increase our
vulnerability to adverse changes in general economic and industry
conditions, as well as to competitive
pressure;
|
|
·
|
our
ability to obtain additional financing for working capital, capital
expenditures, general corporate and other purposes may be limited;
and
|
|
·
|
our
flexibility in planning for, or reacting to, changes in our business and
our industry may be
limited.
|
Our
ability to make payments of principal and interest on our indebtedness depends
upon our future performance, which is subject to general economic conditions,
industry cycles and financial, business and other factors affecting our
consolidated operations, many of which are beyond our control. In addition,
under our multicurrency credit agreement with a bank, we are required to comply
with certain restrictive covenants, conditions, and default provisions that
require the maintenance of certain financial ratios. If we are unable to
generate sufficient cash flow from operations in the future to service our debt
or maintain compliance with the financial covenants of our multicurrency credit
agreement due to current economic conditions or otherwise, we may take certain
actions which require us to, among other things:
|
·
|
seek
additional financing in the debt or equity
markets;
|
|
·
|
refinance,
retire or restructure all or a portion of our
indebtedness;
|
|
·
|
sell
selected assets;
|
|
·
|
reduce
or delay planned capital expenditures;
or
|
|
·
|
reduce
or delay planned operating
expenditures.
|
Such
measures might not be sufficient to enable us to service our debt. In addition,
any such financing, refinancing or sale of assets might not be available on
economically favorable terms, if at all, particularly if our credit rating is
not strong.
Difficulties
in the credit markets may limit our ability to refinance our debt as it becomes
due.
We cannot
assure you that we will be able to refinance our debt as it becomes due. The
cost and availability of credit has been and may continue to be adversely
affected by illiquid credit markets and wider credit spreads. Continued
turbulence in the U.S. and international markets and economies may adversely
affect the liquidity and financial conditions of issuers.
Increases
in interest rates could adversely affect our financial condition.
Any
changes in prevailing interest rates will have an immediate effect on us because
we have entered into an interest rate swap arrangement that effectively converts
the fixed rate of interest on our $250 million aggregate principal amount of
3.95 percent senior unsecured notes due April 2015 to a floating rate. Any
increased interest expense associated with increases in interest rates will
adversely affect our cash flow and our ability to service our debt. As a
protection against rising interest rates, we may enter into other agreements
such as interest rate swaps, caps, floors and other interest rate exchange
contracts. However, our existing or any additional agreements may fail to
protect or could adversely affect us because, among other things, the other
parties to such agreements may fail to perform, or the terms of the agreements
may turn out to be unfavorable to us depending on rate movements.
RISK
FACTORS RELATING TO PERSONNEL AND MERGER AND ACQUISITION ACTIVITY
We
may not be able to attract or retain employees with skills necessary to remain
competitive in our industry.
Our
continued success depends in part on the recruitment and retention of skilled
personnel, including technical, marketing, management and staff personnel.
Experienced personnel in the semiconductor industry, particularly in our
targeted analog areas, are in high demand and competition for their skills is
intense. We cannot assure you that we will be able to successfully recruit and
retain the key personnel we require.
We
may pursue acquisitions and investments that could harm our operating results
and may disrupt our business.
We have
made and will continue to consider making strategic business investments,
alliances and acquisitions we consider necessary to gain access to key
technologies that we believe will augment our existing technical capability and
support our business model objectives. Acquisitions and investments involve
risks and uncertainties that may unfavorably impact our future financial
performance. We may not be able to integrate and develop the technologies we
acquire as expected. If the technology is not developed in a timely manner, we
may be unsuccessful in penetrating target markets. With any
Page 17
of 98
acquisition
there are risks that future operating results may be unfavorably affected by
acquisition related costs, including in-process R&D charges and incremental
R&D spending.
RISK
FACTORS RELATING TO TAX AND ENVIRONMENTAL REGULATIONS
We
may be affected by higher than expected tax rates or exposure to additional
income tax liabilities.
As a
global company, our effective tax rate is dependent upon the geographic
composition of worldwide earnings and tax regulations governing each region. We
are subject to income taxes in both the United States and various foreign
jurisdictions, and complex analyses and significant judgment are required to
determine worldwide tax liabilities. From time to time, we have received notices
of tax assessments in various jurisdictions where we operate. We may receive
future notices of assessments and the amounts of these assessments or our
failure to favorably resolve such assessments may have a material adverse effect
on our financial condition or results of operations.
We have
significant amounts of deferred tax assets. The recognition of deferred tax
assets is reduced by a valuation allowance if it is more likely than not that
the tax benefits associated with the deferred tax benefits will not be realized.
If we are unable to generate sufficient future taxable income in certain
jurisdictions, or if there is a significant change in the enacted tax rates or
the time period within which the underlying temporary differences become taxable
or deductible, we could be required to increase the valuation allowances against
our deferred tax assets, which would cause an increase in our effective tax
rate. Proposals and discussions in Congress and the Executive branch for new
U.S. tax legislation could, if adopted, adversely affect our effective tax rate.
A significant increase in our effective tax rate could have a material adverse
effect on our financial condition or results of operations.
We were
granted a tax holiday by the Malaysian government that is effective for a
ten-year period that began in our fiscal 2010. Such tax holiday is contingent
upon meeting certain minimum requirements either on an annual basis or over
specified periods of time ranging from 5 to 7 years. These requirements relate
to capital expenditures levels, statutory revenue realization and the
maintenance of a skilled workforce in Malaysia. If we are unable to meet these
requirements, our income in Malaysia would be subject to taxation by the
Malaysian government and this would result in increasing our effective tax
rate.
We
are subject to many environmental laws and regulations.
Increasingly
stringent environmental regulations restrict the amount and types of materials
that can be released from our operations into the environment. While the cost of
compliance with environmental laws has not had a material adverse effect on our
results of operations historically, compliance with these and any future
regulations could require significant capital investments in pollution control
equipment or changes in the way we make our products. In addition, because we
use hazardous and other regulated materials in our manufacturing processes, we
are subject to risks of liabilities and claims, regardless of fault, resulting
from accidental releases, including personal injury claims and civil and
criminal fines. The following should also be considered:
|
·
|
we
currently are remediating past contamination at some of our
sites;
|
|
·
|
we
have been identified as a potentially responsible party at a number of
Superfund sites where we (or our predecessors) disposed of wastes in the
past; and
|
|
·
|
significant
regulatory and public attention on the impact of semiconductor operations
on the environment may result in more stringent regulations, further
increasing our costs.
|
For more
information on environmental matters, see Note 15 to the Consolidated Financial
Statements.
ITEM
1B. UNRESOLVED STAFF COMMENTS
Not
applicable.
Page 18
of 98
ITEM
2. PROPERTIES
We
conduct manufacturing, as well as certain research and development activities,
at our wafer fabrication facilities located in South Portland, Maine and
Greenock, Scotland. Production activity in our Texas wafer fabrication facility
decreased during fiscal 2010 as we consolidated its production volume into our
remaining manufacturing facilities in Maine and Scotland. By the end of the
fiscal year, we closed the manufacturing operations in Texas. Wafer fabrication
capacity utilization (based on wafer starts) was 51 percent for fiscal 2010
compared to 53 percent for fiscal 2009. Our assembly and test functions are
performed primarily in our manufacturing facility located in Melaka,
Malaysia.
Our
principal administrative and research facilities are located in Santa Clara,
California. Our regional headquarters for Worldwide Marketing and Sales are
located in Santa Clara, California; Munich, Germany; Tokyo, Japan; and Kowloon,
Hong Kong. We maintain local sales offices and sales service centers in various
locations and countries throughout our four business regions. We also operate
small research facilities in various locations in the U.S.,
including:
|
·
|
Federal
Way, Washington
|
·
|
Norcross,
Georgia
|
|
·
|
Fort
Collins, Colorado
|
·
|
Phoenix,
Arizona
|
|
·
|
Grass
Valley, California
|
·
|
Salem,
New Hampshire
|
|
·
|
Indianapolis,
Indiana
|
·
|
South
Portland, Maine
|
|
·
|
Longmont,
Colorado
|
·
|
Tucson,
Arizona
|
Design
facilities are also operated at overseas locations including China, Estonia,
Finland, Germany, India, Italy, Japan, Malaysia, the Netherlands, Taiwan and the
United Kingdom. We own our manufacturing facilities and our corporate
headquarters. In general, we lease most of our research facilities and our sales
and administrative offices. As described in the business section under Item 1 of
this Form 10-K, our manufacturing operations are centralized and shared among
our product line business units, and no individual facility is dedicated to a
specific operating segment.
Page 19
of 98
ITEM
3. LEGAL PROCEEDINGS
We
currently are a party to various legal proceedings, including those noted below.
While we believe that the ultimate outcome of these various proceedings,
individually and in the aggregate, will not have a material adverse effect on
our financial position or results of operations, litigation is always subject to
inherent uncertainties, and unfavorable rulings could occur. An unfavorable
ruling could include money damages or an injunction prohibiting us from selling
one or more products. Were an unfavorable ruling to occur, there exists the
possibility of a material adverse impact on the net income of the period in
which the ruling occurs, and future periods.
Tax
Matters
Our
federal tax returns for fiscal 2007 through 2009 are currently under examination
by the IRS. In addition, the IRS will audit our amended federal tax returns for
fiscal 2005 and 2006. Several U.S. state taxing jurisdictions are examining our
state tax returns for fiscal 2001 through 2005. During fiscal 2010, the state of
California closed its audits of fiscal years up through fiscal 2000, which
resulted in an immaterial adjustment. Internationally, tax authorities from
several foreign jurisdictions are also examining our foreign tax returns. We
believe we have made adequate tax payments and/or accrued adequate amounts such
that the outcome of these audits will have no material adverse effect on our
financial statements.
Environmental
Matters
We have
been named to the National Priorities List (Superfund) for our Santa Clara,
California site and we have completed a remedial investigation/feasibility study
with the Regional Water Quality Control Board (RWQCB), which is acting as agent
for the EPA. We have agreed in principle with the RWQCB on a site remediation
plan, and we are conducting remediation and cleanup efforts at the site. In
addition to the Santa Clara site, we have been designated from time to time as a
potentially responsible party by international, federal and state agencies for
certain environmental sites with which we may have had direct or indirect
involvement. These designations are made regardless of the extent of our
involvement. These claims are in various stages of administrative or judicial
proceedings and include demands for recovery of past governmental costs and for
future investigations and remedial actions. In many cases, the dollar amounts of
the claims have not been specified and the claims have been asserted against a
number of other entities for the same cost recovery or other relief as is sought
from us. We have also retained responsibility for environmental matters
connected with businesses we sold in fiscal 1996 and 1997, but we are not
currently involved in any legal proceedings relating to those
liabilities.
Other
In May
2008, eTool Development, Inc. and eTool Patent Holdings Corporation
(collectively eTool) brought suit in the U.S. District Court for the Eastern
District of Texas alleging that our WEBENCH® online design tools infringe an
eTool patent and seeking an injunction and unspecified amounts of monetary
damages (trebled because of the alleged willful infringement), attorneys’ fees
and costs. In December 2008, eTool amended the complaint and counterclaims to
include our SOLUTIONS online tool in its allegations of infringement of the
eTool patent. We filed an answer to the amended complaint and counterclaims for
declaratory judgment of non-infringement and invalidity of the patent. On
February 27, 2009, the Court held a scheduling conference setting a claim
construction hearing for August 2011 and a jury trial for January 2012. eTool
served its infringement contentions in March 2009 and we served our invalidity
contentions in May 2009. Both parties exchanged initial disclosures on May 29,
2009. The discovery phase of the case is now open and ongoing. In February 2010,
we filed our inter
partes reexamination petition with the United States Patent and Trademark
Office (PTO), seeking a determination that the ‘919 patent is invalid. On March
15, 2010, the PTO issued a communication granting our inter partes reexamination
petition. The inter
partes proceeding is ongoing. On June 8, 2010, eTool filed its second
amended complaint removing the infringement allegations against our SOLUTIONS
online tool. We answered eTool’s second amended complaint on June 25, 2010. We
intend to contest the case through all available means.
ITEM
4. [REMOVED AND RESERVED]
Page 20
of 98
EXECUTIVE
OFFICERS OF THE REGISTRANT
Fiscal
Year 2010
|
Name
|
Title, Fiscal Year 2010
|
Age
|
|
Brian
L. Halla (1)
|
Chairman
(retired May 30, 2010)
|
63
|
|
Donald
Macleod (2)
|
Chairman,
President and Chief Executive Officer (effective May 31,
2010)
|
61
|
|
Lewis
Chew (3)
|
Senior
Vice President, Finance and Chief Financial Officer
|
47
|
|
Todd
M. DuChene (4)
|
Senior
Vice President, General Counsel and Secretary
|
46
|
|
Detlev
J. Kunz (5)
|
Senior
Vice President, Product Group
|
59
|
|
Chue
Siak “C.S.” Liu (6)
|
Senior
Vice President, Worldwide Manufacturing
|
58
|
|
Suneil
V. Parulekar (7)
|
Senior
Vice President, Worldwide Marketing and Sales
|
62
|
|
Michael
Polacek (8)
|
Senior
Vice President, Key Market Segments and Business
Development
|
46
|
|
Jamie
E. Samath (9)*
|
Vice
President and Corporate Controller
|
39
|
|
Edward
J. Sweeney (10)
|
Senior
Vice President, Human Resources
|
53
|
|
Visamohan
“Mohan” Yegnashankaran (11)
|
Senior
Vice President, Worldwide Technology Development
|
64
|
Except as
otherwise noted, all information is current as of May 30, 2010, the last day of
the 2010 fiscal year.
* Mr.
Samath was named Vice President and Corporate Controller on May 31,
2010.
Business
Experience
|
(1)
|
Mr. Halla
was Chairman of the Board and Chief Executive Officer from May 1996 until
his retirement as Chief Executive Officer on November 30, 2009 and as
Chairman on May 30, 2010. Mr. Halla is no longer employed with National.
Prior to that, Mr. Halla had held positions at LSI Corporation as
Executive Vice President, LSI Logic Products; Senior Vice President and
General Manager, Microprocessor/DSP Products Group; and Vice President and
General Manager, Microprocessor Products
Group.
|
|
|
|
(2)
|
Mr.
Macleod is currently Chairman, President and Chief Executive Officer of
National. Mr. Macleod served as President and Chief Operating Officer from
June 2005 until he was named President and Chief Executive Officer in
November 2009. Mr. Macleod also became National’s Chairman on May 31,
2010. Mr. Macleod was Chief Operating Officer from April 2001 to June
2005. From February 1978 to April 2001, Mr. Macleod held positions as
Executive Vice President, Finance and Chief Financial Officer; Senior Vice
President, Finance and Chief Financial Officer; Vice President and General
Manager, Volume Products—Europe and Director of Finance and Management
Services—Europe.
|
|
(3)
|
Mr.
Chew has been National’s Senior Vice President, Finance and Chief
Financial Officer since June 2001. Prior to that, Mr. Chew
served as Vice President, Corporate Controller from December 1998 to April
2001. Mr. Chew joined National in May
1997.
|
|
(4)
|
Mr. DuChene
has been Senior Vice President, General Counsel and Secretary since he
joined National in January 2008. Prior to joining National, Mr. DuChene
was Executive Vice President, General Counsel and Secretary of Solectron
Corporation, a global electronics manufacturing company, from 2005 to 2007
and as Senior Vice President, Corporate Development, Chief Legal Officer
and Secretary of Fisher Scientific International Inc. from 1996 to 2005.
Prior to that Mr. DuChene was Senior Vice President, General Counsel and
Secretary of OfficeMax, Inc.
|
Page 21 of
98
|
(5)
|
Mr.
Kunz has been Senior Vice President, Product Group since October
2008. Prior to that Mr. Kunz served as Senior Vice President,
Power Management Group from May 2005 to October 2008; Senior Vice
President, Worldwide Marketing and Sales from July 2001 to May 2005; and
Vice President, Europe from January 2000 to July 2001. Mr. Kunz
began his career with National in July
1981.
|
|
(6)
|
Mr.
Liu has been the Senior Vice President, Worldwide Manufacturing Operations
since May 2005. Prior to that time, Mr. Liu served as Vice
President and Managing Director for National’s test and assembly facility
in Melaka, Malaysia from August 1996 to May 2005. Mr. Liu began
his career at National in 1976.
|
|
|
|
(7)
|
Mr.
Parulekar has been Senior Vice President, Worldwide Marketing and Sales
since October 2008. From April 2001 to October 2008, Mr. Parulekar was
Senior Vice President of the Analog Signal Path Group. Prior to
that, Mr. Parulekar served as Vice President of the Amplifier and Audio
Products Group. Mr. Parulekar began his career at National in
January 1989.
|
|
(8)
|
Mr.
Polacek has been Senior Vice President, Key Market Segments and Business
Development since October 2008. Prior to that, Mr. Polacek
served as Vice President, Amplifiers Group from December 2006 to October
2008; Vice President, Audio Products from August 2004 to December 2006;
Vice President, Imaging from August 2003 to August 2004; and Vice
President, Information Appliances from March 1999 to August
2003. Mr. Polacek joined National in June
1992.
|
|
|
|
(9)
|
Mr.
Samath has been Vice President and Corporate Controller since May 31,
2010. From June 2005 to May 31, 2010, Mr. Samath was Corporate Controller.
Prior to that Mr. Samath held the position of Director of Finance, Central
Technology and Manufacturing Group, from May 2001 to June 2005. Mr. Samath
began his career at National in February
1991.
|
|
(10)
|
Mr.
Sweeney has been Senior Vice President, Worldwide Human Resources since
May 2002. Prior to that, Mr. Sweeney was Vice President,
Human Resources for Vitria Technology from May 2000 to May 2002 and Vice
President, Human Resources for Candescent Technologies, Inc. from August
1998 to May 2000. Previously, from August 1994 to August 1998,
Mr. Sweeney held positions with National as Vice President of Human
Resources, Central Manufacturing Technology Group and Vice President of
Human Resources, Analog Products Group. Mr. Sweeney first
began his career with National in
1983.
|
|
(11)
|
Mr.
Yegnashankaran has been Senior Vice President, Technology Research since
January 2010. From May 2005 to January 2010, Mr. Yegnashankaran was Senior
Vice President, Worldwide Technology Development. Prior to that, from June
1996 to May 2005, Mr. Yegnashankaran served as Vice President, Worldwide
Manufacturing Product Development/Engineering. Mr. Yegnashankaran joined
National in June 1996.
|
Our
executive officers serve at the pleasure of our Board of Directors. There is no
family relationship among any of our directors and executive
officers.
Page 22
of 98
PART II
ITEM
5. MARKET FOR REGISTRANT’S COMMON EQUITY, RELATED STOCKHOLDER MATTERS
AND
ISSUER
PURCHASES OF EQUITY SECURITIES
See
information appearing in Note 13, Shareholders’ Equity; and Note 17, Financial
Information by Quarter (Unaudited) in the Notes to the Consolidated Financial
Statements included in Item 8 of this Form 10-K. Our common stock is traded on
the New York Stock Exchange. During fiscal 2010, we paid total cash dividends of
$75.7 million on our common stock, consisting of dividends of $0.08 per share of
common stock paid in each of the quarters of the fiscal year. During fiscal
2009, we paid total cash dividends of $64.4 million on our common stock,
consisting of dividends of $0.06 per share of common stock paid in each of the
first two quarters of the fiscal year and dividends of $0.08 per share of common
stock in each of the remaining two quarters of the fiscal year. Market price
range data is based on the New York Stock Exchange Composite Tape. Market price
per share at the close of business on July 9, 2010 was $14.13. At July 9, 2010,
the number of record holders of our common stock was 4,845. For information on
our equity compensation plans, see Item 12 of this Form 10-K.
During
the past three fiscal years, we did not make any unregistered sales of our
securities.
The
following graph compares a $100 investment in National stock over the five year
period from the beginning of fiscal 2005 through the end of fiscal 2010, with a
similar investment in the Standard & Poor’s 500 Stock Index and Standard
& Poor’s 500 Semiconductor Industry Index. It shows the cumulative total
returns over this five year period, assuming reinvestment of
dividends.
Comparison
of Five Year Cumulative Total Return* Among National,
S&P
500 Index and S&P 500 Semiconductor Industry Index
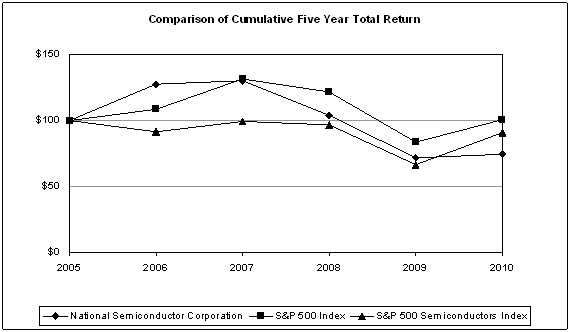
|
May
29,
2005
|
May
28,
2006
|
May
27,
2007
|
May
25,
2008
|
May
31,
2009
|
May
30,
2010
|
||||||||
|
National
Semiconductor Corp.
|
$
|
100.00
|
$
|
127.49
|
$
|
130.57
|
$
|
103.67
|
$
|
71.57
|
$
|
74.07
|
|
|
S&P
500 Index
|
100.00
|
108.84
|
131.30
|
121.55
|
83.42
|
100.93
|
|||||||
|
S&P
500 Semiconductor Industry Index
|
100.00
|
91.13
|
99.46
|
96.83
|
66.48
|
90.73
|
|||||||
* Assumes
$100 invested on 5/29/05 in stock or index, including reinvestment of
dividends.
Page 23
of 98
Issuer
Purchases of Equity Securities
The
following table summarizes purchases we made of our common stock during the
fourth quarter of fiscal 2010:
|
Period
|
Total
Number
Shares
Purchased (1)
|
Average
Price
Paid
per Share
|
Total
Number of
Shares
Purchased as
Part
of Publicly
Announced
Plans or
Programs
|
Approximate
Dollar
Value
of Shares that
May
Yet Be Purchased
Under
the Plans or
Programs
(2)
|
|
Month
# 1
March
1, 2010 –
March
28, 2010
|
4,828
|
$14.40
|
-
|
$
127 million
|
|
Month
# 2
March
29, 2010 –
April
28, 2010
|
30,828
|
$15.21
|
-
|
$
127 million
|
|
Month
# 3
April
29, 2010 –
May
30, 2010
|
4,038
|
$14.13
|
-
|
$
127 million
|
|
Total
|
39,694
|
-
|
(2)
During the fourth fiscal quarter, no purchases were made under the $500 million
stock repurchase program announced in June 2007. As of May 30, 2010, $127
million of the $500 million stock repurchase program announced in June 2007
remains available for future stock repurchases. We do not have any plans to
terminate the program prior to its completion, and there is no expiration date
for this repurchase program.
Page 24
of 98
ITEM
6. SELECTED FINANCIAL DATA
The
following selected financial information has been derived from our audited
consolidated financial statements. The information set forth below is not
necessarily indicative of results of our future operations and should be read in
conjunction with “Management’s Discussion and Analysis of Financial Condition
and Results of Operations” in Item 7 of this Form 10-K and the consolidated
financial statements and related notes thereto in Item 8 of this Form
10-K.
FIVE-YEAR
SELECTED FINANCIAL DATA
|
Years
Ended
(In
Millions, Except Per Share Amounts and Employee Figures)
|
May
30,
2010
|
May
31,
2009
|
May
25,
2008
|
May
27,
2007
|
May
28,
2006
|
||||||||||||
|
OPERATING
RESULTS
|
|||||||||||||||||
|
Net
sales
|
$
|
1,419.4
|
$
|
1,460.4
|
$
|
1,885.9
|
$
|
1,929.9
|
$
|
2,158.1
|
|||||||
|
Cost
of sales
|
484.2
|
544.1
|
671.5
|
757.7
|
885.4
|
||||||||||||
|
Gross
margin
|
935.2
|
916.3
|
1,214.4
|
1,172.2
|
1,272.7
|
||||||||||||
|
Operating
expenses
|
609.4
|
733.1
|
705.3
|
682.5
|
607.2
|
||||||||||||
|
Operating
income
|
325.8
|
183.2
|
509.1
|
489.7
|
665.5
|
||||||||||||
|
Interest
(expense) income, net
|
(58.5
|
)
|
(62.3
|
)
|
(51.7
|
)
|
38.9
|
31.8
|
|||||||||
|
Other
non-operating (expense) income, net
|
1.3
|
(7.3
|
)
|
(6.2
|
)
|
2.0
|
(2.1
|
)
|
|||||||||
|
Income
before income taxes
|
268.6
|
113.6
|
451.2
|
530.6
|
695.2
|
||||||||||||
|
Income
tax expense
|
59.4
|
40.3
|
118.9
|
155.3
|
246.0
|
||||||||||||
|
Net
income
|
$
|
209.2
|
$
|
73.3
|
$
|
332.3
|
$
|
375.3
|
$
|
449.2
|
|||||||
|
EARNINGS
PER SHARE
|
|||||||||||||||||
|
Net
income:
|
|||||||||||||||||
|
Basic
|
$
|
0.88
|
$
|
0.32
|
$
|
1.31
|
$
|
1.17
|
$
|
1.32
|
|||||||
|
Diluted
|
$
|
0.87
|
$
|
0.31
|
$
|
1.26
|
$
|
1.12
|
$
|
1.26
|
|||||||
|
Weighted-average
common and potential common shares outstanding:
|
|||||||||||||||||
|
Basic
|
236.4
|
229.1
|
252.8
|
319.5
|
339.8
|
||||||||||||
|
Diluted
|
241.3
|
235.1
|
264.3
|
334.2
|
357.0
|
||||||||||||
|
FINANCIAL
POSITION AT YEAR-END
|
|||||||||||||||||
|
Working
capital
|
$
|
922.5
|
$
|
811.6
|
$
|
863.0
|
$
|
991.5
|
$
|
1,143.0
|
|||||||
|
Total
assets
|
$
|
2,274.8
|
$
|
1,963.3
|
$
|
2,149.1
|
$
|
2,246.8
|
$
|
2,552.6
|
|||||||
|
Long-term
debt
|
$
|
1,001.0
|
$
|
1,227.4
|
$
|
1,414.8
|
$
|
20.6
|
$
|
21.1
|
|||||||
|
Total
debt
|
$
|
1,277.5
|
$
|
1,289.9
|
$
|
1,477.3
|
$
|
20.6
|
$
|
21.1
|
|||||||
|
Shareholders’
equity
|
$
|
425.9
|
$
|
177.0
|
$
|
196.9
|
$
|
1,768.5
|
$
|
1,967.6
|
|||||||
|
OTHER
DATA
|
|||||||||||||||||
|
Research
and development
|
$
|
272.7
|
$
|
306.0
|
$
|
363.0
|
$
|
363.7
|
$
|
326.6
|
|||||||
|
Capital
additions
|
$
|
43.3
|
$
|
83.7
|
$
|
111.3
|
$
|
106.6
|
$
|
163.3
|
|||||||
|
Cash
dividends declared and paid
|
$
|
75.7
|
$
|
64.4
|
$
|
50.6
|
$
|
45.1
|
$
|
34.2
|
|||||||
|
Number
of employees (in thousands)
|
5.8
|
5.8
|
7.3
|
7.6
|
8.5
|
||||||||||||
Page 25
of 98
ITEM
7. MANAGEMENT’S DISCUSSION AND ANALYSIS OF FINANCIAL CONDITION AND RESULTS OF
OPERATIONS
This
MD&A contains a number of forward-looking statements within the meaning of
Section 27A of the Securities Act of 1933 and Section 21E of the
Securities Exchange Act of 1934. These statements are based on our current
expectations and could be affected by the uncertainties and risk factors
described throughout this filing and particularly in Part I of Form 10-K “Item
1A. Risk Factors” and the “outlook” section of this MD&A. These statements
relate to, among other things, sales, gross margins, operating expenses, capital
expenditures, economic and market conditions, research and development efforts,
asset dispositions, and acquisitions of and investments in other companies, and
are indicated by words or phrases such as “anticipate,” “expect,” “outlook,”
“foresee,” “believe,” “could,” “intend,” “will,” and similar words or phrases.
These statements involve risks and uncertainties that could cause actual results
to differ materially from expectations. These forward-looking statements should
not be relied upon as predictions of future events as we cannot assure you that
the events or circumstances reflected in these statements will be achieved or
will occur. For a discussion of some of the factors that could cause actual
results to differ materially from our forward-looking statements, see the
discussion on risk factors that appears in Part I, Item 1A. of this Form 10-K
and other risks and uncertainties detailed in this and our other reports and
filings with the SEC. We undertake no obligation to update forward-looking
statements to reflect developments or information obtained after the date hereof
and disclaim any obligation to do so.
This
discussion should be read in conjunction with the consolidated financial
statements and the accompanying notes included in this Annual Report on Form
10-K for the year ended May 30, 2010.
Strategy
and Business
We
design, develop, manufacture and market a wide range of semiconductor products,
most of which are analog and mixed-signal integrated circuits. Our goal is to be
the premier provider of high-performance, energy-efficient analog and
mixed-signal solutions. Many of these solutions are marketed under our
PowerWise® brand. We are focused on the following:
|
·
|
growing
our core revenues by marketing our extensive portfolio of general purpose
analog products to a broad base of customers utilizing our established
distribution channels and industry leading design
tools;
|
|
·
|
identifying
and understanding the complex application specific system problems
addressable by analog innovation;
|
|
·
|
providing
energy efficient, analog-intensive solutions that enable customers to
differentiate their products while reducing the power consumption of their
systems;
|
|
·
|
targeting
our analog solutions towards emerging areas or applications that can
provide further growth on top of our core business (current examples would
include LED lighting, renewable energy, portable medical, communications
infrastructure and personal mobile devices);
|
|
·
|
consistently
delivering competitive products with superior quality and supply chain
execution to our customers, and
|
|
·
|
consistently
delivering superior returns on invested capital to our
shareholders.
|
Approximately 94 percent of our
net sales in fiscal 2010 came from Analog segment products. Beyond the general
purpose analog categories defined by the World Semiconductor Trade Statistics or
WSTS, we also sell analog subsystems specifically targeted at certain particular
markets and applications. Energy efficiency is our overarching theme, and our
PowerWise® products enable systems that consume less power, extend battery life
and generate less heat. Our leading-edge products include power management
circuits and sub-systems, audio and operational amplifiers, communication
interface products and data conversion solutions. For more information on our
business, see Part I, “Item 1. Business,” in this Annual Report on Form 10-K for
the fiscal year ended May 30, 2010.
|
|
Critical
Accounting Policies and Estimates
|
We
believe the following critical accounting policies are those policies that have
a significant effect on the determination of our financial position and results
of operations. These policies also require us to make our most difficult and
subjective judgments:
Page 26
of 98
|
|
a)
|
Revenue
Recognition
|
We
recognize revenue from the sale of semiconductor products upon shipment,
provided we have persuasive evidence of an arrangement typically in the form of
a purchase order, title and risk of loss have passed to the customer, the amount
is fixed or determinable and collection of the revenue is reasonably assured. We
record a provision for estimated future returns at the time of shipment. Approximately 64 percent of
our semiconductor product sales were made to distributors in fiscal 2010,
which includes approximately 9 percent of sales made through dairitens in
Japan under local business practices. This compares to approximately 53 percent
in fiscal 2009 and approximately 54 percent in fiscal 2008, which includes sales
made through dairitens in Japan of approximately 8 percent in fiscal 2009 and 11
percent in fiscal 2008. We have agreements with our distributors that cover
various programs, including pricing adjustments based on resale pricing and
volume, price protection for inventory and scrap allowances. The revenue we
record for these distribution sales is net of estimated provisions for these
programs. When determining this net distribution revenue, we must make
significant judgments and estimates. Our estimates are based upon
historical experience rates by geography and product family, inventory levels in
the distribution channel, current economic trends and other related factors. We
continuously monitor the claimed allowance against the rates assumed in our
estimates of the allowances. Actual distributor claims activity has been
materially consistent with the provisions we have made based on our estimates.
However, because of the inherent nature of estimates, there is always a risk
that there could be significant differences between actual amounts and our
estimates. Our financial condition and operating results are dependent on our
ability to make reliable estimates, and we believe that our estimates are
reasonable. However, different judgments or estimates could result in variances
that might be significant to our operating results.
Service
revenues are recognized as the services are provided or as milestones are
achieved, depending on the terms of the arrangement. These revenues are included
in net sales and totaled $19.6 million in fiscal 2010, $17.4 million in fiscal
2009 and $25.1 million in fiscal 2008.
Certain
intellectual property income is classified as revenue if it meets specified
criteria established by company policy that defines whether it is considered a
source of income from our primary operations. These revenues are included
in net sales and totaled $1.3 million in fiscal 2010, $2.6 million in fiscal
2009 and $1.6 million in fiscal 2008. All other intellectual property
income that does not meet the specified criteria is not considered a source of
income from primary operations and is therefore classified as a component of
other operating income, net, in the consolidated statement of income.
Intellectual property income is recognized when the license is delivered, the
fee is fixed or determinable, collection of the fee is reasonably assured and
remaining obligations are perfunctory or inconsequential to the other
party.
|
|
b)
|
Valuation
of Inventories
|
Inventories
are stated at the lower of standard cost, which approximates actual cost on a
first-in, first-out basis, or market. The total carrying value of our inventory
is reduced for any difference between cost and estimated market value of
inventory that is determined to be obsolete or unmarketable, based upon
assumptions about future demand and market conditions. Reductions in carrying
value are deemed to establish a new cost basis. Inventory is not written up if
estimates of market value subsequently improve. We evaluate obsolescence by
analyzing the inventory aging, order backlog and future customer demand on an
individual product basis. If actual demand were to be substantially lower than
what we have estimated, we may be required to write inventory down below the
current carrying value. While our estimates require us to make significant
judgments and assumptions about future events, we believe our relationships with
our customers, combined with our understanding of the end-markets we serve,
provide us with the ability to make reasonable estimates. The actual amount of
obsolete or unmarketable inventory has been materially consistent with
previously estimated write-downs we have recorded. We also evaluate the carrying
value of inventory for lower-of-cost-or-market on an individual product basis,
and these evaluations are intended to identify any difference between net
realizable value and standard cost. Net realizable value is used as a measure of
market for purposes of evaluating lower-of-cost-or-market and is determined as
the selling price of the product less the estimated cost of disposal. When
necessary, we reduce the carrying value of inventory to net realizable value. If
actual market conditions and resulting product sales were to be less favorable
than what we have projected, additional inventory write-downs may be
required.
|
|
c)
|
Impairment
of Goodwill, Intangible Assets and Other Long-lived
Assets
|
We assess
the impairment of long-lived assets whenever events or changes in circumstances
indicate that their carrying value may not be recoverable from the estimated
future cash flows expected to result from their use and
Page 27
of 98
eventual
disposition. Our long-lived assets subject to this evaluation include property,
plant and equipment and amortizable intangible assets. Amortizable intangible
assets subject to this evaluation include developed technology we have acquired,
patents and technology licenses. We assess the impairment of goodwill annually
in our fourth fiscal quarter and whenever events or changes in circumstances
indicate that it is more likely than not that an impairment loss has been
incurred. We are required to make judgments and assumptions in identifying those
events or changes in circumstances that may trigger impairment. Some of the
factors we consider include:
|
·
|
significant
decrease in the market value of an asset;
|
|
·
|
significant
changes in the extent or manner for which the asset is being used or in
its physical condition;
|
|
·
|
significant
change, delay or departure in our business strategy related to the
asset;
|
|
·
|
significant
negative changes in the business climate, industry or economic conditions;
and
|
|
·
|
current
period operating losses or negative cash flow combined with a history of
similar losses or a forecast that indicates continuing losses associated
with the use of an asset.
|
Our
impairment evaluation of long-lived assets includes an analysis of estimated
future undiscounted net cash flows expected to be generated by the assets over
their remaining estimated useful lives. If our estimate of future undiscounted
net cash flows is insufficient to recover the carrying value of the assets over
the remaining estimated useful lives, we record an impairment loss in the amount
by which the carrying value of the assets exceeds the fair value. We determine
fair value based on discounted cash flows using a discount rate commensurate
with the risk inherent in our current business model. Major factors that
influence our cash flow analysis are our estimates for future revenue and
expenses associated with the use of the asset. Different estimates could have a
significant impact on the results of our evaluation. If, as a result of our
analysis, we determine that our amortizable intangible assets or other
long-lived assets have been impaired, we will recognize an impairment loss in
the period in which the impairment is determined. Any such impairment charge
could be significant and could have a material adverse effect on our financial
position and results of operations.
We
classify long-lived assets as assets held for sale when the criteria have been
met, in accordance with ASC Topic 360, “Property, Plant, and Equipment.” Upon
classification of an asset as held for sale, we cease depreciation of the asset
and classify the asset in other current assets at the lower of its carrying
value or fair value (less cost to sell). If an asset is held for sale as a
result of a restructuring of operations, any write down to fair value (less cost
to sell) is included as a restructuring expense in the consolidated statement of
income. When we commit to a plan to abandon a long-lived asset before the end of
its previously estimated useful life, we revise depreciation estimates to
reflect the use of the asset over its shortened useful life. We review
depreciation estimates periodically, including both estimated useful lives and
estimated salvage values. These reviews may result in changes to historical
depreciation rates, which are considered to be changes in accounting estimates
and are accounted for on a prospective basis.
Our
impairment evaluation of goodwill is based on comparing the fair value to the
carrying value of our reporting units containing goodwill. Our reporting units
are based on our operating segments as defined under ASC Topic 280, "Segment
Reporting." The fair value of a reporting unit is measured at the
business unit level using a discounted cash flow approach that incorporates our
estimates of future revenues and costs for those business units. As of May 30, 2010 our
reporting units containing goodwill include our high speed products,
infrastructure power, mobile devices power, performance power products and
precision signal path business units, all of which are operating segments within
our Analog reportable segment, and our custom solutions business unit which is
included in the category “All Others.” The estimates we use in evaluating
goodwill are consistent with the plans and estimates that we use to manage the
underlying businesses. If we fail to deliver new products for these business
units, if the products fail to gain expected market acceptance, or if market
conditions for these business units fail to materialize as anticipated, our
revenue and cost forecasts may not be achieved and we may incur charges for
goodwill impairment, which could be significant and could have a material
adverse effect on our results of operations.
|
|
d)
|
Income
Taxes
|
We
determine deferred tax assets and liabilities based on the future tax
consequences that can be attributed to net operating loss and credit carryovers
and differences between the financial statement carrying amounts of existing
assets and liabilities and their respective tax bases, using the enacted tax
rate expected to be applied when the taxes are actually paid or recovered. The
recognition of deferred tax assets is reduced by a valuation allowance if it is
more likely than not that the tax benefits will not be realized. The ultimate
realization of deferred tax assets depends upon the generation of future taxable
income during the periods in which the net operating loss and credit carryovers
and
Page 28
of 98
differences
between financial statement carrying amounts and their respective tax bases
become deductible. In determining a valuation allowance, we consider past
performance, expected future taxable income and prudent and feasible tax
planning strategies. We currently have a valuation allowance that has been
established primarily against the reinvestment and investment tax credits
related to our operation in Malaysia, as we have concluded that the deferred tax
assets will not be realized in the foreseeable future due to a tax holiday
granted by the Malaysian government that is effective for a ten-year period that
began in our fiscal 2010 and the uncertainty of sufficient taxable income in
Malaysia beyond fiscal 2019.
Our
forecast of expected future taxable income is based on historical taxable income
and projections of future taxable income over the periods that the deferred tax
assets are deductible. Changes in market conditions that differ materially from
our current expectations and changes in future tax laws in the United States and
international jurisdictions or changes in our tax structure may cause us to
change our judgments of future taxable income. These changes, if any, may
require us to adjust the existing tax valuation allowance higher or lower than
the amount we currently have recorded and such an adjustment could have a
material impact on the tax expense for the fiscal year.
The
calculation of tax liabilities involves significant judgment in estimating the
impact of uncertainties in the application of complex tax laws. Although ASC
Topic 740, “Income Taxes,” provides further clarification on the accounting for
uncertainty in income taxes recognized in the financial statements, the
threshold and measurement attribute prescribed by the FASB guidance will
continue to require significant judgment by management. If the ultimate
resolution of tax uncertainties is different from what we have currently
estimated, this could have a material impact on income tax expense.
|
|
e)
|
Share-based
Compensation
|
We
measure and record compensation expense for all share-based payment awards based
on estimated fair values in accordance with ASC Topic 718, “Compensation-Stock
Compensation.” We provide share-based awards to our employees, executive
officers and directors through various equity compensation plans including our
employee equity, stock option, stock purchase and restricted stock plans. The
fair value of stock option and stock purchase equity awards is measured at the
date of grant using a Black-Scholes option pricing model, and the fair value of
restricted stock awards is based on the market price of our common stock on the
date of grant. The cash awards to be paid in connection with retention
arrangements with each of our executive officers (approved by the Compensation
Committee of our Board of Directors in November 2008) is considered a
share-based payment award and measured at fair value since the award is indexed
to the price of our common stock. The fair value of these cash awards is
measured each reporting period and is calculated using the Monte Carlo valuation
method.
In
determining fair value using the Black-Scholes option pricing model and the
Monte Carlo valuation method, management is required to make certain estimates
of the key assumptions such as expected life, expected volatility, dividend
yields and risk free interest rates. The estimates of these key assumptions
involve judgment regarding subjective future expectations of market price and
trends. The assumptions used in determining expected life and expected
volatility have the most significant effect on calculating the fair value of
share-based awards. For all options granted after December 31, 2007, we
determine expected life based on historical stock option exercise experience for
the last four years, adjusted for our expectation of future exercise activity.
For options granted prior to January 1, 2008, we use the simplified method
specified by the SEC’s Staff Accounting Bulletin No. 107 to determine the
expected life of stock options. Expected volatility is based on implied
volatility, as management has determined that implied volatility better reflects
the market’s expectation of future volatility than historical volatility. If we
were to determine that another method to estimate these assumptions was more
reasonable than our current methods, or if another method for calculating these
assumptions were to be prescribed by authoritative guidance, the fair value for
our share-based awards could change significantly. If the expected volatility
and/or expected life were increased under our assumptions, then the
Black-Scholes and Monte Carlo computations of fair value would also increase,
thereby resulting in higher compensation costs being recorded.
Under
GAAP, we are required to estimate forfeitures at the date of grant. Our estimate
of forfeitures is based on our historical activity, which we believe is
indicative of expected forfeitures. In subsequent periods if the actual rate of
forfeitures differs from our estimate, the forfeiture rates may be revised, as
necessary. Changes in the estimated forfeiture rates can have a significant
effect on share-based compensation expense since the effect of adjusting the
rate is recognized in the period the forfeiture estimate is
changed.
Page 29
of 98
We also
grant performance share units to executive officers that require us to estimate
expected achievement of performance targets over the performance period. This
estimate involves judgment regarding future expectations of various financial
performance measures such as those described in the overview section below. If
there are changes in our estimate of the level of financial performance measures
expected to be achieved, the related share-based compensation expense may be
significantly increased or reduced in the period that our estimate
changes.
|
|
Overview
|
We focus
on providing leading-edge analog solutions with a large portion of our sales
classified within the general purpose analog categories as defined by WSTS. In
fiscal 2010, approximately 94 percent of our total sales came from our Analog
segment. We believe that the success we have achieved in these markets has been
driven by our knowledge of the analog markets, our circuit design capabilities
and our understanding of electronic systems, especially as they pertain to
energy efficiency that is enabled by our products. Our success has also been due
to our innovative packaging and proprietary analog process technology, as well
as our comprehensive manufacturing and supply chain competence.
Net sales
were lower in fiscal 2010 compared to net sales in fiscal 2009 as we were
negatively affected throughout the first half of fiscal 2010 by the significant
slowdown in the global economy that affected calendar 2009. In contrast, our net
sales in the second half of fiscal 2010 grew 33 percent over net sales in the
second half of fiscal 2009 as the global economy slowly began to recover.
Although factory utilization was slightly lower at 51 percent in fiscal 2010
compared to 53 percent in fiscal 2009 due to lower sales, we achieved a higher
gross margin percentage compared to fiscal 2009. Although our performance in
gross margin percentage is partly dependent on our sales mix of higher-value
analog products, blended-average selling prices were fairly flat in fiscal 2010
compared to fiscal 2009. Lower inventory obsolescence and scrap rates combined
with better manufacturing cost efficiencies that included the benefits from
factory consolidation activities in fiscal 2010 were the primary contributors to
higher gross margin percentage in fiscal 2010. We continue to direct our
research and development investments on high-value growth areas in analog
markets and applications, with particular focus on power management and energy
efficiency where our PowerWise® products enable systems that consume less power,
extend battery life and generate less heat.
In
reviewing our performance, we consider several key financial measures. When
reviewing our net sales performance, we look at sales growth rates (both
absolute and relative to competitors), new order rates (including turns orders,
which are orders received with delivery requested in the same quarter),
blended-average selling prices, sales of new products and market share. We gauge
our operating income performance based on gross margin trends, product mix,
blended-average selling prices, factory utilization rates and operating expenses
relative to sales. Our profitability and earnings per share increased
sequentially in each of the quarters in fiscal 2010 and were higher for fiscal
2010 compared to fiscal 2009. We remain focused on growing our revenue and
earnings per share over time while generating a consistently high return on
invested capital by concentrating on operating income, working capital
management, capital expenditures and cash management. We determine return on
invested capital based on net operating income after tax divided by invested
capital, which generally consists of total assets reduced by goodwill and
non-interest bearing liabilities.
Stock
repurchase activity is one element of our overall program to deliver a
consistently high return on invested capital, which we believe improves
shareholder value over time. During fiscal 2010, however, we did not repurchase
shares of our common stock as we decided to preserve cash during the uncertain
financial environment and also to pay down some of our long-term debt sooner
than required. As of May 30, 2010, we had a balance of $127.4 million remaining
available for future common stock repurchases under Board authorized
programs.
We also
continued with the dividend program in fiscal 2010, during which time we paid a
total of $75.7 million in cash dividends. On June 10, 2010, our Board of
Directors declared a cash dividend of $0.08 per outstanding share of common
stock, which was paid on July 12, 2010 to shareholders of record at the close of
business on June 21, 2010. On July 12, 2010, in connection with a regularly
scheduled meeting, our Board of Directors declared a cash dividend of $0.10 per
outstanding share of common stock, which will be paid on October 12, 2010 to
shareholders of record at the close of business on September 20,
2010.
Page 30
of 98
The
following table and discussion provide an overview of our operating results for
fiscal 2010, 2009 and 2008:
|
Years
Ended:
(In
Millions)
|
May
30, 2010
|
%
Change
|
May
31, 2009
|
%
Change
|
May
25, 2008
|
|||||||||
|
Net
sales
|
$
|
1,419.4
|
(2.8%
|
)
|
$
|
1,460.4
|
(22.6%
|
)
|
$
|
1,885.9
|
||||
|
Operating
income
|
$
|
325.8
|
$
|
183.2
|
$
|
509.1
|
||||||||
|
As
a % of net sales
|
23.0
|
%
|
12.5
|
%
|
27.0
|
%
|
||||||||
|
Net
income
|
$
|
209.2
|
$
|
73.3
|
$
|
332.3
|
||||||||
|
As
a % of net sales
|
14.7
|
%
|
5.0
|
%
|
17.6
|
%
|
||||||||
Net income for fiscal 2010 includes a
net charge of $20.1 million for severance and restructuring expenses, of which
$1.7 million relates to exit activity associated with the realignment of certain
product line business units and $21.5 million relates to the planned closures of
our manufacturing facilities in Texas and China announced in March
2009. These severance and restructuring expenses were partially
offset by a $3.1 million reduction of accrued expenses related to prior actions
(See Note 6 to the Consolidated Financial Statements). Net income also includes
$0.4 million of other operating income (See Note 4 to the Consolidated Financial
Statements). These charges and credits are all pre-tax amounts.
Net income for fiscal 2009 included
$143.9 million for severance and restructuring expenses related to the actions
taken to reduce overall expenses in response to weak economic conditions and
related business levels. Those actions included workforce reductions (in
November 2008 and March 2009) and the planned closures of our manufacturing
facilities in Texas and China announced in March 2009 (See Note 6 to the
Consolidated Financial Statements). Net income also included a $2.9 million
in-process R&D charge related to the acquisition of ActSolar, Inc. (See Note
7 to the Consolidated Financial Statements) and $2.7 million of other operating
income (See Note 4 to the Consolidated Financial Statements). These charges and
credits are all pre-tax amounts. Income tax expense for fiscal 2009 included
incremental tax expense of $16.7 million related to the write down of foreign
deferred tax assets that resulted from a tax holiday granted by the Malaysian
government that is effective for a ten-year period that began in our fiscal
2010. The effect of the write down of foreign deferred tax assets was partially
offset by $15.0 million of tax benefits associated with R&D tax credits, net
of the portion of the tax benefit that did not meet the more-likely-than-not
recognition threshold.
Net
income for fiscal 2008 included $27.2 million for severance and restructuring
expenses related to a factory modernization effort announced in January 2008 and
a workforce reduction announced in April 2008 (See Note 6 to the Consolidated
Financial Statements). Net income for fiscal 2008 also included $0.4 million of
other operating income (See Note 4 to the Consolidated Financial Statements).
These charges and credits are all pre-tax amounts. Income tax expense for fiscal
2008 included $31.9 million of tax benefits that arose primarily from the
resolution of international tax inquiries, the expiration of statute of
limitations associated with international tax matters and activities related to
the manufacturing restructure and workforce reduction.
|
|
Share-based
Compensation Expense
|
Our
operating results include the recognition of share-based compensation expense,
which totaled $73.8 million in fiscal 2010, $70.9 million in fiscal 2009 and
$89.7 million in fiscal 2008. The overall increase in our share-based
compensation expense in fiscal 2010 compared to fiscal 2009 was primarily due to
higher expense related to the share-based awards for our executive officers, as
the company underwent a transition of its Chief Executive Officer during fiscal
2010. The overall decrease in our share-based compensation in fiscal
2009 compared to fiscal 2008 is primarily due to the drop off of higher
compensation expense from stock options granted prior to fiscal 2007 that
generally had higher computed fair values due mainly to the volatility component
of the fair value computation. For further information and a description of our
share-based compensation plans, see Note 1 and Note 14 to the Consolidated
Financial Statements.
Page 31
of 98
|
|
Net
Sales
|
|
Years
Ended:
(In
Millions)
|
May
30, 2010
|
%
Change
|
May
31, 2009
|
%
Change
|
May
25, 2008
|
|||||||||
|
Analog
segment
|
$
|
1,329.1
|
(0.4%
|
)
|
$
|
1,334.9
|
(21.3%
|
)
|
$
|
1,695.9
|
||||
|
As
a % of net sales
|
93.6
|
%
|
91.4
|
%
|
89.9
|
%
|
||||||||
|
All
others
|
$
|
90.3
|
(28.0%
|
)
|
$
|
125.5
|
(33.9%
|
)
|
$
|
190.0
|
||||
|
As
a % of net sales
|
6.4
|
%
|
8.6
|
%
|
10.1
|
%
|
||||||||
|
Total
net sales
|
$
|
1,419.4
|
$
|
1,460.4
|
$
|
1,885.9
|
||||||||
|
100
|
%
|
100
|
%
|
100
|
%
|
|||||||||
The chart
above and the following discussion are based on our reportable segments
described in Note 16 to the Consolidated Financial Statements. The information
for fiscal 2009 and 2008 has been reclassified to present segment information
based on the structure of our operating segments in fiscal 2010.
During
the first quarter of fiscal 2010, the advanced power business unit was merged
into the infrastructure power business unit. As a result, the Analog segment
comprises five operating segments which include the high speed products,
infrastructure power, mobile devices power, performance power products and
precision signal path business units.
Analog
segment sales were slightly lower in fiscal 2010 compared to fiscal 2009 due to
lower overall demand from customers, particularly from customers in the wireless
handset market, who were negatively affected by the downturn in the overall
global economy throughout calendar 2009. Despite the effect of the economic
downturn in fiscal 2010, analog sales in the second half of fiscal 2010 grew 35
percent over net sales in the second half of fiscal 2009 as the global economy
slowly began to recover. Unit shipments in our Analog segment were just slightly
down by 1 percent in fiscal 2010 compared to the volume shipped in fiscal 2009
due to higher unit shipments in the second half of fiscal 2010. Blended-average
selling prices were essentially flat in fiscal 2010 compared to fiscal
2009.
For
purposes of the following discussion, we have combined as one group the business
units whose products are targeted for the power management market
(infrastructure power, mobile devices power and performance power products).
Although net sales from this group in fiscal 2010 compared to fiscal 2009
decreased by 3 percent, their net sales in the second half of fiscal 2010 were
higher by 29 percent compared to the second half of fiscal 2009. Net sales from
our high speed products and precision signal path business units in fiscal 2010
compared to fiscal 2009 increased by 5 percent and 1 percent, respectively.
These increases in net sales for these business units were driven by the growth
in their net sales in the second half of fiscal 2010 compared to the second half
of fiscal 2009 which was higher by 44 percent and 40 percent,
respectively.
For other
operating business units included in “All Others,” the decrease in sales for
fiscal 2010 compared to fiscal 2009 was primarily due to declining sales from
non-analog business units that are no longer a part of our core focus. The sales
from these non-analog business units include sales generated from foundry and
contract service arrangements.
For
fiscal 2010, net sales in our geographic regions increased by 7 percent in Japan
and 2 percent in Europe while it decreased by 2 percent in the Americas and 7
percent in the Asia Pacific region compared to fiscal 2009. Regional sales as a
percentage of total net sales in fiscal 2010 compared to fiscal 2009 increased
to 24 percent in the Americas, 22 percent in Europe and 9 percent in Japan while
it declined in the Asia Pacific region to 45 percent. The reported amount of net
sales in U.S. dollars related to foreign currency-denominated sales in fiscal
2010 was favorably affected by foreign currency exchange rate fluctuations as
the Japanese yen strengthened over the fiscal year against the dollar. Although
the euro weakened over the fiscal year against the dollar, it did not have a
material effect on foreign currency-denominated sales in fiscal 2010. The
overall effect of currency exchange rate fluctuations on net sales reported in
U.S. dollars was minimal since only 16 percent of our total net sales were
denominated in foreign currency and we have hedging programs intended to
minimize the effect of currency exchange rate fluctuations.
Analog
segment sales were lower in fiscal 2009 compared to fiscal 2008 due to lower
overall demand from customers who were negatively affected by the sharp downturn
in the overall global economy. Weak industry conditions also caused a
significant decline in new orders from our distributors, who service a number of
customers across a broad range of industries and markets. Unit shipments in our
Analog segment decreased 25 percent in fiscal 2009 compared to
the
Page 32
of 98
volume
shipped in fiscal 2008. Blended-average selling prices increased 5 percent in
fiscal 2009 compared to fiscal 2008, which was driven mainly by improved sales
mix from higher-value products.
Within
the analog segment net sales from our power management business unit decreased
by 21 percent in fiscal 2009 compared to fiscal 2008. Net sales from our high
speed products and precision signal path business units in fiscal 2009 compared
to fiscal 2008 decreased by 15 percent and 26 percent,
respectively.
For other
operating business units included in “All Others,” the decrease in sales for
fiscal 2009 compared to fiscal 2008 was primarily due to declining sales from
non-analog business units that are no longer a part of our core focus. The sales
from these non-analog business units include sales generated from foundry and
contract service arrangements.
For
fiscal 2009, net sales in our geographic regions decreased compared to fiscal
2008 by 12 percent in the Americas, 25 percent in Europe, 22 percent in the Asia
Pacific region and 43 percent in Japan. Regional sales as a percentage of total
net sales in fiscal 2009 compared to fiscal 2008 were higher in the Asia Pacific
region at 48 percent and the Americas at 23 percent, but dropped to 21 percent
in Europe and 8 percent in Japan. The reported amount of net sales in U.S.
dollars related to foreign currency-denominated sales in fiscal 2009 was
favorably affected by foreign currency exchange rate fluctuations primarily
because the Japanese yen strengthened over the fiscal year against the dollar.
Although the euro weakened over the fiscal year against the dollar, its effect
on foreign currency-denominated sales in fiscal 2009 was immaterial. The overall
effect of currency exchange rate fluctuations on net sales reported in U.S.
dollars was minimal since less than 20 percent of our total net sales were
denominated in foreign currency and we have hedging programs intended to
minimize the effect of currency exchange rate fluctuations.
|
|
Gross
Margin
|
|
Years
Ended:
(In
Millions)
|
May
30, 2010
|
%
Change
|
May
31, 2009
|
%
Change
|
May
25, 2008
|
|||||||||
|
Net
sales
|
$
|
1,419.4
|
(2.8
%
|
)
|
$
|
1,460.4
|
(22.6%
|
)
|
$
|
1,885.9
|
||||
|
Cost
of sales
|
484.2
|
(11.0
%
|
)
|
544.1
|
(19.0%
|
)
|
671.5
|
|||||||
|
Gross
margin
|
$
|
935.2
|
$
|
916.3
|
$
|
1,214.4
|
||||||||
|
As
a % of net sales
|
65.9
|
%
|
62.7
|
%
|
64.4
|
%
|
||||||||
Our gross
margin percentage was higher in fiscal 2010 compared to fiscal 2009, primarily
due to the favorable effects of cost control measures, including cost savings
from the closures of our manufacturing facilities in both Texas and China where
production activity was ceased during fiscal 2010. Although our blended-average
analog selling prices were essentially flat compared to fiscal 2009, product mix
within our portfolio of analog products continues to have a positive influence
on our performance in gross margin percentage. Lower inventory obsolescence and
scrap rates also affected our gross margin percentages favorably in fiscal 2010
compared to fiscal 2009. Wafer fabrication capacity utilization (based on wafer
starts) was 51 percent in fiscal 2010 compared to 53 percent in fiscal 2009.
Gross margin includes share-based compensation expense of $10.3 million in
fiscal 2010 compared to $16.0 million in fiscal 2009.
Our gross margin percentage decreased
in fiscal 2009 compared to fiscal 2008 due to a decline in factory utilization
caused by significantly lower sales. The decrease in gross margin percentage was
somewhat offset by a favorable effect from lower expenses resulting from cost
control measures. Despite a lower gross margin percentage, improved product mix
of higher-margin analog products continued to have a positive influence on our
performance in gross margin percentage. As part of that product mix improvement,
our blended-average analog selling prices in fiscal 2009 were higher compared to
fiscal 2008. Wafer fabrication capacity utilization (based on wafer starts) was
67 percent in fiscal 2008. Share-based compensation expense included in gross
margin was $20.1 million in fiscal 2008.
Page 33
of 98
|
|
Research
and Development
|
|
Years
Ended:
(In
Millions)
|
May
30, 2010
|
%
Change
|
May
31, 2009
|
%
Change
|
May
25, 2008
|
|||||||||
|
Research
and development
|
$
|
272.7
|
(10.9
%
|
)
|
$
|
306.0
|
(15.7%
|
)
|
$
|
363.0
|
||||
|
As
a % of net sales
|
19.2
|
%
|
21.0
|
%
|
19.2
|
%
|
||||||||
The
decrease in research and development expenses in fiscal 2010 compared to fiscal
2009 primarily reflects cost savings associated with the cost reduction actions
announced in fiscal 2009, including lower payroll and employee benefit expenses.
Share-based compensation expense included in R&D expense for fiscal 2010 was
$17.8 million compared to $24.3 million in fiscal 2009. We are continuing to
concentrate our research and development spending on analog products and
underlying analog capabilities with particular emphasis on circuits that enable
greater energy efficiency. We continue to invest in the
development of new analog products that can serve applications in a wide variety
of end markets such as portable electronics, industrial, communications
infrastructure, renewable energy products, medical, and sensing and detection
applications. Because of our focus on markets that require or involve greater
energy efficiency, a significant portion of our research and development is
directed at power management technology.
The decrease in R&D expenses for
fiscal 2009 compared to fiscal 2008 primarily reflects cost savings associated
with the cost reduction actions announced in November 2008 and in fiscal 2008
combined with lower annual payroll and employee benefits expenses. Fiscal 2009
expenses also reflect savings from reduced discretionary spending in response to
the weakening economic environment during the same time frame. Share-based
compensation expense included in R&D expense was $27.3 million in fiscal
2008.
R&D expenses for fiscal 2009
exclude an in-process R&D charge of $2.9 million related to the acquisition
of ActSolar, Inc. (See Note 7 to the Consolidated Financial Statements). The
in-process R&D charge is included as a separate component of operating
expenses in the consolidated statement of income for fiscal 2009.
|
|
Selling,
General and Administrative
|
|
Years
Ended:
(In
Millions)
|
May
30, 2010
|
%
Change
|
May
31, 2009
|
%
Change
|
May
25, 2008
|
|||||||||
|
Selling,
general and administrative
|
$
|
317.0
|
12.0%
|
$
|
283.0
|
(10.3%
|
)
|
$
|
315.5
|
|||||
|
As
a % of net sales
|
22.3
|
%
|
19.4
|
%
|
16.7
|
%
|
||||||||
Selling,
general and administrative expenses in fiscal 2010 include a charge of $5.3
million compared to fiscal 2009, which included a credit of $7.7
million. This charge and credit represent changes in the liability
associated with the employee deferred compensation plan due to changes in the
market value of the employees’ corresponding investment assets for the plan. See
the discussion of the corresponding gain and loss on the employees’ investment
asset described in the paragraph, “Other Non-Operating Income (Expense), Net.”
Excluding these amounts, SG&A expenses for fiscal 2010 compared to fiscal
2009 increased by $21.0 million, or 7.2 percent. We believe that excluding the
charges and credit relating to changes in the liability associated with the
employee deferred compensation plan liability provides a better understanding of
the changes in our SG&A expenses that are related to our core operating
performance during the relevant fiscal years. SG&A expenses in fiscal 2010
compared to fiscal 2009 include higher employee benefit expenses and higher
share-based compensation expenses related to executive officers, which are
offset by cost savings associated with the cost reduction actions announced in
fiscal 2009. Share-based compensation expense for fiscal 2010 included in
SG&A expenses was $45.7 million compared to fiscal 2009, which was $30.6
million.
Although SG&A expenses were lower
in fiscal 2009 compared to fiscal 2008, SG&A expenses include credits
related to reductions in the liability associated with the employee deferred
compensation plan due to a decline in the market value of the employees’
corresponding investment assets in the plan ($6.2 million in fiscal 2008).
Excluding the effect from the reductions in this liability associated with the
deferred compensation plan, the decrease is primarily due to lower share-based
compensation expense and lower annual payroll and employee benefit expenses
which were partially offset by higher legal expenses related to intellectual
property matters. Share-based compensation expense included in SG&A expenses
was $42.3 million in fiscal 2008.
Page 34
of 98
Severance and Restructuring Expenses
Related to Cost Reduction Programs
Our
fiscal 2010 results include a net charge of $20.1 million for severance and
restructuring expenses, of which $1.7 million relates to exit activity
associated with the realignment of certain product line business units and $21.5
million relates to the planned closures of our manufacturing facilities in Texas
and China announced in March 2009. These severance and restructuring expenses
were partially offset by a $3.1 million reduction of accrued expenses related to
prior actions. For a more complete discussion of these actions and related
charges, see Note 6 to the Consolidated Financial Statements.
Our fiscal 2009 results included a net
charge of $143.9 million for severance and restructuring expenses. Of this
amount, we recorded a charge of $117.3 million related to the actions announced
in March 2009 when we eliminated approximately 850 positions worldwide. In
addition, we planned to further reduce headcount by approximately 875 over the
next 12-18 months through the eventual closure of our wafer fabrication facility
in Arlington, Texas and our assembly and test plant in Suzhou, China. This
charge included severance costs of $59.7 million, asset impairment charges of
$54.3 million and other exit-related costs of $3.3 million associated with
closure and transfer activities. In November 2008, we announced a global
workforce reduction that eliminated approximately 330 positions. We also closed
two design centers located in the United States. As a result of this action, we
recorded severance and restructuring expenses of $26.4 million in fiscal 2009,
which includes severance costs of $25.5 million, other exit-related costs of
$0.1 million and $0.8 million for the impairment of abandoned equipment. In
addition to the actions described above, we recorded a net charge of $0.3
million related to the workforce reduction and manufacturing restructure
announced in fiscal 2008. This amount includes a $2.2 million charge for other
exit-related costs that was partially offset by a recovery of $1.9 million. For
a more complete discussion of these actions and related charges, see Note 6 to
the Consolidated Financial Statements.
Our fiscal 2008 results included a
net charge of $27.2 million for severance and restructuring expenses. We
recorded $19.1 million primarily for severance and equipment impairment as part
of an action announced in January 2008 to modernize our facilities and
rationalize our capacity. We also recorded a charge of $9.6 million for
severance related to a workforce reduction announced in April 2008 as part of
our efforts to strategically align resources in connection with our focus on
revenue growth in key market areas that require better power management and
energy efficiency. In addition, severance and restructuring expenses for fiscal
2008 included a recovery of $1.5 million. See Note 6 to the Consolidated
Financial Statements for a more complete discussion of these actions and related
charges.
|
|
Charge
for Acquired In-Process Research and
Development
|
In
connection with the acquisition of ActSolar, Inc. in fiscal 2009, we allocated
$2.9 million of the total purchase price to the value of in-process R&D.
This amount was expensed upon acquisition because technological feasibility had
not been established and no future alternative uses existed for the technology.
See Note 7 to the Consolidated Financial Statements for a more complete
discussion of the acquisition.
Interest
Income
|
Years
Ended:
(In
Millions)
|
May
30, 2010
|
May
31, 2009
|
May
25, 2008
|
|||||||||||
|
Interest
income
|
$
|
1.8
|
$
|
10.4
|
$
|
33.8
|
||||||||
The
decrease in interest income in fiscal 2010, 2009 and 2008 is due to lower
interest rates in each of those fiscal years.
|
|
Interest
Expense
|
|
Years
Ended:
(In
Millions)
|
May
30, 2010
|
May
31, 2009
|
May
25, 2008
|
|||||||||||
|
Interest
expense
|
$
|
60.3
|
$
|
72.7
|
$
|
85.5
|
||||||||
The
decrease in interest expense in fiscal 2010, 2009 and fiscal 2008 is due to
lower interest rates related to our debt that has floating interest rates and a
lower overall debt balance.
Page 35
of 98
|
|
Other
Non-Operating Income (Expense), Net
|
|
Years
Ended:
(In
Millions)
|
May
30, 2010
|
May
31, 2009
|
May
25, 2008
|
|||||||||||
|
Gain
(loss) on investments
|
$
|
5.6
|
$
|
(7.3
|
)
|
$
|
(6.0
|
)
|
||||||
|
Loss
on extinguishment of debt
|
(2.1
|
)
|
-
|
-
|
||||||||||
|
Net
loss on derivative instruments in fair value hedge
|
(2.2
|
)
|
-
|
-
|
||||||||||
|
Charitable
contribution
|
-
|
-
|
(0.2
|
)
|
||||||||||
|
Total
other non-operating income (expense), net
|
$
|
1.3
|
$
|
(7.3
|
)
|
$
|
(6.2
|
)
|
||||||
A primary
component of other non-operating income (expense), net is derived from
activities or market value fluctuations related to investment assets. The gain
on investments in fiscal 2010 reflects an increase in the market value of the
investment assets held in a trust for the employee deferred compensation plan
while the losses in fiscal 2009 and 2008 reflected a decline in its market
value. As described in the paragraph, “Selling, General and Administrative,”
SG&A expenses for the same period include the related charge or credit
pertaining to the corresponding liability. The gain on investments in fiscal
2010 also includes a $0.3 million gain from the liquidation of a non-marketable
investment we previously held. The loss on investments in fiscal 2009 and 2008
included gains of $0.4 million and $0.2 million, respectively, from
non-marketable investments that were not associated with the deferred
compensation plan. The loss on derivative instruments is a result of our swap
agreement for the April 2010 $250 million debt issuance (See Note 3 to the
Consolidated Financial Statements).
Income
Tax Expense
|
Years
Ended:
(In
Millions)
|
May
30, 2010
|
May
31, 2009
|
May
25, 2008
|
|||||||||||
|
Income
tax expense
|
$
|
59.4
|
$
|
40.3
|
$
|
118.9
|
||||||||
|
Effective
tax rate
|
22.1
|
%
|
35.5
|
%
|
26.4
|
%
|
||||||||
The
effective tax rate was lower in fiscal 2010 compared to fiscal 2009 due to a tax
benefit of $7.4 million primarily arising from the repatriation of previously
unremitted Japanese earnings. In addition, a portion of our earnings comes from
our Malaysian subsidiary and is not taxable because of a tax holiday granted by
the Malaysian government that is effective for a ten-year period that began in
our fiscal 2010.
The effective tax rate was higher for
fiscal 2009 compared to fiscal 2008, primarily due to the write down of foreign
deferred tax assets that resulted from the tax holiday granted by the Malaysian
government described above. The effect of the write down of foreign deferred tax
assets was partially offset by the tax benefits associated with R&D tax
credits, net of the portion of the tax benefit that did not meet the
more-likely-than-not recognition threshold (See Note 11 to the Consolidated
Financial Statements).
We
adopted standards that changed the accounting for uncertain tax positions in
accordance with ASC Topic 740, “Income Taxes” at the beginning of fiscal 2008.
The cumulative effect of the change in accounting for uncertain tax positions
was a $37.1 million increase to retained earnings at the beginning of fiscal
2008. Historically, we had classified unrecognized tax benefits as current
income taxes payable. Under the new guidance, we now classify unrecognized tax
benefits as long-term income taxes payable except to the extent we anticipate
cash payment within the next year. Any prospective adjustments to our
unrecognized tax benefits will be recorded as an increase or decrease to income
tax expense and cause a corresponding change to our effective tax
rate.
Our ability to realize the net deferred
tax assets ($315.8 million at May 30, 2010) is primarily dependent on our
ability to generate future U.S. taxable income. We believe it is more likely
than not that we will generate sufficient taxable income to utilize these tax
assets. Our ability to utilize these tax assets is dependent on future results
and it is therefore possible that we will be unable to ultimately realize some
portion or all of the benefits of these recognized deferred tax assets. This
could result in additions to the deferred tax asset valuation allowance and an
increase to tax expense.
Foreign
Operations
Our
foreign operations include manufacturing facilities in the Asia Pacific region
and Europe and sales offices throughout the Asia Pacific region, Europe and
Japan. A portion of the transactions at these facilities is denominated in local
currency,
Page 36
of 98
which
exposes us to risk from exchange rate fluctuations. Our exposure from expenses
at foreign manufacturing facilities during fiscal 2010 was concentrated in U.K.
pound sterling, Malaysian ringgit and Chinese RMB. Where practical, we hedge net
non-U.S. dollar denominated asset and liability positions using forward exchange
and purchased option contracts. Our exposure from foreign currency denominated
revenue is limited to the Japanese yen and the euro. We hedge up to 100 percent
of the notional value of outstanding customer orders denominated in foreign
currency using forward exchange contracts and over-the-counter foreign currency
options. A portion of anticipated foreign sales commitments is at times hedged
using purchased option contracts that have an original maturity of one year or
less.
Financial
Market Risks
We are
exposed to financial market risks, including changes in interest rates and
foreign currency exchange rates. To mitigate these risks, we use derivative
financial instruments. We do not use derivative financial instruments for
speculative or trading purposes.
Although
there has been continued deterioration and instability in the financial markets,
the credit quality of our investment portfolio (classified as cash and cash
equivalents) remains very high. Our investment portfolio is mainly comprised of
debt instruments that are with A/A2 or better rated issuers, of which the
majority is rated AA-/Aa2 or better. We limit our exposure to any one
counterparty by diversifying our investments and continually evaluating each
counterparty’s relative credit standing. As of May 30, 2010, the total credit
exposure from most single counterparties did not exceed $40 million with the
exception of AAA rated government-backed bonds and deposits. Our debt
instruments also have very short average maturities that are generally less than
a month, and we have not encountered any delays or disruption in their
redemptions or maturities nor have we experienced any losses in connection with
our cash investments.
Although
the $250 million principal amount of senior unsecured notes we issued in a
public offering in April 2010 bear interest at a fixed rate, we entered into an
interest rate swap agreement that effectively converts the fixed rate of the
debt to a floating rate. As a result, an increase in the reference interest rate
increases our interest expense and similarly, a decrease in the reference
interest rate decreases our interest expense. At our current debt levels, a
change in the London Interbank Offered Rate, or LIBOR, of one percentage point
would result in a corresponding change in our interest expense of up to $2.5
million annually. Decreases in interest expense would be offset by decreases in
interest income earned from our large cash portfolio. Similarly, if interest
rates were to increase, it is likely that both our interest expense and our
interest income on cash would increase. We repaid in full the $250 million
principal amount of senior floating rate notes that became due in June 2010
subsequent to the fiscal year end. The remainder of our long-term debt totaling
approximately $1 billion has fixed interest rates and is not affected by changes
in interest rates.
A
substantial majority of our revenue and capital spending is transacted in U.S.
dollars. However, we do enter into transactions in other currencies, primarily
the Japanese yen, pound sterling, euro and various other Asian currencies. To
protect against reductions in value and the volatility of future cash flows
caused by changes in foreign exchange rates, we have established programs to
hedge our exposure to these changes in foreign currency exchange rates. Our
hedging programs reduce, but do not always eliminate, the impact of foreign
currency exchange rate movements. An adverse change (defined as 15 percent in
all currencies) in exchange rates would result in a decline in income before
taxes of less than $15 million. This calculation assumes that each exchange rate
would change in the same direction relative to the U.S. dollar. In addition to
the direct effects of changes in exchange rates, these changes typically affect
the volume of sales or the foreign currency sales price as competitors’ products
become more or less attractive. Our sensitivity analysis of the effects of
changes in foreign currency exchange rates does not factor in a potential change
in sales levels or local currency selling prices. All of these potential changes
are based on sensitivity analyses performed as of May 30, 2010.
Liquidity
and Capital Resources
|
Years
Ended:
(In
Millions)
|
May
30, 2010
|
May
31, 2009
|
May
25, 2008
|
|||||||
|
Net
cash provided by operating activities
|
$
|
402.9
|
$
|
360.8
|
$
|
644.3
|
||||
|
Net
cash used in investing activities
|
(41.7
|
)
|
(81.7
|
)
|
(102.0
|
)
|
||||
|
Net
cash used in financing activities
|
(34.5
|
)
|
(315.6
|
)
|
(634.1
|
)
|
||||
|
Net
change in cash and cash equivalents
|
$
|
326.7
|
$
|
(36.5
|
)
|
$
|
(91.8
|
)
|
||
The
primary factors contributing to the changes in cash and cash equivalents in
fiscal 2010, 2009 and 2008 are described below:
Page 37
of 98
In
fiscal 2010, cash from operating activities was positively affected by net
income, adjusted for non-cash items (primarily depreciation and amortization,
and share-based compensation expense), combined with a positive effect from
changes in working capital components. The positive changes in working capital
were from a decrease in inventory plus increases in accounts payable and accrued
expenses, as well as other non-current liabilities. These positive changes were
partially offset by the negative change in working capital from an increase in
receivables and other current assets. In fiscal 2009, cash from operating
activities was generated by net income, adjusted for non-cash items (primarily
depreciation and amortization, and share-based compensation expense), combined
with a positive effect from changes in working capital components. The positive
changes in working capital were mainly attributable to decreases in receivables
and inventories. These positive changes were partially offset by the negative
change from decreases in accounts payable and accrued expenses, as well as the
decrease in other non-current liabilities. In fiscal 2008, cash from operating
activities was generated by net income, adjusted for non-cash items (primarily
depreciation and amortization, and share-based compensation expense) and a
positive effect from changes in working capital components. Changes in working
capital that had a positive effect were attributable to an increase in accounts
payable and accrued expenses and decreases in inventories and other assets,
which were partially offset by a decrease in other non-current
liabilities.
The
primary use of cash for investing activities in fiscal 2010 was the purchase of
property, plant and equipment of $43.3 million, mainly representing the purchase
of machinery and equipment, combined with a net payment of $4.8 million
associated with the acquisition of ERI. The primary use of cash for
investing activities in fiscal 2009 was the purchase of property, plant and
equipment of $83.7 million, mainly representing the purchase of machinery and
equipment. The primary use of cash for investing activities in fiscal 2008 was
the purchase of property, plant and equipment of $111.3 million, mainly
representing the purchase of machinery and equipment, which was partially offset
by proceeds from the sale of property, plant and equipment of $16.6
million.
The
primary use of cash for financing activities in fiscal 2010 was for payments of
$265.6 million of principal payments on the bank term loan, $75.7 million for
cash dividends, and $6.3 million for software license obligations. This amount
was partially offset by cash proceeds of $244.9 million (net of issuance costs
and discount on principal) from our issuance of $250 million principal amount of
senior unsecured notes in a public offering in April 2010 and $71.2 million from
the issuance of common stock under employee benefit plans. The primary use of
cash for financing activities in fiscal 2009 was for the repurchase of 6.2
million shares of our common stock in the open market for $128.4 million and
payments of $187.6 million for principal payments on the unsecured bank term
loan and $64.4 million for cash dividends. These amounts were partially offset
by cash proceeds of $60.2 million from the issuance of common stock under
employee benefits plans. The primary use of cash for financing activities in
fiscal 2008 was for the repurchase of 85.9 million shares of our common stock
for $2.1 billion, which included the delivery of 58.0 million shares of our
common stock repurchased under the $1.5 billion accelerated share repurchase
program. The remaining shares were repurchased in the open market. We also used
cash for financing activities for the payments of $50.6 million for cash
dividends, $46.8 million on the unsecured bank term loan and $14.6 million
related to tax withholdings paid on behalf of employees for net share
settlements. These amounts were partially offset by cash proceeds of $1.5
billion (net of issuance costs) that came from new debt, which included $1.0
billion unsecured senior notes issued in a public offering and a $500.0 million
unsecured credit facility with a consortium of banks funded in fiscal 2008. Cash
proceeds also included $103.7 million from the issuance of common stock under
employee benefit plans. Financing activities in fiscal 2008 also include an
additional $1.5 billion of cash received from the unsecured bridge credit
facility that was used to finance the accelerated stock repurchase and an
additional payment of $1.5 billion for its full repayment after completing the
$1.0 billion unsecured senior note offering and the $500 million unsecured
credit facility with a consortium of banks.
As
described above we issued $250 million principal amount of senior unsecured
notes in a public offering in April 2010. The unsecured notes bear interest at a
fixed rate of 3.95 percent and are due in April 2015. Interest is payable
semi-annually and the notes are redeemable by us at any time. In April 2010, we
also repaid in full the remaining outstanding principal on our unsecured term
loan with a consortium of banks prior to its original maturity of June 2012. The
early repayment resulted in a cash outlay of $203.6 million and the recognition
of a $2.1 million loss on extinguishment (see Note 10 to the Consolidated
Financial Statements).
On June
10, 2010, our Board of Directors declared a cash dividend of $0.08 per
outstanding share of common stock, which was paid on July 12, 2010 to
shareholders of record at the close of business on June 21, 2010. On July 12,
2010, in connection with a regularly scheduled meeting, our Board of Directors
declared a cash dividend of $0.10 per outstanding share of common stock, which
will be paid on October 12, 2010 to shareholders of record at the close of
business on September 20, 2010.
Page 38
of 98
We anticipate that our fiscal 2011 capital expenditures will be higher than the
fiscal 2010 amount. We will continue to manage the level of capital expenditures
relative to sales levels, capacity utilization and industry business conditions.
By the end of fiscal 2010, we ceased production activity in both China and
Texas. Activities associated with the closures of those manufacturing facilities
are expected to continue through the end of calendar 2010, as well as activities
related to the exit activity associated with the realignment of certain product
line business units. In June 2010 after the end of our fiscal year, we repaid in
full the $250.0 million principal amount of senior floating rate notes that
became due June 2010. Our remaining debt as of May 30, 2010 includes our 6.15
percent fixed rate notes with an aggregate principal amount of $375 million due
in June 2012, our 3.95 percent fixed rate notes with an aggregate principal of
$250 million due in April 2015 and our 6.6 percent fixed rate notes with an
aggregate principal amount of $375 million due in June 2017. We expect that
existing cash and investment balances, together with existing lines of credit
and cash generated by operations, will be sufficient to finance the capital
investments currently planned for fiscal 2011 and payments related to the plant
closures and product line business unit realignment. However, we cannot assure
that if economic conditions were to substantially further deteriorate within the
next year, we would have the appropriate financial resources to meet our
business requirements.
Our cash
and investment balances are dependent in part on continued collection of
customer receivables and the ability to sell inventories. Although we have not
experienced major problems with our customer receivables, continual declines in
overall economic conditions could lead to deterioration in the quality of
customer receivables in the future. Since we no longer hold investments with
maturities greater than 90 days, we did not experience any major declines in our
cash equivalents or marketable investments as a result of the downturn in the
financial markets. However, major declines in financial markets could cause
reductions in our cash equivalents and marketable investments in the
future.
The
following table provides a summary of the effect on liquidity and cash flows
from our contractual obligations as of May 30, 2010:
|
Payments
due by period:
|
|||||||||||||||
|
(In
Millions)
|
Total
|
Less
than
1
Year
|
1 –
3
Years
|
3
– 5
Years
|
More
than
5
Years
|
||||||||||
|
Contractual
obligations:
|
|||||||||||||||
|
Long-term
debt
|
$
|
1,277.5
|
$
|
276.5
|
$
|
375.0
|
$
|
251.0
|
$
|
375.0
|
|||||
|
Operating
lease obligations:
|
|||||||||||||||
|
Non-cancelable
operating leases
|
35.5
|
15.0
|
12.8
|
5.7
|
2.0
|
||||||||||
|
Purchase
obligations:
|
|||||||||||||||
|
CAD
software licensing agreements
|
7.4
|
7.4
|
-
|
-
|
-
|
||||||||||
|
Other
software licensing agreements
|
1.3
|
1.3
|
-
|
-
|
-
|
||||||||||
|
Industrial
gas contracts
|
6.0
|
0.5
|
1.0
|
1.0
|
3.5
|
||||||||||
|
Other
purchase obligations
|
19.9
|
7.1
|
8.4
|
4.4
|
-
|
||||||||||
|
Total
|
$
|
1,347.6
|
$
|
307.8
|
$
|
397.2
|
$
|
262.1
|
$
|
380.5
|
|||||
|
Commercial
commitments:
Standby
letters of credit under bank multicurrency
agreement
|
$
|
3.4
|
$
|
3.4
|
$
|
-
|
$
|
-
|
$
|
-
|
|||||
In
addition, as of May 30, 2010, capital purchase commitments were $15.5
million.
We do not
currently have any relationships with unconsolidated entities or financial
partnerships, such as entities often referred to as structured finance or
special purpose entities, which might be established for the purpose of
facilitating off-balance sheet arrangements or other contractually narrow or
limited purposes. We do not engage in trading activities involving non-exchange
traded contracts. As a result, we do not believe we are materially exposed to
financing, liquidity, market or credit risks that could arise if we had engaged
in these relationships.
Recently
Issued Accounting Pronouncements
In April,
2010, the FASB issued FASB Accounting Standards Update (ASU) No. 2010-17,
“Revenue Recognition (Topic 605) - Milestone Method of Revenue Recognition - a
consensus of the FASB Emerging Issues Task Force.” This ASU provides guidance on
defining a milestone and determining when it may be appropriate to apply the
milestone method of revenue recognition for research or development
transactions. This ASU will be effective on a prospective basis
for
Page 39
of 98
milestones
achieved beginning in our second quarter of fiscal 2011. We do not expect the
adoption of this ASU to have a significant effect to our consolidated financial
statements.
In January 2010, the FASB issued ASU
No. 2010-06, “Fair Value Measurements and Disclosures (Topic 820) – Improving
Disclosures about Fair Value Measurements.” This ASU requires new disclosures
regarding significant transfers in and out of Levels 1 and 2, and information
about activity in Level 3 fair value measurements. In addition, this ASU
clarifies existing disclosures regarding input and valuation techniques, as well
as the level of disaggregation for each class of assets and liabilities. This
ASU is effective for us beginning in fiscal 2011. We do not expect the adoption
of this ASU to have a significant effect on our consolidated financial
statements.
In October 2009, the FASB issued ASU
No. 2009-13, “Revenue Recognition (Topic 605) – Multiple-Deliverable Revenue
Arrangements – a consensus of the FASB Emerging Issues Task Force.” In the
absence of vendor-specific objective evidence (VSOE) or other third party
evidence (TPE) of the selling price for the deliverables in a multiple-element
arrangement, this ASU requires companies to use an estimated selling price (ESP)
for the individual deliverables. Companies are to apply the relative-selling
price model for allocating an arrangement’s total consideration to its
individual elements. Under this model, the ESP is used for both the delivered
and undelivered elements that do not have VSOE or TPE of the selling price. This
ASU will be applied on a prospective basis for revenue arrangements entered into
or materially modified beginning in our fiscal 2012, with earlier application
permitted. Since we will apply the requirements of this ASU on a prospective
basis, we are currently evaluating its requirements and have not yet determined
its effect on our consolidated financial statements.
Outlook
During
fiscal 2010, we experienced improvement in our business as the global economy
began to recover. New orders increased sequentially in each successive quarter
of fiscal 2010. This led to sequential growth in net sales in each quarter of
fiscal 2010.
In the
fourth quarter of fiscal 2010, new orders increased by 12 percent over the
preceding third quarter. This was driven primarily by our distributor channel,
although new orders from our direct OEM customer base also increased
sequentially. A portion of the improvement in total company new orders was
attributable to better-than-expected turns orders, which represent orders
received with delivery requested in the same quarter. This increase in turns
orders came mainly from increasing levels of demand in the industrial markets,
which are served through our distribution channel. As a result of the
improvement in order activity, our opening backlog as we entered the first
quarter of fiscal 2011 was higher than the level it was when we began the fourth
quarter of fiscal 2010.
Considering
all factors, including those described above, we provided guidance for net sales
in the first quarter of fiscal 2011 to increase approximately 3 percent to 5
percent sequentially from the level achieved in the fourth quarter of fiscal
2010. However, if backlog orders are cancelled or if the currently anticipated
level of turns orders is less than expected, we may not be able to achieve this
projected level of sales. As a result of the higher net sales outlook, we
anticipate that our wafer fabrication utilization will rise in the first quarter
of fiscal 2011. Consequently, we anticipate that our gross margin percentage for
the first quarter of fiscal 2011 will increase compared to the fourth quarter of
fiscal 2010 depending on the sales level that we achieve. However, if there are
declines in factory utilization or changes in the expected sales level or
product mix, our gross margin percentage could be unfavorably
affected.
ITEM
7A. QUANTITATIVE AND QUALITATIVE DISCLOSURES ABOUT MARKET RISK
See
information/discussion appearing under the subcaption “Financial Market Risks”
of Management’s Discussion and Analysis of Financial Condition and Results of
Operations in Item 7 of this Form 10-K and the information appearing in Note 1,
“Summary of Significant Accounting Policies,” and Note 3, “Financial
Instruments,” in the Notes to the Consolidated Financial Statements included in
Item 8 of this Form 10-K.
Page 40
of 98
ITEM
8. FINANCIAL STATEMENTS AND SUPPLEMENTARY DATA
INDEX TO
CONSOLIDATED FINANCIAL STATEMENTS
|
Page
|
||
|
Financial Statements of National Semiconductor
Corporation and Subsidiaries:
|
||
|
Consolidated
Balance Sheets at May 30, 2010 and May 31, 2009
|
42
|
|
|
Consolidated
Statements of Income for each of the years in the three-year period ended
May
30, 2010
|
43
|
|
|
Consolidated
Statements of Comprehensive Income for each of the years in the three-year
period ended May 30, 2010
|
44
|
|
|
Consolidated
Statements of Shareholders’ Equity for each of the years in the three-year
period ended May 30, 2010
|
45
|
|
|
Consolidated
Statements of Cash Flows for each of the years in the three-year period
ended May 30, 2010
|
46
|
|
|
Notes
to Consolidated Financial Statements
|
47
|
|
|
Reports
of Independent Registered Public Accounting Firm
|
85
|
|
|
Financial Statement
Schedule:
|
||
|
Schedule
II -- Valuation and Qualifying Accounts for each of the years in the
three-year period ended May 30, 2010
|
93
|
|
Page 41
of 98
NATIONAL
SEMICONDUCTOR CORPORATION
CONSOLIDATED
BALANCE SHEETS
|
May
30,
|
May
31,
|
|||||
|
(In
Millions, Except Share Amounts)
|
2010
|
2009
|
||||
|
ASSETS
|
||||||
|
Current
assets:
|
||||||
|
Cash
and cash equivalents
|
$
|
1,027.0
|
$
|
700.3
|
||
|
Receivables,
less allowances of $30.0 in 2010 and $18.7 in 2009
|
98.2
|
71.7
|
||||
|
Inventories
|
118.6
|
134.6
|
||||
|
Deferred
tax assets
|
70.3
|
72.6
|
||||
|
Other
current assets
|
156.8
|
108.0
|
||||
|
Total
current assets
|
1,470.9
|
1,087.2
|
||||
|
Property,
plant and equipment, net
|
390.1
|
461.8
|
||||
|
Goodwill
|
66.1
|
61.5
|
||||
|
Deferred
tax assets, net
|
245.5
|
251.5
|
||||
|
Other
assets
|
102.2
|
101.3
|
||||
|
Total
assets
|
$
|
2,274.8
|
$
|
1,963.3
|
||
|
LIABILITIES
AND SHAREHOLDERS’ EQUITY
|
||||||
|
Current
liabilities:
|
||||||
|
Current
portion of long-term debt
|
$
|
276.5
|
$
|
62.5
|
||
|
Accounts
payable
|
49.8
|
40.3
|
||||
|
Accrued
expenses
|
204.5
|
144.6
|
||||
|
Income
taxes payable
|
17.6
|
28.2
|
||||
|
Total
current liabilities
|
548.4
|
275.6
|
||||
|
Long-term
debt
|
1,001.0
|
1,227.4
|
||||
|
Long-term
income taxes payable
|
175.3
|
162.6
|
||||
|
Other
non-current liabilities
|
124.2
|
120.7
|
||||
|
Total
liabilities
|
1,848.9
|
1,786.3
|
||||
|
Commitments
and contingencies
|
||||||
|
Shareholders’
equity:
|
||||||
|
Preferred
stock of $0.50 par value. Authorized 1,000,000 shares.
|
-
|
-
|
||||
|
Common
stock of $0.50 par value. Authorized 850,000,000 shares.
|
||||||
|
Issued
and outstanding 239,071,512 in 2010 and 232,605,355 in
2009
|
119.5
|
116.3
|
||||
|
Additional
paid-in-capital
|
188.3
|
67.6
|
||||
|
Retained
earnings
|
250.3
|
116.8
|
||||
|
Accumulated
other comprehensive loss
|
(132.2
|
)
|
(123.7
|
)
|
||
|
Total
shareholders’ equity
|
425.9
|
177.0
|
||||
|
Total
liabilities and shareholders’ equity
|
$
|
2,274.8
|
$
|
1,963.3
|
||
See
accompanying Notes to Consolidated Financial Statements
Page 42
of 98
NATIONAL
SEMICONDUCTOR CORPORATION
CONSOLIDATED
STATEMENTS OF INCOME
|
Years
Ended
|
May
30,
|
May
31,
|
May
25,
|
||||||||
|
(In
Millions, Except Per Share Amounts)
|
2010
|
2009
|
2008
|
||||||||
|
Net
sales
|
$
|
1,419.4
|
$
|
1,460.4
|
$
|
1,885.9
|
|||||
|
Cost
of sales
|
484.2
|
544.1
|
671.5
|
||||||||
|
Gross
margin
|
935.2
|
916.3
|
1,214.4
|
||||||||
|
Research
and development
|
272.7
|
306.0
|
363.0
|
||||||||
|
Selling,
general and administrative
|
317.0
|
283.0
|
315.5
|
||||||||
|
Severance
and restructuring expenses
|
20.1
|
143.9
|
27.2
|
||||||||
|
In-process
research and development charge
|
-
|
2.9
|
-
|
||||||||
|
Other
operating income, net
|
(0.4
|
)
|
(2.7
|
)
|
(0.4
|
)
|
|||||
|
Operating
expenses
|
609.4
|
733.1
|
705.3
|
||||||||
|
Operating
income
|
325.8
|
183.2
|
509.1
|
||||||||
|
Interest
income
|
1.8
|
10.4
|
33.8
|
||||||||
|
Interest
expense
|
(60.3
|
)
|
(72.7
|
)
|
(85.5
|
)
|
|||||
|
Other
non-operating income (expense), net
|
1.3
|
(7.3
|
)
|
(6.2
|
)
|
||||||
|
Income
before income taxes
|
268.6
|
113.6
|
451.2
|
||||||||
|
Income
tax expense
|
59.4
|
40.3
|
118.9
|
||||||||
|
Net
income
|
$
|
209.2
|
$
|
73.3
|
$
|
332.3
|
|||||
|
Earnings
per share:
|
|||||||||||
|
Basic
|
$
|
0.88
|
$
|
0.32
|
$
|
1.31
|
|||||
|
Diluted
|
$
|
0.87
|
$
|
0.31
|
$
|
1.26
|
|||||
|
Weighted-average
common and potential common shares outstanding:
|
|||||||||||
|
Basic
|
236.4
|
229.1
|
252.8
|
||||||||
|
Diluted
|
241.3
|
235.1
|
264.3
|
||||||||
See
accompanying Notes to Consolidated Financial Statements
Page 43
of 98
NATIONAL
SEMICONDUCTOR CORPORATION
CONSOLIDATED
STATEMENTS OF COMPREHENSIVE INCOME
|
Years
Ended
|
May
30,
|
May
31,
|
May
25,
|
||||||||
|
(In
Millions)
|
2010
|
2009
|
2008
|
||||||||
|
Net
income
|
$
|
209.2
|
$
|
73.3
|
$
|
332.3
|
|||||
|
Other
comprehensive (loss) income, net of tax:
|
|||||||||||
|
Defined
benefit pension plans:
|
|||||||||||
|
Reclassification
adjustment for the amortization of transition
asset
included in net periodic pension cost
|
(0.1
|
)
|
(0.2
|
)
|
(0.1
|
)
|
|||||
|
Recognition
of actuarial (loss) gain arising during the period
|
(8.3
|
)
|
(36.5
|
)
|
27.4
|
||||||
|
Plan
settlement
|
-
|
-
|
(0.4
|
)
|
|||||||
|
Retirement
health plan:
|
|||||||||||
|
Recognition
of prior service costs upon implementation of new plan
|
(0.2
|
)
|
-
|
||||||||
|
Recognition
of actuarial loss arising during the period
|
(0.1
|
)
|
-
|
-
|
|||||||
|
Derivative
instruments:
|
|||||||||||
|
Unrealized
gain on cash flow hedges
|
-
|
-
|
0.1
|
||||||||
|
Other
comprehensive (loss) income
|
(8.5
|
)
|
(36.9
|
)
|
27.0
|
||||||
|
Comprehensive
income
|
$
|
200.7
|
$
|
36.4
|
$
|
359.3
|
|||||
See
accompanying Notes to Consolidated Financial Statements
Page 44
of 98
NATIONAL
SEMICONDUCTOR CORPORATION
CONSOLIDATED
STATEMENTS OF SHAREHOLDERS’ EQUITY
|
(((In
Millions, Except Per Share Amount)
|
Common
Stock
|
Retained
Earnings
|
Accumulated
Other
Comprehensive
Loss
|
Total
|
|||||||||||||||
|
Shares
|
Par
Value
|
Additional
Paid-In Capital
|
|||||||||||||||||
|
Balance
at May 27, 2007
|
310.3
|
$
|
155.1
|
$
|
-
|
$
|
1,727.2
|
$
|
(113.8
|
)
|
$
|
1,768.5
|
|||||||
|
Cumulative
effect adjustment upon the adoption of new accounting
|
|||||||||||||||||||
|
standards
for uncertain income tax positions
|
-
|
-
|
-
|
37.1
|
-
|
37.1
|
|||||||||||||
|
Net
income
|
-
|
-
|
-
|
332.3
|
-
|
332.3
|
|||||||||||||
|
Cash
dividend declared and paid ($0.20 per share)
|
-
|
-
|
-
|
(50.6
|
)
|
-
|
(50.6
|
)
|
|||||||||||
|
Issuance
of common stock under option and purchase plans
|
7.6
|
3.9
|
99.8
|
-
|
-
|
103.7
|
|||||||||||||
|
Issuance
of stock under Executive Officer Equity Plan
|
1.0
|
0.5
|
(0.5
|
)
|
-
|
-
|
-
|
||||||||||||
|
Cancellation
of restricted stock
|
(0.4
|
)
|
(0.2
|
)
|
(14.4
|
)
|
-
|
-
|
(14.6
|
)
|
|||||||||
|
Share-based
compensation cost
|
-
|
-
|
89.4
|
-
|
-
|
89.4
|
|||||||||||||
|
Tax
benefit associated with stock options
|
-
|
-
|
27.6
|
-
|
-
|
27.6
|
|||||||||||||
|
Purchase
and retirement of treasury stock
|
(85.9
|
)
|
(43.0
|
)
|
(201.
9
|
)
|
(1,878.6
|
)
|
-
|
(2,123.5
|
)
|
||||||||
|
Other
comprehensive income
|
-
|
-
|
-
|
-
|
27.0
|
27.0
|
|||||||||||||
|
Balance
at May 25, 2008
|
232.6
|
116.3
|
-
|
167.4
|
(86.8
|
)
|
196.9
|
||||||||||||
|
Effect
upon the adoption of new accounting standards for change
in
|
|||||||||||||||||||
|
defined benefit plan measurement date, net of tax
|
-
|
-
|
-
|
(0.6
|
)
|
-
|
(0.6
|
)
|
|||||||||||
|
Net
income
|
-
|
-
|
-
|
73.3
|
-
|
73.3
|
|||||||||||||
|
Cash
dividend declared and paid ($0.28 per share)
|
-
|
-
|
-
|
(64.4
|
)
|
-
|
(64.4
|
)
|
|||||||||||
|
Issuance
of common stock under option and purchase plans
|
6.2
|
3.1
|
59.1
|
-
|
-
|
62.2
|
|||||||||||||
|
Cancellation
of restricted stock
|
-
|
-
|
(0.4
|
)
|
-
|
-
|
(0.4
|
)
|
|||||||||||
|
Share-based
compensation cost
|
-
|
-
|
67.2
|
-
|
-
|
67.2
|
|||||||||||||
|
Tax
benefit associated with stock options
|
-
|
-
|
8.1
|
-
|
-
|
8.1
|
|||||||||||||
|
Purchase
and retirement of treasury stock
|
(6.2
|
)
|
(3.1
|
)
|
(66.4
|
)
|
(58.9
|
)
|
-
|
(128.4
|
)
|
||||||||
|
Other
comprehensive income
|
-
|
-
|
-
|
-
|
(36.9
|
)
|
(36.9
|
)
|
|||||||||||
|
Balance
at May 31, 2009
|
232.6
|
116.3
|
67.6
|
116.8
|
(123.7
|
)
|
177.0
|
||||||||||||
|
Net
income
|
-
|
-
|
-
|
209.2
|
-
|
209.2
|
|||||||||||||
|
Cash
dividend declared and paid ($0.32 per share)
|
-
|
-
|
-
|
(75.7
|
)
|
-
|
(75.7
|
)
|
|||||||||||
|
Issuance
of common stock under option and purchase plans
|
6.3
|
3.2
|
65.9
|
-
|
-
|
69.1
|
|||||||||||||
|
Issuance
of stock under Executive Officer Equity Plan
|
0.3
|
0.1
|
(0.1
|
)
|
-
|
-
|
-
|
||||||||||||
|
Cancellation
of restricted stock
|
(0.1
|
)
|
(0.1
|
)
|
(1.9
|
)
|
-
|
-
|
(2.0
|
)
|
|||||||||
|
Share-based
compensation cost
|
-
|
-
|
64.9
|
-
|
-
|
64.9
|
|||||||||||||
|
Tax
deficiency associated with stock options
|
-
|
-
|
(6.8
|
)
|
-
|
-
|
(6.8
|
)
|
|||||||||||
|
Stock
option exchange program
|
-
|
-
|
(1.3
|
)
|
-
|
-
|
(1.3
|
)
|
|||||||||||
|
Other
comprehensive income
|
-
|
-
|
-
|
-
|
(8.5
|
)
|
(8.5
|
)
|
|||||||||||
|
Balance
at May 30, 2010
|
239.1
|
$
|
119.5
|
$
|
188.3
|
$
|
250.3
|
$
|
(132.2
|
)
|
$
|
425.9
|
|||||||
See
accompanying Notes to Consolidated Financial Statements
Page 45
of 98
NATIONAL
SEMICONDUCTOR CORPORATION
CONSOLIDATED
STATEMENTS OF CASH FLOWS
|
(In
Millions)
|
May
30,
2010
|
May
31,
2009
|
May
25,
2008
|
|||||||||
|
CASH
FLOWS FROM OPERATING ACTIVITIES:
|
||||||||||||
|
Net
income
|
$
|
209.2
|
$
|
73.3
|
$
|
332.3
|
||||||
|
Adjustments
to reconcile net income with net cash
|
||||||||||||
|
provided
by operating activities:
|
||||||||||||
|
Depreciation
and amortization
|
94.5
|
119.8
|
132.7
|
|||||||||
|
Share-based
compensation expense
|
65.4
|
67.7
|
89.7
|
|||||||||
|
Excess
tax benefit from share-based payment arrangements
|
(0.3
|
)
|
(5.0
|
)
|
(17.0
|
)
|
||||||
|
Tax
(deficiency) benefit associated with stock options
|
(6.8
|
)
|
8.1
|
27.6
|
||||||||
|
Deferred
tax provision
|
12.9
|
21.2
|
5.1
|
|||||||||
|
(Gain)
loss on investments
|
(5.6
|
)
|
7.3
|
6.0
|
||||||||
|
Loss
(gain) on disposal of equipment
|
0.9
|
(0.1
|
)
|
0.2
|
||||||||
|
(Recovery)
impairment of equipment and other assets
|
(1.2
|
)
|
55.1
|
4.5
|
||||||||
|
Non-cash
restructuring recovery
|
(8.3
|
)
|
(1.5
|
)
|
(1.5
|
)
|
||||||
|
In-process
research and development charge
|
-
|
2.9
|
-
|
|||||||||
|
Loss
on extinguishment of debt
|
2.1
|
-
|
-
|
|||||||||
|
Other,
net
|
4.7
|
0.7
|
4.0
|
|||||||||
|
Changes
in certain assets and liabilities, net:
|
||||||||||||
|
Receivables
|
(28.2
|
)
|
65.2
|
13.3
|
||||||||
|
Inventories
|
15.7
|
13.5
|
27.1
|
|||||||||
|
Other
current assets
|
(23.1
|
)
|
2.9
|
23.3
|
||||||||
|
Accounts
payable and accrued expenses
|
59.9
|
(35.7
|
)
|
46.0
|
||||||||
|
Current
and deferred income taxes
|
1.7
|
(8.5
|
)
|
(18.4
|
)
|
|||||||
|
Other
non-current liabilities
|
9.4
|
(26.1
|
)
|
(30.6
|
)
|
|||||||
|
Net
cash provided by operating activities
|
402.9
|
360.8
|
644.3
|
|||||||||
|
CASH
FLOWS FROM INVESTING ACTIVITIES:
|
||||||||||||
|
Purchase
of property, plant and equipment
|
(43.3
|
)
|
(83.7
|
)
|
(111.3
|
)
|
||||||
|
Sale
of equipment
|
3.1
|
1.1
|
16.6
|
|||||||||
|
Business
acquisition, net of cash acquired
|
(4.8
|
)
|
(4.5
|
)
|
-
|
|||||||
|
Funding
of benefit plan
|
(1.6
|
)
|
(6.4
|
)
|
(5.4
|
)
|
||||||
|
Redemption
and realized net losses (gains) of benefit plan
|
7.5
|
11.6
|
(0.2
|
)
|
||||||||
|
Other,
net
|
(2.6
|
)
|
0.2
|
(1.7
|
)
|
|||||||
|
Net
cash used in investing activities
|
(41.7
|
)
|
(81.7
|
)
|
(102.0
|
)
|
||||||
|
CASH
FLOWS FROM FINANCING ACTIVITIES:
|
||||||||||||
|
Proceeds
from unsecured senior notes, net of issuance costs of $2.4 in fiscal 2010
and $7.1 in fiscal 2008
|
244.9
|
-
|
992.9
|
|||||||||
|
Proceeds
from bank borrowings, net of issuance costs of $3.5
|
-
|
-
|
1,996.5
|
|||||||||
|
Repayment
of bank borrowings
|
(265.6
|
)
|
(187.6
|
)
|
(1,546.8
|
)
|
||||||
|
Payment
on software license obligations
|
(6.3
|
)
|
-
|
(8.7
|
)
|
|||||||
|
Excess
tax benefit from share-based payment arrangements
|
0.3
|
5.0
|
17.0
|
|||||||||
|
Issuance
of common stock
|
71.2
|
60.2
|
103.7
|
|||||||||
|
Payroll
taxes paid on behalf of employees
|
(2.0
|
)
|
(0.4
|
)
|
(14.6
|
)
|
||||||
|
Purchase
and retirement of treasury stock
|
-
|
(128.4
|
)
|
(2,123.5
|
)
|
|||||||
|
Cash
payments in connection with stock option exchange program
|
(1.3
|
)
|
-
|
-
|
||||||||
|
Cash
dividends declared and paid
|
(75.7
|
)
|
(64.4
|
)
|
(50.6
|
)
|
||||||
|
Net
cash used in financing activities
|
(34.5
|
)
|
(315.6
|
)
|
(634.1
|
)
|
||||||
|
Net
change in cash and cash equivalents
|
326.7
|
(36.5
|
)
|
(91.8
|
)
|
|||||||
|
Cash
and cash equivalents at beginning of year
|
700.3
|
736.8
|
828.6
|
|||||||||
|
Cash
and cash equivalents at end of year
|
$
|
1,027.0
|
$
|
700.3
|
$
|
736.8
|
||||||
See
accompanying Notes to Consolidated Financial Statements
Page 46
of 98
NATIONAL
SEMICONDUCTOR CORPORATION
NOTES TO
CONSOLIDATED FINANCIAL STATEMENTS
Note
1. Summary of Significant Accounting Policies
Operations
We
design, develop, manufacture and market a wide range of semiconductor products,
most of which are analog and mixed-signal integrated circuits. Our goal is to be
the premier provider of high-performance energy-efficient analog and
mixed-signal solutions. These solutions are marketed under our PowerWise® brand.
Energy-efficiency is our overarching theme, and our PowerWise® products enable
systems that consume less power, extend battery life and generate less heat. Our
leading-edge products include power management circuits and sub-systems, audio
and operational amplifiers, communication interface products and data conversion
solutions.
Basis
of Presentation
The
consolidated financial statements include National Semiconductor Corporation and
our majority-owned subsidiaries. All significant intercompany transactions are
eliminated in consolidation.
Our
fiscal year ends on the last Sunday of May and for our fiscal year ended May 30,
2010, we had a 52-week year. For our fiscal year ended May 31, 2009, we had a
53-week year. Operating results for the additional week in fiscal 2009 were
considered immaterial to our consolidated results of operations for fiscal 2009.
Our fiscal year ended May 25, 2008 was a 52-week year.
Revenue
Recognition
We
recognize revenue from the sale of semiconductor products upon shipment,
provided we have persuasive evidence of an arrangement typically in the form of
a purchase order, title and risk of loss have passed to the customer, the amount
is fixed or determinable and collection of the revenue is reasonably assured. We
record a provision for estimated future returns at the time of shipment.
Approximately 64 percent of our semiconductor product sales were made to
distributors in fiscal 2010, which includes approximately 9 percent of sales
made through dairitens in Japan under local business practices. This compares to
approximately 53 percent in fiscal 2009 and approximately 54 percent in fiscal
2008, which includes
sales made through dairitens in Japan of approximately 8 percent in fiscal 2009
and 11 percent in fiscal 2008. We have agreements with our distributors
that cover various programs, including pricing adjustments based on resale
pricing and volume, price protection for inventory and scrap
allowances.
In line
with industry practices, we generally credit distributors for the effect of
price reductions on their inventory of our products and, under specific
conditions, we repurchase products that we have discontinued. In general,
distributors do not have the right to return product, except under customary
warranty provisions. The programs we offer to our distributors could include one
or both of the following:
|
·
|
Allowances involving pricing
and volume. We refer to this as the “contract sales debit”
program.
|
|
·
|
Allowance for inventory
scrap. We refer to this as the “scrap allowance”
program.
|
Under the
contract sales debit program, products are sold to distributors at standard
published prices that are contained in price books that are broadly provided to
our various distributors. Distributors are required to pay for this product
within our standard commercial terms. After the initial purchase of the product,
the distributor has the opportunity to request a price allowance for a
particular part number depending on the current market conditions for that
specific part as well as volume considerations. This request is made prior to
the distributor reselling the part. Once we have approved an allowance to the
distributor, the distributor proceeds with the resale of the product and credits
are issued to the distributor in accordance with the specific allowance that we
approved. Periodically, we issue new distributor price books. For those parts
for which the standard prices have been reduced, we provide an immediate credit
to distributors for inventory quantities they have on hand.
Under the
scrap allowance program, certain distributors are given a contractually defined
allowance to cover the cost of any scrap they might incur. The amount of the
allowance is specifically agreed upon with each distributor.
The
revenue we record for these distribution sales is net of estimated provisions
for these programs. Our estimates are based upon historical experience rates by
geography and product family, inventory levels in the distribution channel,
current economic trends and other related factors. We continuously monitor the
claimed allowances against the rates assumed
Page 47
of 98
in our
estimates of the allowances. Actual distributor claims activity has been
materially consistent with the provisions we have made based on our
estimates.
Service
revenues are recognized as the services are provided or as milestones are
achieved, depending on the terms of the arrangement. These revenues are included
in net sales and totaled $19.6 million in fiscal 2010, $17.4 million in fiscal
2009 and $25.1 million in fiscal 2008.
Certain
intellectual property income is classified as revenue if it meets specified
criteria established by company policy that defines whether it is considered a
source of income from our primary operations. These revenues are included in net
sales and totaled $1.3 million in fiscal 2010, $2.6 million in fiscal 2009 and
$1.6 million in fiscal 2008. All other intellectual property income that does
not meet the specified criteria is not considered a source of income from
primary operations and is therefore classified as a component of other operating
income, net, in the consolidated statement of income. Intellectual property
income is recognized when the license is delivered, the fee is fixed or
determinable, collection of the fee is reasonably assured and remaining
obligations are perfunctory or inconsequential to the other party.
Inventories
Inventories
are stated at the lower of standard cost, which approximates actual cost on a
first-in, first-out basis, or market. The total carrying value of our inventory
is reduced for any difference between cost and estimated market value of
inventory that is determined to be obsolete or unmarketable, based upon
assumptions about future demand and market conditions.
Property,
Plant and Equipment
Property,
plant and equipment are recorded at cost. We use the straight-line method to
depreciate machinery and equipment over their estimated useful life (3-9 years).
Buildings and improvements are depreciated using both straight-line and
declining-balance methods over the assets’ remaining estimated useful life (3-50
years), or, in the case of leasehold improvements, over the lesser of the
estimated useful life or lease term.
We capitalize eligible costs to
acquire software used internally. We use the straight-line method to amortize
software used internally over its estimated useful life (generally 3-5 years).
Internal-use software is included in the property, plant and equipment
balance.
Goodwill
Goodwill
represents the excess of the purchase price over the fair value of identifiable
net tangible and intangible assets acquired in a business combination. Goodwill
is assigned to reporting units and as of May 30, 2010, we have six reporting
units that contain goodwill.
We
evaluate goodwill for impairment on an annual basis and whenever events or
changes in circumstance indicate that it is more likely than not that an
impairment loss has been incurred. We assess the impairment of goodwill annually
in our fourth fiscal quarter, which has been selected as the period for our
recurring evaluation for all reporting units. Our impairment evaluation of
goodwill is based on comparing the fair value to the carrying value of our
reporting units containing goodwill. The fair value of a reporting unit is
measured at the business unit level using a discounted cash flow approach that
incorporates our estimates of future revenues and costs for those business
units.
Impairment
of Long-lived Assets
We assess
the impairment of long-lived assets whenever events or changes in circumstances
indicate that their carrying value may not be recoverable from the estimated
future cash flows expected to result from their use and eventual disposition.
Our long-lived assets subject to this evaluation include property, plant and
equipment and amortizable intangible assets. Amortizable intangible assets
subject to this evaluation include developed technology we have acquired,
patents and technology licenses. Our impairment evaluation of long-lived assets
includes an analysis of estimated future undiscounted net cash flows expected to
be generated by the assets over their remaining estimated useful lives. If our
estimate of future undiscounted net cash flows is insufficient to recover the
carrying value of the assets over the remaining estimated useful lives, we
record an impairment loss in the amount by which the carrying value of the
assets exceeds the fair value. If assets are determined to be recoverable, but
the useful lives are shorter than we originally estimated, we depreciate or
amortize the net book value of the asset over the newly determined remaining
useful lives.
We
classify long-lived assets as assets held for sale when the criteria have been
met, in accordance with ASC Topic 360, “Property, Plant, and Equipment.” Upon
classification of an asset as held for sale, we cease depreciation of the asset
and
Page 48
of 98
classify
the asset as a current asset at the lower of its carrying value or fair value
(less cost to sell). If an asset is held for sale as a result of a restructuring
of operations, any write down to fair value (less cost to sell) is included as a
restructuring expense in the consolidated statement of income. When we commit to
a plan to abandon a long-lived asset before the end of its previously estimated
useful life, we revise depreciation estimates to reflect the use of the asset
over its shortened useful life. We review depreciation estimates periodically,
including both estimated useful lives and estimated salvage values. These
reviews may result in changes to historical depreciation rates, which are
considered to be changes in accounting estimates and are accounted for on a
prospective basis.
Income
Taxes
We
determine deferred tax assets and liabilities based on the future tax
consequences that can be attributed to net operating loss and credit carryovers
and differences between the financial statement carrying amounts of existing
assets and liabilities and their respective tax bases, using the enacted tax
rates expected to be applied when the taxes are actually paid or realized. The
recognition of deferred tax assets is reduced by a valuation allowance if it is
more likely than not that the tax benefits will not be realized. The ultimate
realization of deferred tax assets depends upon the generation of future taxable
income during the periods in which the net operating loss and credit carryovers
and differences between financial statement carrying amounts and their
respective tax bases become deductible.
Earnings
per Share
We
compute basic earnings per share using the weighted-average number of common
shares outstanding. Diluted earnings per share are computed using the
weighted-average common shares outstanding after giving effect to potential
common shares from stock options, restricted stock and restricted stock units
based on the treasury stock method.
For all
years presented, the reported net income was used as the numerator in our
computation of basic and diluted earnings per share. A reconciliation of the
shares used in the computation follows:
|
(In
Millions, Except Exercise Prices)
|
2010
|
2009
|
2008
|
|
Weighted-average
common shares outstanding used
|
|||
|
for
basic earnings per share
|
236.4
|
229.1
|
252.8
|
|
Effect
of dilutive securities:
|
|||
|
Stock
options, restricted stock and restricted stock units
|
4.9
|
6.0
|
11.5
|
|
Weighted-average
common and potential common shares
|
|||
|
outstanding
used for diluted earnings per share
|
241.3
|
235.1
|
264.3
|
|
Anti-dilutive
common equivalent shares:
|
|||
|
Stock
options:
|
|||
|
Number
of shares
|
34.1
|
41.9
|
23.0
|
|
Weighted-average
exercise price
|
$21.68
|
$23.25
|
$27.26
|
Anti-dilutive
common equivalent shares are not included in the calculation of diluted earnings
per share. For fiscal 2010, 2009 and 2008, respectively, the effect of these
shares was anti-dilutive because the exercise price of the related stock options
exceeded the average market price during the year. Shares related to outstanding
stock options at May 30, 2010 that were anti-dilutive could potentially dilute
basic earnings per share in the future.
Currencies
The
functional currency for all operations worldwide is the U.S. dollar. We include
gains and losses arising from remeasurement of foreign currency financial
statement balances into U.S. dollars and gains and losses resulting from foreign
currency transactions in selling, general and administrative expenses. Included
in net income were net foreign currency losses of $3.9 million in fiscal 2010
and $3.4 million in fiscal 2009. Net income in fiscal 2008 included a net
foreign currency gain of $2.1 million.
Page 49
of 98
Financial
Instruments
Cash and
Cash Equivalents. Cash equivalents are highly liquid instruments with an
original maturity of three months or less. We maintain cash equivalents in
various currencies and in a variety of financial instruments.
Deferred
Compensation Plan Assets. Employee contributions under the deferred compensation
plan (See Note 12 to the Consolidated Financial Statements) are maintained in a
rabbi trust and are not readily available to us. Participants can direct the
investment of their deferred compensation plan accounts in the same investments
funds offered by the 401(k) plan. Although participants direct the investment of
these funds, they are classified as trading securities and are included in other
assets because they remain assets of the company until they are actually paid
out to the participants. We had deferred compensation plan assets of $40.3
million at May 30, 2010 and $40.9 million at May 31, 2009, which are included in
other assets. In connection with these trading securities, we recorded a net
gain of $5.3 million in fiscal 2010, and net losses of $7.7 million in fiscal
2009 and $6.2 million in fiscal 2008. There is an offset for the same amounts
included in SG&A expenses in fiscal 2010, 2009 and 2008, respectively, that
represents the corresponding change in the liability associated with the
employee deferred compensation plan due to the change in market value of these
trading securities.
Derivative
Financial Instruments. As part of our risk management strategy we use derivative
financial instruments, including forwards, swaps and purchased options, to hedge
certain foreign currency and interest rate exposures. Our intent is to offset
gains and losses that occur from our underlying exposure with gains and losses
on the derivative contracts used to hedge them. As a matter of company policy,
we do not enter into speculative positions with derivative instruments. The
criteria we use for designating an instrument as a hedge include the
instrument’s effectiveness in risk reduction and direct matching of the
financial instrument to the underlying transaction.
We record
all derivative instruments on the balance sheet at fair value. Gains or losses
resulting from changes in the values of these derivatives are accounted for
based on the use of the derivative and whether it qualifies for hedge
accounting. See Note 3 to the Consolidated Financial Statements for a full
description of our hedging activities and related accounting
policies.
Share-based
Compensation
We
measure and record compensation expense for all share-based payment awards based
on estimated fair values in accordance with ASC Topic 718, “Compensation-Stock
Compensation.” We provide share-based awards to our employees, executive
officers and directors through various equity compensation plans including our
employee equity, stock option, stock purchase and restricted stock
plans.
The fair
value of stock option and stock purchase equity awards is measured at the date
of grant using a Black-Scholes option pricing model and the fair value of
restricted stock awards is based on the market price of our common stock on the
date of grant. The fair value of these awards is recognized on a straight-line
basis over the vesting period. The cash awards to be paid in connection with
retention arrangements with each of our executive officers (approved by the
Compensation Committee of our Board of Directors in November 2008) is considered
a share-based payment award and measured at fair value since the award is
indexed to the price of our common stock. The fair value of these cash awards is
measured each reporting period and is calculated using the Monte Carlo valuation
method.
The
compensation expense for share-based awards is based on awards that are expected
to vest and is reduced for estimated forfeitures. We apply an annual forfeiture
rate that is determined based on historical forfeiture activity. Our estimated
forfeiture rate is evaluated each reporting period and, taking into
consideration all available evidence both before and after the reporting date,
we make appropriate adjustments. This forfeiture rate represents the awards
expected to be forfeited each year and results in the recognition of share-based
compensation expense over the vesting period for those awards that vest. For
fiscal 2010, 2009 and 2008, forfeiture rates of 6.5 percent, 7.7 percent and 6.2
percent, respectively, were applied for share-based compensation expense related
to employee stock options (excluding officers).
Page 50
of 98
Share-based
compensation expense included in operating results for fiscal 2010, 2009 and
2008 is presented in the following table:
|
(In
Millions, Except Per Share Amounts)
|
2010
|
2009
|
2008
|
||||||||
|
Cost
of sales:
|
|||||||||||
|
Gross
compensation
|
$
|
9.8
|
$
|
15.5
|
$
|
19.8
|
|||||
|
Capitalized
in inventory during the period
|
(7.8
|
)
|
(13.0
|
)
|
(16.0
|
)
|
|||||
|
Realized
from inventory during the period
|
8.3
|
13.5
|
16.3
|
||||||||
|
10.3
|
16.0
|
20.1
|
|||||||||
|
Research
and development
|
17.8
|
24.3
|
27.3
|
||||||||
|
Selling,
general and administrative
|
45.7
|
30.6
|
42.3
|
||||||||
|
Total
share-based compensation included in income before taxes
|
73.8
|
70.9
|
89.7
|
||||||||
|
Income
tax benefit
|
(23.5
|
)
|
(21.0
|
)
|
(26.7
|
)
|
|||||
|
Total
share-based compensation, net of tax, included in net
income
|
$
|
50.3
|
$
|
49.9
|
$
|
63.0
|
|||||
|
Share-based
compensation effects on earnings per share:
|
|||||||||||
|
Basic
|
$
|
0.21
|
$
|
0.22
|
$
|
0.25
|
|||||
|
Diluted
|
$
|
0.21
|
$
|
0.21
|
$
|
0.24
|
|||||
|
Share-based
compensation capitalized in inventory
|
$
|
1.0
|
$
|
1.5
|
$
|
2.0
|
|||||
|
Total
gross share-based compensation
|
$
|
73.3
|
$
|
70.4
|
$
|
89.4
|
|||||
The fair
value of share-based awards to employees in connection with equity compensation
plans was estimated using a Black-Scholes option pricing model that used the
following weighted-average assumptions:
|
2010
|
2009
|
2008
|
|||||||
|
Stock
Option Plan:
|
|||||||||
|
Expected
life (in years)
|
3.8
|
3.7
|
4.1
|
||||||
|
Expected
volatility
|
45
|
%
|
45
|
%
|
33
|
%
|
|||
|
Risk-free
interest rate
|
1.9
|
%
|
2.4
|
%
|
4.6
|
%
|
|||
|
Dividend
yield
|
2.3
|
%
|
1.4
|
%
|
0.6
|
%
|
|||
|
Stock
Purchase Plan:
|
|||||||||
|
Expected
life (in years)
|
0.8
|
0.7
|
0.7
|
||||||
|
Expected
volatility
|
42
|
%
|
39
|
%
|
35
|
%
|
|||
|
Risk-free
interest rate
|
0.3
|
%
|
1.8
|
%
|
3.5
|
%
|
|||
|
Dividend
yield
|
2.3
|
%
|
1.4
|
%
|
0.8
|
%
|
|||
The
weighted-average fair value of stock options granted during fiscal 2010, 2009
and 2008 was $4.01, $5.83 and $8.49 per share, respectively. The
weighted-average fair value of rights granted under the stock purchase plans was
$4.06, $5.05 and $6.78 per share for fiscal 2010, 2009 and 2008,
respectively.
Page 51
of 98
The fair
value of cash awards in connection with the executive officer retention
arrangements was estimated using the Monte Carlo valuation method that used the
following weighted-average assumptions as of May 30, 2010 and May 31,
2009:
|
2010
|
2009
|
|||||||||||||||
|
Executive
Officer Retention Awards:
|
||||||||||||||||
|
Closing
stock price
|
$
|
14.05
|
$
|
13.88
|
||||||||||||
|
Remaining
term (in years)
|
0.5
|
1.5
|
||||||||||||||
|
Expected
volatility
|
32
|
%
|
60
|
%
|
||||||||||||
|
Risk-free
interest rate
|
0.2
|
%
|
0.9
|
%
|
||||||||||||
|
Dividend
yield
|
2.3
|
%
|
2.0
|
%
|
||||||||||||
For all
options granted after December 31, 2007, we determine expected life based on
historical stock option exercise experience for the last four years, adjusted
for our expectation of future exercise activity. For options granted prior to
January 1, 2008, we use the simplified method specified by SEC’s Staff
Accounting Bulletin (SAB) No. 107 to determine the expected life of stock
options. The expected volatility is based on implied volatility, as management
has determined that implied volatility better reflects the market’s expectation
of future volatility than historical volatility, and is determined based on our
traded options, which are actively traded on several exchanges. We derive the
implied volatility using the closing prices of traded options during a period
that closely matches the timing of the option grant for the stock option and
stock purchase plans, and on the last day of the quarter for the cash awards
under the executive officer retention arrangements. The traded options selected
for our measurement for the stock option and stock purchase plans are
near-the-money and close to the exercise price of the option grants and have
terms ranging from one to two years. The traded options selected for our
measurement of the cash awards under the executive officer retention
arrangements are near-the-money and at the closing price of our common stock on
the last day of the quarter and have similar remaining terms (in years). The
risk-free interest rate is based upon interest rates that match the expected
life of the outstanding options under our employee stock option plans, the
expected life of the purchase rights under our employee stock purchase plan and
the retention period under the executive officer retention arrangements, as
applicable. The dividend yield is based on recent history and our expectation of
dividend payouts.
Under our
equity compensation plans, employees who retire from the company and meet
certain conditions set forth in the plans and related stock option grant
agreements continue to vest in their stock options after retirement. During that
post-retirement period of continued vesting, no service is required of the
employee. Prior to fiscal 2007, we historically recognized compensation costs of
these options using the nominal vesting period approach for pro forma reporting
purposes. The FASB guidance specifies that a stock option award is considered to
be vested when the employee’s retention of the option is no longer contingent on
the obligation to provide continuous service (the “non-substantive vesting
period approach”). Under the non-substantive vesting period approach, the
compensation cost should be recognized immediately for options granted to
employees who are eligible for retirement at the time the option is granted. If
an employee is not currently eligible for retirement, but is expected to become
eligible during the nominal vesting period, then the compensation expense for
the option should be recognized over the period from the grant date to the date
retirement eligibility occurs. Beginning in fiscal 2007, we changed the method
for recognizing the compensation cost for these options to the non-substantive
vesting period approach for those options that were granted beginning in fiscal
2007. If we had used the non-substantive vesting period approach in calculating
the amounts for unvested option grants prior to fiscal 2007, the pre-tax
share-based compensation expense would have been lower by $1.3 million in fiscal
2010, $6.8 million in fiscal 2009 and $14.2 million in fiscal 2008.
Use
of Estimates in Preparation of Financial Statements
The
preparation of financial statements in conformity with accounting principles
generally accepted in the United States of America requires us to make estimates
and assumptions that affect the reported amounts of assets and liabilities and
the disclosure of contingent liabilities at the date of the financial statements
and the reported amounts of revenues and expenses during the reporting period.
Actual results could differ from those estimates.
Page 52
of 98
Reclassifications
Certain
amounts in the consolidated financial statements and notes to consolidated
financial statements for prior years have been reclassified to conform to the
fiscal 2010 presentation. Net operating results have not been affected by these
reclassifications.
Note
2. Fair Value Measurements
We
measure and report our financial assets and liabilities under the provisions of
ASC Topic 820, “Fair Value Measurements and Disclosures,” which we adopted in
fiscal 2009. Effective at the beginning of fiscal 2010, we adopted the FASB
authoritative guidance for non-financial assets and non-financial liabilities.
The adoption for non-financial assets and non-financial liabilities had no
significant effect on either our financial position or results of operations.
Our non-financial assets subject to fair value measurements include goodwill,
amortizable intangible assets, and property, plant and equipment, which are
measured and recorded at fair value in the period they are determined to be
impaired. As permitted under the FASB guidance, we did not apply its provisions
to non-financial assets and non-financial liabilities prior to fiscal
2010.
We
measure fair value to record our cash equivalents, derivative financial
instruments and the deferred compensation plan assets. The measurement of fair
value for our long-term debt is used to provide disclosure and is not used to
record the carrying value of our long-term debt.
Fair
value is defined as the price that would be received to sell an asset or paid to
transfer a liability in an orderly transaction between market participants at
the measurement date. A fair value measurement assumes that the transaction to
sell the asset or transfer the liability occurs in the principal market for the
asset or liability.
The FASB
guidance establishes a fair value hierarchy that prioritizes the inputs to
valuation techniques used to measure fair value. The hierarchy gives the highest
priority to unadjusted quoted prices in active markets for identical assets or
liabilities (level 1 measurements) and the lowest priority to unobservable
inputs (level 3 measurements). The three levels of the fair value hierarchy are
described below:
|
·
|
Level 1. Valuations
based on quoted prices in active markets for identical assets or
liabilities that an entity has the ability to access.
Level
1 assets and liabilities include our investments in institutional
money-market funds that are classified as cash equivalents and the
investment funds of the deferred compensation plan assets, where the
respective financial instruments are traded in an active market with
sufficient volume and frequency of activity.
|
|
·
|
Level 2. Valuations
based on quoted prices for similar assets or liabilities, quoted prices
for identical assets or liabilities in markets that are not active, or
other inputs that are observable or can be corroborated by observable data
for substantially the full term of the assets or liabilities.
Level
2 assets and liabilities include our investments in commercial paper that
are classified as cash equivalents, derivative financial instruments and
our senior notes that represent long-term debt instruments that are less
actively traded in the market, but where quoted market prices exist for
similar instruments that are actively traded.
|
|
·
|
Level 3. Valuations
based on inputs that are supported by little or no market activity and
that are significant to the fair value of the assets or
liabilities.
Level
3 assets and liabilities include goodwill, amortizable intangible assets,
and property, plant and equipment, which are measured at fair value using
a discounted cash flow approach when they are determined to be impaired,
and our unsecured term loan with a bank, where we determine fair value
based on unobservable inputs using the best information available in the
circumstances and take into consideration assumptions that market
participants would use in pricing the liability.
|
Page 53
of 98
Assets
measured at fair value on a recurring basis include the following:
|
(In
Millions)
|
Quoted
Prices in Active Markets for Identical Instruments
(Level
1)
|
Significant
Other Observable Inputs
(Level
2)
|
Total
|
||||||
|
Balances
at May 30, 2010:
|
|||||||||
|
Cash
and cash equivalents:
|
|||||||||
|
Institutional
money-market funds
|
$
|
216.6
|
$
|
-
|
$
|
216.6
|
|||
|
Commercial
paper
|
-
|
79.9
|
79.9
|
||||||
|
216.6
|
79.9
|
296.5
|
|||||||
|
Other
current assets:
|
|||||||||
|
Derivative
assets - Forward contracts
|
-
|
0.6
|
0.6
|
||||||
|
Other
assets:
|
|||||||||
|
Investment
funds - Deferred compensation plan assets:
|
|||||||||
|
Institutional
money-market funds
|
6.9
|
-
|
6.9
|
||||||
|
Mutual
funds
|
32.6
|
-
|
32.6
|
||||||
|
Marketable
equity securities
|
0.8
|
-
|
0.8
|
||||||
|
40.3
|
-
|
40.3
|
|||||||
|
Derivative
assets - Interest rate swap
|
-
|
1.6
|
1.6
|
||||||
|
Total
assets measured at fair value
|
$
|
256.9
|
$
|
82.1
|
$
|
339.0
|
|||
|
Balances
at May 31, 2009:
|
|||||||||
|
Cash
and cash equivalents:
|
|||||||||
|
Institutional
money-market funds
|
$
|
368.4
|
$
|
-
|
$
|
368.4
|
|||
|
Other
assets:
|
|||||||||
|
Investment
funds - Deferred compensation plan assets:
|
|||||||||
|
Institutional
money-market funds
|
10.2
|
-
|
10.2
|
||||||
|
Mutual
funds
|
30.1
|
-
|
30.1
|
||||||
|
Marketable
equity securities
|
0.6
|
-
|
0.6
|
||||||
|
40.9
|
-
|
40.9
|
|||||||
|
Total
assets measured at fair value
|
$
|
409.3
|
$
|
-
|
$
|
409.3
|
|||
There
were no transfers between level 1 and level 2 financial assets in fiscal 2010
and 2009.
The
institutional money-market funds and the various investment funds within our
deferred compensation plan assets are traded in an active market and the net
asset value of each fund on the last day of the quarter is used to determine its
fair value. We determine fair value of our commercial paper by obtaining
non-binding market prices from our broker on the last day of each quarter. We
then corroborate these market prices by comparison to quoted market prices for
similar instruments. The fair value of forward foreign currency exchange
contracts represents the present value difference between the stated forward
contract rate and the current market forward rate at settlement. The fair value
of foreign currency option contracts represents the probable weighted net amount
we would expect to receive at maturity. The fair value of the interest rate swap
is determined using a standard valuation model that includes significant
observable inputs, such as interest rate yield curves and discount rates
commensurate with the six-month LIBOR interest rates, as well as the
creditworthiness of the counterparties and our own nonperformance
risk.
The fair
value of our long-term debt (including the current portion) at May 30, 2010 was
$1,339.2 million and at May 31, 2009 was $1,201.2 million. The fair value
measurements for our long-term debt instruments take into consideration credit
rating changes, equity price movements, interest rate changes and other economic
variables.
Page 54
of 98
Note
3. Financial Instruments
Cash
Equivalents
Our
policy is to diversify our investment portfolio to minimize the exposure of our
principal to credit, geographic and investment sector risk. At May 30, 2010,
investments were placed with a variety of different financial institutions and
other issuers. Investments with maturity of one year or less have a rating of
A1/P1 or better.
Our cash
equivalents consisted of the following as of May 30, 2010 and May 31,
2009:
|
(In
Millions)
|
2010
|
2009
|
||||
|
CASH
EQUIVALENTS
|
||||||
|
Available-for-sale
securities:
|
||||||
|
Institutional
money market funds
|
$
|
216.6
|
$
|
368.4
|
||
|
Commercial
paper
|
79.9
|
-
|
||||
|
296.5
|
368.4
|
|||||
|
Held-to-maturity
securities:
|
||||||
|
Bank
time deposits
|
530.0
|
187.6
|
||||
|
Total
cash equivalents
|
$
|
826.5
|
$
|
556.0
|
Although
our non-marketable investments had no carrying value at May 30, 2010 and May 31,
2009, we still hold stock in certain non-publicly traded companies. As a result,
we recognized gross realized gains of $0.3 million in fiscal 2010, $0.4 million
in fiscal 2009 and $0.2 million in fiscal 2008 from certain of our
non-marketable investments.
Derivative
Financial Instruments
The
objective of our foreign exchange risk management policy is to preserve the U.S.
dollar value of after-tax cash inflow in relation to non-U.S. dollar currency
movements. We are exposed to foreign currency exchange rate risk that is
inherent in orders, sales, cost of sales, expenses, and assets and liabilities
denominated in currencies other than the U.S. dollar. We enter into foreign
exchange contracts, primarily forwards and purchased options, to hedge against
exposure to changes in foreign currency exchange rates. These contracts are
matched at inception to the related foreign currency exposures that are being
hedged. Exposures which are hedged include sales by subsidiaries, and assets and
liabilities denominated in currencies other than the U.S. dollar. Our foreign
currency hedges typically mature within six months.
Derivative
instruments used to hedge exposures to variability in expected future foreign
denominated cash flows are not designated as cash flow hedges. Gains or losses
on these derivative instruments are immediately recorded in
earnings.
In
connection with the issuance of the $250 million principal amount of senior
unsecured notes in April 2010, we entered into an interest rate swap agreement
with a notional principal of $250 million which effectively converts the fixed
interest rate of the debt to a floating interest rate. The terms of the swap
agreement substantially match the terms of the debt. Under the terms of the swap
agreement, we will receive interest payments semi-annually at an annual rate of
3.95 percent on the notional principal and we will pay interest semi-annually at
an annual rate of 0.84 percent over the six-month LIBOR on the notional
principal. The LIBOR reference rate is set in arrears on each semi-annual date
when the interest payments are due. We have designated this swap agreement as a
fair value hedge and recognize the changes in the fair value of both the swap
and the related debt, which we record as gains or losses on the derivative
instrument in fair value hedge included in other non-operating income (expense),
net.
Page 55
of 98
The
following table provides information about gains (losses) associated with our
derivative financial instruments:
|
Location
of Gains (Losses) Recognized in Income on Derivative
|
Amount
of Gains (Losses) Recognized in Income on Derivative
|
Location
of Gains (losses) Recognized in Income on Hedged Item
|
Amount
of Gains (Losses) Recognized in Income on Hedged Item
|
|||||||||||||
|
(In
Millions)
|
2010
|
2009
|
2008
|
2010
|
||||||||||||
|
Fair
value hedge:
|
||||||||||||||||
|
Interest rate swap
|
Other
non-operating income (expense), net
|
$
|
1.6
|
$
|
-
|
$
|
-
|
Other
non-operating income (expense), net
|
$
|
(3.8
|
)
|
|||||
|
$
|
1.6
|
$
|
-
|
$
|
-
|
$
|
(3.8
|
)
|
||||||||
|
Instruments
without hedge accounting designation:
|
||||||||||||||||
|
Forward
contracts
|
Selling,
general and administrative
|
$
|
0.1
|
$
|
2.4
|
$
|
-
|
|||||||||
|
Purchased
options
|
Selling,
general and administrative
|
(0.1
|
)
|
(0.2
|
)
|
(0.6
|
)
|
|||||||||
|
$
|
-
|
$
|
2.2
|
$
|
(0.6
|
)
|
||||||||||
Fair Value and
Notional Principal of Derivative Financial Instruments
The
notional principal amounts for derivative financial instruments provide one
measure of the transaction volume outstanding as of fiscal year-end and do not
represent the amount of the exposure to credit or market loss. The estimates of
fair value are based on applicable and commonly used pricing models using
prevailing financial market information at May 30, 2010. The table below shows
the fair value and notional principal of derivative financial instruments at May
30, 2010.
|
(In
Millions)
|
Balance
Sheet Location
|
Notional
Principal
|
Fair
Value
|
||||||
|
2010
|
|||||||||
|
Fair
value hedge:
|
|||||||||
|
Interest
rate swap
|
Other
assets
|
$
|
250.0
|
$
|
1.6
|
||||
|
Instruments
without hedge accounting designation:
|
|||||||||
|
Forward
contracts
|
Other
current assets
|
20.0
|
0.6
|
||||||
|
Total
|
$
|
270.0
|
$
|
2.2
|
|||||
All of
the foreign exchange contracts that we entered into during fiscal 2009 expired
by May 31, 2009.
Concentrations
of Credit Risk
Financial
instruments that may subject us to concentrations of credit risk are primarily
investments and trade receivables. Our investment policy requires cash
investments to be placed with high-credit quality counterparties and limits the
amount of investments with any one financial institution or direct issuer. We
sell our products to distributors and manufacturers involved in a variety of
industries including computers and peripherals, wireless communications and
automotive. We perform continuing credit evaluations of our customers whenever
necessary and we generally do not require collateral. Our top ten customers combined
represented approximately 58 percent of total accounts receivable at May 30,
2010 and approximately 60 percent of total accounts receivable at May 31,
2009.
Page 56
of 98
Net sales
to major customers as a percentage of total net sales were as
follows:
|
2010
|
2009
|
2008
|
|||||||
|
Distributor:
|
|||||||||
|
Avnet
|
17%
|
15%
|
15%
|
||||||
|
Arrow
|
15%
|
13%
|
12%
|
||||||
|
OEM:
|
|||||||||
|
Nokia
|
*
|
*
|
11%
|
||||||
*
less than 10%
Sales to
the distributors included above are mostly for our Analog segment products, but
also include some sales for our other operating segment products. Historically,
we have not experienced significant losses related to receivables from
individual customers or groups of customers in any particular industry or
geographic area.
Note
4. Consolidated Financial Statement Details
|
Consolidated
Balance Sheets
(In
Millions)
|
2010
|
2009
|
|||||
|
RECEIVABLE
ALLOWANCES
|
|||||||
|
Doubtful
accounts
|
$
|
0.4
|
$
|
1.1
|
|||
|
Returns
and allowances
|
29.6
|
17.6
|
|||||
|
Total
receivable allowances
|
$
|
30.0
|
$
|
18.7
|
|||
|
INVENTORIES
|
|||||||
|
Raw
materials
|
$
|
9.5
|
$
|
5.0
|
|||
|
Work
in process
|
67.8
|
81.6
|
|||||
|
Finished
goods
|
41.3
|
48.0
|
|||||
|
Total
inventories
|
$
|
118.6
|
$
|
134.6
|
|||
|
OTHER
CURRENT ASSETS
|
|||||||
|
Prepaid
income taxes
|
$
|
90.0
|
$
|
71.1
|
|||
|
Prepaid
expenses
|
19.8
|
31.2
|
|||||
|
Assets
held for sale
|
45.8
|
5.4
|
|||||
|
Other
|
1.2
|
0.3
|
|||||
|
Total
current assets
|
$
|
156.8
|
$
|
108.0
|
|||
|
PROPERTY,
PLANT AND EQUIPMENT
|
|||||||
|
Land
|
$
|
21.1
|
$
|
29.7
|
|||
|
Buildings
and improvements
|
398.3
|
536.4
|
|||||
|
Machinery
and equipment
|
1,679.4
|
1,825.4
|
|||||
|
Internal-use
software
|
81.5
|
83.1
|
|||||
|
Construction
in progress
|
18.7
|
30.7
|
|||||
|
Total
property, plant and equipment
|
2,199.0
|
2,505.3
|
|||||
|
Less
accumulated depreciation and amortization
|
(1,808.9
|
)
|
(2,043.5
|
)
|
|||
|
Total
property, plant and equipment, net
|
$
|
390.1
|
$
|
461.8
|
|||
|
OTHER
ASSETS
|
|||||||
|
Deposits
|
$
|
2.4
|
$
|
7.1
|
|||
|
Debt
issuance costs
|
5.8
|
8.2
|
|||||
|
Income
tax receivable
|
41.7
|
35.2
|
|||||
|
Deferred
compensation plan assets
|
40.3
|
40.9
|
|||||
|
Other
|
12.0
|
9.9
|
|||||
|
Total
other assets
|
$
|
102.2
|
$
|
101.3
|
Page 57
of 98
|
Consolidated
Balance Sheets
(In
Millions)
|
2010
|
2009
|
|||||
|
ACCRUED
EXPENSES
|
|||||||
|
Payroll
and employee related
|
$
|
127.3
|
$
|
39.5
|
|||
|
Accrued
interest payable
|
24.6
|
24.9
|
|||||
|
Severance
and restructuring expenses
|
15.4
|
44.4
|
|||||
|
Other
|
37.2
|
35.8
|
|||||
|
Total
accrued expenses
|
$
|
204.5
|
$
|
144.6
|
|||
|
OTHER
NON-CURRENT LIABILITIES
|
|||||||
|
Accrued
pension cost
|
$
|
67.3
|
$
|
52.7
|
|||
|
Deferred
compensation plan liability
|
40.3
|
40.9
|
|||||
|
Other
|
16.6
|
27.1
|
|||||
|
Total
other non-current liabilities
|
$
|
124.2
|
$
|
120.7
|
|||
|
ACCUMULATED
OTHER COMPREHENSIVE LOSS
|
|||||||
|
Defined
benefit pension plans
|
$
|
(131.9
|
)
|
$
|
(123.5
|
)
|
|
|
Other
|
(0.3
|
)
|
(0.2
|
)
|
|||
|
Total
accumulated other comprehensive loss
|
$
|
(132.2
|
)
|
$
|
(123.7
|
)
|
|
Consolidated
Statements of Income
|
|||||||||
|
(In
Millions)
|
2010
|
2009
|
2008
|
||||||
|
OTHER
OPERATING INCOME, NET
|
|||||||||
|
Net
intellectual property income
|
$
|
(0.3
|
)
|
$
|
(2.7
|
)
|
$
|
(0.6
|
)
|
|
Gain
on sale of manufacturing plant assets
|
-
|
-
|
(3.1
|
)
|
|||||
|
Litigation
settlement
|
(0.3
|
)
|
-
|
3.3
|
|||||
|
Other
|
0.2
|
-
|
-
|
||||||
|
Total
other operating income, net
|
$
|
(0.4
|
)
|
$
|
(2.7
|
)
|
$
|
(0.4
|
)
|
|
OTHER
NON-OPERATING INCOME (EXPENSE), NET
|
|||||||||
|
Net
(loss) gain on marketable and other investments, net:
|
|||||||||
|
Trading
securities:
|
|||||||||
|
Change
in unrealized holding gains/losses, net
|
$
|
5.3
|
$
|
(7.7
|
)
|
$
|
(6.2
|
)
|
|
|
Non-marketable
investments:
|
|||||||||
|
Gain
from sale
|
-
|
0.4
|
0.2
|
||||||
|
Gain
from liquidation of investment
|
0.3
|
-
|
-
|
||||||
|
Total
net gain (loss) on marketable and other investments, net
|
5.6
|
(7.3
|
)
|
(6.0
|
)
|
||||
|
Loss
on extinguishment of debt
|
(2.1
|
)
|
-
|
-
|
|||||
|
Net
loss on derivative instrument in fair value hedge
|
(2.2
|
)
|
-
|
-
|
|||||
|
Charitable
contribution
|
-
|
-
|
(0.2
|
)
|
|||||
|
Total
other non-operating income (expense), net
|
$
|
1.3
|
$
|
(7.3
|
)
|
$
|
(6.2
|
)
|
|
Page 58
of 98
Note
5. Supplemental Disclosure of Cash Flow Information and Non-Cash Investing and
Financing Activities
|
(In
Millions)
|
2010
|
2009
|
2008
|
||||||
|
SUPPLEMENTAL
DISCLOSURE OF CASH FLOW INFORMATION
|
|||||||||
|
Cash
paid for:
|
|||||||||
|
Interest
|
$
|
59.3
|
$
|
70.8
|
$
|
58.5
|
|||
|
Income
taxes
|
$
|
83.3
|
$
|
24.3
|
$
|
117.3
|
|||
|
SUPPLEMENTAL
SCHEDULE OF NON-CASH INVESTING AND FINANCING ACTIVITIES
|
|||||||||
|
Cancellation
of shares withheld for taxes on restricted stock and performance share
unit awards
|
$
|
2.0
|
$
|
0.4
|
$
|
14.6
|
|||
|
Acquisition
of software under license obligations, net
|
$
|
-
|
$
|
3.3
|
$
|
-
|
|||
|
Reduction
in goodwill to recognize acquired tax asset
|
$
|
-
|
$
|
-
|
$
|
3.1
|
|||
|
Deposit
applied to purchase equipment
|
$
|
15.0
|
$
|
-
|
$
|
-
|
|||
Note 6. Cost Reduction Programs and
Restructuring of Operations
Fiscal
2010
We
recorded a net charge of $20.1 million for severance and restructuring expenses
in fiscal 2010. The following table provides additional detail related to these
expenses:
|
(In
Millions)
|
Analog
Segment
|
All
Others
|
Total
|
|||||||
|
May
2010 business realignment:
|
||||||||||
|
Severance
|
$
|
1.1
|
$
|
0.6
|
$
|
1.7
|
||||
|
March
2009 workforce reduction and plant closures:
|
||||||||||
|
Other
exit-related costs
|
-
|
28.7
|
$
|
28.7
|
||||||
|
Severance
|
-
|
0.5
|
0.5
|
|||||||
|
Gain
on sale of equipment
|
-
|
(1.3
|
)
|
(1.3
|
)
|
|||||
|
Other
equipment gain, net
|
-
|
(1.2
|
)
|
(1.2
|
)
|
|||||
|
Release
of reserves:
|
||||||||||
|
Severance
|
(0.4
|
)
|
(4.8
|
)
|
(5.2
|
)
|
||||
|
(0.4
|
)
|
21.9
|
21.5
|
|||||||
|
November
2008 workforce reduction:
|
||||||||||
|
Release
of reserves:
|
||||||||||
|
Severance
|
(0.2
|
)
|
(2.8
|
)
|
(3.0
|
)
|
||||
|
Fiscal
2008 workforce reduction and manufacturing restructure:
|
||||||||||
|
Release
of reserves:
|
||||||||||
|
Other
exit-related costs
|
-
|
(0.1
|
)
|
(0.1
|
)
|
|||||
|
Total
severance and restructuring expenses, net
|
$
|
0.5
|
$
|
19.6
|
$
|
20.1
|
||||
We
recorded a charge of $1.7 million for severance payments to employees who were
terminated in connection with exit activities as part of the realignment of
certain product line business units announced in May 2010. These exit activities
are expected to be completed by the end of calendar 2010 and total cumulative
charges are expected to be approximately $3 million to $4 million.
In
connection with the workforce reduction and plant closures announced in March
2009 (See the discussion under fiscal 2009), we recorded a net charge of $21.5
million in fiscal 2010 for additional severance and restructuring expenses that
were partially offset by the equipment gains described below. The restructuring
expenses include $28.7 million of other exit-related costs associated with
closure and transfer activities that occurred at our manufacturing sites in
Texas and China during fiscal 2010.
Page 59
of 98
By the
second half of fiscal 2010, the global economy began to slowly recover as
revenue prospects have improved significantly. An increasing portion of our
revenues has been coming from a portfolio of products that are primarily
manufactured in our wafer fabrication facility in Greenock, Scotland. Management
believes there is a larger market with a longer life for these products than was
previously assumed and has decided to increase its manufacturing capacity in
Scotland. Certain equipment previously classified as held for sale, primarily
the Texas equipment, will now be used in our manufacturing facility in Scotland.
We recognized an impairment charge of $23.0 million related to this equipment in
March 2009. The carrying value of this equipment has been adjusted based on the
lower of its carrying value before being classified as held for sale (adjusted
for any depreciation that would have been recognized had it been continuously
classified as held and used), or its fair value at the time management decided
the equipment would no longer be sold. Since the date we first classified this
equipment as held for sale to the date we reclassified it as held and used, the
fair value of this equipment has increased. As a result, we recorded a gain of
$1.2 million to restore the carrying value of the equipment to fair value which
was lower than what its carrying value would have been had it been continuously
classified as held and used. The weighted average remaining life of this
equipment at the time we classified it as held for sale was 7.8 years and now
that it has been reclassified as held and used, its weighted-average remaining
life is 7.3 years. We also recorded a gain of $1.3 million upon completing the
sale of some of the equipment in China and Texas during fiscal 2010. In
addition, we recorded a recovery of $5.2 million due to adjustments to reduce
accrued severance expenses for manufacturing employees who voluntarily
terminated prior to their scheduled departure dates and for severance packages
that were finalized with certain employees in foreign locations.
Since
these net charges relate to actions announced in fiscal 2009, total cumulative
net charges (including the net charges incurred in fiscal 2010 and 2009) through
May 30, 2010 for these actions are presented in the following
table:
|
(In
Millions)
|
Analog
Segment
|
All
Others
|
Total
|
||||||
|
March
2009 workforce reduction and plant closures:
|
|||||||||
|
Severance
|
$
|
14.0
|
$
|
46.2
|
$
|
60.2
|
|||
|
Other
exit-related costs
|
-
|
32.0
|
32.0
|
||||||
|
Impairment
of property, plant and equipment
|
-
|
54.3
|
54.3
|
||||||
|
Gain
on sale of equipment
|
-
|
(1.3
|
)
|
(1.3
|
)
|
||||
|
Other
equipment gain, net
|
-
|
(1.2
|
)
|
(1.2
|
)
|
||||
|
Release
of reserves:
|
|||||||||
|
Severance
|
(0.4
|
)
|
(4.8
|
)
|
(5.2
|
)
|
|||
|
Total
cumulative severance and restructuring expenses for the
|
|||||||||
|
March
2009 workforce reduction and plant closures
|
$
|
13.6
|
$
|
125.2
|
$
|
138.8
|
|||
We have
ceased production activity in both China (end of August 2009) and Texas (end of
fiscal 2010). Remaining activities associated with the closures of the China and
Texas manufacturing facilities are expected to continue over the next 2
quarters. We expect to incur approximately $11 million to $16 million over the
same period for other exit-related costs associated with these remaining
activities. As a result, total charges for all actions announced in March 2009
are expected to be approximately $150 million to $155 million. Most of this
amount will be reported within our corporate group, which is not considered an
operating segment, and will be included in the category described as “All
Others.”
Since
production activity ceased in China by the end of August 2009, we have been
actively engaged in locating buyers to purchase the manufacturing facility and
its existing machinery and equipment in its current condition. In addition,
certain equipment that was no longer being used in our Texas manufacturing
operations is expected to be sold. As a result, the China plant assets and the
Texas equipment, which had a carrying value of $22.4 million after impairment
charges, were classified as held for sale at the end of our first quarter of
fiscal 2010. As discussed above, some of the equipment in China and Texas, which
had a carrying value of $1.6 million, was sold during fiscal 2010. Equipment
previously classified as held for sale that will now be used in our
manufacturing facility in Scotland had a carrying value of $3.8 million. By the
end of the fiscal year, we ceased production activity in Texas and we are also
actively engaged in locating buyers to purchase the manufacturing facility and
its existing machinery and equipment in its current condition. The Texas
facility and its manufacturing machinery and equipment that had been used
through the end of production activity have a carrying value of $28.8 million.
As a result, all of the China and Texas plant assets, which have a total
carrying value of $45.8 million, have been classified as held for sale and are
reported in other current assets in the consolidated balance sheet as
of
Page 60
of 98
May 30,
2010. We have ceased depreciation on these assets and now measure the carrying
value at the lower of historical net book value or fair value (less cost to
sell).
The
fiscal 2010 net charge for severance and restructuring expenses described above
includes a recovery of $3.0 million for an adjustment to reduce accrued
severance expenses upon finalizing severance packages with certain terminated
employees in foreign locations in connection with the workforce reduction
announced in November 2008. It also includes a recovery of $0.1 million recorded
upon the release of a residual accrued balance for other exit-related costs
associated with the fiscal 2008 manufacturing restructure.
Fiscal
2009
We
recorded a net charge of $143.9 million for severance and restructuring expenses
in fiscal 2009. The following table provides additional detail related to these
expenses:
|
(In
Millions)
|
Analog
Segment
|
All
Others
|
Total
|
||||||
|
March
2009 workforce reduction and plant closures:
|
|||||||||
|
Severance
|
$
|
14.0
|
$
|
45.7
|
$
|
59.7
|
|||
|
Impairment
of equipment and other assets
|
-
|
54.3
|
54.3
|
||||||
|
Other
exit-related costs
|
-
|
3.3
|
3.3
|
||||||
|
14.0
|
103.3
|
117.3
|
|||||||
|
November
2008 workforce reduction:
|
|||||||||
|
Severance
|
9.8
|
15.7
|
25.5
|
||||||
|
Impairment
of equipment
|
0.7
|
0.1
|
0.8
|
||||||
|
Other
exit-related costs
|
0.1
|
-
|
0.1
|
||||||
|
10.6
|
15.8
|
26.4
|
|||||||
|
Fiscal
2008 workforce reduction and manufacturing restructure:
|
|||||||||
|
Other
exit-related costs
|
-
|
2.2
|
2.2
|
||||||
|
Gain
on sale of equipment
|
-
|
(0.5
|
)
|
(0.5
|
)
|
||||
|
Release
of reserves:
|
|||||||||
|
Severance
|
(1.1
|
)
|
(0.3
|
)
|
(1.4
|
)
|
|||
|
(1.1
|
)
|
1.4
|
0.3
|
||||||
|
Release
of reserves related to other prior actions:
|
|||||||||
|
Other
exit-related costs
|
-
|
(0.1
|
)
|
(0.1
|
)
|
||||
|
Total
severance and restructuring expenses
|
$
|
23.5
|
$
|
120.4
|
$
|
143.9
|
|||
In March
2009, we announced that we would take actions to reduce overall expenses in
response to weak economic conditions and related business levels. As part of the
plan, we eliminated approximately 850 positions worldwide in our product lines,
sales and marketing, manufacturing and support functions. The majority of the
affected employees departed by the end of fiscal 2009. We also planned to
further reduce headcount by approximately 875 through the eventual closure of
our wafer fabrication facility in Arlington, Texas and our assembly and test
plant in Suzhou, China. The departure of these additional employees coincides
with the phased timing of the plant closures. As a result of these actions, we
recorded $117.3 million in fiscal 2009, which includes severance costs of $59.7
million, asset impairment charges of $54.3 million and other exit-related costs
of $3.3 million associated with closure and transfer activities incurred in
fiscal 2009. Included in the asset impairment charges is $9.8 million related to
the modification of a CAD software license that reduced the volume of licenses
available for use by the company.
In
November 2008, we announced a global workforce reduction that eliminated
approximately 330 positions in response to the uncertain business climate at
that time. These positions were primarily in non-manufacturing functions in our
product line, marketing and sales, and general administrative operations. In
addition to the workforce reduction, we closed two design centers located in the
United States. As a result of this action, we recorded severance and
restructuring expenses of $26.4 million in fiscal 2009, which represents the
total amount expected to be incurred. This amount includes severance costs of
$25.5 million, other exit-related costs of $0.1 million and $0.8 million for the
impairment of abandoned equipment.
Page 61
of 98
In
addition to the actions described above, we recorded a net charge of $0.3
million related to the workforce reduction and manufacturing restructure
announced in fiscal 2008. All activities related to these actions have now been
completed. This amount includes a $2.2 million charge for other exit-related
costs primarily incurred in connection with dismantling and removing equipment.
This charge was partially offset by a recovery of $1.9 million, which includes
$1.4 million primarily due to an adjustment to reduce accrued severance expenses
upon finalizing severance packages with certain terminated employees in foreign
locations and a gain of $0.5 million from the subsequent sale of some of the
equipment that had been previously written down.
Fiscal
2008
We
recorded a net charge of $27.2 million for severance and restructuring expenses
in fiscal 2008. The following table provides additional detail related to these
expenses:
|
(In
Millions)
|
Analog
Segment
|
All
Others
|
Total
|
||||||
|
Workforce
reduction:
|
|||||||||
|
Severance
|
$
|
6.5
|
$
|
3.1
|
$
|
9.6
|
|||
|
Manufacturing
restructure:
|
|||||||||
|
Severance
|
-
|
13.2
|
13.2
|
||||||
|
Other
exit-related costs
|
-
|
3.2
|
3.2
|
||||||
|
Impairment
of equipment
|
-
|
4.5
|
4.5
|
||||||
|
Gain
from sale of equipment
|
-
|
(1.8
|
)
|
(1.8
|
)
|
||||
|
-
|
19.1
|
19.1
|
|||||||
|
Release
of reserves:
|
|||||||||
|
Other
exit-related costs
|
-
|
(1.5
|
)
|
(1.5
|
)
|
||||
|
Total
severance and restructuring expenses
|
$
|
6.5
|
$
|
20.7
|
$
|
27.2
|
|||
In April
2008, we announced a workforce reduction that eliminated approximately 128
positions across the company, primarily in product line and support functions as
part of our effort to strategically align resources in connection with our focus
on accelerating revenue growth in key market areas that require better power
management and energy efficiency. As a result of this action, we recorded a
charge of $9.6 million for severance.
In
January 2008, we announced that we would dispose of certain manufacturing
equipment and reduce the workforce at our wafer fabrication facilities as part
of an action to modernize our facilities and rationalize our capacity.
Substantially all activities related to this action were completed by the end of
calendar 2008. In connection with this action, we eliminated approximately 200
positions, primarily at our manufacturing plants located in Arlington, Texas;
South Portland, Maine; and Greenock, Scotland. As a result, we recorded a total
charge of $19.1 million. Of this amount, $13.2 million was for severance and
$3.2 million was other exit-related costs for dismantling and removing
equipment. This amount also included $4.5 million for the impairment of
equipment. These charges were partially offset by a $1.8 million gain recognized
upon the subsequent sale of some of the equipment.
In June
2007, we entered into an agreement with the landlord of a facility we vacated as
part of a previous cost reduction action. The agreement terminated the lease and
we settled the remaining obligations under the lease agreement for $4.2 million.
As a result, we recorded a $1.5 million recovery for the release of the residual
accrued balance of the lease obligation.
In June
2007, we completed the sale of our assembly and test plant in Singapore that was
closed in fiscal 2007. The facility and its residual equipment were sold for
$12.0 million to an unrelated third party. The carrying value of the assets sold
was $7.6 million. As a result, we recorded a gain of $3.1 million in fiscal
2008, after deducting final transaction costs of $1.3 million. These assets were
part of our manufacturing operation, which is not considered an operating
segment, but is a corporate group included in the category described as “All
Others.”
Page 62
of 98
Summary
of Activities
The
following table provides a summary of the activities related to our severance
and restructuring costs included in accrued expenses during fiscal 2010, 2009
and 2008:
|
(In
Millions)
|
Fiscal
2010 Business Unit Realignment
|
Fiscal
2009
Workforce
Reduction
and
Plant Closures
|
Cost
Reduction and Restructuring Actions
In
Prior Years
|
Total
|
||||||||||||||||||
|
Severance
|
Severance
|
Other
Exit-Related Costs
|
Severance
|
Other
Exit-Related Costs
|
||||||||||||||||||
|
Balance
at May 27, 2007
|
$
|
0.5
|
$
|
6.2
|
$
|
6.7
|
||||||||||||||||
|
Cost
reduction charges
|
22.8
|
3.2
|
26.0
|
|||||||||||||||||||
|
Cash
payments
|
(8.8
|
)
|
(7.1
|
)
|
(15.9
|
)
|
||||||||||||||||
|
Release
of residual reserves
|
-
|
(1.5
|
)
|
(1.5
|
)
|
|||||||||||||||||
|
Balance
at May 25, 2008
|
14.5
|
0.8
|
15.3
|
|||||||||||||||||||
|
Cost
reduction charges
|
$
|
85.2
|
$
|
3.4
|
-
|
2.2
|
90.8
|
|||||||||||||||
|
Cash
payments
|
(42.3
|
)
|
(2.2
|
)
|
(13.0
|
)
|
(2.7
|
)
|
(60.2
|
)
|
||||||||||||
|
Release
of residual reserves
|
-
|
-
|
(1.4
|
)
|
(0.1
|
)
|
(1.5
|
)
|
||||||||||||||
|
Balance
at May 31, 2009
|
42.9
|
1.2
|
0.1
|
0.2
|
44.4
|
|||||||||||||||||
|
Cost
reduction charges
|
$
|
1.7
|
0.5
|
28.7
|
-
|
-
|
30.9
|
|||||||||||||||
|
Cash
payments
|
(22.7
|
)
|
(29.3
|
)
|
(0.2
|
)
|
(0.1
|
)
|
(52.3
|
)
|
||||||||||||
|
Exchange
rate adjustment
|
0.6
|
-
|
0.1
|
-
|
0.7
|
|||||||||||||||||
|
Release
of residual reserves
|
(8.2
|
)
|
-
|
-
|
(0.1
|
)
|
(8.3
|
)
|
||||||||||||||
|
Balance
at May 30, 2010
|
$
|
1.7
|
$
|
13.1
|
$
|
0.6
|
$
|
-
|
$
|
-
|
$
|
15.4
|
||||||||||
During
fiscal 2010 we paid severance to 564 employees in connection with the workforce
reductions announced in fiscal 2009. Payments for other exit-related costs were
primarily for expenses associated with closure and transfer activities incurred
in connection with the closures of our manufacturing facilities in Texas and
China.
The balances at May 30, 2010 primarily
represent remaining estimated costs for activities that have occurred, but have
yet to be paid, as a result of the workforce reduction and the manufacturing
plant closures announced in fiscal 2009. Payments for the remaining $13.1
million of severance balances are expected to be paid over the next 3 quarters
as we complete the closures of our two manufacturing facilities and most of
those affected employees will depart by the end of our fiscal 2011 first
quarter. Severance amounts are generally paid 30-60 days after the employee’s
actual departure date or may be deferred until the beginning of the calendar
year after their departure date. Other exit-related costs primarily relate to
expenses associated with closure and transfer activities occurring in these
manufacturing locations.
Page 63
of 98
Note
7. Acquisition
Fiscal
2010
In
October 2009, we acquired Energy Recommerce Inc. (ERI), a privately held solar
energy company that provides web-based monitoring of commercial photovoltaic
systems performance. The acquisition of ERI expands our portfolio of power
management technologies.
Beginning
in fiscal 2010, we adopted ASC Topic 805, “Business Combinations,” which changed
the accounting for business combinations. The acquisition of ERI was accounted
for under the new guidance using the acquisition method of accounting with a
purchase price of $6.1 million for all of the outstanding shares of the
company’s common stock. The purchase price was allocated as
follows:
|
(In
Millions)
|
Total
|
||
|
Net
assets
|
$
|
0.2
|
|
|
Acquired
developed technology
|
0.8
|
||
|
Other
intangible assets
|
1.1
|
||
|
Goodwill
|
4.6
|
||
|
Deferred
tax liability
|
(0.6
|
)
|
|
|
Total
|
$
|
6.1
|
|
Goodwill
is included in our Analog segment and primarily represents the expected value of
future customers and future technologies that have yet to be determined. Future
customers and technologies do not meet the criteria for recognition separately
from goodwill, because they are part of the future development and growth of the
business. No amount of goodwill is expected to be deductible for tax
purposes.
Revenue
and earnings of ERI since the acquisition date included in our operating results
for fiscal 2010 were immaterial. Pro forma results of operations related to this
acquisition have not been presented since ERI’s operating results up to the date
of acquisition were immaterial to our consolidated financial
statements.
Fiscal
2009
In March
2009, we acquired ActSolar, Inc. (“ActSolar”), a privately-held solar energy
company that provides power optimization solutions for commercial and
utility-scale solar installations. The acquisition of ActSolar was intended to
expand our portfolio of power optimization technologies and provide us with new
diagnostics and panel monitoring capabilities for solar arrays. The acquisition
was accounted for using the purchase method of accounting with a purchase price
of $4.8 million for all of the outstanding shares of the company’s common stock.
As a result, we recorded a $2.9 million in-process R&D charge in fiscal
2009. In-process R&D was expensed upon acquisition because technological
feasibility had not been established and no future alternative uses exist. The
remainder of the purchase price was allocated as follows:
|
(In
Millions)
|
Total
|
||
|
Net
liabilities
|
$
|
(0.5
|
)
|
|
Other
intangible assets
|
1.4
|
||
|
Goodwill
|
1.0
|
||
|
Total
|
$
|
1.9
|
|
Pro forma
results of operations related to this acquisition have not been presented since
ActSolar’s operating results up to the date of acquisition were immaterial to
our consolidated financial statements.
Page 64
of 98
Note
8. Goodwill and Intangible Assets
Goodwill
The
following table presents goodwill by reportable segments:
|
(In
Millions)
|
Analog
Segment
|
All
Others
|
Total
|
||||||||
|
Balances
at May 25, 2008
|
$
|
60.5
|
$
|
-
|
$
|
60.5
|
|||||
|
Reorganization
of reporting units
|
(7.3
|
)
|
7.3
|
-
|
|||||||
|
Acquisition
of ActSolar
|
1.0
|
-
|
1.0
|
||||||||
|
Balances
at May 31, 2009
|
54.2
|
7.3
|
61.5
|
||||||||
|
Acquisition
of ERI
|
4.6
|
-
|
4.6
|
||||||||
|
Balances
at May 30, 2010
|
$
|
58.8
|
$
|
7.3
|
$
|
66.1
|
|||||
In fiscal
2010, we recorded $4.6 million of goodwill in connection with the acquisition of
ERI (see Note 7 to the Consolidated Financial Statements).
In fiscal
2009, one of our reporting units containing goodwill that was previously
included in the Analog segment was reorganized into a reporting unit that is
included in the category of “All Others.” We recorded $1.0 million of goodwill
in connection with the acquisition of ActSolar in fiscal 2009 (see Note 7 to the
Consolidated Financial Statements).
We have
intangible assets of $2.9 million at May 30, 2010 and $1.4 million at May 31,
2009, which are included in other assets in the consolidated balance sheet.
These intangible assets primarily include developed technology and other
amortizable intangible assets with a weighted-average amortization period of 6.7
years. Amortization expense was $0.4 million in fiscal 2010 and $0.1 million in
fiscal 2009. There was no amortization expense in fiscal 2008.
Note
9. Asset Retirement Obligations
Our asset
retirement obligations arise primarily from contractual commitments to
decontaminate machinery and equipment used at our manufacturing facilities at
the time we dispose of or replace them. We also have leased facilities where we
have asset retirement obligations from contractual commitments to remove
leasehold improvements and return the property to a specified condition when the
lease terminates.
We have
not recognized any asset retirement obligations associated with the closure or
abandonment of the manufacturing facilities we own. Our legal asset retirement
obligations for manufacturing facilities arise primarily from local laws and
statutes that establish minimum standards or requirements in the event a
manufacturing facility is shut down, or otherwise exited or abandoned. As a
result, we considered the timing and (or) method of settlement for a conditional
asset retirement obligation in the measurement of the related liability and
determined that the asset retirement obligations related to these facilities
were immaterial to our financial condition and results of
operations.
The
following table presents the activity for the asset retirement obligations
included in other non-current liabilities for the years ended May 30, 2010 and
May 31, 2009:
|
(In
Millions)
|
|||
|
Balance
at May 25, 2008
|
$
|
3.5
|
|
|
Accretion
expense
|
0.4
|
||
|
Balance
at May 31, 2009
|
3.9
|
||
|
Liability
settled
|
(0.5
|
)
|
|
|
Accretion
expense
|
1.1
|
||
|
Balance
at May 30, 2010
|
$
|
4.5
|
|
Page 65
of 98
Note
10. Debt
Debt at
fiscal year-end consisted of the following:
|
(In
Millions)
|
2010
|
2009
|
||||
|
Senior
floating rate notes due 2010, 0.51% at May 30, 2010
|
$
|
250.0
|
$
|
250.0
|
||
|
Senior
notes due 2012 at 6.15%
|
375.0
|
375.0
|
||||
|
Senior
notes due 2015 at 3.95%
|
250.0
|
-
|
||||
|
Senior
notes due 2017 at 6.60%
|
375.0
|
375.0
|
||||
|
Bank
floating rate unsecured term loan
|
-
|
265.6
|
||||
|
Unsecured
promissory note at 2.50%
|
26.5
|
24.3
|
||||
|
1,276.5
|
1,289.9
|
|||||
|
Less
net unamortized discount
|
(2.8
|
)
|
-
|
|||
|
Add
fair value adjustment*
|
3.8
|
-
|
||||
|
1,277.5
|
1,289.9
|
|||||
|
Less
current portion of long-term debt
|
276.5
|
62.5
|
||||
|
Long-term
debt
|
$
|
1,001.0
|
$
|
1,227.4
|
||
*The
fixed-rate debt obligation that is hedged is reflected in the consolidated
balance sheet as an amount equal to the sum of the debt’s carrying value plus a
fair value adjustment for the change in the fair value of the hedged debt
obligation.
In April
2010, we issued $250.0 million principal amount of senior unsecured notes
through a public offering. The unsecured notes bear interest at a fixed rate of
3.95 percent and are due in April 2015. Interest is payable semi-annually and
the notes are redeemable by us at any time.
In April
2010, we repaid in full the outstanding principal on our unsecured term loan
with a consortium of banks prior to its original maturity of June 2012. There
was no prepayment penalty fee associated with the early repayment of the loan.
The repayment resulted in a cash outlay of $203.6 million which included the
aggregate principal amount outstanding and accrued interest through the
repayment date. We recorded a $2.1 million loss on extinguishment of debt to
recognize the remaining unamortized issuance costs that were included in other
assets.
In June
2007, we issued $1.0 billion principal amount of senior unsecured notes through
a public offering. The offering of unsecured notes included $250.0 million
aggregate principal amount of senior floating rate notes due June 2010, $375.0
million aggregate principal amount of 6.15 percent senior notes due June 2012
and $375.0 million aggregate principal amount of 6.60 percent senior notes due
June 2017. Interest on the senior fixed rate notes is payable semi-annually and
the notes are redeemable by us at any time. In June 2010, we repaid in full the
$250.0 million principal amount of senior floating rate notes that became due
June 2010. The total amount of the repayment was $250.3 million which included
the aggregate principal amount outstanding and accrued interest through the
repayment date.
The
unsecured promissory note, which is denominated in Japanese yen (2,408,750,000),
is due November 2010. Interest is payable quarterly at a fixed 2.5 percent
annual rate. We are also required to comply with the covenants set forth under
our multi-currency agreement.
The
aggregate annual maturities of long-term debt at May 30, 2010 are presented in
the following table:
|
Fiscal
year:
|
(In
Millions)
|
||
|
2011
|
$
|
276.5
|
|
|
2012
|
-
|
||
|
2013
|
375.0
|
||
|
2014
|
-
|
||
|
2015
|
251.0
|
||
|
2016
and thereafter
|
375.0
|
||
|
$
|
1,277.5
|
||
Page 66
of 98
The
estimated fair value of long-term debt was $1,339.2 million at May 30,
2010.
We have a
$20 million multicurrency credit agreement with a bank that provides for
multicurrency loans, letters of credit and standby letters of credit that was
renewed in October 2009. At May 30, 2010, we had committed $3.4 million of the
credit available under the agreement. The agreement contains restrictive
covenants, conditions and default provisions that require the maintenance of
certain financial ratios. As of May 30, 2010, we were in compliance with all
financial covenants under the agreement. The agreement expires in October 2010
and we expect to renew it before then.
Note
11. Income Taxes
Worldwide
pretax income from operations and income taxes consist of the
following:
|
(In
Millions)
|
2010
|
2009
|
2008
|
|||||||
|
INCOME
BEFORE INCOME TAXES
|
||||||||||
|
U.S.
|
$
|
166.0
|
$
|
71.8
|
$
|
337.1
|
||||
|
Non-U.S.
|
102.6
|
41.8
|
114.1
|
|||||||
|
$
|
268.6
|
$
|
113.6
|
$
|
451.2
|
|||||
|
INCOME
TAX EXPENSE (BENEFIT)
|
||||||||||
|
Current:
|
||||||||||
|
U.S.
federal, state and local
|
$
|
41.1
|
$
|
17.8
|
$
|
103.6
|
||||
|
Non-U.S.
|
5.4
|
1.3
|
10.2
|
|||||||
|
46.5
|
19.1
|
113.8
|
||||||||
|
Deferred:
|
||||||||||
|
U.S.
federal and state
|
13.9
|
(3.0
|
)
|
16.4
|
||||||
|
Non-U.S.
|
(1.0
|
)
|
24.2
|
(11.3
|
)
|
|||||
|
12.9
|
21.2
|
5.1
|
||||||||
|
Income
tax expense
|
$
|
59.4
|
$
|
40.3
|
$
|
118.9
|
Although
the fiscal 2010 income tax expense of $59.4 million is higher than the fiscal
2009 income tax expense of $40.3 million, our effective tax rate is lower in
fiscal 2010 than in fiscal 2009. The fiscal 2010 income tax expense includes a
tax benefit of $7.4 million primarily arising from the repatriation of
previously unremitted Japanese earnings. In addition, a portion of our earnings
comes from our Malaysian subsidiary and is not taxable because of a tax holiday
granted by the Malaysian government that is effective for a ten-year period that
began in our fiscal 2010. The fiscal 2009 income tax expense of $40.3
million included incremental tax expense of $16.7 million related to the write
down of foreign deferred tax assets that would no longer be realized in the
foreseeable future due to the tax holiday granted by the Malaysian government.
The effect of the write down of foreign deferred tax assets was partially offset
by $15.0 million of tax benefits associated with R&D tax credits, net of the
portion of the tax benefit that did not meet the more-likely-than-not
recognition threshold. Income tax expense of $118.9 million for fiscal 2008
included $31.9 million in tax benefits recognized during fiscal 2008 that arose
primarily from the resolution of international tax inquiries, the expiration of
the statute of limitations associated with international tax matters and costs
related to the manufacturing restructure and workforce reduction
actions.
At the
beginning of fiscal 2008, we adopted the provisions of ASC Topic 740, “Income
Taxes,” which provided further clarification on the accounting for uncertainty
in income taxes recognized in the financial statements. The cumulative effect of
applying the new accounting standards was a $37.1 million increase to retained
earnings at the beginning of fiscal 2008. Historically, we have classified
unrecognized tax benefits as current income taxes payable. We now classify
unrecognized tax benefits as long-term income taxes payable except to the extent
we anticipate cash payment within the next year.
Page 67
of 98
The
following table provides a summary of the changes in the amount of unrecognized
tax benefits that are included in long-term income taxes payable on the
consolidated balance sheet at May 30, 2010:
|
(In
Millions)
|
|||
|
Balance
at the beginning of fiscal 2009
|
$
|
132.6
|
|
|
Settlements
and effective settlements with tax authorities
|
(0.1
|
)
|
|
|
Lapse
of applicable statute of limitations
|
(5.1
|
)
|
|
|
Increases
for tax positions in the current year
|
13.5
|
||
|
Other
changes in unrecognized tax benefits
|
5.3
|
||
|
Balance
at May 31, 2009
|
146.2
|
||
|
Settlements
and effective settlements with tax authorities
|
(4.0
|
)
|
|
|
Lapse
of applicable statute of limitations
|
(3.6
|
)
|
|
|
Increases
for tax positions in the current year
|
13.8
|
||
|
Other
changes in unrecognized tax benefits
|
4.2
|
||
|
Balance
at May 30, 2010
|
$
|
156.6
|
|
At May
30, 2010, $156.6 million of the unrecognized tax benefit would affect our
effective tax rate if it were to be recognized in a future period. Interest and
penalties related to unrecognized tax benefits are included within income tax
expense. The amount of interest and penalties accrued was $18.7 million at May
30, 2010 and $16.4 million at May 31, 2009.
We are
required to file income tax returns in the U.S. federal jurisdiction, various
state and local jurisdictions, and many foreign jurisdictions. A number of years
may elapse before an uncertain tax position is audited and ultimately resolved.
While it is often difficult to predict the final outcome or the exact timing of
resolution for any particular uncertain tax position, we believe that the
amounts of unrecognized tax benefits we have accrued reflect our best estimate.
We adjust these amounts, as well as the related interest and penalties, as
actual facts and circumstances change. Upon resolution of an uncertain tax
position, we record an adjustment to income taxes in the same
period.
We
believe that it is reasonably possible that the unrecognized tax benefits mainly
related to transfer pricing matters for tax years where the statutes of
limitation expire during fiscal 2011 could decrease by as much as $3.9 million
within the next year.
Our federal tax returns for fiscal
2007 through 2009 are currently under examination by the IRS. In addition, the
IRS will audit our amended federal tax returns for fiscal 2005 and 2006. Several
state taxing jurisdictions are examining our state tax returns for fiscal 2001
through 2005. During fiscal 2010, the state of California closed its audits of
fiscal years up through fiscal 2000, which resulted in an immaterial adjustment.
With a few exceptions, state tax returns for fiscal 2000 and after remain
subject to future examination by state tax authorities. Internationally, tax
authorities from several foreign jurisdictions are also examining our tax
returns. In general, our international tax returns for fiscal 2003 and after
remain subject to examination.
Page 68
of 98
The tax
effects of temporary differences that constitute significant portions of the
deferred tax assets are presented below:
|
(In
Millions)
|
2010
|
2009
|
||||
|
DEFERRED
TAX ASSETS
|
||||||
|
Inventories
|
$
|
3.2
|
$
|
5.0
|
||
|
Equity
investments
|
1.0
|
0.2
|
||||
|
Property,
plant and equipment and intangible assets
|
3.8
|
9.9
|
||||
|
Accrued
liabilities
|
51.4
|
57.6
|
||||
|
Research
and development expenditures
|
73.7
|
94.6
|
||||
|
Deferred
compensation
|
18.3
|
14.3
|
||||
|
Share-based
compensation
|
72.7
|
59.3
|
||||
|
Non-U.S.
loss carryovers and other allowances
|
103.4
|
93.7
|
||||
|
Federal
and state credit carryovers
|
86.2
|
85.4
|
||||
|
Other
|
0.8
|
0.9
|
||||
|
Gross
deferred tax assets
|
414.5
|
420.9
|
||||
|
Valuation
allowance
|
(98.7
|
)
|
(96.8
|
)
|
||
|
Total
deferred tax assets
|
$
|
315.8
|
$
|
324.1
|
||
The
decrease in net deferred tax assets for fiscal 2010 of $8.3 million is from
continuing operations and from the tax effect on other comprehensive income
items.
We record
a valuation allowance to reflect the estimated amount of deferred tax assets
that may not be realized. The valuation allowance has been established primarily
against the reinvestment and investment tax allowances related to our operation
in Malaysia, as we have concluded that the deferred tax assets will not be
realized in the foreseeable future due to a tax holiday granted by the Malaysian
government that is effective for a ten-year period that began in our fiscal 2010
and the uncertainty of sufficient taxable income in Malaysia beyond fiscal 2019.
We have a deferred tax asset related to the California R&D credits which can
be carried forward indefinitely and we have concluded that a valuation allowance
is not required against it since our estimate of future taxable income for
California purposes in the long term (greater than 15 years) is considered more
than sufficient to realize the deferred tax asset during the same time period.
The valuation allowance for deferred tax assets increased by $1.9 million in
fiscal 2010 compared to an increase of $15.6 million in fiscal
2009.
The
ultimate realization of deferred tax assets depends upon the generation of
future taxable income during the periods in which those temporary differences
become deductible. As of May 30, 2010, based on historical taxable income and
projections for future taxable income over the periods that the deferred tax
assets are deductible, we believe it is more likely than not that we will
realize the benefits of these deductible differences, net of the valuation
allowance.
The
reconciliation between the income tax rate computed by applying the U.S. federal
statutory rate and the reported worldwide tax rate follows:
|
2010
|
2009
|
2008
|
||||||
|
U.S.
federal statutory tax rate
|
35.0
|
%
|
35.0
|
%
|
35.0
|
%
|
||
|
Non-U.S.
income taxed at different rates
|
(13.8
|
)
|
0.6
|
(3.0
|
)
|
|||
|
U.S.
state and local taxes net of federal benefits
|
1.6
|
(0.7
|
)
|
0.9
|
||||
|
Changes
in beginning of year valuation allowances
|
(0.5
|
)
|
5.8
|
(1.9
|
)
|
|||
|
Domestic
manufacturing benefit
|
(1.2
|
)
|
(2.8
|
)
|
(1.3
|
)
|
||
|
Tax
credits
|
(2.2
|
)
|
(5.7
|
)
|
(1.1
|
)
|
||
|
Other
|
3.2
|
3.3
|
(2.2
|
)
|
||||
|
Effective
tax rate
|
22.1
|
%
|
35.5
|
%
|
26.4
|
%
|
||
No U.S.
income taxes have been provided on the cumulative unremitted earnings of
approximately $108.5 million from non-U.S. subsidiaries as of May 30, 2010. It
is not practicable to determine the U.S. income tax liability that would
be
Page 69
of 98
payable
if such earnings was not reinvested indefinitely. We intend to continue
reinvesting certain foreign earnings from non-U.S. subsidiaries
indefinitely.
At May
30, 2010, we had $11.9 million of state net operating loss carryovers, which
expire between fiscal 2011 and 2022. We also had $125.1 million of state credit
carryovers, consisting primarily of California R&D credits of $124.8 million
which can be carried forward indefinitely. In addition, we had net operating
losses and other tax allowance carryovers of $432.0 million from certain
non-U.S. jurisdictions, most of which do not expire.
Note
12. Retirement and Pension Plans
The
annual expense for all retirement and pension plans was as follows:
|
(In
Millions)
|
2010
|
2009
|
2008
|
|||||||
|
Salary
deferral 401(k) plan
|
$
|
13.3
|
$
|
16.5
|
$
|
17.2
|
||||
|
Non-U.S.
pension and retirement plans
|
$
|
16.5
|
$
|
10.1
|
$
|
12.7
|
||||
U.S.
Plans
Our
retirement and savings program for U.S. employees consists of a salary deferral
401(k) plan. The salary deferral 401(k) plan allows employees to defer up to 30
percent of their salaries, subject to certain limitations, with partially
matching company contributions. To encourage employee participation, we make a
matching contribution of 150 percent of the employee’s contribution to the
401(k) plan, up to the first 4 percent of the employee’s eligible salary.
Contributions are invested in one or more of thirty investment funds at the
discretion of the employee. One of the investment funds is a stock fund in which
contributions are invested in National common stock at the discretion of the
employee. 401(k) investments made by the employee in National common stock may
be sold at any time at the employee’s direction. Although we have reserved
10,000,000 shares of common stock for issuance to the stock fund, shares
purchased to date with contributions have been purchased on the open market and
we have not issued any stock directly to the stock fund.
We also
have a deferred compensation plan, which allows highly compensated employees (as
defined by IRS regulations) to defer greater percentages of compensation than
would otherwise be permitted under the salary deferral 401(k) plan and IRS
regulations. The deferred compensation plan is a non-qualified plan of deferred
compensation maintained in a rabbi trust. Participants can direct the investment
of their deferred compensation plan accounts in the same investment funds
offered by the 401(k) plan.
International
Plans
Certain
of our international subsidiaries have varying types of defined benefit pension
and retirement plans that comply with local statutes and practices.
We
maintain defined benefit pension plans in the U.K., Germany and Taiwan that
cover all eligible employees within each respective country. Prior to August
2007, we also had a defined benefit pension plan in Japan, which was terminated
in full and replaced by a defined contribution plan in August 2007. As a result,
we incurred a total charge of $0.2 million for the curtailment and settlement of
the defined benefit pension plan.
Pension
plan benefits are based primarily on participants’ compensation and years of
service credited as specified under the terms of each country’s plan. The
funding policy is consistent with the local requirements of each country. We may
also voluntarily fund additional annual contributions as determined by
management.
Beginning
in fiscal 2009, we adopted the provisions of ASC Topic 715,
“Compensation-Retirement Benefits,” that requires the measurement date of a
plan’s funded status to be the same as the company’s fiscal year-end. As a
result, the measurement date of February 28th for
one of our plans was changed to May 31st. In
lieu of remeasuring plan assets and benefit obligations as of the beginning of
fiscal 2009 and using those new measurements to determine the effect of the
measurement date change, we used the alternative approach permitted by GAAP.
Under the alternative approach, the measurement of plan assets and benefit
obligations determined as of February 28, 2008 were used to estimate the effect
of the measurement date change. As a result, the net periodic pension cost for
the 15-month period from February 28, 2008 to May 31, 2009 was allocated
proportionately between amounts to be recognized as an adjustment of retained
earnings for the portion of the 15-month period in fiscal 2008 and net periodic
pension cost for the remaining portion in fiscal 2009. As
Page 70
of 98
a result,
we recorded an adjustment of $0.6 million to retained earnings representing the
effect of the change in measurement date for this plan.
Plan
assets of the funded defined benefit pension plans are invested in funds held by
third-party fund managers or are deposited into government-managed accounts in
which we are not actively involved with and have no control over investment
strategy. Two of the plans are self-funded plans. The plan assets held by
third-parties consist primarily of U.S. and foreign equity securities, bonds and
cash. The fund manager monitors the fund’s asset allocation within the
guidelines established by the plan’s Board of Trustees. In line with plan
investment objectives and consultation with company management, the Trustees set
an allocation benchmark among equity, bond and other assets based on the
relative weighting of overall international market indices. The overall
investment objectives of the plan are 1) the acquisition of suitable assets of
appropriate liquidity which will generate income and capital growth to meet
current and future plan benefits, 2) to limit the risk of the assets failing to
meet the long term liabilities of the plan and 3) to minimize the long term
costs of the plan by maximizing the return on the assets. Performance is
regularly evaluated by the Trustees and is based on actual returns achieved by
the fund manager relative to its benchmark. The expected long-term rate of
return for plan assets is based on analysis of historical data and future
expectations relevant to the investments and consistency with the assumed rate
of inflation implicit in the market.
The
following table presents target allocation percentages and the fiscal year end
percentage for each major category of plan assets:
|
2010
|
2009
|
|||||||
|
Asset
Category
|
Target
Allocation
|
Actual
Allocation
|
Target
Allocation
|
Actual
Allocation
|
||||
|
Equities
|
68
|
%
|
59
|
%
|
62
|
%
|
42
|
%
|
|
Bonds
|
23
|
%
|
26
|
%
|
25
|
%
|
25
|
%
|
|
Cash
|
0
|
%
|
8
|
%
|
5
|
%
|
26
|
%
|
|
Other
|
9
|
%
|
7
|
%
|
8
|
%
|
7
|
%
|
|
Total
|
100
|
%
|
100
|
%
|
100
|
%
|
100
|
%
|
The following table presents the fair
value of plan assets by major categories using the same three-level hierarchy
described in Note 2:
|
(In
Millions)
|
Quoted
Prices
in
Active Markets for Identical Instruments
(Level
1)
|
Significant
Other Observable Inputs
(Level
2)
|
Unobservable
Inputs
(Level
3)
|
Total
|
||||||||
|
Cash
and cash equivalents
|
$
|
16.8
|
$
|
-
|
$
|
-
|
$
|
16.8
|
||||
|
Equities:
|
||||||||||||
|
Global
equity securities
|
0.7
|
113.9
|
-
|
114.6
|
||||||||
|
Insurance
contracts
|
-
|
-
|
12.5
|
12.5
|
||||||||
|
Fixed
income bonds
|
9.6
|
46.5
|
-
|
56.1
|
||||||||
|
Other
|
1.3
|
15.3
|
-
|
16.6
|
||||||||
|
Total
assets measured at fair value
|
$
|
28.4
|
$
|
175.7
|
$
|
12.5
|
$
|
216.6
|
||||
For all of our plans the discount rates
represent the rates at which benefits could have been settled at the measurement
date and were determined based on an analysis of the investment returns
underlying annuity contracts, or alternatively the rates of return currently
available on high quality fixed interest investments for liability durations
that match the timing and amount of the expected benefit payments. The source
data used to determine the discount rates for the U.K. and Germany plans are
based on the published iBoxx index of AA bond yields for durations of over 15
years. The yields at the plans’ measurement dates were approximately 5.25 to
5.46 percent. While no formal liability cash flow projections were made for
these plans, the mean term of their liabilities was determined for assessing
appropriate bond durations. Our plan in Taiwan is not material.
Page 71
of 98
Net
annual periodic pension cost of these non-U.S. defined benefit pension plans is
presented in the following table:
|
(In
Millions)
|
2010
|
2009
|
2008
|
|||||||||
|
Service
cost of benefits earned during the year
|
$
|
2.8
|
$
|
3.2
|
$
|
5.1
|
||||||
|
Plan
participant contributions
|
(0.8
|
)
|
(0.8
|
)
|
(1.1
|
)
|
||||||
|
Interest
cost on projected benefit obligation
|
15.5
|
15.0
|
15.9
|
|||||||||
|
Expected
return on plan assets
|
(13.3
|
)
|
(16.8
|
)
|
(19.7
|
)
|
||||||
|
Net
amortization and deferral
|
5.4
|
2.9
|
5.5
|
|||||||||
|
Net
periodic pension cost
|
9.6
|
3.5
|
5.7
|
|||||||||
|
Plan
settlement
|
-
|
-
|
0.2
|
|||||||||
|
Total
net periodic pension cost
|
$
|
9.6
|
$
|
3.5
|
$
|
5.9
|
||||||
Changes
in the benefit obligations and plans assets are presented in the following
table:
|
(In
Millions)
|
2010
|
2009
|
|||||||
|
PROJECTED
BENEFIT OBLIGATION
|
|||||||||
|
Beginning
balance
|
$
|
252.5
|
$
|
291.2
|
|||||
|
Service
cost
|
2.8
|
3.6
|
|||||||
|
Interest
cost
|
15.5
|
18.7
|
|||||||
|
Benefits
paid
|
(6.7
|
)
|
(8.5
|
)
|
|||||
|
Actuarial
gain
|
53.8
|
(1.7
|
)
|
||||||
|
Exchange
rate adjustment
|
(34.0
|
)
|
(50.8
|
)
|
|||||
|
Ending
balance
|
$
|
283.9
|
$
|
252.5
|
|||||
|
PLAN
ASSETS AT FAIR VALUE
|
|||||||||
|
Beginning
balance
|
$
|
199.8
|
$
|
272.3
|
|||||
|
Actual
return on plan assets
|
41.9
|
(39.8
|
)
|
||||||
|
Company
contributions
|
6.8
|
20.5
|
|||||||
|
Plan
participant contributions
|
0.8
|
0.8
|
|||||||
|
Benefits
paid
|
(6.7
|
)
|
(8.0
|
)
|
|||||
|
Exchange
rate adjustment
|
(26.0
|
)
|
(46.0
|
)
|
|||||
|
Ending
balance
|
$
|
216.6
|
$
|
199.8
|
|||||
|
FUNDED
STATUS – BENEFIT OBLIGATION IN EXCESS OF PLAN ASSETS
|
|||||||||
|
Fiscal
year end balance
|
$
|
67.3
|
$
|
52.7
|
|||||
|
ACCUMULATED
BENEFIT OBLIGATION
|
|||||||||
|
Fiscal
year end balance
|
$
|
282.8
|
$
|
251.8
|
|||||
Page 72
of 98
Amounts
recognized in the consolidated balance sheets:
|
(In
Millions)
|
2010
|
2009
|
|||||||
|
Other
non-current liabilities
|
$
|
67.3
|
$
|
52.7
|
|||||
|
Accumulated
other comprehensive loss
|
$
|
(131.9
|
)
|
$
|
(123.5
|
)
|
|||
Amounts
in accumulated other comprehensive loss that have not yet been recognized as
components of net periodic pension cost:
|
(In
Millions)
|
2010
|
2009
|
|||||||
|
Transition
asset
|
$
|
1.1
|
$
|
1.2
|
|||||
|
Actuarial
loss
|
(133.0
|
)
|
(124.7
|
)
|
|||||
|
$
|
(131.9
|
)
|
$
|
(123.5
|
)
|
||||
The net
periodic pension cost and projected benefit obligations were determined using
the following assumptions:
|
2010
|
2009
|
2008
|
|
|
NET
PERIODIC PENSION COST
|
|||
|
Discount
rate
|
2.3%-6.5%
|
2.8%-6.2%
|
2.8%-5.2%
|
|
Rate
of increase in compensation levels
|
0.0%-3.0%
|
1.8%-3.8%
|
1.8%-3.8%
|
|
Expected
long-term return on assets
|
1.5%-7.5%
|
3.0%-7.5%
|
3.0%-7.5%
|
|
PROJECTED
BENEFIT OBLIGATIONS
|
|||
|
Discount
rate
|
2.1%-5.5%
|
2.3%-6.5%
|
2.8%-6.2%
|
|
Rate
of increase in compensation levels
|
1.0%-3.0%
|
1.0%-3.5%
|
1.8%-3.8%
|
Total
contributions paid to these plans were $6.8 million in fiscal 2010, $15.4
million in fiscal 2009 and $33.6 million in fiscal 2008. We currently expect
contributions to total approximately $5.2 million in fiscal 2011. This amount
excludes any voluntary contribution, which is yet to be determined by
management.
The
following table presents the total expected benefits to be paid to plan
participants for the next ten fiscal years as determined based on the same
assumptions used to measure the benefit obligation at the end of the fiscal
year:
|
(In
Millions)
|
||||
|
2011
|
$
|
6.3
|
||
|
2012
|
6.8
|
|||
|
2013
|
7.0
|
|||
|
2014
|
7.3
|
|||
|
2015
|
7.5
|
|||
|
2016-2020
|
45.0
|
|||
|
Total
|
$
|
79.9
|
||
Amounts
in accumulated other comprehensive loss expected to be recognized as components
of net periodic pension cost over the next fiscal year:
|
(In
Millions)
|
|||
|
Amortization
of net transition asset
|
$
|
(0.2
|
)
|
|
Amortization
of net loss
|
$
|
5.9
|
|
Page 73
of 98
Note
13. Shareholders’ Equity
Stock
Repurchase Programs
Fiscal
2010
During
fiscal 2010, we did not repurchase any shares of our common stock in connection
with the $500 million stock repurchase program we announced in June 2007. Under
this program, we have a balance of $127.4 million remaining available for future
stock repurchases at May 30, 2010. We do not have any plans to terminate the
program prior to its completion, and there is no expiration date for this
repurchase program.
Fiscal
2009
We
repurchased a total of 6.2 million shares of our common stock during fiscal 2009
for $128.4 million as part of the $500 million stock repurchase program
announced in June 2007. All of these shares were repurchased in the open market
and have been cancelled as of May 31, 2009.
Fiscal
2008
In June
2007, our Board of Directors approved (i) a $1.5 billion accelerated stock
repurchase program; and (ii) an additional $500 million stock repurchase program
similar to our existing stock repurchase program announced in March 2007. We
entered into two separate agreements with Goldman Sachs to conduct the
accelerated stock repurchase program. Under one of the agreements, we
repurchased from Goldman Sachs, for $1.0 billion, a number of shares of our
common stock determined by the volume-weighted average price of the stock during
a six month period, subject to provisions establishing minimum and maximum
numbers of shares. Under the other agreement, we repurchased shares of our
common stock from Goldman Sachs immediately for an initial amount of $500
million. Goldman Sachs purchased an equivalent number of shares of our common
stock in the open market over the next six months, and at the end of that
period, the initial price was adjusted down based on the volume-weighted average
price during the same period. The price adjustment was settled by us, at our
option, in shares of our common stock. The $1.5 billion accelerated stock
repurchase program was completed in December 2007 with a total 58.0 million
shares repurchased.
In
addition to the accelerated stock repurchase program, we repurchased an
additional 27.9 million shares of our common stock during fiscal 2008 for $623.5
million as part of two $500 million stock repurchase programs: (i) the $500
million stock repurchase program announced in March 2007, which was completed
during the third quarter of fiscal 2008, and (ii) the $500 million stock
repurchase program announced in June 2007. All of these shares were repurchased
in the open market. For all of fiscal 2008, we repurchased a total of 85.9
million shares of our common stock for $2,123.5 million through both the $1.5
billion accelerated stock repurchase program and the two $500 million stock
repurchase programs. All shares of common stock that were repurchased had been
cancelled as of the end of fiscal 2008.
Dividends
We paid
cash dividends of $75.7 million in fiscal 2010, $64.4 million in fiscal 2009 and
$50.6 million in fiscal 2008. In June 2010, the Board of Directors declared a
cash dividend of $0.08 per outstanding share of common stock, which was paid on
July 12, 2010 to shareholders of record as of the close of business on June 21,
2010. On July 12, 2010, in connection with a regularly scheduled meeting, our
Board of Directors declared a cash dividend of $0.10 per outstanding share of
common stock, which will be paid on October 12, 2010 to shareholders of record
at the close of business on September 20, 2010.
Note
14. Share-based Compensation Plans
In
September 2009, the shareholders of National approved the 2009 Incentive Award
Plan (the 2009 Plan). The 2009 Plan replaces our four former equity compensation
plans that provided share-based awards to employees and officers of the company
(the 1977 Stock Option Plan, the 2007 Employees Equity Plan (EEP), the 2005
Executive Officer Equity Plan (EOEP) and the Executive Officer Stock Option
Plan) and no further awards will be made to employees and officers under those
plans. While new options can no longer be granted, there are options that are
still outstanding under those plans. The 2009 Plan authorizes 16,000,000 shares
of our common stock for issuance to eligible individuals in the form of stock
options, restricted stock, restricted stock units, stock appreciation rights,
performance awards, dividend equivalents, stock payments, deferred stock, other
stock-based awards and performance-based awards. In addition to employees and
officers of the company, members of our Board of Directors and consultants to
the company are eligible to participate, as determined by the Compensation
Committee of the Board of Directors. As of May 30, 2010, up to 13.2 million
shares were available for future issuance of all equity awards under the 2009
Plan.
Page 74
of 98
Stock
Option Plans
The 2009
Plan provides for the grant of both nonqualified stock options and incentive
stock options (as defined in the U.S. tax code). The 2009 Plan provides for the
grant of stock options at fair market value on the date of grant. The term and
vesting period of the stock options are set by the Compensation Committee of our
Board of Directors. To date, options granted under the terms of the 2009 Plan
expire no later than six years and one day after the date of grant and vest
one-fourth of the total grant one year after grant and the rest in equal monthly
installments over the next three years. The terms of stock options granted under
the former equity compensation plans were similar to the 2009 Plan.
We have a
director stock option plan that was approved by shareholders in fiscal 1998
which authorized the grant of up to 2,000,000 shares of common stock to eligible
directors who are not employees of the company. Options were granted
automatically upon approval of the plan by shareholders and were granted
automatically to eligible directors upon their appointment to the board and
subsequent election to the board by shareholders. In connection with the
approval of amendments to the director stock plan in fiscal 2006, this plan was
frozen and no new options can be granted under the plan. Options issued to
directors under this plan vested in full after six months. Under this plan,
options to purchase 350,000 shares of common stock with a weighted-average per
share exercise price of $14.24 and weighted-average remaining contractual life
of 2.3 years were outstanding and exercisable as of May 30, 2010. The aggregate
intrinsic value of these fully vested shares was $0.7 million at May 30,
2010.
Under the
former EOEP, options to purchase 1,280,000 shares of common stock were granted
in fiscal 2010, options to purchase 565,000 shares of common stock were granted
in fiscal 2009 and options to purchase 520,000 shares of common stock were
granted in fiscal 2008. These shares are included in the amounts presented in
the table that summarizes stock option activity. Grants will no longer be made
under the EOEP.
As of May
30, 2010, under all equity compensation plans for stock options there were 44.4
million shares reserved for issuance. The following table summarizes the
activity of common stock shares related to stock options granted during fiscal
2010, 2009 and 2008 under our equity plans (excluding the director stock option
plan under which new options can no longer be granted):
|
|
Number
of Shares
(In
Millions)
|
Weighted-Average
Exercise
Price
|
||||
|
Outstanding
at May 27, 2007
|
55.2
|
$
|
18.29
|
|||
|
Granted
|
6.7
|
$
|
27.26
|
|||
|
Exercised
|
(5.9
|
)
|
$
|
12.84
|
||
|
Forfeited
|
(0.7
|
)
|
$
|
25.03
|
||
|
Expired
|
(0.8
|
)
|
$
|
28.06
|
||
|
Outstanding
at May 25, 2008
|
54.5
|
$
|
19.76
|
|||
|
Granted
|
7.9
|
$
|
18.35
|
|||
|
Exercised
|
(3.9
|
)
|
$
|
9.82
|
||
|
Forfeited
|
(2.2
|
)
|
$
|
23.40
|
||
|
Expired
|
(2.5
|
)
|
$
|
23.64
|
||
|
Outstanding
at May 31, 2009
|
53.8
|
$
|
19.95
|
|||
|
Granted
|
6.4
|
$
|
13.12
|
|||
|
Exercised
|
(4.4
|
)
|
$
|
11.42
|
||
|
Forfeited
|
(13.5
|
)
|
$
|
23.60
|
||
|
Expired
|
(11.4
|
)
|
$
|
26.69
|
||
|
Outstanding
at May 30, 2010
|
30.9
|
$
|
15.64
|
|||
Expiration
dates for options outstanding at May 30, 2010 range from June 1, 2010 to May 18,
2016.
The total
intrinsic value of options exercised was $7.9 million in fiscal 2010, $27.8
million in fiscal 2009 and $79.2 million in fiscal 2008. Total unrecognized
compensation cost related to stock option grants as of May 30, 2010 was
$21.2 million, which is expected to be recognized over a weighted-average
period of 2.6 years.
Page 75
of 98
The
following table provides additional information about total options outstanding
at May 30, 2010 under the stock option plans (excluding the director stock
option plan):
|
Number
of
Shares
(In
Millions)
|
Weighted-Average
Exercise
Price
|
Aggregate
Intrinsic
Value
(In
Millions)
|
Weighted-Average
Remaining
Contractual
Life
(In
Years)
|
||||||
|
Fully
vested and
|
|||||||||
|
expected
to vest
|
30.4
|
$15.68
|
$41.7
|
2.3
|
|||||
|
Currently
exercisable
|
21.8
|
$16.13
|
$33.0
|
1.4
|
Stock
Purchase Plan
We have
an employee stock purchase plan approved by shareholders that authorizes the
issuance of up to 16,000,000 shares to eligible employees worldwide. Our stock
purchase plan uses a captive broker and we deposit shares purchased by the
employee with the captive broker. In addition, for international participants,
the National subsidiary that the participant is employed by is responsible for
paying to us the difference between the purchase price set by the terms of the
plan and the fair market value at the time of the purchase. This plan allows
employees to purchase shares of the company’s common stock at 85 percent of the
lower of the common stock’s fair market value at the time of enrollment in one
of two six-month purchase periods in a one-year offering period or the end of
the purchase period.
Under the
terms of our stock purchase plan, we issued 1.8 million shares in fiscal 2010,
2.2 million shares in fiscal 2009 and 1.5 million shares in fiscal 2008 to
employees for $19.2 million, $24.0 million and $26.0 million,
respectively. As of May 30, 2010 there were 4.8 million shares
reserved for future issuance under the stock purchase plan.
Other
Forms of Equity Compensation
The 2009
Plan provides for the grant of restricted stock and restricted stock units that
are subject to restrictions which may be based exclusively on the passage of
time or may also include performance conditions as determined by the
Compensation Committee of our Board of Directors. Vesting for both restricted
stock and restricted stock units can begin to occur six months after grant and
the minimum full vesting period for non-performance contingent restricted shares
is three years. The minimum vesting period for any performance contingent
restricted shares is one year. Restricted stock and restricted stock units
granted under the former EEP and restricted stock plan were also subject to
restrictions based exclusively on the passage of time or included performance
conditions and have similar vesting requirements. We use restricted stock awards
as a retention vehicle for employees with technical skills and expertise that
are important to us.
Page 76
of 98
The
following table provides a summary of activity during fiscal 2010 for grants of
restricted stock not yet vested and restricted stock units under the restricted
stock plan, the EEP and the 2009 Plan (excluding units granted with performance
based restrictions):
|
Number
of Shares
(In
Millions)
|
Weighted-Average
Grant-Date
Fair Value
|
||||||
|
Outstanding
at May 27, 2007
|
0.4
|
$
|
22.62
|
||||
|
Granted/Issued
|
0.2
|
$
|
24.04
|
||||
|
Vested
|
(0.1
|
)
|
$
|
21.73
|
|||
|
Forfeited
|
-
|
$
|
28.39
|
||||
|
Outstanding
at May 25, 2008
|
0.5
|
$
|
23.21
|
||||
|
Granted/Issued
|
0.8
|
$
|
11.64
|
||||
|
Vested
|
(0.1
|
)
|
$
|
19.46
|
|||
|
Forfeited
|
(0.1
|
)
|
$
|
16.50
|
|||
|
Outstanding
at May 31, 2009
|
1.1
|
$
|
15.59
|
||||
|
Granted/Issued
|
2.1
|
$
|
13.75
|
||||
|
Vested
|
(0.1
|
)
|
$
|
24.24
|
|||
|
Forfeited
|
(0.1
|
)
|
$
|
12.70
|
|||
|
Outstanding
at May 30, 2010
|
3.0
|
$
|
13.96
|
||||
The total
fair value of restricted shares that vested in fiscal 2010, 2009 and 2008 was
$2.1 million, $1.6 million and $2.8 million, respectively. Total unrecognized
compensation cost related to non-vested restricted stock shares and restricted
stock units outstanding as of May 30, 2010 was $26.0 million, which is expected
to be recognized over a weighted-average period of 3.0 years.
We have a
director stock plan, which has been approved by shareholders, that authorizes
the issuance of up to 900,000 shares of common stock to eligible directors who
are not employees of the company. The stock is issued automatically to eligible
new directors upon their appointment to the board and to all eligible directors
on their subsequent election to the board by shareholders. Directors may also
elect to take their annual retainer fees for board membership and committee
chairmanship in stock under the plan. The shares issued to the directors under
the plan are restricted from transfer for between six and thirty-six months. As
of May 30, 2010 we had issued 796,047 shares under the director stock plan and
had reserved 103,953 shares for future issuances. Total unrecognized
compensation cost related to non-vested shares under the director stock plan as
of May 30, 2010 was $0.9 million, which is expected to be recognized over a
weighted-average period of 2.3 years. We will continue to grant awards to
members of our Board of Directors under the existing director stock plan until
all remaining authorized shares have been used. At that time, future awards will
then be granted under the 2009 Plan.
With
respect to performance share units under the EOEP, 259,374 shares were issued
upon completion in July 2009 of the third two-year performance period. Targets
for a fifth two-year performance period were established in July 2009 and will
be measured after the end of fiscal 2011. In addition, targets for a one-year
performance period were established, which will be measured after the end of
fiscal 2010, but requires a two-year vesting period. In fiscal 2009, no shares
were issued upon completion in July 2008 of the second two-year performance
period because minimum performance thresholds were not achieved and in fiscal
2008, 1,005,000 shares were issued upon completion in July 2007 of the first
performance period. Total unrecognized compensation cost related to unvested
performance share units as of May 30, 2010 was $12.4 million, which is expected
to be recognized over a weighted-average period of 1.0 years.
After the
end of fiscal 2010, the fourth two-year performance period was measured upon its
completion and since minimum performance thresholds were not achieved, no shares
were issued in July 2010. Under the 2009 Plan, targets for a sixth two-year
performance period were established in June 2010 and will be measured after the
end of fiscal 2012.
In
November 2008, the Compensation Committee of our Board of Directors approved
retention arrangements for each of our executive officers that cover the ensuing
two-year period and provide each executive officer with a cash award to be paid
on or about November 30, 2010. The amount of the cash award is based on the
average daily closing price of our common stock for the second fiscal quarter
ending November 28, 2010, which amount increases depending on
five
Page 77
of 98
specified
stock price ranges that fall between a minimum and maximum price as set forth
under each arrangement. The cash award is considered a share-based payment award
and measured at fair value since the award is indexed to the price of our common
stock. We measure compensation expense based on the estimated fair value of the
cash award at the end of each reporting period and include that amount in
share-based compensation expense. To calculate fair value, we use the Monte
Carlo valuation method which estimates the probability of the potential payouts.
The fair value of the cash award is amortized over the retention period and
recognized as a liability reported in accrued expenses in the consolidated
balance sheet as of May 30, 2010. Total unrecognized compensation cost related
to the executive officer retention awards at May 30, 2010 was $2.9 million,
which is expected to be recognized over a weighted-average period of 0.5
years.
Stock
Option Exchange Program
We
completed a stock option exchange program in November 2009. Like many companies,
we had experienced a significant decline in our stock price during calendar 2008
and 2009 as a result of the global financial and economic crisis. Our employees
held stock options with exercise prices significantly above the recent trading
prices of our common stock. The stock option exchange program offered our
employees the opportunity to surrender certain of those outstanding stock
options for cancellation in exchange for a number of restricted stock units to
be granted under the 2009 Plan having a value roughly equivalent to the value of
the options exchanged. Named executive officers and members of our Board of
Directors were not eligible to participate in the option exchange
program.
Under the
exchange program, eligible stock options with an exercise price of $17.00 and
above could be exchanged for restricted stock units at an exchange ratio that
ranged between 5 to 1 and 10 to 1 depending on the actual exercise prices of the
eligible stock options. The exchange ratios for the option exchange were
determined using the Black-Scholes option pricing model with a computation of
expected volatility based on a combination of historical and implied volatility.
We used this model to enable us to calculate exchange ratios that would result
in a fair value of the new restricted stock units to be effectively equal to the
fair value of the surrendered eligible stock options and as such, incremental
compensation expense was immaterial.
Under the
exchange program, eligible stock options to purchase an aggregate of 12,830,732
shares held by 1,713 employees were cancelled. Of this amount, eligible options
to purchase 11,988,793 shares were cancelled and exchanged for a total of
1,670,944 new restricted stock units on November 16, 2009. The aggregate fair
value of the restricted stock units was $22.7 million based on the closing price
of our common stock on the exchange date. These restricted stock units will vest
ratably each year for four years unless the exchanged stock options were fully
vested, in which case they will vest ratably each year for three years. Under
the terms of the exchange program, a cash payment was offered for the surrender
of eligible stock options for which application of the exchange ratios would
result in the issuance of less than 100 restricted stock units. Eligible options
to purchase 841,939 shares were cancelled in exchange for an aggregate $1.3
million cash payment made to employees on November 16, 2009. As a result of the
cash payments, share-based compensation expense in fiscal 2010 includes an
incremental expense of $1.7 million.
Note
15. Commitments and Contingencies
Commitments
We lease
certain facilities and equipment under operating lease arrangements. Rental
expenses under operating leases were $24.5 million, $29.8 million and $31.9
million in fiscal 2010, 2009 and 2008, respectively.
Future
minimum commitments under non-cancelable operating leases are as
follows:
|
(In
Millions)
|
|||
|
2011
|
$
|
15.0
|
|
|
2012
|
7.8
|
||
|
2013
|
5.0
|
||
|
2014
|
3.3
|
||
|
2015
|
2.4
|
||
|
2016
and thereafter
|
2.0
|
||
|
Total
|
$
|
35.5
|
|
Page 78
of 98
In
October 2009, we entered into a five-year warehouse services agreement with a
local supplier in Singapore who will provide warehousing and distribution
services for our finished products. Under the terms of the agreement, we are
committed to purchase services based on the delivery of a minimum volume of our
finished products at specified rates (depending on the volume delivered) as
determined in the agreement. The minimum purchases under the agreement are $3.1
million in each of the next 4 years (fiscal 2011 through 2014) and a remaining
$1.3 million in fiscal 2015. We purchased $3.9 million of warehouse services
under this agreement in fiscal 2010.
We have
an agreement with a local energy supplier in Maine to purchase electricity for
our manufacturing facility located there. The agreement began in January 2006
and is a five-year term full requirement contract with no minimum purchase
commitments. The agreement allows for a fixed purchase price if the annual
volume purchased falls within a specified range as determined by the terms of
the agreement. In fiscal 2010, 2009 and 2008, we purchased $8.9 million, $8.8
million and $9.7 million, respectively, for electricity usage under this
agreement. We also had an agreement with a local energy supplier in Texas to
purchase electricity for our manufacturing facility located there. The agreement
was a three-year bulk contract where service began in June 2006. However, the
agreement was terminated prior to its expiration since our level of future
electricity usage was expected to be significantly reduced due to the action
announced in January 2008 to modernize our facilities and rationalize the
capacity in our manufacturing plants. We paid a $1.0 million penalty fee and
entered into a separate agreement with the same supplier for the purchase of
electricity for the remainder of the service period provided under the former
agreement. The new agreement, which expired at the end of fiscal 2009, required
us to purchase a minimum level of electricity at a specified price as determined
by the terms of the agreement. Under that agreement, we purchased a total of
$6.0 million for electricity usage in fiscal 2009 and a total of $5.5 million
for electricity usage under both agreements in fiscal 2008.
We have
an agreement with a supplier in Malacca, Malaysia to purchase industrial gases
for our manufacturing facility located there. The agreement began in May 2007
and runs through May 2022. Under the terms of the agreement we can purchase up
to a certain monthly volume of gas products based on specified prices as
determined by the terms of the agreement. The agreement permits the review of
these prices every five years if such prices vary by more or less than 10
percent of fair market value. Minimum purchases under the agreement are $506
thousand in each of the next 5 years (fiscal 2011 through 2015) and a remaining
$3.5 million in fiscal 2016 and thereafter. We purchased $1.0 million of gas
products under this agreement in both fiscal 2010 and 2009. In fiscal 2008, we
purchased $0.9 million of gas product.
We are
party to a master operating lease agreement for capital equipment under which
individual operating lease agreements are executed as the delivery and
acceptance of scheduled equipment occurs. The required future minimum lease
payments under these operating leases are included in the table above. These
individual operating lease agreements under the master lease provide for
guarantees of the equipment’s residual value at the end of their lease terms for
up to a maximum of $4.1 million. At May 30, 2010, the fair value of the lease
guarantees was $0.1 million and is included in other non-current
liabilities.
Contingencies
-- Legal Proceedings
Environmental
Matters
We have
been named to the National Priorities List for our Santa Clara, California, site
and we have completed a remedial investigation/feasibility study with the
Regional Water Quality Control Board (RWQCB), acting as an agent for the EPA. We
have agreed in principle with the RWQCB on a site remediation plan and we are
conducting remediation and cleanup efforts at the site. In addition to the Santa
Clara site, we have been designated from time to time as a potentially
responsible party (PRP) by international, federal and state agencies for certain
environmental sites with which we may have had direct or indirect involvement.
These designations are made regardless of the extent of our involvement. These
claims are in various stages of administrative or judicial proceedings and
include demands for recovery of past governmental costs and for future
investigations and remedial actions. In many cases, the dollar amounts of the
claims have not been specified, and, claims have been asserted against a number
of other entities for the same cost recovery or other relief as is sought from
us. We accrue costs associated with environmental matters when they become
probable and can be reasonably estimated. The amount of all environmental
charges to earnings, including charges for the Santa Clara site remediation,
(excluding potential reimbursements from insurance coverage), were not material
during fiscal 2010, 2009 and 2008.
We have
also retained responsibility for environmental matters connected with businesses
we sold in fiscal 1996 and 1997. To date, the costs associated with the
liabilities we have retained in these dispositions have not been material and
there have been no related legal proceedings.
Page 79
of 98
Tax
Matters
Our
federal tax returns for fiscal 2007 through 2009 are currently under examination
by the IRS. In addition, the IRS will audit our amended federal tax returns for
fiscal 2005 and 2006. Several U.S. state taxing jurisdictions are examining our
state tax returns for fiscal 2001 through 2005. During fiscal 2010, the state of
California closed its audits of fiscal years up through fiscal 2000, which
resulted in an immaterial adjustment. Internationally, tax authorities from
several foreign jurisdictions are also examining our tax returns. We believe we
have made adequate tax payments and/or accrued adequate amounts of reserves such
that the outcomes of these audits will have no material adverse effects on our
financial statements.
Other
Matters
In May
2008, eTool Development, Inc. and eTool Patent Holdings Corporation
(collectively eTool) brought suit in the U.S. District Court for the Eastern
District of Texas alleging that our WEBENCH® online design tools infringe an
eTool patent and seeking an injunction and unspecified amounts of monetary
damages (trebled because of the alleged willful infringement), attorneys’ fees
and costs. In December 2008, eTool amended the complaint and counterclaims to
include our SOLUTIONS online tool in its allegations of infringement of the
eTool patent. We filed an answer to the amended complaint and counterclaims for
declaratory judgment of non-infringement and invalidity of the patent. On
February 27, 2009, the Court held a scheduling conference setting a claim
construction hearing for August 2011 and a jury trial for January 2012. eTool
served its infringement contentions in March 2009 and we served our invalidity
contentions in May 2009. Both parties exchanged initial disclosures on May 29,
2009. The discovery phase of the case is now open and ongoing. In February 2010,
we filed our inter
partes reexamination petition with the United States Patent and Trademark
Office (PTO), seeking a determination that the ‘919 patent is invalid. On March
15, 2010, the PTO issued a communication granting our inter partes reexamination
petition. The inter
partes proceeding is ongoing. On June 8, 2010, eTool filed its second
amended complaint removing the infringement allegations against our SOLUTIONS
online tool. We answered eTool’s second amended complaint on June 25, 2010. We
intend to contest the case through all available means.
We are
currently a party to various claims and legal proceedings, including those noted
above. We make provisions for a liability when it is both probable that a
liability has been incurred and the amount of the loss can be reasonably
estimated. We believe we have made adequate provisions for potential liability
in litigation matters. We review these provisions at least quarterly and adjust
these provisions to reflect the impact of negotiations, settlements, rulings,
advice of legal counsel and other information and events pertaining to a
particular case. Based on the information that is currently available to us, we
believe that the ultimate outcome of litigation matters, individually and in the
aggregate, will not have a material adverse effect on our results of operations
or financial position. However, litigation is inherently unpredictable. If an
unfavorable ruling or outcome were to occur, there is a possibility of a
material adverse effect on results of operations or our financial
position.
Contingencies
-- Other
In
connection with our past divestitures, we have routinely provided indemnities to
cover the indemnified party for matters such as environmental, tax, product and
employee liabilities. We also routinely include intellectual property
indemnification provisions in our terms of sale, development agreements and
technology licenses with third parties. Since maximum obligations are not
explicitly stated in these indemnification provisions, the potential amount of
future maximum payments cannot be reasonably estimated. To date we have incurred
minimal losses associated with these indemnification obligations and as a
result, we have not recorded any liabilities in our consolidated financial
statements.
Note
16. Segment and Geographic Information
We
design, develop, manufacture and market a wide range of semiconductor products,
most of which are analog and mixed-signal integrated circuits. We are organized
by various product line business units. For segment reporting purposes, each of
our product line business units represents an operating segment as defined under
ASC Topic 280, “Segment Reporting,” and our Chief Executive Officer is
considered the chief operating decision-maker. Business units that have
similarities, including economic characteristics, underlying technology, markets
and customers, are aggregated into larger segments. For fiscal 2010, our Analog
segment, which accounted for 94 percent of net sales, is the only operating
segment that meets the criteria of a reportable segment. Operating segments that
do not meet the criteria of a reportable segment are combined under “All
Others.”
Product
line business units that make up the Analog segment include high speed products,
precision signal path, and power management which includes three different
business units (infrastructure power, mobile devices power and
Page 80
of 98
performance
power products). These business units represent the core analog focus and
receive the majority of our research and development investment funds. The
Analog segment is focused on utilizing our analog and mixed-signal design
expertise to develop high-performance building blocks and integrated solutions
aimed at end markets, such as wireless handsets (including smart phones) and
other portable devices, and at applications for broader markets, such as
industrial and medical, automotive, network infrastructure and photovoltaic
systems.
Aside
from these operating segments, our corporate structure in fiscal 2010, 2009 and
2008 also included the centralized Worldwide Marketing and Sales Group, the Key
Market Segments Group, the Technology Development Group, the Manufacturing
Operations Group, and the Corporate Group. Certain expenses of these groups are
allocated to the operating segments and are included in their segment operating
results.
With the
exception of the allocation of certain expenses, the significant accounting
policies and practices used to prepare the consolidated financial statements as
described in Note 1 to the Consolidated Financial Statements are generally
followed in measuring the sales, segment income or loss and determination of
assets for each reportable segment. We allocate certain expenses associated with
centralized manufacturing, selling, marketing and general administration to
operating segments based on either the percentage of net trade sales for each
operating segment to total net trade sales or headcount, as appropriate. Certain
R&D expenses primarily associated with centralized activities such as
process development are allocated to operating segments based on the percentage
of dedicated R&D expenses for each operating segment to total dedicated
R&D expenses.
Page 81
of 98
The
following table presents specified amounts included in the measure of segment
operating results or the determination of segment assets:
|
(In
Millions)
|
Analog
Segment
|
All
Others
|
Total
|
||||||||||
|
2010
|
|||||||||||||
|
Net
sales to external customers
|
$
|
1,329.1
|
$
|
90.3
|
$
|
1,419.4
|
|||||||
|
Income
(loss) before income taxes
|
$
|
321.9
|
$
|
(53.3
|
)
|
$
|
268.6
|
||||||
|
Depreciation
and amortization
|
$
|
4.9
|
$
|
89.6
|
$
|
94.5
|
|||||||
|
Share-based
compensation expense
|
$
|
19.0
|
$
|
54.8
|
$
|
73.8
|
|||||||
|
Interest
income
|
$
|
-
|
$
|
1.8
|
$
|
1.8
|
|||||||
|
Interest
expense
|
$
|
-
|
$
|
60.3
|
$
|
60.3
|
|||||||
|
Loss
on extinguishment of debt
|
$
|
-
|
$
|
2.1
|
$
|
2.1
|
|||||||
|
Net
loss on derivative instrument in fair value hedge
|
$
|
-
|
$
|
2.2
|
$
|
2.2
|
|||||||
|
Total
assets
|
$
|
177.7
|
$
|
2,097.1
|
$
|
2,274.8
|
|||||||
|
2009
|
|||||||||||||
|
Net
sales to external customers
|
$
|
1,334.9
|
$
|
125.5
|
$
|
1,460.4
|
|||||||
|
Income
(loss) before income taxes
|
$
|
247.0
|
$
|
(133.4
|
)
|
$
|
113.6
|
||||||
|
Depreciation
and amortization
|
$
|
6.0
|
$
|
113.8
|
$
|
119.8
|
|||||||
|
Share-based
compensation expense
|
$
|
23.5
|
$
|
47.4
|
$
|
70.9
|
|||||||
|
Interest
income
|
$
|
-
|
$
|
10.4
|
$
|
10.4
|
|||||||
|
Interest
expense
|
$
|
-
|
$
|
72.7
|
$
|
72.7
|
|||||||
|
In-process
research and development charge
|
$
|
2.9
|
$
|
-
|
$
|
2.9
|
|||||||
|
Total
assets
|
$
|
187.5
|
$
|
1,775.8
|
$
|
1,963.3
|
|||||||
|
2008
|
|||||||||||||
|
Net
sales to external customers
|
$
|
1,695.9
|
$
|
190.0
|
$
|
1,885.9
|
|||||||
|
Income
before income taxes
|
$
|
450.9
|
$
|
0.3
|
$
|
451.2
|
|||||||
|
Depreciation
and amortization
|
$
|
7.1
|
$
|
125.6
|
$
|
132.7
|
|||||||
|
Share-based
compensation expense
|
$
|
26.5
|
$
|
63.2
|
$
|
89.7
|
|||||||
|
Interest
income
|
$
|
-
|
$
|
33.8
|
$
|
33.8
|
|||||||
|
Interest
expense
|
$
|
-
|
$
|
85.5
|
$
|
85.5
|
|||||||
|
Gain
on sale of manufacturing plant assets
|
$
|
-
|
$
|
3.1
|
$
|
3.1
|
|||||||
|
Litigation
settlement
|
$
|
-
|
$
|
3.3
|
$
|
3.3
|
|||||||
|
Total
assets
|
$
|
197.1
|
$
|
1,952.0
|
$
|
2,149.1
|
|||||||
The
information in the table above for fiscal 2009 and 2008 has been reclassified to
present segment information based on the structure of our operating segments in
fiscal 2010. Sales for the category “All Others,” includes sales from non-analog
business units that are no longer a part of our core focus, as well as some
sales generated from foundry and contract service arrangements.
Total
assets for the Analog segment consist only of those assets that are specifically
dedicated to an operating segment and include inventories, equipment, equity
investments, goodwill and amortizable intangibles assets. Depreciation and
amortization presented for each segment include only such charges on dedicated
segment assets. Similarly, share-based compensation expense presented for each
segment includes only such charges related to employees who directly support the
operating segments. The measurement of segment profit and loss includes an
allocation of depreciation expense for shared manufacturing facilities and
share-based compensation expense associated with direct labor contained in the
standard cost of product for each segment.
Page 82
of 98
Our revenues from external customers are derived from the sales of semiconductor
product and engineering-related services. For fiscal 2010, 2009 and 2008, sales
from engineering-related services were immaterial and are included with
semiconductor product sales. Our semiconductor product sales consist of
integrated circuit components and are considered a group of similar
products.
Net sales
to major customers as a percentage of total net sales were as
follows:
|
2010
|
2009
|
2008
|
|||||||
|
Distributor:
|
|||||||||
|
Avnet
|
17%
|
15%
|
15%
|
||||||
|
Arrow
|
15%
|
13%
|
12%
|
||||||
|
OEM:
|
|||||||||
|
Nokia
|
*
|
*
|
11%
|
||||||
*
less than 10%
Sales to
the distributors included above are mostly for our Analog segment products, but
also include some sales for our other operating segment products. Sales to Nokia
are primarily for our Analog segment products.
We
operate our marketing and sales activities in four main geographic regions that
include the Americas, Asia Pacific, Europe and Japan. Total sales by
geographical area include sales to unaffiliated customers and inter-geographic
transfers, which are based on standard cost. To control costs, a substantial
portion of our products are transported between the Americas, Asia Pacific
region and Europe while in the process of being manufactured and sold. In the
information presented below, we have excluded these inter-geographic
transfers.
The
following tables provide geographic sales and asset information by major
countries within the main geographic areas:
|
(In
Millions)
|
2010
|
2009
|
2008
|
|||||||||
|
Net
sales:
|
||||||||||||
|
United
States
|
$
|
334.9
|
$
|
341.1
|
$
|
385.5
|
||||||
|
Foreign
locations:
|
||||||||||||
|
People’s
Republic of China
|
450.5
|
462.3
|
573.8
|
|||||||||
|
Singapore
|
192.7
|
231.5
|
309.9
|
|||||||||
|
Japan
|
124.0
|
115.4
|
200.6
|
|||||||||
|
Germany
|
317.3
|
310.1
|
204.4
|
|||||||||
|
United
Kingdom (1)
|
-
|
-
|
211.7
|
|||||||||
|
1,084.5
|
1,119.3
|
1,500.4
|
||||||||||
|
Total
net sales
|
$
|
1,419.4
|
$
|
1,460.4
|
$
|
1,885.9
|
||||||
|
Long-lived
assets:
|
||||||||||||
|
United
States
|
$
|
244.1
|
$
|
294.1
|
$
|
358.2
|
||||||
|
Foreign
locations:
|
||||||||||||
|
Malaysia
|
66.3
|
69.9
|
93.8
|
|||||||||
|
United
Kingdom
|
77.0
|
72.9
|
72.1
|
|||||||||
|
Rest
of World
|
2.7
|
24.9
|
33.2
|
|||||||||
|
146.0
|
167.7
|
199.1
|
||||||||||
|
Total
long-lived assets
|
$
|
390.1
|
$
|
461.8
|
$
|
557.3
|
||||||
(1)
Beginning in fiscal 2009, we no longer report sales in the United Kingdom since
our European sales operations were consolidated and are now in Munich,
Germany.
Page 83
of 98
Note
17. Financial Information by Quarter (Unaudited)
The
following table presents the unaudited quarterly
information for fiscal 2010 and 2009:
|
Fourth
|
Third
|
Second
|
First
|
||||||||||
|
(In
Millions, Except Per Share Amounts)
|
Quarter
|
Quarter
|
Quarter
|
Quarter
|
|||||||||
|
2010
|
|||||||||||||
|
Net
sales
|
$
|
398.5
|
$
|
361.9
|
$
|
344.6
|
$
|
314.4
|
|||||
|
Gross
margin
|
$
|
274.3
|
$
|
243.7
|
$
|
225.0
|
$
|
192.2
|
|||||
|
Net
income
|
$
|
79.2
|
$
|
53.2
|
$
|
47.0
|
$
|
29.8
|
|||||
|
Earnings
per share:
|
|||||||||||||
|
Net
income:
|
|||||||||||||
|
Basic
|
$
|
0.33
|
$
|
0.22
|
$
|
0.20
|
$
|
0.13
|
|||||
|
Diluted
|
$
|
0.33
|
$
|
0.22
|
$
|
0.20
|
$
|
0.13
|
|||||
|
Weighted-average
common and potential common shares outstanding:
|
|||||||||||||
|
Basic
|
238.0
|
237.3
|
236.6
|
233.6
|
|||||||||
|
Diluted
|
243.6
|
242.5
|
241.0
|
237.9
|
|||||||||
|
Common
stock price - high
|
$
|
16.00
|
$
|
15.70
|
$
|
16.20
|
$
|
15.85
|
|||||
|
Common
stock price - low
|
$
|
13.12
|
$
|
13.14
|
$
|
12.52
|
$
|
11.60
|
|||||
|
2009
|
|||||||||||||
|
Net
sales
|
$
|
280.8
|
$
|
292.4
|
$
|
421.6
|
$
|
465.6
|
|||||
|
Gross
margin
|
$
|
163.6
|
$
|
168.1
|
$
|
277.4
|
$
|
307.2
|
|||||
|
Net
(loss) income
|
$
|
(63.7
|
)
|
$
|
21.1
|
$
|
36.3
|
$
|
79.6
|
||||
|
Earnings
(loss) per share:
|
|||||||||||||
|
Net
(loss) income:
|
|||||||||||||
|
Basic
|
$
|
(0.28
|
)
|
$
|
0.09
|
$
|
0.16
|
$
|
0.35
|
||||
|
Diluted
|
$
|
(0.28
|
)
|
$
|
0.09
|
$
|
0.16
|
$
|
0.33
|
||||
|
Weighted-average
common and potential common shares outstanding:
|
|||||||||||||
|
Basic
|
230.1
|
228.4
|
228.0
|
229.8
|
|||||||||
|
Diluted
|
230.1
|
231.3
|
234.0
|
241.3
|
|||||||||
|
Common
stock price - high
|
$
|
14.00
|
$
|
12.17
|
$
|
22.51
|
$
|
24.75
|
|||||
|
Common
stock price - low
|
$
|
9.31
|
$
|
9.06
|
$
|
9.02
|
$
|
19.48
|
|||||
Our
common stock is traded on the New York Stock Exchange. The quoted market prices
are as reported on the New York Stock Exchange Composite Tape. At May 30, 2010,
there were approximately 4,800 record holders of common stock. The graph showing
the performance of our stock over the last five years can be found in Item 5 of
this Form 10-K.
Page 84
of 98
Report
of Independent Registered Public Accounting Firm
The Board
of Directors and Shareholders
National
Semiconductor Corporation:
We have
audited the accompanying consolidated balance sheets of National Semiconductor
Corporation and subsidiaries (the Company) as of May 30, 2010 and May 31, 2009,
and the related consolidated statements of income, comprehensive income,
shareholders’ equity, and cash flows for each of the years in the three year
period ended May 30, 2010. In connection with our audits of the consolidated
financial statements, we also have audited the accompanying financial statement
schedule included in Item 15(a)2. These consolidated financial statements and
financial statement schedule are the responsibility of the Company’s management.
Our responsibility is to express an opinion on these consolidated financial
statements and financial statement schedule based on our audits.
We
conducted our audits in accordance with the standards of the Public Company
Accounting Oversight Board (United States). Those standards require that we plan
and perform the audit to obtain reasonable assurance about whether the financial
statements are free of material misstatement. An audit includes examining, on a
test basis, evidence supporting the amounts and disclosures in the financial
statements. An audit also includes assessing the accounting principles used and
significant estimates made by management, as well as evaluating the overall
financial statement presentation. We believe that our audits provide a
reasonable basis for our opinion.
In our
opinion, the consolidated financial statements referred to above present fairly,
in all material respects, the financial position of National Semiconductor
Corporation and subsidiaries as of May 30, 2010 and May 31, 2009, and the
results of their operations and their cash flows for each of the years in the
three year period ended May 30, 2010, in conformity with U.S. generally accepted
accounting principles. Also in our opinion, the related financial statement
schedule, when considered in relation to the basic consolidated financial
statements taken as a whole, presents fairly, in all material respects, the
information set forth therein.
As
discussed in note 2 to the consolidated financial statements, the Company has
changed its method of accounting for the valuation of financial assets and
liabilities at the beginning of fiscal year 2009 due to the adoption of
Financial Accounting Standards Board Accounting Standards Codification (ASC)
Topic 820, Fair Value Measurements and
Disclosures, and, as discussed in note 12 to the consolidated financial
statements, the Company has changed its method of accounting for the measurement
date of its defined benefit pension plans in fiscal year 2009 due to the
adoption of ASC Topic 715, Compensation–Retirement Benefits. Also, as
discussed in note 11 to the consolidated financial statements, the Company
changed its method of accounting for uncertain tax positions at the beginning of
fiscal year 2008 as a result of the adoption of ASC Topic 740, Income Taxes.
We also
have audited, in accordance with the standards of the Public Company Accounting
Oversight Board (United States), the Company’s internal control over financial
reporting as of May 30, 2010, based on criteria established in Internal Control – Integrated Framework,
issued by the Committee of Sponsoring Organizations of the Treadway Commission
(COSO), and our report dated July 20, 2010 expressed an unqualified opinion on
the effectiveness of the Company’s internal control over financial
reporting.
/s/ KPMG
LLP
Mountain
View, California
July 20,
2010
Page 85
of 98
Report
of Independent Registered Public Accounting Firm
The Board
of Directors and Shareholders
National
Semiconductor Corporation:
We have
audited National Semiconductor Corporation and subsidiaries’ (the Company)
internal control over financial reporting as of May 30, 2010, based on criteria
established in Internal Control – Integrated
Framework, issued by the Committee of Sponsoring Organizations of the
Treadway Commission (COSO). The Company’s management is responsible for
maintaining effective internal control over financial reporting and for its
assessment of the effectiveness of internal control over financial reporting
included in the accompanying Management’s Annual Report on Internal Control Over
Financial Reporting in Item 9A. Our responsibility is to express an opinion on
the Company’s internal control over financial reporting based on our
audit.
We
conducted our audit in accordance with the standards of the Public Company
Accounting Oversight Board (United States). Those standards require that we plan
and perform the audit to obtain reasonable assurance about whether effective
internal control over financial reporting was maintained in all material
respects. Our audit included obtaining an understanding of internal control over
financial reporting, assessing the risk that a material weakness exists, and
testing and evaluating the design and operating effectiveness of internal
control based on the assessed risk. Our audit also included performing such
other procedures as we considered necessary in the circumstances. We believe
that our audit provides a reasonable basis for our opinion.
A
company’s internal control over financial reporting is a process designed to
provide reasonable assurance regarding the reliability of financial reporting
and the preparation of financial statements for external purposes in accordance
with generally accepted accounting principles. A company’s internal control over
financial reporting includes those policies and procedures that (1) pertain to
the maintenance of records that, in reasonable detail, accurately and fairly
reflect the transactions and dispositions of the assets of the company; (2)
provide reasonable assurance that transactions are recorded as necessary to
permit preparation of financial statements in accordance with generally accepted
accounting principles, and that receipts and expenditures of the company are
being made only in accordance with authorizations of management and directors of
the company; and (3) provide reasonable assurance regarding prevention or timely
detection of unauthorized acquisition, use, or disposition of the company’s
assets that could have a material effect on the financial
statements.
Because
of its inherent limitations, internal control over financial reporting may not
prevent or detect misstatements. Also, projections of any evaluation of
effectiveness to future periods are subject to the risk that controls may become
inadequate because of changes in conditions, or that the degree of compliance
with the policies or procedures may deteriorate.
In our
opinion, National Semiconductor Corporation and subsidiaries maintained, in all
material respects, effective internal control over financial reporting as of May
30, 2010, based on criteria established in Internal Control – Integrated Framework,
issued by the Committee of Sponsoring Organizations of the Treadway Commission
(COSO).
We also
have audited, in accordance with the standards of the Public Company Accounting
Oversight Board (United States), the consolidated balance sheets of National
Semiconductor Corporation and subsidiaries as of May 30, 2010 and May 31, 2009,
and the related consolidated statements of income, comprehensive income,
shareholders’ equity, and cash flows for each of the years in the three year
period ended May 30, 2010, and the related financial statement schedule, and our
report dated July 20, 2010 expressed an unqualified opinion on those
consolidated financial statements and financial statement schedule.
/s/ KPMG
LLP
Mountain
View, California
July 20,
2010
Page 86
of 98
ITEM 9.
CHANGES IN AND DISAGREEMENTS WITH ACCOUNTANTS ON ACCOUNTING AND FINANCIAL
DISCLOSURE
Not
applicable.
ITEM
9A. CONTROLS AND PROCEDURES
Evaluation
of Disclosure Controls and Procedures
We
maintain disclosure controls and procedures that are intended to ensure that the
information required to be disclosed in our Exchange Act filings is properly and
timely recorded, processed, summarized and reported. In designing and evaluating
our disclosure controls and procedures, we recognize that management necessarily
is required to apply its judgment in evaluating controls and procedures. Since
we have investments in certain unconsolidated entities which we do not control
or manage, our disclosure controls and procedures with respect to such entities
are necessarily substantially more limited than those we maintain for our
consolidated subsidiaries.
We have a
disclosure controls committee comprised of key individuals from a variety of
disciplines in the company that are involved in the disclosure and reporting
process. The committee meets regularly to ensure the timeliness, accuracy and
completeness of the information required to be disclosed in our filings
containing financial statements. As required by SEC Rule 13a-15(b), the
committee reviewed this Form 10-K and also met with the Chief Executive Officer
and the Chief Financial Officer to review this Form 10-K and the required
disclosures and the effectiveness of the design and operation of our disclosure
controls and procedures. The committee performed an evaluation, under the
supervision of and with the participation of management, including our Chief
Executive Officer and Chief Financial Officer, of the effectiveness of the
design and operation of our disclosure controls and procedures as of the end of
the fiscal year covered by this report. Based on that evaluation and their
supervision of and participation in the process, our Chief Executive Officer and
Chief Financial Officer have concluded that our disclosure controls and
procedures are effective.
Management’s
Annual Report on Internal Control Over Financial Reporting
Our
management is responsible for establishing and maintaining adequate internal
control over financial reporting to provide reasonable assurance regarding the
reliability of our financial reporting and the preparation of financial
statements for external reporting purposes in accordance with generally accepted
accounting principles. Internal control over financial reporting includes those
policies and procedures that (i) pertain to the maintenance of records that in
reasonable detail accurately and fairly reflect the transactions and
dispositions of the assets of the company; (ii) provide reasonable assurance
that transactions are recorded as necessary to permit preparation of financial
statements in accordance with U.S. GAAP, and that receipts and expenditures of
the company are being made only in accordance with authorization of management
and directors of the company; and (iii) provide reasonable assurance regarding
prevention or timely detection of unauthorized acquisition, use or disposition
of the company’s assets that could have a material effect on the financial
statements.
Management
assessed our internal control over financial reporting as of May 30, 2010, the
end of our 2010 fiscal year. Management conducted its evaluation of
the effectiveness of our internal control over financial reporting based on the
framework established in Internal Control-Integrated Framework issued by the
Committee of Sponsoring Organizations of the Treadway Commission. Management’s
assessment included evaluation of such elements as the design and operating
effectiveness of key reporting controls, process documentation, accounting
policies, and our overall control environment. This assessment is supported by
testing and monitoring performed by our internal audit and finance
personnel.
Based on
our assessment, our management has concluded that our internal control over
financial reporting was effective as of the end of our 2010 fiscal year. We
reviewed the results of this assessment with the audit committee of our board of
directors.
Our
independent registered public accounting firm, KPMG LLP, independently assessed
the effectiveness of our internal control over financial reporting. KPMG has
issued an unqualified attestation report, which is included under Item 8 of this
Form 10-K as a separate Report of Independent Registered Public Accounting
Firm.
Inherent
Limitations on Effectiveness of Controls
Our
management, including our Chief Executive Officer and Chief Financial Officer,
does not expect that our disclosure controls or our internal control over
financial reporting will prevent or detect all error and all fraud. A control
system, no
Page 87
of 98
matter
how well designed and operated, can provide only reasonable, not absolute,
assurance that the control system’s objectives will be met. The design of a
control system must reflect the fact that there are resource constraints and the
benefits of controls must be considered relative to their costs. Further,
because of inherent limitations in all control systems, no evaluation of
controls can provide absolute assurance that misstatements due to error or fraud
will not occur or that all control issues and instances of fraud, if any, within
the company have been detected. These inherent limitations include the realities
that judgments in decision-making can be faulty and that breakdowns can occur
because of simple error or mistake. Controls can also be circumvented by the
individual acts of some persons, by collusion of two or more people, or by
management override of the controls. The design of any system of controls is
based in part on certain assumptions about the likelihood of future events, and
there can be no assurance that any design will succeed in achieving its stated
goals under all potential future conditions. Projections of any evaluation of
controls effectiveness to future periods are subject to risks. Over time,
controls may become inadequate because of changes in conditions or deterioration
in the degree on compliance with policies or procedures.
Changes
in Internal Controls
As part
of our efforts to ensure compliance with the requirements of Section 404 of the
Sarbanes-Oxley Act of 2002, we conduct a continual review of our internal
control over financial reporting. The review is an ongoing process and it is
possible that we may institute additional or new internal controls over
financial reporting as a result of the review. During the fourth quarter of
fiscal 2010, we did not make any changes in our internal controls over financial
reporting that have materially affected, or are reasonably likely to materially
affect, our internal controls over financial reporting.
ITEM
9B. OTHER INFORMATION
Not
applicable.
Page 88
of 98
PART III
ITEM
10. DIRECTORS, EXECUTIVE OFFICERS AND CORPORATE GOVERNANCE
The
following information appearing in our Proxy Statement for the 2010 annual
meeting of shareholders to be held on or about September 24, 2010 and which will
be filed in definitive form pursuant to Regulation 14A on or about August 11,
2010 (the “2010 Proxy Statement”), is incorporated herein by
reference:
|
|
·
|
information
concerning our directors appearing in the section on the proposal relating
to election of directors;
|
|
|
·
|
information
appearing under the subcaptions “Audit Committee,” “Section 16(a)
Beneficial Ownership Reporting Compliance,” and “Code of Business Conduct
and Ethics” appearing in the section titled “Corporate Governance, Board
Meetings and Committees.”
|
Information
concerning our executive officers is set forth in Part I of this Form 10-K under
the caption “Executive Officers of the Registrant.”
ITEM
11. EXECUTIVE COMPENSATION
The
information appearing in (i) the section titled “Executive Compensation”
(including all related subcaptions thereof), (ii) under the subcaptions
“Director Compensation” and “Compensation Committee Interlocks and Insider
Participation” in the section titled “Corporate Governance, Board Meetings and
Committees,” and (iii) in the section titled “Compensation Committee Report” in
the 2010 Proxy Statement is incorporated herein by reference.
Page 89
of 98
ITEM
12. SECURITY OWNERSHIP OF CERTAIN BENEFICIAL OWNERS AND MANAGEMENT
AND
RELATED
STOCKHOLDER MATTERS
The
information concerning the only known ownership of more than 5 percent of our
outstanding common stock appearing in the section titled “Security Ownership of
Certain Beneficial Owners” in the 2010 Proxy Statement is incorporated herein by
reference. The information concerning the ownership of our equity securities by
directors, certain executive officers and directors and officers as a group
appearing under the caption “Security Ownership of Management” in the 2010 Proxy
Statement is incorporated herein by reference.
Equity
Compensation Plans
The
following table summarizes share and exercise price information about our equity
compensation plans as of May 30, 2010.
Equity
Compensation Plan Information
|
Plan
Category
|
Number
of securities to be issued upon exercise of outstanding options, warrants,
and rights
(a)
|
Weighted-average
exercise price of outstanding options, warrants and rights
(b)
|
Number
of securities remaining available for future issuance under equity
compensation plans (excluding securities reflected in column
(a))
(c)
|
||
|
Equity
compensation plans approved by security holders:
|
|||||
|
2009
Incentive Award Plan:
|
|||||
|
Options
|
743,000
|
$14.56
|
|||
|
Restricted
Stock
|
2,043,430
|
-
|
|||
|
2,786,430
|
13,203,570
|
||||
|
Stock
Option Plan
|
1,839,300
|
$15.09
|
-
|
||
|
Executive
Officer Stock Option Plan
|
7,408,000
|
$14.11
|
-
|
||
|
Director
Stock Option Plan
|
350,000
|
$14.24
|
-
|
||
|
2007
Employees Equity Plan:
|
|||||
|
Options
|
8,029,841
|
$14.60
|
|||
|
Restricted
Stock Units:
|
|||||
|
Time-based
RSU
|
641,750
|
||||
|
Performance-based
RSU
|
15,000
|
||||
|
656,750
|
-
|
-
|
|||
|
Employee
Stock Purchase Plan
|
-
|
4,769,882
|
|||
|
Director
Stock Plan
|
-
|
103,953
|
|||
|
2005
Executive Officer Equity Plan:
|
|||||
|
Options
|
1,894,000
|
$15.90
|
-
|
||
|
Performance
Share Units at Target
|
1,670,000
|
-
|
-
|
||
|
Equity
compensation plans not approved by security holders:
|
|||||
|
1997
Employees Stock Option Plan
|
10,955,328
|
$17.59
|
-
|
||
|
Total
|
35,589,649
|
18,077,405
|
|||
Page 90
of 98
Information
about our Equity Compensation Plans not Approved by Stockholders
The 1997
Employees Stock Option Plan provided for the grant of non-qualified stock
options to employees who are not executive officers of the company. Options were
granted at the closing market price on the date of grant and can expire up to a
maximum of six years and one day after grant or three months after termination
of employment (up to five years after termination due to death, disability or
retirement), whichever occurs first. Options can begin to vest after six months;
all options granted in the last three fiscal years begin to vest after one year,
with vesting completed on a monthly basis ratably over the next three
years. The plan was terminated in September 2007 and no further
options can be granted thereunder.
ITEM
13. CERTAIN RELATIONSHIPS AND RELATED TRANSACTIONS, AND DIRECTOR
INDEPENDENCE
The
information appearing under the subcaptions “Certain Relationships and Related
Party Transactions” and “Director Independence” in the section titled “Corporate
Governance, Board Meetings and Committees” in the 2010 Proxy Statement is
incorporated herein by reference.
ITEM
14. PRINCIPAL ACCOUNTANT FEES AND SERVICES
The
information presented in the section on the proposal relating to ratification of
the appointment of the independent auditor, including the information concerning
fees paid to KPMG LLP, appearing in the 2010 Proxy Statement is incorporated
herein by reference.
Page 91
of 98
PART IV
ITEM
15. EXHIBITS AND FINANCIAL STATEMENT SCHEDULES
|
(a) 1. Financial Statements
|
Pages
in
this document
|
|
|
National
Semiconductor Corporation and Subsidiaries
|
||
|
For
each of the years in the three-year period ended May 30, 2010 – refer to
Index in Item 8
|
41-86
|
|
|
(a) 2. Financial Statement
Schedules
|
||
|
Schedule
II - Valuation and Qualifying Accounts
|
93
|
All other
schedules are omitted since the required information is inapplicable or the
information is presented in the Consolidated Financial Statements or notes
thereto.
(a) 3.
Exhibits
The
exhibits listed in the accompanying Index to Exhibits on page 96 to 98 of this
report are filed as part of, or incorporated by reference into, this
report.
Page 92
of 98
NATIONAL
SEMICONDUCTOR CORPORATION
SCHEDULE
II -- VALUATION AND QUALIFYING ACCOUNTS
(In
Millions)
Deducted
from Receivables in the Consolidated Balance Sheets
|
Description
|
Doubtful
Accounts
|
Returns
|
Allowances
|
Total
|
|
Balance
at May 27, 2007
|
$
1.2
|
$
2.8
|
$
28.4
|
$
32.4
|
|
Additions
charged against revenue
|
-
|
2.4
|
191.8
|
194.2
|
|
Additions
charged against cost and expenses
|
0.1
|
-
|
-
|
0.1
|
|
Deductions
|
-
|
(3.1)
|
(198.2)
|
(201.3)
|
|
Balance
at May 25, 2008
|
1.3
|
2.1
|
22.0
|
25.4
|
|
Additions
charged against revenue
|
-
|
5.8
|
185.4
|
191.2
|
|
Additions
charged against cost and expenses
|
-
|
-
|
-
|
-
|
|
Deductions
|
(0.2)
(1)
|
(3.5)
|
(194.2)
|
(197.9)
|
|
Balance
at May 31, 2009
|
1.1
|
4.4
|
13.2
|
18.7
|
|
Additions
charged against revenue
|
-
|
2.2
|
230.1
|
232.3
|
|
Deductions
|
(0.7)
(1)
|
(3.9)
|
(216.4)
|
(221.0)
|
|
Balance
at May 30, 2010
|
$0.4
|
$2.7
|
$26.9
|
$30.0
|
________________________________________________
(1) Doubtful
accounts written off, less recoveries.
Our
customers do not have contractual rights to return product to us except under
customary warranty provisions. The majority of returns and allowances are
related to the price adjustment programs we have with distributors, none of
which involve return of product. As discussed in Note 1 to the Consolidated
Financial Statements, we have agreements with our distributors that cover
various programs, including pricing adjustments based on resale pricing and
volume, price protection for inventory and scrap allowances. The revenue we
record for these distribution sales is net of estimated provisions for these
programs. Our estimates are based upon historical experience rates by geography
and product family, inventory levels in the distribution channel, current
economic trends, and other related factors. Our history of actual credits
granted in connection with the allowance programs has been consistent with the
reserves we have recorded.
Page 93
of 98
SIGNATURES
Pursuant
to the requirements of Section 13 or 15(d) of the Securities Exchange Act of
1934, the registrant has duly caused this report to be signed on its behalf by
the undersigned, thereunto duly authorized.
|
NATIONAL
SEMICONDUCTOR CORPORATION
|
||
|
Date: July
20, 2010
|
/S/
DONALD MACLEOD
|
|
|
Donald
Macleod
|
||
|
Chairman,
President and Chief Executive
Officer
|
Pursuant
to the requirements of the Securities Exchange Act of 1934, this report has been
signed below by the following persons on behalf of the registrant and in the
capacities stated and on the 20th day
of July 2010.
|
Signature
|
Title
|
||
|
/S/
|
DONALD
MACLEOD
|
Chairman,
President
and
Chief Executive Officer
(Principal
Executive Officer)
|
|
|
Donald
Macleod
|
|||
|
/S/
|
LEWIS
CHEW
|
Senior
Vice President, Finance
and
Chief Financial Officer
(Principal
Financial Officer)
|
|
|
Lewis
Chew
|
|||
|
/S/
|
JAMIE
E. SAMATH
|
Vice
President and
Corporate
Controller
(Principal
Accounting Officer)
|
|
|
Jamie
E. Samath
|
|||
|
/S/
|
WILLIAM
J. AMELIO *
|
Director
|
|
|
William
J. Amelio
|
|||
|
/S/
|
STEVEN
R. APPLETON *
|
Director
|
|
|
Steven
R. Appleton
|
|||
|
/S/
|
GARY
P. ARNOLD *
|
Director
|
|
|
Gary
P. Arnold
|
|||
|
/S/
|
RICHARD
J. DANZIG *
|
Director
|
|
|
Richard
J. Danzig
|
|||
|
/S/
|
JOHN
T. DICKSON *
|
Director
|
|
|
John
T. Dickson
|
|||
|
/S/
|
ROBERT
J. FRANKENBERG *
|
Director
|
|
|
Robert
J. Frankenberg
|
|||
|
/S/
|
MODESTO
A. MAIDIQUE *
|
Director
|
|
|
Modesto
A. Maidique
|
|||
|
/S/
|
EDWARD
R. McCRACKEN *
|
Director
|
|
|
Edward
R. McCracken
|
|||
|
/S/
|
RODERICK
C. McGEARY *
|
Director
|
|
|
Roderick
C. McGeary
|
|||
|
/S/
|
WILLIAM
E. MITCHELL *
|
Director
|
|
|
William
E. Mitchell
|
|||
|
*By
|
\s\
LEWIS CHEW
|
|
|
Lewis
Chew,
Attorney-in-Fact
|
||
Page 94
of 98
Consent
of Independent Registered Public Accounting Firm
The Board
of Directors
National
Semiconductor Corporation:
We
consent to the incorporation by reference in the registration statements
(No. 333-165803) on Form S-3 and (Nos. 33-48943, 33-54931,
33-55715, 33-61377, 333-09957, 333-26625, 333-36733, 333-48424, 333-63614,
333-77195, 333-109348, 333-119963, 333-122652, 333-129585, 333-146600, and
333-162367) on Form S-8 of National Semiconductor Corporation of our
reports dated July 20, 2010, with respect to the consolidated balance
sheets of National Semiconductor Corporation and subsidiaries (the Company)
as of May 30, 2010 and May 31, 2009, and the related consolidated
statements of income, comprehensive income, shareholders’ equity, and cash flows
for each of the years in the three-year period ended May 30, 2010, and the
related financial statement schedule, and the effectiveness of internal control
over financial reporting as of May 30, 2010, which reports appear in the
2010 Annual Report on Form 10-K of National Semiconductor
Corporation.
Our report on the consolidated financial statements refers to the change in the Company’s method of accounting for the valuation of financial assets and liabilities at the beginning of fiscal year 2009 due to the adoption of Financial Accounting Standards Board Accounting Standards Codification (ASC) Topic 820, Fair Value Measurements and Disclosures, and to the change in the Company’s method of accounting for the measurement date of its defined benefit pension plans in fiscal year 2009 due to the adoption of ASC Topic 715, Compensation – Retirement Benefits. Our report on the consolidated financial statements also refers to the change in the Company’s method of accounting for uncertain tax positions at the beginning of fiscal year 2008 as a result of the adoption of ASC Topic 740, Income Taxes.
/s/ KPMG
LLP
Mountain
View, California
July 20,
2010
Page 95
of 98
INDEX
TO EXHIBITS
The
following documents are filed as, or hereby incorporated by reference, into this
report:
|
3.1
|
Second
Restated Certificate of Incorporation of National Semiconductor
Corporation, as amended (incorporated by reference from the Exhibits to
our Registration Statement on Form S-3, Registration No. 33-52775, which
became effective March 22, 1994); Certificate of Amendment of Certificate
of Incorporation dated September 30, 1994 (incorporated by reference from
the Exhibits to our Registration Statement on Form S-8, Registration No.
333-09957, which became effective August 12, 1996); Certificate of
Amendment of Certificate of Incorporation dated September 22, 2000
(incorporated by reference from the Exhibits to our Registration Statement
on Form S-8, Registration No. 333-48424, which became effective October
23, 2000).
|
|
3.2
|
By-Laws
of National Semiconductor Corporation, as amended and restated effective
January 28, 2009 (incorporated by reference from the Exhibits to our Form
8-K, SEC File No. 001-06453, filed January 29, 2009).
|
|
4.1
|
Form
of Common Stock Certificate (incorporated by reference from the Exhibits
to our Registration Statement on Form S-3 Registration No. 33-48935, which
became effective October 5, 1992).
|
|
4.2
|
Indenture,
dated as of June 18, 2007, by and between National Semiconductor
Corporation and The Bank of New York Mellon Trust Company, N.A.
(incorporated by reference from the Exhibits to our Registration Statement
on Form S-3, Registration No. 333-165803, filed on March 31,
2010).
|
|
4.3
|
Supplemental
Indenture for 6.150% Senior Notes due 2012 (incorporated by reference from
the Exhibits to our Form 8-K dated June 13, 2007, SEC File No. 001-06453,
filed June 18, 2007); form of Global Note for 6.150% Senior Notes due 2012
(incorporated by reference from the Exhibits to our Form 8-K dated June
13, 2007, SEC File No. 001-06453, filed June 18, 2007).
|
|
4.4
|
Supplemental
Indenture for 6.60% Senior Notes due 2017 (incorporated by reference from
the Exhibits to our Form 8-K dated June 13, 2007, SEC File No. 001-06453,
filed June 18, 2007); form of Global Note for 6.600% Senior Notes due 2017
(incorporated by reference from the Exhibits to our Form 8-K dated June
13, 2007, SEC File No. 001-06453, filed June 18, 2007).
|
|
4.5
|
Supplemental
Indenture for 3.950% Senior Notes due 2015 (incorporated by reference from
the Exhibits to our Form 8-K, SEC File No. 001-06453, filed April 6,
2010); form of Global Note for 3.950% Senior Notes due 2015 (incorporated
by reference from the Exhibits to our Form 8-K, SEC File No. 001-06453,
filed April 6, 2010).
|
|
10.1*
|
Fiscal
2009 Incentive Retention Program (incorporated by reference from our
Current Report on Form 8-K, SEC File No. 001-06453, filed on November 26,
2008).
|
|
10.2*
|
Stock
Option Plan, as amended effective February 26, 2007; form of stock option
agreement used for options granted under the Stock Option Plan (both
incorporated by reference from the Exhibits to our Form 10-Q for the
quarter ended February 25, 2007, SEC File No. 001-06453, filed April 5,
2007).
|
|
10.3*
|
Executive
Officer Stock Option Plan, as amended effective February 26, 2007; form of
stock option agreement used for options granted under the Executive
Officer Stock Option Plan (both incorporated by reference from the
Exhibits to our Form 10-Q for the quarter ended February 25, 2007, SEC
File No. 001-06453, filed April 5, 2007).
|
|
10.4*
|
Director
Stock Plan as amended and restated effective August 13, 2005 (incorporated
by reference from the Exhibits to our Registration Statement on Form S-8,
Registration No. 333-129585, filed November 9, 2005).
|
|
10.5*
|
Director
Stock Option Plan (incorporated by reference from the Exhibits to our Form
10-K for the fiscal year ended May 29, 2005, SEC File No. 001-06453, filed
August 9, 2005); form of stock option agreement used for options granted
under the Director Stock Option Plan (incorporated by reference from the
Exhibits to our Form 10-Q for the quarter ended November 28, 2004, SEC
File No. 001-06453, filed January 6, 2005).
|
|
10.6*
|
Board
Retirement Policy (incorporated by reference from the Exhibits to our Form
10-K for the fiscal year ended May 29, 2005, SEC File No. 001-06453, filed
August 9, 2005).
|
Page 96
of 98
|
10.7*
|
Preferred
Life Insurance Program (incorporated by reference from the Exhibits to our
Form 10-K for the fiscal year ended May 29, 2005, SEC File No. 001-06453,
filed August 9, 2005).
|
|
10.8*
|
Retired
Officers and Directors Health Plan (incorporated by reference from the
Exhibits to our Form 10-K for the fiscal year ended May 28, 2006, SEC File
No. 001-06453, filed July 27, 2006).
|
|
10.9*
|
Executive
Staff Long Term Disability Plan as amended January 1, 2002 as restated
July 2002 (incorporated by reference from the Exhibits to our Form 10-Q
for the quarter ended November 24, 2002, SEC File No. 001-06453, filed
January 6, 2003).
|
|
10.10*
|
Form
of Change of Control Employment Agreement entered into with certain
executive officers of National Semiconductor Corporation (incorporated by
reference from the Exhibits to our Form 10-Q for the quarter ended
November 25, 2007, SEC File No. 001-06453, filed January 4, 2008); form of
Amended and Restated Change of Control Employment Agreement entered into
with certain executive officers of National Semiconductor Corporation
(incorporated by reference from the Exhibits to our Form 10-K for the
fiscal year ended May 25, 2008, SEC File No. 001-06453, filed July 23,
2008).
|
|
10.11*
|
National
Semiconductor Deferred Compensation Plan as amended and restated effective
as of January 1, 2008 (incorporated by reference from the Exhibits to our
Form 10-Q for the quarter ended November 25, 2007, SEC File No. 001-06453,
filed January 4, 2008).
|
|
10.12*
|
Restricted
Stock Plan as amended effective July 18, 2007 (incorporated by reference
from the Exhibits to our Form 10-K for the fiscal year ended May 27, 2007,
SEC File No. 001-06453, filed July 26, 2007); form of agreements used for
grants of restricted stock, restricted stock units and performance based
restricted stock units under the Restricted Stock Plan (incorporated by
reference from the Exhibits to our Form 8-K dated July 18, 2006, SEC File
No. 001-06453, filed July 20, 2006).
|
|
10.13*
|
1997
Employees Stock Option Plan, as amended effective February 26, 2007; form
of stock option agreement used for options granted under the 1997
Employees Stock Option plan (both incorporated by reference from the
Exhibits to our Form 10-Q for the quarter ended February 25, 2007, SEC
File No. 001-06453, filed April 5, 2007).
|
|
10.14*
|
Retirement
and Savings Program (incorporated by reference from the Exhibits to our
Form 10-K for the year ended May 26, 2002, SEC File No. 001-06453, filed
August 16, 2002); Amendments One to Seven to Retirement and Savings
Program (incorporated by reference from the Exhibits to our Form 10-K for
the fiscal year ended May 30, 2004, SEC File No. 001-06453, filed August
11, 2004); Amendment Eight to Retirement and Savings Program (incorporated
by reference from the Exhibits to our Form 8-K dated September 22, 2005,
SEC File No. 001-06453, filed September 22, 2005).
|
|
10.15*
|
Executive
Physical Exam Plan effective January 1, 2003 (incorporated by reference
from the Exhibits to our Form 10-Q for the quarter ended November 24,
2002, SEC File No. 001-06453, filed January 6, 2003).
|
|
10.16*
|
Executive
Preventive Health Program, January 2003 (incorporated by reference from
the Exhibits to our Form 10-Q for the quarter ended February 23, 2003, SEC
File No. 001-06453, filed April 2, 2003).
|
|
10.17*
|
2005
Executive Officer Equity Plan as amended effective September 28, 2007
(incorporated by reference from the Exhibits to our Registration Statement
on Form S-8, Registration No. 333-122652, filed October 10, 2007); form of
option grant agreement under 2005 Executive Officer Equity Plan and form
of performance share unit award agreement under 2005 Executive Officer
Equity Plan (both incorporated by reference from the Exhibits to our
amended Form 8-K, SEC File No. 001-06453, filed October 2,
2007).
|
|
10.18*
|
Director
Compensation Arrangements (incorporated by reference from the Exhibits to
our Form 8-K, SEC File No. 001-06453, filed September 30,
2005).
|
|
10.19*
|
Executive
Financial Counseling Plan (incorporated by reference from the Exhibits to
our Form 10-K for the fiscal year ended May 29, 2005, SEC File No.
001-06453, filed August 9, 2005).
|
|
10.20*
|
Corporate
Aircraft Time Share Policy as amended effective May 26, 2008 (incorporated
by reference from the Exhibits to our Form 10-K for the fiscal year ended
May 25, 2008, SEC File No. 001-06453, filed July 23, 2008).
|
|
10.21*
|
National
Semiconductor Corporation Executive Officer Incentive Plan, as amended
effective July 15, 2009 (incorporated by reference from Appendix A to our
Definitive Proxy Statement on Schedule 14A, SEC File No. 001-06453, filed
August 11, 2009).
|
Page 97
of 98
|
10.22*
|
National
Semiconductor Corporation 2009 Incentive Award Plan, as adopted by the
Board of Directors on July 15, 2009 and approved by the stockholders on
September 25, 2009 (incorporated by reference from the Exhibit to our Form
8-K, SEC File No. 001-06453, filed October 1, 2009).
|
|
10.23*
|
Retirement
and Consulting Agreement, dated as of October 21, 2009, by and between
Brian L. Halla and National Semiconductor Corporation (incorporated by
reference from the Exhibits to our Form 8-K, SEC File No. 001-06453, filed
October 26, 2009).
|
|
10.24
|
Eleventh
Amendment to Credit Agreement (Multicurrency) dated as of October 26, 2009
by and between National Semiconductor Corporation and Bank of America,
N.A.
|
|
10.25
|
Credit
Agreement (Multicurrency) dated October 30, 2000 between National
Semiconductor Corporation and Bank of America, N.A.
|
|
21.1
|
List
of Subsidiaries and Affiliates.
|
|
23.1
|
Consent
of Independent Registered Public Accounting Firm (included in Part
IV).
|
|
24.1
|
Power
of Attorney.
|
|
31.1
|
Rule
13a-14 (a) /15d-14 (a) Certifications.
|
|
32.1
|
Section
1350 Certifications.
|
|
*
Management contract or compensatory plan or
arrangement.
|
|
Page 98
of 98