Attached files
| file | filename |
|---|---|
| EX-12.1 - EXHIBIT 12.1 - Lawson Software, Inc. | a2199377zex-12_1.htm |
| EX-32.2 - EXHIBIT 32.2 - Lawson Software, Inc. | a2199377zex-32_2.htm |
| EX-23.1 - EXHIBIT 23.1 - Lawson Software, Inc. | a2199377zex-23_1.htm |
| EX-31.2 - EXHIBIT 31.2 - Lawson Software, Inc. | a2199377zex-31_2.htm |
| EX-21.1 - EXHIBIT 21.1 - Lawson Software, Inc. | a2199377zex-21_1.htm |
| EX-32.1 - EXHIBIT 32.1 - Lawson Software, Inc. | a2199377zex-32_1.htm |
| EX-10.46 - EXHIBIT 10.46 - Lawson Software, Inc. | a2199377zex-10_46.htm |
| EX-10.47 - EXHIBIT 10.47 - Lawson Software, Inc. | a2199377zex-10_47.htm |
| EX-10.48 - EXHIBIT 10.48 - Lawson Software, Inc. | a2199377zex-10_48.htm |
| EX-31.1 - EXHIBIT 31.1 - Lawson Software, Inc. | a2199377zex-31_1.htm |
UNITED STATES
SECURITIES AND EXCHANGE COMMISSION
Washington, D.C. 20549
FORM 10-K
| ý | ANNUAL REPORT PURSUANT TO SECTION 13 OR 15(d) OF THE SECURITIES EXCHANGE ACT OF 1934 | |
FOR THE FISCAL YEAR ENDED MAY 31, 2010 |
||
OR |
||
o |
TRANSITION REPORT PURSUANT TO SECTION 13 OR 15(d) OF THE SECURITIES EXCHANGE ACT OF 1934 |
|
FOR THE TRANSITION PERIOD FROM TO |
||
Commission file number: 000-51942
![]()
LAWSON SOFTWARE, INC.
(Exact name of registrant as specified in its charter)
| DELAWARE (State or other jurisdiction of incorporation or organization) |
20-3469219 (I.R.S. Employer Identification Number) |
380 ST. PETER STREET
ST. PAUL, MINNESOTA 55102
(Address of principal executive offices)
(651) 767-7000
(Registrant's telephone number, including area code)
SECURITIES REGISTERED PURSUANT TO SECTION 12(b) OF THE ACT:
Common Stock, $0.01 Par Value Per Share
Preferred Stock Purchase Rights
SECURITIES REGISTERED PURSUANT TO SECTION 12(g) OF THE ACT: None
Indicate by check mark if the registrant is a well-known seasoned issuer, as defined in Rule 405 of the Securities Act. Yes ý No o
Indicate by check mark if the registrant is not required to file reports pursuant to Section 13 or Section 15(d) of the Act. Yes o No ý
Indicate by check mark whether the registrant (1) has filed all reports required to be filed by Section 13 or 15(d) of the Securities Exchange Act of 1934 during the preceding 12 months (or for such shorter period that the registrant was required to file such reports), and (2) has been subject to such filing requirements for the past 90 days. Yes ý No o
Indicate by check mark whether the registrant has submitted electronically and posted on its corporate Web site, if any, every Interactive Data File required to be submitted and posted pursuant to Rule 405 of Regulation S-T (§ 232.405 of this chapter) during the preceding 12 months (or for such shorter period that the registrant was required to submit and post such files). Yes o No o
Indicate by check mark if disclosure of delinquent filers pursuant to Item 405 of Regulation S-K is not contained herein, and will not be contained, to the best of Registrant's knowledge, in definitive proxy or information statements incorporated by Reference in Part III of this Form 10-K or any amendment to this Form 10-K. ý
Indicate by check mark whether the registrant is a large accelerated filer, an accelerated filer, a non-accelerated filer, or a smaller reporting company. See definition of "large accelerated filer," "accelerated filer" and "smaller reporting company" in Rule 12b-2 of the Exchange Act. (Check one):
| Large accelerated filer ý | Accelerated filer o | Non-accelerated filer o (Do not check if a smaller reporting company) |
Smaller reporting company o |
Indicate by check mark whether the registrant is a shell company (as defined in Rule 12b-2 of the Act). Yes o No ý
The aggregate market value of the voting and non-voting common stock held by non-affiliates of the registrant, based upon the closing sale price of Common Stock on November 30, 2009 as reported on the Nasdaq National Market, was $943,002,331.
The number of shares of the registrant's common stock outstanding on July 1, 2010 was 162,080,920.
DOCUMENTS INCORPORATED BY REFERENCE
Portions of the definitive Proxy Statement of Lawson Software, Inc. to be filed for the 2010 Annual Meeting of Stockholders, are incorporated by reference into Part III of this Annual Report on Form 10-K.
Form 10-K
Index
Forward-Looking Statements
In addition to historical information, this Annual Report on Form 10-K contains forward-looking statements including statements that contain risks and uncertainties. These forward-looking statements contain statements of intent, belief, or current expectations of Lawson Software and its management. The forward-looking statements are made in reliance upon the safe harbor provisions of the Private Securities Litigation Reform Act of 1995. The words "believe," "expect," "anticipate," "intend," "estimate," "forecast," "project," "should" and similar expressions are intended to identify "forward-looking statements" within the meaning of the Private Securities Litigation Reform Act of 1995. Forward-looking statements include, among others, statements about our future performance, the continuation of historical trends, the sufficiency of our sources of capital for future needs, the effects of acquisitions, the outcome of pending litigation and the expected impact of recently issued accounting pronouncements. The forward-looking statements are subject to certain risks and uncertainties that could cause actual results to differ materially from those anticipated in the forward-looking statements. Factors that might cause such a difference include, but are not limited to, those discussed in Item 1A, Risk Factors. Readers are cautioned not to place undue reliance on these forward-looking statements, which reflect management's opinions only as of the date hereof. The Company undertakes no obligation to revise or publicly release the results of any revision to these forward-looking statements. Readers should carefully review the risk factors described in this Annual Report on Form 10-K and in other documents we file from time to time with the Securities and Exchange Commission (SEC) including our Quarterly Reports on Form 10-Q.
Note Regarding Statistical Information
The Gartner Reports described herein under "Focusing on Specific Industries and the Mid-Market", (the "Gartner Reports") represent data, research opinion or viewpoints published, as part of a syndicated subscription service, by Gartner, Inc. ("Gartner"), and are not representations of fact. Each Gartner Report speaks as of its original publication date (and not as of the date of this Annual Report on Form 10-K) and the opinions expressed in the Gartner Reports are subject to change without notice.
When we refer to "we," "our," "us," "the Company," "Lawson" or "Lawson Software," we mean Lawson Software, Inc. and its subsidiaries. Unless otherwise indicated, references to our fiscal year mean the fiscal year ended on May 31 of such year.
General
Lawson Software, Inc. is a global provider of enterprise software. We provide business application software, consulting and maintenance to customers primarily in specific services, trade and manufacturing/distribution industries. We specialize in and target specific industries through our three reportable segments: S3 Strategic Industries segment which targets customers in the healthcare and public sector industries as well as the horizontal market for our human capital management product line, M3 Strategic Industries segment which targets customers in the equipment service management & rental, food & beverage and fashion industries, and our General Industries segment which includes our services industries (S3) customers and manufacturing & distribution industries (M3) customers which are in industries not included in our other two industries groups. Our goal is to be the global leader in our target markets, with a particular focus on meeting the needs of mid-market customers.
Our mission is to make our customers stronger. We offer a broad range of software applications and industry-specific solutions that help our customers improve their business processes and reduce
1
costs, resulting in better business or operational performance. Lawson solutions help automate and integrate business processes and promote collaboration among our customers and their partners, suppliers and employees. Through our consulting services, we help our customers implement, learn to use, upgrade and optimize their Lawson applications. Through our support services, we provide ongoing maintenance and assistance to our customers.
Lawson serves customers in three geographic regions: the Americas; Europe, Middle East, and Africa (EMEA); and Asia-Pacific, including Australia and New Zealand (APAC). We provide software in 16 languages to our customers in 68 countries and have approximately 3,900 employees throughout the world.
We generate revenues in three ways: 1) software license fees; 2) customer support and maintenance; and 3) consulting services. We market and sell our software and services primarily through a direct sales force, which is augmented by channel partners and resellers.
During fiscal 2009 and prior years, we viewed our operations and managed our business as one reportable segment: the development and marketing of computer software and related services including consulting, maintenance and customer support. Beginning in the first quarter of fiscal 2010, we reorganized our operations to provide greater focus on and better serve our targeted vertical markets. With this strategic organizational change, including workforce realignment, we determined that we have three reportable segments that align with our three industries groups: S3 Strategic Industries, M3 Strategic Industries and General Industries. See Note 14, Segment and Geographic Information, in Notes to Consolidated Financial Statements of this Form 10-K for additional information.
Lawson was founded and incorporated in 1975. In February 2001, we reincorporated in Delaware through a merger with our predecessor, Lawson Associates, Inc., a Minnesota corporation. We established a new Delaware corporation as our parent company as part of the acquisition of Intentia in April 2006.
On April 25, 2006, Lawson acquired Intentia International AB (Intentia), a Sweden-based provider of enterprise software, in an all-stock transaction valued at $460.9 million. The combination with Intentia increased Lawson's operational scale, product portfolio and geographic reach to compete in the global enterprise software market.
On January 11, 2010, we acquired Healthvision, a Dallas-based company providing integration and application technology and related services to hospitals and large healthcare organizations, for $160.0 million in cash. The acquisition of Healthvision is a strategic fit for our Lawson Healthcare customers within our S3 Strategic Industries segment. See Note 4, Business Combinations, in Notes to Consolidated Financial Statements of this Form 10-K for additional information.
We have made significant investments over the past few years in establishing our global support center in Manila, Philippines. This facility employs over 800 employees and provides our customers product development, consulting services, support and delivery at competitive global rates. In addition, the Manila team provides shared services to our IT, finance and other corporate functions.
Lawson has offices in 26 countries. Our principal executive office is at 380 Saint Peter Street, Saint Paul, Minnesota 55102-1302. Our telephone number is +1-651-767-7000. Our website is www.lawson.com. Other than the information expressly set forth in this annual report, the information contained or referred to on our website is not part of this annual report.
Environment
We face a competitive and challenging environment for sales of our software and services. Industry consolidation continues to be a primary factor shaping the selling environment. Our focus on specific industries and our low total cost of ownership continue to be our primary competitive differentiators in this environment.
2
Consolidation
In recent years, the enterprise software industry has consolidated, driven by mergers and acquisitions. This activity has included larger companies making acquisitions purely to acquire a customer base or to fill out their product lines, creating "horizontal" providers of most forms of enterprise software. It has also involved smaller companies joining forces to better compete in the market. Oracle Corporation has been the most active in our industry, acquiring approximately 50 companies since 2005. Of note, Oracle acquired PeopleSoft Inc. in 2005 (which had acquired J.D. Edwards & Company in 2003), Retek Inc. in 2005, Siebel Systems Inc. in 2006, Hyperion Solutions Corporation in 2007, BEA Systems Inc. in 2008 and Sun Micro Systems Inc. in January 2010. Other major acquisitions in our industry include Infor Global Solutions acquiring SSA Global in July 2006 and SAP AG purchasing Business Objects S.A. in 2008 and most recently their announced intent to acquire Sybase, Inc.
While this consolidation has created larger companies with broad product lines, it has also resulted in fewer competitors providing less choice for customers. As a result, we believe this consolidation has created an opportunity for Lawson to serve customers that may have budget or IT-resource constraints or are simply interested in another option to the two or three large vendors. For many customers, we present a competitive alternative to the large horizontal providers while maintaining an ability to compete with smaller niche providers.
Focusing on Specific Industries and the Mid-Market
Lawson strives to be a compelling choice to certain enterprise software customers. We believe that we have developed competitive advantages in serving several specific industries and mid-market companies. As a result, we target specific industries, including manufacturing & distribution, healthcare, public sector (U.S.), service industries, equipment service management & rental, food & beverage and fashion as well as the horizontal market for our human capital management product line. We believe an industry-specific focus is fundamental to our ability to help our customers achieve their desired results and derive greater value from their enterprise software investments.
Our industry-specific focus helps us develop industry-specific solutions, provide industry-specific expertise to sell and implement these solutions and offer industry-specific support on an ongoing basis. This industry orientation helps differentiate Lawson and enables us to present Lawson not only as a competitive alternative but also as a compelling choice.
At the same time, many of our products have broad application across multiple industries and are well-suited for customers outside our targeted industries. Many companies seek general enterprise software and not necessarily industry-specific solutions. Over the years, Lawson has developed an expertise serving mid-to-large size customers and this so-called mid-market now comprises the vast majority of our customer base. While the effects of the weakened global economy had a significant impact in fiscal 2009 and 2010 and will continue to be felt in fiscal 2011, we consider the mid-market to have growth potential for enterprise software during the next few years. Our "horizontal" products—human capital management, enterprise financial management, business intelligence and asset management—are well-suited for these types of mid-market opportunities. The Gartner Report "Forecast: Small and Midsize Business ERP Software, North America, 2008-2013" published in November, 2009 estimated that total revenues for the ERP Upper Midmarket in North America declined by 1.3% in 2009. However, the report also forecasts that same market segment to grow 4.6% in both 2010 and 2011 to over $1.4 billion in total revenues. The market recovery in Western Europe is expected to take longer. The Gartner Report "Forecast: Small and Midsize Business ERP Software, Western Europe, 2008-2013" published in February 2010 estimated that total revenues for the ERP Upper Midmarket in Western Europe declined by 3.0% in 2009. An additional decline of 0.5% is forecasted for 2010, before rebounding 4.1% to 1.36 billion Euros in 2011. Increasingly, businesses within this category are looking to buy, add to or replace the systems they are using to help manage
3
their financial, human resources, procurement, distribution or other business management processes. Within the Gartner North American forecast above, the human capital management submarket in North America also had a slight decline in 2009, but is forecasted to rebound quickly with growth rates in excess of 9% in both 2010 and 2011, reaching a total of $477.0 million in total revenues.
Competition
The enterprise software industry is intensely competitive, rapidly changing and significantly affected by new product offerings and other market activities. Some of our competitors have an advantage over us due to their larger customer bases, larger technical staffs, greater brand name recognition and greater financial and marketing resources. We believe the principal competitive factors affecting our market include:
- •
- product features, functionality, performance and price;
- •
- knowledge of a customer's industry and tailored solutions;
- •
- company stability, resources and reputation;
- •
- ease of integration and speed of implementation;
- •
- level of customer service;
- •
- sales and marketing efforts; and
- •
- new product and technology introductions.
We believe Lawson has competitive advantages over a number of our competitors. Some of these advantages include:
- •
- 35 years of experience serving mid-market customers;
- •
- low total cost of ownership;
- •
- industry-specific experience and expertise;
- •
- industry-focused solutions; and
- •
- openness and flexibility of our software architecture.
Lawson's most frequently encountered competitors are SAP AG and Oracle Corporation. Both are large, global vendors that are increasingly targeting mid-sized businesses, particularly as their traditional larger-customer market becomes saturated. We believe there is demand for a vendor like Lawson that can offer scalable applications that are simpler to implement and operate than the more complex applications of SAP and Oracle. Our focus is on delivering simpler solutions with lower total ownership costs including license fees, consulting services and on going customer support.
As a large, strong, global company, we believe Lawson can compete and win against SAP and Oracle, especially customer opportunities in mid-sized organizations or in our targeted industries. By increasing our scale and the range of our products, we believe Lawson also provides an alternative to attempts by Microsoft, another significant competitor, to move into the mid-market segment.
Lawson has also strengthened its competitive position by launching innovative new products like Lawson Smart Office, Lawson Enterprise Search, Lawson Human Capital Management, Lawson System Foundation and Lawson QuickStep solutions. Increasingly, we are generating applications using our Landmark Application Designer, a proprietary application design tool that significantly reduces the lines of software code in applications. We have also significantly improved our consulting and maintenance offerings to give our customers greater choice in how we install and support their Lawson applications and technology.
4
Products and Services
Software
Our software products include applications and technology. Applications consist of the Lawson S3 Enterprise Management System, the Lawson M3 Enterprise Management System and the Lawson Human Capital Management System. Technology consists of the Lawson Business Process Platform on which Lawson applications run and the Lawson User Productivity Platform which searches, collects and analyzes data from the Lawson applications as depicted below:
Lawson S3 Enterprise Management System—Lawson S3 applications help customers "staff, source and serve" in their respective markets. The Lawson S3 product line is specifically designed for services industries.
| Lawson S3 Enterprise Management System |
||
| Lawson Enterprise Financial Management | Budgeting, forecasting, project management and financial reporting software. | |
Key products: Financials, Project Accounting, Grant Management, Expense Management and Budgeting & Planning. |
||
Lawson Supply Chain Management |
Software to manage the entire supply chain—from procurement to delivery. |
|
Key products: Contract Management, Procurement, Requisitions Self Service, Procurement Punchout, Vendor Self Service, Strategic Sourcing, Distribution Management and Customer Self Service. |
||
Lawson Services Management |
Software to manage the time, work and delivery of services professionals. |
|
Key products: Project Portfolio Management, Services Automation and Time Management. |
||
5
| Industry-Tailored Solutions | Using our industry expertise in targeted industries to provide functionality to address specific business needs of these industries (i.e. Surgical Instrument Management, Healthcare Integration Software, Health Information Exchange Software, Clinical Software, Patient Administration and Operations Software, Par and Cycle Counting, Receiving and Delivery, Performance Management for Healthcare, Retail Operations, and Grant Management). |
Lawson M3 Enterprise Management System—Lawson M3 applications help customers who "make, move and maintain" goods or equipment in their markets. The Lawson M3 product line is geared for manufacturing and trade-oriented businesses facing resource constraints and whose processes are often complex and industry-specific.
| Lawson M3 Enterprise Management System |
||
| Lawson Financial Management | Financial accounting and planning software. | |
Key products: Accounts Receivable, Budgeting, Cost Accounting, Cash Flow Management, General Ledger, Product Costing and Risk Management. |
||
Lawson Manufacturing Operations |
Software for discrete manufacturing, process manufacturing and mixed-mode manufacturing environments. |
|
Key products: M3 Manufacturing Execution and M3 Product Data Management. |
||
Lawson Supply Chain Management |
Forecasting, planning and execution software. |
|
Key products: Procurement, Supply Chain Execution and Supply Chain Planning. |
||
Equipment Service Management & Rental |
Software specifically designed for equipment manufacturers, distributors and rental companies who focus on after-sales service and continuous customer care. |
|
Key products: Equipment and Component Control, Preventative Maintenance, Work Order Processing, Maintenance and Performance Costing, Maintenance Customer Order Processing, Maintenance Planning Board, Diagnostics Management and Vehicle Operations Management. |
||
Lawson Enterprise Asset Management |
Asset management software. |
|
Key products: Enterprise Asset Management, Asset Performance Management, Maintenance Management, Asset Data Management, Preventative Maintenance, Work-order Control, Diagnostics Management and Statistical Analysis. |
||
Lawson Customer Sales and Service |
Customer relationship management software. |
|
Key products: Service Management and Rental Management. |
||
Lawson Human Capital Management (HCM) Products and Solutions—Applications in the Lawson HCM product line provide solutions for customers to strategically manage their workforce. The Lawson
6
HCM product line is a full suite of products that helps customers transform the role of the Human Resources (HR) professional from an administrative and policy enforcing role to that of a strategic business partner.
| Lawson Human Capital Management |
||
| Lawson Talent Management | Software to manage, develop and retain employees. | |
Key products: Lawson Talent Acquisition, Lawson Goal Management, Lawson Performance Management, Lawson Compensation Management, Lawson Learning and Development, Lawson Succession Management and Lawson Global Human Resources. |
||
Lawson Human Resource Management |
Software to manage the HR processes related to employees. |
|
Key products: Lawson Absence Management, Lawson Benefits Administration, Lawson e-Recruiting, Lawson Employee and Manager Self-Service, Lawson Human Resources, Lawson Payroll, Lawson Performance Management for Healthcare, Lawson Personnel Administration, Lawson Resource Navigator, Lawson Teacher Contract Administration and TalentView of Performance. |
||
Lawson Workforce Management |
Software that automates time intensive staffing and scheduling tasks. |
|
Key products: Lawson Scheduling and Staffing, Lawson Scheduling and Staffing for Casinos, Lawson Scheduling and Staffing for Healthcare and Lawson TimeOff Planner for Healthcare. |
||
Lawson Technology—The platform to run all Lawson applications and tools to search, collect and analyze data.
| Lawson Business Process Platform |
||
| Lawson Business Process Management | Add-ons to almost any Lawson application to tailor the application to a customer's specific needs. These tools include Business Process Automation and Workflow Tools, business-to-business communication and application-to-application Integration Tools, Development Tools and System Tools. | |
S3 Key products: Lawson ProcessFlow Integrator and Lawson Design Studio. |
||
M3 Key products: IBrix Design, Collaborator, Web Services, Application Program Interface, Automated Document Capture and EDI Management. |
||
Lawson S3 System Foundation |
The technical foundation required to run Lawson S3 applications. Includes open, standards-based technology that consolidates Lawson runtime technology with IBM technology and middleware. |
|
7
| Key products: Landmark Technology and Core Technology (Application Maintenance Toolset, Security, Portal, ProcessFlow Standard, ADA Section 508 Accessibility). | ||
Lawson M3 System Foundation |
The technical foundation required to run Lawson M3 applications. |
|
Key products: Workplace Management Applications, Application Foundation and Web Application Foundation. |
| Lawson User Productivity Platform |
||
| Lawson S3 Enterprise Performance Management | Role-based business intelligence software that can help improve and speed decision-making throughout an enterprise. | |
Key products: Lawson Business Intelligence, Lawson Business Consulting Services and Lawson ProcessFlow Professional. |
||
Lawson M3 Enterprise Performance Management |
Business intelligence and opportunity assessment software that can identify strategic business improvement opportunities and speed decision-making throughout an enterprise. |
|
Key products: Opportunity Analyzer, Business Intelligence for M3, M3 Business Performance Management and M3 Analytics. |
||
Lawson Smart Office |
An innovative user interface that redefines the user experience with Lawson and non-Lawson applications. Lawson Smart Office allows users to directly access Lawson and Microsoft applications and update data pervasively and instantly across the applications. Lawson Smart Office enhances user productivity. |
|
Lawson Enterprise Search |
Lawson Enterprise Search redefines the search capability for structured and unstructured data across the Lawson S3 enterprise system, Lawson Business Intelligence, the user's desktop, and the user's personal history such as comments entered in Microsoft Office applications. |
|
Maintenance and Customer Support
Our customer support programs include software upgrades, updates and corrections for the software under maintenance, as well as various levels of support including access to our knowledge base and the Lawson support team, technical advice, and application management. These programs, Lawson Bronze and Lawson Silver maintenance agreements, are comprehensive customer care programs which entitle our customers to various levels of support to meet their specific needs. Our maintenance and customer support offerings are delivered through the Lawson Global Support organization operating from our state-of-the-art support centers around the world.
Consulting Services
Our consulting services range from the initial assessment and planning of a project to the actual implementation and post implementation of a project, including optimizing a customer's use of their Lawson software. We also provide training and learning tools via Lawson Learning to help our customers become proficient in using Lawson software quickly and effectively.
8
Cloud Services
Announced in the spring of 2010, Lawson Cloud Services brings the benefits of cloud computing to external (off-premise) and internal (on-premise) deployments of Lawson software applications.
Lawson External Cloud Services combines full-function ERP software from Lawson with industry-leading cloud technology from Amazon Web Services. Lawson External Cloud Services includes our Lawson S3 Enterprise Management System, Lawson M3 Enterprise Management System and Lawson Talent Management. As part of the Lawson External Cloud Services offering, Lawson's flexible pricing gives our customers the choice of paying for their software by subscription or perpetual license.
Lawson Internal Cloud Services brings the benefits of software virtualization and cloud computing to our customers who want an on-premise deployment of their Lawson solutions. Lawson Internal Cloud Services utilizes the innovative Lawson Cloud Console and the first two of what Lawson plans to be a series of "virtual appliances." The first virtual appliances are Lawson Smart Office and Lawson Enterprise Search. Virtual Appliances are "pre-assembled" software bundles that eliminate the arduous, time-consuming process of manually installing software.
Sales and Marketing
We market and sell our software and services solutions primarily through a direct sales force, augmented by strategic alliances with systems integrators and resellers. Our direct sales force and services organizations are aligned with our strategy of providing industry-tailored applications. Within each industry, we have a sales team dedicated to prospective customers and another dedicated to existing customers. We also have regional sales teams that focus on specific geographic territories. Our sales and service offices are located in three geographic regions: the Americas, EMEA and APAC.
In addition to our direct sales teams, we enter into strategic alliances with systems integrators and resellers to benefit from our partners' resources, expertise and customer base. Business partner alliances allow us to expand our market presence through increased awareness of our software applications within our partners' organizations and customer bases, and through their personnel who are trained to implement our software. Our channel partners market and promote our software products and typically provide implementation services to their end-users. Channel partners generate sales leads, make initial customer contacts, and assess needs prior to our introduction. In addition, some of our channel partners engage in customer support and localization of our products. We also engage in joint marketing programs, presentations at seminars, attendance at trade shows, and the hosting of conferences with many of our business partners.
We also use application service providers (ASPs) to distribute our products in a hosted environment. ASPs allow us to reach small-to-medium sized businesses that prefer a hosted solution. Our software's architecture is easily distributed over the Internet and is highly scalable to serve many customers. It also supports multi-tenancy, which lets ASPs securely host multiple customers on a single set of our applications.
Research and Development
Since our inception, we have made substantial investments in software product development. We believe that timely development of new software applications, enhancements to existing software applications and the acquisition of rights to sell or incorporate complementary technologies and products into our software offerings are essential to maintain our competitive position in the market. The business application software market is characterized by rapid technological change, frequent introductions of new products, changes in customer demands and rapidly evolving industry standards.
9
We are committed to continued investment in R&D to enhance our existing products as well as developing new applications using our Landmark development tool for our Lawson S3, Lawson M3 and Lawson Human Capital Management product lines.
Our total research and development expenses were $90.3 million, $82.4 million and $85.4 million in fiscal 2010, 2009 and 2008; respectively. As of May 31, 2010, our research and development organization consisted of approximately 1,000 employees. See Item 7, Management's Discussion and Analysis of Financial Condition and Results of Operations, for further discussion of R&D expenses.
Trademarks
"Lawson" and "Lawson Software" are registered trademarks in the U.S. and the European Union. Other trademarks and trade names appearing in this document are the property of their respective holders.
Intellectual Property and Product Liability
We regard certain aspects of our internal operations, software and documentation as proprietary, and rely on a combination of contract, copyright, patent, trademark and trade secret laws and other measures, including confidentiality agreements, to protect our proprietary information. We currently hold 11 patents in the U.S. Existing copyright laws afford only limited protection. We believe that because of the rapid pace of technological change in the computer software industry, trade secret and copyright protection is less significant than factors such as the knowledge, ability and experience of our employees, frequent software product enhancements and the timeliness and quality of support services. We cannot guarantee that these protections will be adequate, or that our competitors will not independently develop technologies that are substantially equivalent or superior to our technology. Historically, we have provided our customers source code for many of our products. We may elect to distribute only object code in the future. In either case, we will permit customers to obtain access to our other source code through a source code escrow arrangement. Access to our source code may increase the likelihood of misappropriation or other misuse of our intellectual property. In addition, the laws of certain countries in which our software products are, or may be licensed, do not protect our software products and intellectual property rights to the same extent as the laws of the U.S. and Sweden.
We do not believe our software products, third-party software products we offer under sublicense agreements, our trademarks, or other Lawson proprietary rights infringe the property rights of third parties. However, we cannot guarantee that third parties will not assert infringement claims against us with respect to current or future software products or that any such assertion may not require us to enter into royalty arrangements or result in costly litigation. As described in this report under Item 3, Legal Proceedings, we are currently defending three separate and unrelated patent infringement lawsuits in the U.S. Under the license agreements with our customers, we agree to indemnify our customers for third-party claims that our products infringe the intellectual property rights of those third parties.
We are also exposed to product liability risks under applicable country and state laws. We generally attempt to limit our exposure to product liability claims with customers as part of our license agreements. However, local laws or unfavorable judicial decisions might diminish or invalidate the scope of these limitations.
Employees
As of May 31, 2010, we had approximately 3,900 employees, including approximately 600 in sales and marketing, approximately 1,000 in research and development, approximately 1,700 in services and customer support and approximately 600 in administration. None of our employees in the U.S. are
10
represented by a labor union. We are party to a collective labor agreement applicable to our employees in Sweden and in certain other international subsidiaries workers' councils represent our employees.
Executive Officers
The following sets forth our executive officers as of June 30, 2010, their age, position and a brief description of their business experience:
Name
|
Age | Position | |||
|---|---|---|---|---|---|
Harry Debes |
59 | President, Chief Executive Officer, Director | |||
Stefan Schulz |
43 | Senior Vice President, Chief Financial Officer | |||
Colin Balmforth |
49 | Group Executive Vice President, General Industries and Global Support | |||
Jeff Comport |
56 | Senior Vice President, Product Management | |||
Dean J. Hager |
43 | Group Executive Vice President, S3 Industries | |||
Bruce B. McPheeters |
55 | Senior Vice President, Secretary and General Counsel | |||
Paul Parish |
60 | Senior Vice President, Chief Information Officer | |||
Scott Swoish |
48 | Executive Vice President, Global Services | |||
Guenther Tolkmit |
58 | Senior Vice President, Product Development | |||
Kristin Trecker |
45 | Senior Vice President, Human Resources | |||
Eric Verniaut |
44 | Executive Vice President, Industry Group | |||
Travis White |
60 | Senior Vice President, Marketing | |||
Harry Debes has served as our president and chief executive officer and as a director since June 2005. From November 2003 until June 2005, Mr. Debes was president and chief executive officer of SPL Worldgroup, a leading provider of enterprise software to the electric utility industry. From May 2001 until joining SPL Worldgroup, he was employed by JD Edwards & Co., an enterprise software company, where he served as senior vice president Americas until JD Edwards was acquired by Peoplesoft, Inc. in August 2003. From 1990 until May 2001, Mr. Debes was employed by GEAC Computer Corporation, an enterprise software company. While working for GEAC, Mr. Debes held a variety of positions including managing director of GEAC Asia-Pacific and president of GEAC Enterprise Solutions for the Americas.
Stefan Schulz has served as senior vice president and chief financial officer since January 2010. From October 2007 through December 2009 he served as senior vice president of finance and as senior vice president—global controller from October 2005 until September 2007. In addition, Mr. Schulz served as our interim chief financial officer from August 2006 until October 2006 and has served as our principal accounting officer since October 2005. From November 1993 until joining us in October 2005 he was employed by BMC Software, Inc. a provider of enterprise management solutions that empower companies to automate their IT and align it to the needs of the business. While at BMC Software, he served as corporate controller from February 2001 to May 2004 and most recently as vice president of revenue operations. Prior to joining BMC, Mr. Schulz was employed by Arthur Andersen LLP in their audit and business advisory practice.
Colin Balmforth has served as our group executive vice president of general industries and global support since June 2009. From December 2007 until June 2009, Mr. Balmforth served as our senior vice president of global support. From September 2005 until December 2007, Mr. Balmforth was vice president of professional services for Intelliden Software, a provider of intelligent networking software solutions. From July 2003 until September 2005, Mr. Balmforth was chief operating officer and executive vice president for Conexus Partners, an advisory consulting firm for the enterprise resource planning (ERP) software market. From 1998 to 2003, Mr. Balmforth held several senior management positions with Peoplesoft, Inc. and J.D. Edwards Company, including global responsibility for the support business functions at those ERP software companies. From 1984 until 1998, Mr. Balmforth
11
held various support and services management positions with several software companies. Mr. Balmforth was based in Europe from 1984 until March 2000.
Jeffrey Comport has served as senior vice president of product management since November 2009. Mr. Comport provides strategic oversight and coordination across all the Lawson S3, M3, Strategic Human Capital Management, and technology product lines to develop synergies and deliver the products that best meet the requirements of our customers. He came to Lawson from Gartner, a leading technology business research and advisory company, where he was vice president-distinguished analyst responsible for defining and delivering Gartner's strategy and governance research. Mr. Comport spent 15 years at Gartner, beginning as a research director and eventually becoming chief of research and a member of the senior research board. Earlier in his career, he held executive product strategy roles at Integral Systems and Criterion Inc.
Dean Hager has served as our group executive vice president of S3 industries since June 2009. From April 2006 until June 2009, Mr. Hager served as our senior vice president of product management. Mr. Hager served as our chief product officer from June 2004 until April 2006, executive vice president emerging markets from June 2003 until June 2004, executive vice president global products division from February 2001 until May 2002, executive vice president worldwide marketing from June 2000 to February 2001, vice president, e-business marketing from June 1999 until June 2000 and director of marketing for our former AS/400 business unit from May 1998 until June 1999. From March 1989 to May 1998, Mr. Hager was employed by IBM, where he held several management positions, with his last position held as senior program manager with its server products division.
Bruce McPheeters has served as corporate secretary since October 1999, general counsel since April 2000 and senior vice president since June 2002. Mr. McPheeters served as vice president administration from April 2000 until May 2002 and corporate counsel from September 1999 until April 2000. From 1981 until joining Lawson in September 1999, Mr. McPheeters was a business lawyer in private practice, focusing primarily in the areas of intellectual property, securities and mergers and acquisitions of privately and publicly held companies. From December 1995 until September 1999, he was employed by the law firm of Gray, Plant, Mooty, Mooty & Bennett, P.A.
Paul Parish has served as senior vice president and chief information officer in January 2010. Before joining Lawson, Mr. Parish had been vice president of financial and administrative systems for Catholic Health Initiatives since 2004. At the Denver-based health system, which has approximately 66,000 employees and operates 75 hospitals, 40 long-term care, assisted-living and residential facilities and two community health-services organizations in 19 states, he was responsible for the strategic and operational information technology needs of the nonclinical part of the information technology applications. He has more than 30 years of executive leadership experience in the development of business systems, processes, organizational infrastructures and winning cultures. From 1988 to 2003, he held a variety of leadership roles with Hitachi Consulting LLP (formerly the management consulting group of Grant Thornton), a global business and IT consulting company of Hitachi Ltd. Prior to Hitachi, he held consulting and management roles at Deloitte Consulting and Jewel Companies.
Scott Swoish has served as executive vice president of global services since June 2009. From February 2008 until June 2009, Mr. Swoish served as senior vice president of corporate development. Mr. Swoish served as senior vice president of global sales operations from January 2007 until February 2008. From December 2003 until joining Lawson in January 2007, he was senior vice president of global consulting and sales operations for SPL WorldGroup Inc. and served as president of the Manila delivery resource center and oversaw partner alliances. Before joining SPL, Mr. Swoish held a number of senior management positions in finance and services with PeopleSoft/J.D. Edwards, where he worked from January 2002 until November 2003, as well as at GEAC Enterprise Solutions and Dun & Bradstreet Software.
12
Guenther Tolkmit has served as senior vice president of product development since April 2006. Mr. Tolkmit served as the chief technology officer of Intentia from September 2005 until the time of the merger with Lawson in April 2006 and vice president support and delivery for Intentia from March 2005 until August 2005. Before joining Intentia, Mr. Tolkmit served as chief operating officer and chief technology officer for Parsytec AG from 2001 until February 2005. Mr. Tolkmit has also served in a number of senior roles at SAP AG including vice president of technology management, worldwide chief marketing officer and senior vice president of SAP Ventures. He had formerly held management positions at Software AG, Cullinet Inc. and Siemens AG.
Kristin Trecker has served as senior vice president of human resources since April 2006 and vice president of human resources from June 2004 until April 2006. Prior to assuming that position, Ms. Trecker held a variety of roles within the Lawson human resources organization since 1994. Prior to joining Lawson in 1994, Ms. Trecker was employed in a variety of roles in the healthcare and gaming industries.
Eric Verniaut has served as executive vice president of M3 industries since June 2009. From November 2008 until June 2009, Mr. Verniaut served as executive vice president of professional services. From April 2006 until October 2008, he was chief executive officer of T-Systems North America and chairman Americas region of T-Systems Enterprise Services, a subsidiary of the Deutsche Telekom Group. From 1992 until April 2006, he held various international leadership positions at gedas Group, an IT and consulting firm, where he was instrumental in internationalizing the professional services organization.
Travis White has served as senior vice president, marketing since March 2006. From April 2005 to March 2006, Mr. White was retired and pursued his interest in bicycling. From April 2003 to April 2005, Mr. White was vice president, marketing at Datria. Mr. White served as a consultant to small software companies from June 2002 to April 2003. From 1993 until June 2002, Mr. White held various executive roles at J.D. Edwards. From 1999 through 2001, he was based in Paris as the J.D. Edwards' vice president for marketing in Europe, Middle East and Africa. Mr. White has 20 years experience in shaping corporate strategies and delivering marketing messages.
Financial Information about Geographic Areas
For financial information about geographic areas see Note 14, Segment and Geographic Information, in Notes to Consolidated Financial Statements of this Form 10-K.
Available Information
We make available, free of charge, on our website (www.lawson.com) our annual reports on Form 10-K, quarterly reports on Form 10-Q, current reports on Form 8-K and any amendments to those reports filed or furnished pursuant to Section 13(a) or 15(d) of the Securities Exchange Act of 1934, as amended, as soon as reasonably practicable after we have electronically filed or furnished such materials to the Securities and Exchange Commission. The information posted on our website is not incorporated into this Annual Report on Form 10-K.
13
Factors That May Affect Our Future Results or the Market Price of Our Stock
We operate in a rapidly changing environment that involves numerous uncertainties and risks. Investors evaluating our company and our business should carefully consider the factors described below and all other information contained in this Annual Report on Form 10-K. This section should be read in conjunction with the Consolidated Financial Statements and Notes thereto and Management's Discussion and Analysis of Financial Condition and Results of Operations included in this report. Any of the following factors could materially harm our business, operating results and financial condition and/or negatively affect our stock price. Additional factors and uncertainties not currently known to us or that we currently consider immaterial could also harm our business, operating results and financial condition. We may make forward-looking statements from time to time, both written and oral. We undertake no obligation to revise or publicly release the results of any revisions to these forward-looking statements based on circumstances or events which occur in the future. The actual results may differ materially from those projected in any such forward-looking statements due to a number of factors, including those set forth below and elsewhere in this report.
The weakened global economy has negatively impacted our contracting activity and revenue, required that we reduce our expenses and imposed risks on our business.
Some prospective and existing customers have cancelled, delayed or downsized software purchases and implementation projects because of the adverse economy and their internal budget constraints. Some customers may also experience difficulty in paying us for previously purchased products and services. The adverse economic environment has also intensified the difficulty of forecasting software license and services revenue due, in part, to the lengthening and uncertainty of the sales cycle. A decrease in licensing activity will typically lead to a decrease in services revenue in the same or subsequent quarters. Lower licensing activity will also lower new maintenance revenue since maintenance fees for new product licenses are based on the amount of associated license fees. We took steps in fiscal 2009 and 2010 to reduce headcount and lower expenses. Despite our efforts to focus on new sales of products and services and to manage our expenses, there is risk that we will not be able to achieve our business plan during this difficult global economic environment.
Economic, political and market conditions can adversely affect our revenue growth and operating results.
The uncertainty posed by the weakened global economy, volatile credit markets, escalating energy prices, terrorist activities, potential pandemics, natural disasters and related uncertainties and risks and other geopolitical issues may impact the purchasing decisions of current or potential customers. Because of these factors, we believe the level of demand for our products and services and projections of future revenue and operating results, will continue to be difficult to predict. These geopolitical risks could also impede employee travel and our business operations in any affected regions.
We face large, established competitors, specialized competitors and substantial price competition.
We compete with Oracle Corporation, SAP AG, Microsoft Corporation and other larger software companies that have advantages over us due to their larger customer bases, greater name recognition, long operating and product development history, greater international presence and substantially greater financial, technical and marketing resources. If customers or prospects want to reduce the number of their software vendors, they may elect to purchase competing products from Oracle, SAP, or Microsoft since those larger vendors offer a wider range of products. Furthermore, Oracle is capable of bundling its software with its database applications, which underlie a significant portion of our installed
14
applications. We also compete with a variety of more specialized software and services vendors, including:
- •
- single-industry software vendors;
- •
- human resource management software vendors;
- •
- financial management software vendors;
- •
- manufacturing software vendors;
- •
- merchandising software vendors;
- •
- services automation software vendors;
- •
- software integrators and outsourced services providers; and
- •
- internet (on demand) software vendors.
Some competitors offer payment terms, contractual warranties, implementation terms or guarantees that are more favorable to customers and prospects. Competitors may entice our customers and prospects to switch software vendors by offering those customers or prospects free or heavily discounted products or services, and other more favorable contract terms. We may be unable to continue to compete successfully with new and existing competitors without lowering prices or offering other favorable terms to customers that lower our margins and increase our risks. We expect competition to persist and intensify, which could negatively impact our operating results and market share.
We may have exposure to potential impairment charges related to our goodwill and acquired intangible assets.
We have made several acquisitions over the past few years, primarily the acquisition of Intentia in April 2006 and Healthvision in January 2010. As a result of these acquisitions, we have recorded on our balance sheet approximately $525.6 million of goodwill and $159.7 million of intangible assets, net of accumulated amortization, as of May 31, 2010. We may incur impairment charges related to goodwill or our acquired intangible assets if we determine that the fair value of the goodwill and/or our acquired intangible assets is less than their current carrying value. In general, this could occur if the fair value of our applicable reporting units declines to an amount below the carrying value of such reporting units, or if we do not anticipate that the acquired intangibles will generate future cash flows in-line with our expectations as established at the date of acquisition. In fiscal 2010, we reorganized our operations into vertically focused operating segments resulting in our allocation of goodwill to each of our separate reporting units. As a consequence, we are required to test for potential goodwill impairment at the reporting unit levels. Recording an impairment charge related to our goodwill or acquired intangible assets could have a material adverse impact on our results of operations. See Note 2, Summary of Significant Accounting Policies—Goodwill and Other Intangible Assets, in Notes to the Consolidated Financial Statements of this Form 10-K for further discussion.
Our revenues, and in particular our software license revenues, vary each quarter and are difficult to predict.
Revenues from license fees in any quarter depend substantially upon our licensing activity with new and existing customers, and our ability to recognize revenues in that quarter under our revenue recognition policies. A significant portion of our future revenue is dependent upon our existing installed base of customers continuing to license additional products, as well as purchasing consulting services and renewing their annual maintenance agreements. If we do not continue to develop or acquire new products, licensing activity with existing customers will decline. Licensing activity for our products drives maintenance and services revenues because we sell maintenance and services for only our products. A decrease in licensing activity will typically lead to a decrease in services revenue in the
15
same or subsequent quarters. If we do not have sufficient new licensing activity each year, our maintenance revenue and profit for the following year will decline because new customers or sales of additional products to existing customers are needed to offset the percentage of existing customers who scale back their businesses, reduce licenses and maintenance contracts, are acquired, or otherwise choose not to renew annual maintenance. Our sales force and marketing team must continue to generate sales leads among existing customers and prospective customers. When we "qualify" a lead, that lead becomes part of our sales "pipeline." If our pipeline does not continue to grow in our different markets and geographies, our revenues will eventually decline. The rate at which we convert our pipeline into actual sales can vary greatly from year to year for the following reasons:
- •
- The period between initial customer contact and a purchase by a customer may vary and can be more than one year. During
the sales cycle, prospective customers may decide not to purchase or may scale down purchases because of competing offers, budgetary constraints or changes in the prospect's management, strategy,
business or industry. Increasingly, customer or prospect organizations are taking more steps to approve the purchase of our products and services. Often times, we must wait for a customer or
prospect's board of directors to approve a purchase. These added approval requirements can delay the sales cycle and jeopardize the likelihood of completing the sale.
- •
- A substantial number of our existing and prospective customers make their purchase decision within the last few weeks or
days of each quarter. A delay or deferral in a small number of large new software license transactions could cause our quarterly license revenue to fall significantly short of our predictions.
- •
- Prospective customers may decline or defer the purchase of new products if we do not have sufficient customer references
for those products.
- •
- New products or technologies, software industry mergers and other software industry news may create uncertainty and cause customers and prospective customers to cancel, postpone or reduce capital spending for our products.
Because a substantial portion of our software license revenue contracts are completed in the latter part of a quarter, and our cost structure is largely fixed in the short term, unexpected revenue shortfalls and deferrals have a disproportionately negative impact on our profitability.
We may not retain or attract customers if we do not develop new products and enhance our current products in response to technological changes and competing products.
The enterprise software market is faced with rapid technological change, evolving standards in computer hardware, software development, communications and security infrastructure, and changing needs and expectations of customers. Building new products and service offerings requires significant investment in development. A substantial portion of our research and development resources are devoted to regulatory and maintenance requirements and product upgrades that address new technology support. These demands put significant constraints on our resources available for new product development. We also face uncertainty when we develop or acquire new products because there is no assurance that a sufficient market will develop for those products.
We may be unable to identify or complete suitable acquisitions and investments; and any acquisitions and investments we do complete may create business difficulties or dilute earnings.
As part of our business strategy, we intend to pursue strategic acquisitions in the future. We may be unable to identify suitable acquisitions or investment candidates. Even if we identify suitable candidates, we cannot provide assurance that we will be able to make acquisitions or investments on commercially acceptable terms. If we acquire a company, we may incur losses in the operations of that
16
company and we may have difficulty integrating its products, personnel and/or operations into our business. In addition, its key personnel may decide not to work for us. These difficulties could disrupt our on-going business, distract our management and workforce, increase our expenses and adversely affect our operating results. We may also incorrectly judge the value or worth of an acquired company or business. Furthermore, we may incur significant debt or issue equity securities to pay for future acquisitions or investments. The issuance of equity securities may be dilutive to our stockholders. If the products of an acquired company are not successful, those remaining assets could become impaired, which may result in an impairment loss that could materially adversely impact our financial position and results of operations.
Competitors may take advantage of our limited intellectual property protection.
We consider certain aspects of our internal operations, software and documentation to be proprietary, and rely on a combination of contract, copyright, trademark and trade secret laws to protect this information. In addition, we currently hold 11 patents in the U. S. Copyright laws afford only limited protection because those laws do not protect product ideas. In addition, when we license our products to customers, we provide source code for many of our products. Customers may also access source code through a source code escrow arrangement. Access to our source code could provide an opportunity for companies to offer competing maintenance and product modification services to our customers. Defending our intellectual property rights is time consuming and costly.
Others may claim that we infringe their intellectual property rights.
Many participants in the technology industry, and patent holding companies who have no independent product revenue, have an increasing number of patents and have frequently demonstrated a readiness to take legal action based on allegations of patent and other intellectual property infringement. These types of claims are time consuming and costly to defend. As described in this report under Item 3, Legal Proceedings, we are currently defending three separate and unrelated patent infringement lawsuits in the U.S. If a successful claim is made against us and we fail to develop or license a substitute technology, our business, results of operations, financial condition or cash flows could be adversely affected.
Our products are deployed in large and complex systems and may contain defects or security flaws or be implemented incorrectly.
Because our products are deployed in large and complex systems, they can only be fully tested for reliability when deployed in networks for long periods of time. Our software programs may contain undetected defects when first introduced or as new versions are released. Our customers might encounter difficulties with the implementation of our products, experience corruption of their data or encounter performance or scaling problems only after our software programs have been deployed. The services needed for implementing our products are also complex, and require knowledge and cooperation between both the customer's and the service provider's teams. As a consequence, from time to time we have received customer complaints or been sued. In addition, our products are combined with products from other vendors. As a result, should problems occur, it may be difficult to identify the source of the problem. Software and data security are becoming increasingly important because of regulatory restrictions on data privacy and the significant legal exposures and business disruptions stemming from computer viruses and other unauthorized entry or use of computer systems. We may not be able to avoid or limit liability for disputes relating to product performance, software security or the provision of services. Product defects and security flaws could expose us to product liability and warranty claims and harm our reputation, which could impact our future sales of products and services.
17
The success of our recently announced Lawson Cloud Services offering could be adversely impacted by deployment problems, security breaches, or system or telecommunication disruptions.
Lawson Cloud Services is new and could encounter unexpected problems. These problems could be attributable to our products, third party software, telecommunications failures, security breaches, or the cloud technology from Amazon Web Services or other hosting providers. We are in the early stages of rolling out this new offering and have not yet established the range of customer references that will be needed for Lawson Cloud Services to be a success. Industry acceptance of cloud computing is still forming. Since cloud technology is new and requires that customer data reside outside of a customer's "fire wall" of protection, many prospective customers could reject or delay adoption, thereby limiting the potential for this new offering. Other limitations include product and network scalability for large numbers of users. We must also renegotiate some of our third-party software contracts so that we can deploy the Lawson Cloud Services using an instance of the entire range of required software, including the software owned by those third parties. These types of risks could adversely affect our adoption and renewal rates for Lawson Cloud Services and adversely impact our ability to achieve our business plan and forecasted financial results.
Deterioration in our relationships with resellers, systems integrators and other third-parties that market and sell our products could reduce our revenues.
Our revenue growth will depend, in part, on adding new partners to expand our sales channels, as well as leveraging our relationships with existing partners. If our relationships with these resellers, system integrators and strategic and technology partners deteriorate or terminate, we may lose sales and marketing opportunities. Some current and potential customers rely on third-party systems integrators to implement and manage new and existing applications. These systems integrators may increase their promotion of competing enterprise software applications, or may otherwise discontinue their relationships with us.
Because we do not own all of the products that we license, we rely on our continued relationships with other software suppliers.
We license third-party software products that we incorporate into, or resell with, our own software products. For example, we incorporate in many of our products software supplied by Micro Focus International, Inc. and StreamServe, Inc. We also have reseller and alliance relationships with IBM, Business Software Incorporated and other software suppliers businesses that allow us to resell their offerings with our products and services. These relationships and other technology licenses are subject to periodic renewal and may include minimum sales requirements. A failure to renew or early termination of these relationships or other technology licenses could adversely impact our business.
International sales and operations subject us to risks that can adversely affect our operating results.
We derive a substantial portion of our revenues, and have significant operations, outside of the U.S. Our international operations include software development, sales, customer support and administration. We face challenges in managing an organization operating in various countries, which can entail longer payment cycles and difficulties in collecting accounts receivable, fluctuations in currency exchange rates, overlapping tax regimes, difficulties in transferring funds from certain countries and reduced protection for intellectual property rights in some countries. We must comply with a variety of international laws and regulations, including trade restrictions, local labor ordinances, and import and export requirements.
18
We may experience foreign currency gains and losses.
We conduct a significant portion of our business in currencies other than the U.S. Dollar. Our revenues and operating results are affected when the U.S. Dollar strengthens or weakens relative to other currencies. Changes in the value of major foreign currencies, particularly the Swedish Krona, the Euro, the Canadian Dollar, the British Pound as well as the Norwegian Krona relative to the U.S. Dollar can significantly affect our revenues and operating results. Recognized balance sheet exposures are partially offset by forward currency contracts that we purchase. Net foreign currency transaction gains and losses, resulting primarily from recognized balance sheet exposures, are recorded within earnings in the period incurred.
Litigation may adversely affect our business, financial condition and results of operations.
We are subject to legal and regulatory requirements applicable to our business and industry throughout the world. We are subject to various legal proceedings and the risk of litigation by employees, customers, patent owners, suppliers, stockholders or others through private actions, class actions, administrative proceedings or other litigation. Litigation can be lengthy, expensive, and disruptive to our operations and results cannot be predicted with certainty. There may also be adverse publicity associated with litigation, regardless of whether the allegations are valid or whether we are ultimately found liable. As a result, litigation may adversely affect our business, financial condition and results of operations.
Open source software may diminish our license fees and impair the ownership of our products.
The open source community is comprised of many different formal and informal groups of companies, software developers and individuals who have created a wide variety of software and have made that software available for use, distribution and modification, often free of charge. Open source software, such as the Linux operating system, has been gaining in popularity among business users. If developers contribute enterprise application software to the open source community, and that software has competitive features and scale to business users in our markets, we will need to change our product pricing and distribution strategy to compete. If one of our developers embedded open source components into one of our products, without our knowledge or authorization, our ownership and licensing of that product could be in jeopardy. Depending on the open source license terms, the use of an open source component could mean that all products delivered with that open source component become part of the open source community. In that case, we would not own those delivered products and could not charge license fees for those products. We currently take steps to train our developers and monitor the content of products in development, but there is no assurance that these steps will always be effective.
Business disruptions could adversely affect our operating results.
A significant portion of our critical business operations, including research and development, product maintenance, services support, and general and administrative support, are concentrated in a few geographic areas. A disruption or failure of our systems could cause delays in completing sales and providing maintenance and services to customers. A major earthquake, fire or other catastrophic event that results in the destruction or disruption of any of our critical business or information technology systems could severely affect our ability to conduct normal business operations and, as a result, our future operating results could be materially and adversely affected.
Our profit margin for consulting services is lower than margins related to the other aspects of our business.
The consulting part of our business is highly competitive, is less proprietary, and carries a much lower gross margin than the other aspects of our business. Our consulting services business is highly
19
sensitive to customer demands, competitive pressures and other external and internal forces. Our actions to improve our consulting services margin may be offset by these forces which could negatively impact our operating results.
We must attract and retain account executives in our sales organization to achieve our revenue goals.
Revenue growth, and in particular software license revenue growth, requires that we have a sufficient number of trained account executives in our sales organization to develop leads and call on prospective customers. Competition in our industry for experienced account executives is intense. Competitors and other software companies may lure away our account executives through signing bonuses and other special incentives. The failure to attract and retain account executives will negatively impact our revenue growth. When we hire a new account executive, the time period required for that person to become productive will vary, depending on their experience and training and the customer pipeline and length of sales cycle.
If we are unable to attract and retain senior management, software developers, services consultants, finance and accounting specialists, and other qualified personnel, we will be unable to develop new products and increase our revenue and profitability.
We also rely on the continued service of our senior management, software developers, services consultants, finance and accounting specialists, and other key employees. In the software industry, there is substantial and continuous competition for highly skilled business, product development, technical, financial and other personnel. The failure to attract, train, retain and effectively manage employees could negatively impact our development and efforts and cause a degradation of our customer service. If we are unable to attract and retain finance and accounting personnel who have experience with the software industry and U. S. accounting requirements, we will have to rely on more costly contractors to fill the roles necessary for us to meet our governance and regulatory requirements.
We are required to delay revenue recognition into future periods for portions of our license fee activity.
Our entire worldwide business is subject to United States generally accepted accounting principles (U.S. GAAP). Under those rules, we are required to defer revenue recognition for license fees in situations that include the following:
- •
- the customer agreement includes products that are under development or has other undelivered elements;
- •
- the customer agreement includes essential services, including significant modifications, customization or complex
interfaces (this is more prevalent with our M3 products);
- •
- the customer agreement includes acceptance criteria;
- •
- the customer agreement includes extended or contingent payment terms or fees;
- •
- a third-party vendor, whose technology is incorporated into our products, delays delivery of its product to the customer;
- •
- the customer agreement includes a fixed-fee service arrangement for which we do not have "vendor specific
objective evidence" (VSOE) of fair value; or
- •
- we are not able to establish historical pricing and maintenance renewal rates to meet the VSOE requirements of these accounting rules.
We expect that we will continue to defer recognition of portions of our license fee activity in each period because of these factors, with deferrals more likely for (a) our M3 products because of product customization (often required due to the nature of the manufacturing and distribution industries) that
20
is frequently included with new sales, (b) sales to governmental entities because those often include fixed-fee arrangements for which we do not have VSOE of fair value, and (c) sales of large license fee contracts because it is more difficult to use standard contract terms. The amount of license fees deferred may be significant and will vary each quarter, depending on the mix of products sold in each market and geography, and the actual contract terms.
We may take additional restructuring actions that result in financial charges in the period taken.
In fiscal 2009 and 2010, we took actions to reduce costs in response to the current global economic downturn and as part of our preparation for verticalization of our organization's structure in fiscal 2010. Depending on the continued impact of the global economic downturn and the uncertainty and timing of any recovery, we may decide to take additional restructuring actions to improve our operational efficiencies and we may be required to incur financial charges in the period when we make such decisions, which could have a material adverse impact on our results of operations for that period.
We may have exposure to additional tax liabilities.
As a multinational organization, we are subject to income taxes as well as non-income based taxes, in both the U.S. as well as in various foreign jurisdictions. Significant judgment is required in determining our worldwide income tax provision and other tax liabilities. In the ordinary course of a global business, there are many intercompany transactions and calculations where the ultimate tax determination is uncertain. Although we believe that our tax estimates are reasonable, there is no assurance that the final determination of tax audits or tax disputes will not be different from what is reflected in our historical income tax provisions and accruals. We are also subject to non-income taxes, such as payroll, sales, use, value-added, net worth, property and goods and services taxes, both in the U.S. and various foreign jurisdictions. We are regularly under audit by tax authorities with respect to these non-income taxes and may have additional exposure to additional non-income tax liabilities.
Our effective tax rate may increase or fluctuate, which could increase our income tax expense and reduce our net income.
Our effective tax rate can be adversely affected by several factors, many of which are outside of our control, including:
- •
- changes in the relative proportions of revenues and income before taxes in the various jurisdictions in which we operate
that have differing statutory tax rates;
- •
- changing tax laws, regulations, and interpretations in multiple jurisdictions in which we operate;
- •
- changes to the financial accounting rules for income taxes;
- •
- unanticipated changes in tax rates;
- •
- changes in accounting and tax treatment of stock-based compensation;
- •
- the tax effects of purchase accounting for acquisitions and restructuring charges that may cause fluctuations between
reporting periods;
- •
- changes to the valuation allowance on net deferred tax assets; or
- •
- the assessments, or any related tax interest or penalties, could significantly affect our income tax expense for the period in which the settlements take place.
We report our results of operations based on our determinations of the amount of taxes owed in the various tax jurisdictions in which we operate. Periodically, we receive notices that a tax authority to which we are subject has determined that we owe a greater amount of tax than we have reported to such authority, and we regularly engage in discussions, and sometimes disputes with these tax authorities. If the ultimate determination of our taxes owed in any of these jurisdictions is for an amount in excess of the tax provision we have recorded, our operating results, cash flows, and financial condition could be adversely affected.
21
We have adopted anti-takeover defenses that could make it difficult for another company to acquire control of Lawson or limit the price investors might be willing to pay for our stock.
Provisions in our amended and restated certificate of incorporation and bylaws, our stockholder rights plan and Delaware law could make it more difficult for other businesses to acquire us, even if doing so would benefit our stockholders. Our amended and restated certificate of incorporation and bylaws contain the following provisions, among others, which may inhibit an acquisition of our company by a third-party:
- •
- advance notification procedures for matters to be brought before stockholder meetings;
- •
- a limitation on who may call stockholder meetings;
- •
- a prohibition on stockholder action by written consent; and
- •
- the ability of our board of directors to issue shares of preferred stock without a stockholder vote.
The issuance of stock under our stockholder rights plan could delay, deter or prevent a takeover attempt that stockholders might consider in their best interests. We are also subject to provisions of Delaware law that prohibit us from engaging in any business combination with any "interested stockholder," meaning generally that a stockholder who beneficially owns more than 15% of our stock cannot acquire us for a period of three years from the date this person became an interested stockholder unless various conditions are met, such as approval of the transaction by our board of directors. Any of these restrictions could have the effect of delaying or preventing a change in control.
Stock ownership by officers and directors, or other stockholders accumulating large positions in our stock, could significantly influence matters requiring stockholder approval.
As of May 31, 2010, our executive officers, directors, and affiliated entities, in the aggregate, beneficially owned approximately 11.0% of our outstanding common stock, providing them with voting power to significantly influence matters requiring approval by stockholders. From time to time, activist and hedge fund investors have accumulated large positions in our stock. Holders of large quantities of our stock or groups of stockholders acting together could also significantly influence all matters requiring approval by stockholders, including the nomination and election of directors and the approval of mergers or other business combinations. Sales of our common stock by officers, directors or significant stockholders in the public market, or the perception that such sales are likely to occur, could depress the market price of our common stock and could impair our ability to raise capital through the sale of additional equity securities.
Our stock price could become more volatile and our stockholders' investments could lose value.
All of the factors discussed in this section could affect our stock price. The timing of announcements in the public market regarding new products, product enhancements or technological advances by our competitors or us, and any announcements by us of acquisitions, major transactions, or management changes could also affect our stock price. Our stock price is subject to speculation in the press and the analyst community, changes in recommendations or earnings estimates by financial analysts, changes in investors' or analysts' valuation measures for our stock and market trends unrelated to our performance. A significant drop in our stock price could also expose us to the risk of securities class actions lawsuits, which could result in substantial costs and divert management's attention and resources, which could adversely affect our business.
Item 1B. Unresolved Staff Comments
None.
22
Our corporate headquarters and executive offices are in Saint Paul, Minnesota, USA where we lease approximately 308,000 square feet of space. The lease on this facility expires July 31, 2015. We also lease approximately 100,000 square feet of space, primarily for regional sales and support offices, elsewhere in the U.S. Additionally, primarily through our location in Stockholm, Sweden, we lease approximately 680,400 square feet of office space in 25 countries used primarily as sales and services offices. Expiration dates of leases on these offices range from 2010 to 2016. We believe that our current domestic and international facilities are sufficient to meet our needs for at least the next 12 months. In addition, we believe suitable additional or alternative space would be available on commercially reasonable terms to accommodate expansion of our operations, if required. The restructuring plans we have implemented over the past few years have involved the exit or reduction in space of certain of our leased facilities. See Note 3, Restructuring, in Notes to Consolidated Financial Statements of this Form 10-K for additional information.
Patent Infringement Lawsuit by ePlus. On May 19, 2009, ePlus, Inc. filed a lawsuit in the United States District Court for the Eastern District of Virginia against Lawson Software, Inc., Perfect Commerce, Inc., SciQuest, Inc. and Verian Technologies, Inc. The other three defendants subsequently entered into separate confidential settlements and the court dismissed their parts of the lawsuit. The May 2009 complaint alleges that Lawson's supply chain products infringe three U.S. patents owned by ePlus. In that complaint, ePlus seeks damages in an undisclosed amount, enhancement of those damages, an attorneys' fee award and an injunction against further infringement. In May 2010, ePlus quantified its damages claim based on an alleged 5% to 6% royalty on all license, maintenance and services revenues in the United States since November 2003 for a wide range of Lawson's supply chain products. Those alleged royalty damages would total $28.0 to $33.0 million or more, and all or part of that award could be increased up to treble damages by the court, at its discretion, if ePlus proved willful infringement by Lawson. A damages award would also include pre-judgment interest, which could total $6.0 to $8.0 million if ePlus were awarded damages in the amount claimed. ePlus may supplement its damages demand before trial based on updated Lawson sales information. If ePlus proves infringement, the court also has discretion to require Lawson to reimburse ePlus for its legal fees and costs. We are contesting the infringement claims and validity of the patents as well as the time frame and scope of products and services associated with ePlus' damages claim. We are vigorously defending this case because we believe we have meritorious defenses, including non-infringement and patent invalidity. This case is currently scheduled to go to trial in September 2010. If we are not successful in obtaining summary judgment or other resolution before or at trial, at the conclusion of the trial the jury will decide whether or not ePlus has proved that Lawson has infringed, and whether or not Lawson has proved that the patents are invalid. If the jury finds that Lawson failed to prove invalidity of the patents, and if the jury finds that ePlus has proved infringement, then the jury will determine the amount of damages payable by Lawson. Given the inherent unpredictability of litigation and jury trials, we cannot at this time estimate the possible outcome of this lawsuit. Because patent litigation is time consuming and costly to defend, we will continue to incur significant costs defending this case. In addition, in the event of an unfavorable outcome in this matter, it could have a material adverse effect on our future results of operations or cash flows. If ePlus prevails in this lawsuit, we could be required to pay a royalty to ePlus on the sale of certain products and services in the future, and if we could not reach agreement with ePlus on the amount or scope of that royalty, we would have to either stop the sale of those products and services or make modifications to avoid infringement.
Patent Infringement Lawsuit by JuxtaComm. On January 21, 2010, JuxtaComm-Texas Software, LLC filed a lawsuit in the United States District Court for the Eastern District of Texas against Lawson Software, Inc., Lawson Software Americas, Inc. and 20 other defendants. One of the
23
defendants, Seco Tools, Inc. is a Lawson customer. Under the terms of our customer license agreement, we have agreed to defend and indemnify Seco Tools in this lawsuit. The complaint alleges that Lawson and the other defendants infringe United States Patent No. 6,195,662 entitled "System for Transforming and Exchanging Data Between Distributed Heterogeneous Computer Systems." JuxtaComm seeks damages in an undisclosed amount, enhancement of those damages, an attorneys' fee award and an injunction against further infringement. On April 22, 2010, JuxtaComm filed an amended complaint, naming Lawson ProcessFlow Integrator and Lawson System Foundation, as well as any products and/or services in the Lawson S3 and Lawson M3 product lines, as allegedly infringing. We intend to vigorously defend this case. Given the inherent unpredictability of litigation and jury trials, we cannot at this time estimate the possible outcome of this lawsuit. Because patent litigation is time consuming and costly to defend, we could incur significant costs defending this case. In addition, in the event of an unfavorable outcome in this matter, it could have a material adverse effect on our future results of operations or cash flows.
Patent Infringement Lawsuit by Aloft Media. On May 14, 2010, Aloft Media, LLC filed a lawsuit in the United States District Court for the Eastern District of Texas against Lawson Software, Inc., Lawson Software Americas, Inc. and 12 other defendants. The complaint alleges that Lawson's Planning Workbench for Food and Beverage software product, and possibly other software products, infringe United States Patent Nos. 7,593,910 and 7,596,538, which are each entitled "Decision-Making System, Method and Computer Program Product." Aloft Media seeks, in undisclosed amounts, damages, costs, expenses, interest and royalties. We intend to vigorously defend this case. Given the inherent unpredictability of litigation and jury trials, we cannot at this time estimate the possible outcome of this lawsuit. Because patent litigation is time consuming and costly to defend, we could incur significant costs defending this case. In addition, in the event of an unfavorable outcome in this matter, it could have a material adverse effect on our future results of operations or cash flows.
Class Action Overtime Lawsuit. On May 20, 2008, a putative class action lawsuit was filed against us in the United States District Court for the Southern District of New York on behalf of current and former business, systems, and technical consultants. The suit, Cruz, et. al., v. Lawson Software, Inc. et. al., alleged that we failed to pay overtime wages pursuant to the Fair Labor Standards Act (FLSA) and state law, and alleged violations of state record-keeping requirements. The suit also alleged certain violations of ERISA and unjust enrichment. Relief sought includes back wages, corresponding 401(k) plan credits, liquidated damages, penalties, interest and attorneys' fees. Given the preliminary nature of the alleged claims and the inherent unpredictability of litigation, we cannot at this time estimate the possible outcome of any such action. We successfully moved the case from the United States District Court for the Southern District of New York to the District of Minnesota. The Minnesota Federal District Court conditionally certified the case under the FLSA as a collective action and granted our motion to dismiss the two ERISA counts and the state wage and hour claims. Plaintiffs moved for Rule 23 class certification but the Court denied their motion. At the present time, the size of the class is limited to the 68 consultants who elected to participate in the lawsuit by filing opt-in forms. The overtime period at issue is two years, which would be increased to three years if the plaintiffs proved that the Company intentionally violated the applicable wage and hour laws. The plaintiffs' damages expert claims total aggregate damages of $10.3 million for a two year period for the 68 consultants and an additional $2.9 million in aggregate damages if the overtime period is three years. Given the inherent unpredictability of litigation and jury trials, we cannot at this time estimate the possible outcome of this lawsuit. On June 30, 2010, Lawson filed a motion to de-certify the FLSA collective action, which, if granted, would limit the action to the five named plaintiffs. That motion will not be heard until November, 2010. As permitted by the present scheduling order, we plan to file a motion for summary judgment asking for dismissal of remaining class members based on their performance of exempt duties and/or making more than $100,000 per year. In the event of an unfavorable outcome in this matter, it could have a material adverse effect on our future results of operations or cash flows.
24
We are subject to various other legal proceedings and the risk of litigation by employees, customers, patent owners, suppliers, stockholders or others through private actions, class actions, administrative proceedings or other litigation. While the outcome of these claims cannot be predicted with certainty, we do not believe that the outcome of any one of these legal matters will have a material adverse effect on our consolidated financial position, results of operations or cash flows. However, depending on the amount and the timing, an unfavorable resolution of some or all of these matters could materially affect our future results of operations or cash flows in a particular period.
Item 4. (Removed and Reserved)
Item 5. Market for Registrant's Common Equity, Related Stockholder Matters and Issuer Purchases of Equity Securities
Market Information
Our common stock is traded on the NASDAQ Global Select Market System (NASDAQ) under the symbol LWSN. The following table lists the high and low closing sale prices by quarter as reported by NASDAQ.
| |
High | Low | ||||||
|---|---|---|---|---|---|---|---|---|
Fiscal 2010 |
||||||||
Fourth Quarter |
$ | 8.25 | $ | 6.20 | ||||
Third Quarter |
$ | 7.19 | $ | 5.75 | ||||
Second Quarter |
$ | 7.41 | $ | 5.87 | ||||
First Quarter |
$ | 6.65 | $ | 4.99 | ||||
Fiscal 2009 |
||||||||
Fourth Quarter |
$ | 5.87 | $ | 3.40 | ||||
Third Quarter |
$ | 5.25 | $ | 3.39 | ||||
Second Quarter |
$ | 8.18 | $ | 2.82 | ||||
First Quarter |
$ | 8.46 | $ | 6.99 | ||||
Holders
As of July 1, 2010, the approximate number of registered stockholders of record was 195.
Dividends
We have historically not declared or paid any cash dividends on our common stock and do not anticipate paying cash dividends in the foreseeable future. We intend to reinvest future earnings to fund the operation and expansion of our business and to repurchase shares of our common stock under our board-approved share repurchase program.
Stock Performance Graph
The following graph shows a comparison of cumulative total stockholder returns for Lawson's common stock, the NASDAQ Stock Market Index (U.S. companies) and the Dow Jones U.S. Software Index for the period from May 31, 2005 through May 31, 2010. The graph assumes the investment of $100 on May 31, 2005. The date regarding our common stock assumes an investment at the closing price on May 31, 2005 of $5.92 per share of our common stock. All values assume reinvestment of the full amount of all dividends and are calculated through May 31, 2010. The performance shown in the
25
graph below is based upon historical data and is not necessarily indicative of the future performance of our common stock.
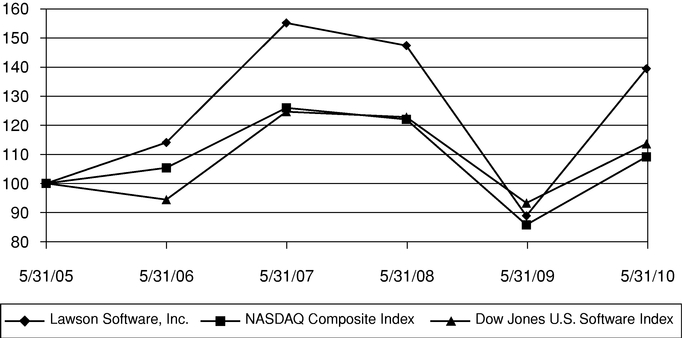
| |
5/31/05 | 5/31/06 | 5/31/07 | 5/31/08 | 5/31/09 | 5/31/10 | |||||||||||||
|---|---|---|---|---|---|---|---|---|---|---|---|---|---|---|---|---|---|---|---|
Lawson Software, Inc. |
100.00 | 114.02 | 155.07 | 147.30 | 88.85 | 139.36 | |||||||||||||
NASDAQ Composite Index |
100.00 | 105.35 | 125.93 | 121.97 | 85.79 | 109.13 | |||||||||||||
Dow Jones U.S. Software Index |
100.00 | 94.43 | 124.61 | 122.77 | 93.27 | 113.61 | |||||||||||||
Purchases of Equity Securities
On November 13, 2006, our Board of Directors approved a share repurchase program of up to $100.0 million of our common stock. The Board increased this maximum to $200.0 million in April 2007 and to $400.0 million in July 2008. The share repurchases are funded by our existing cash balances and future cash flows. Our share repurchases may occur with transactions structured through investment banking institutions as permitted by securities laws and other legal requirements, open market purchases, privately negotiated transactions and/or other mechanisms. Our share repurchase program does not have an expiration date and allows us to repurchase shares at our discretion. Market conditions influence the timing of the buybacks and the number of shares repurchased. There can be no assurance as to the amount, timing or repurchase price of future repurchases, if any, related to the share repurchase program. The program may also be modified, extended or terminated by our Board of Directors at any time.
In the fourth quarter of fiscal 2010, we did not repurchase any shares of our common stock under the share repurchase program. During fiscal 2010, we repurchased an aggregate of 1.3 million shares of our common stock at an average price of $5.92 per share under the share repurchase program. From inception of the repurchase program through May 31, 2010, we have used $270.9 million to repurchase approximately 32.9 million shares at an average price of $8.23 per share. The repurchased shares are recorded as treasury stock and result in a reduction to our stockholders' equity. The shares will be used for general corporate purposes. As of May 31, 2010, the maximum dollar value of shares that may yet be purchased under this program was $129.1 million.
26
Item 6. Selected Consolidated Financial Data
The following tables set forth selected consolidated financial data as of and for our last five fiscal years and should be read in conjunction with Item 7, Management's Discussion and Analysis of Financial Condition and Results of Operations and our Consolidated Financial Statements and the Notes to those statements. The selected consolidated financial data has been derived from our audited Consolidated Financial Statements.
| |
Years Ended May 31, | |||||||||||||||||
|---|---|---|---|---|---|---|---|---|---|---|---|---|---|---|---|---|---|---|
| |
2010(1) | 2009(2) | 2008(2)(3) | 2007(2) | 2006(4) | |||||||||||||
| |
(in thousands, except per share data) |
|||||||||||||||||
Consolidated Statements of Operations Data: |
||||||||||||||||||
Revenues: |
||||||||||||||||||
License fees |
$ | 124,126 | $ | 109,683 | $ | 132,156 | $ | 105,861 | $ | 71,076 | ||||||||
Maintenance services |
352,986 | 350,202 | 336,779 | 291,657 | 188,155 | |||||||||||||
Software revenues |
477,112 | 459,885 | 468,935 | 397,518 | 259,231 | |||||||||||||
Consulting |
259,296 | 297,443 | 382,991 | 352,870 | 131,545 | |||||||||||||
Total revenues |
736,408 | 757,328 | 851,926 | 750,388 | 390,776 | |||||||||||||
Total cost of revenues |
321,094 | 358,632 | 412,920 | 399,320 | 171,542 | |||||||||||||
Gross profit |
415,314 | 398,696 | 439,006 | 351,068 | 219,234 | |||||||||||||
Operating expenses: |
||||||||||||||||||
Research and development |
90,268 | 82,377 | 85,374 | 85,325 | 60,711 | |||||||||||||
Sales and marketing |
162,245 | 162,975 | 189,336 | 160,551 | 83,193 | |||||||||||||
General and administrative |
84,306 | 79,765 | 100,259 | 98,263 | 54,827 | |||||||||||||
Restructuring |
13,154 | 19,954 | (731 | ) | 15,483 | 1,825 | ||||||||||||
Amortization of acquired intangibles |
9,472 | 8,892 | 13,690 | 10,089 | 2,122 | |||||||||||||
Total operating expenses |
359,445 | 353,963 | 387,928 | 369,711 | 202,678 | |||||||||||||
Operating income (loss) |
55,869 | 44,733 | 51,078 | (18,643 | ) | 16,556 | ||||||||||||
Total other income (expense), net |
(15,233 | ) | (8,811 | ) | (13,345 | ) | 11,209 | 11,111 | ||||||||||
Income (loss) before income taxes |
40,636 | 35,922 | 37,733 | (7,434 | ) | 27,667 | ||||||||||||
Provision for income taxes |
27,612 | 21,731 | 28,411 | 14,053 | 11,708 | |||||||||||||
Net income (loss) |
$ | 13,024 | $ | 14,191 | $ | 9,322 | $ | (21,487 | ) | $ | 15,959 | |||||||
Net income (loss) per share: |
||||||||||||||||||
Basic |
$ | 0.08 | $ | 0.09 | $ | 0.05 | $ | (0.12 | ) | $ | 0.14 | |||||||
Diluted |
$ | 0.08 | $ | 0.08 | $ | 0.05 | $ | (0.12 | ) | $ | 0.14 | |||||||
Weighted average common shares outstanding: |
||||||||||||||||||
Basic |
161,442 | 164,011 | 177,283 | 186,363 | 110,995 | |||||||||||||
Diluted |
165,251 | 166,393 | 180,580 | 186,363 | 115,350 | |||||||||||||
- (1)
- On
January 11, 2010 we completed our acquisition of Healthvision. Fiscal 2010 includes Healthvision results for the 20 week period from
January 11, 2010 thru May 31, 2010. See Note 4, Business Combinations, in Notes to Consolidated Financial Statements of this
Form 10-K.
- (2)
- Adjusted to reflect adoption of the FASB guidance on accounting for convertible debt securities. See Note 2, Summary of Significant Accounting Policies, in Notes to Consolidated Financial Statements of this Form 10-K.
27
- (3)
- Fiscal
2008 total other income (expense), net includes an $18.4 million impairment charge related to our investments in auction rate securities. The
related tax benefit of $7.1 million is not reflected in the fiscal 2008 provision for income taxes as we recorded a full valuation allowance against it as no tax benefit is expected.
- (4)
- On April 25, 2006, we completed our acquisition of Intentia. Fiscal 2006 includes Intentia results for the five-week period from April 25, 2006 to May 31, 2006. Fiscal 2010, 2009, 2008 and 2007 include Intentia results for the full year.
| |
May 31, | |||||||||||||||
|---|---|---|---|---|---|---|---|---|---|---|---|---|---|---|---|---|
| |
2010 | 2009(1) | 2008(1) | 2007(1) | 2006 | |||||||||||
| |
(in thousands) |
|||||||||||||||
Consolidated Balance Sheet Data: |
||||||||||||||||
Cash, cash equivalents, marketable securities and short-term investments |
$ | 375,917 | $ | 414,815 | $ | 485,810 | $ | 553,836 | $ | 306,581 | ||||||
Working capital |
115,034 | 213,997 | 261,072 | 324,616 | 168,201 | |||||||||||
Total assets |
1,372,044 | 1,324,481 | 1,496,890 | 1,462,324 | 1,170,652 | |||||||||||
Long-term debt—non-current(2) |
224,143 | 217,333 | 210,764 | 203,872 | 4,275 | |||||||||||
Total stockholders' equity(3) |
625,169 | 623,960 | 763,824 | 779,801 | 791,659 | |||||||||||
- (1)
- Adjusted
to reflect adoption of the FASB guidance on accounting for convertible debt securities See Note 2, Summary of
Significant Accounting Policies, in Notes to Consolidated Financial Statements of this Form 10-K.
- (2)
- On
April 23, 2007 we completed the issuance of $240.0 million of 2.50% senior convertible notes. See Note 7, Long-Term Debt and Credit Facilities, in Notes to Consolidated Financial
Statements of this Form 10-K.
- (3)
- As part of our share repurchase program, we repurchased 1.3 million shares of our common stock for $7.4 million in fiscal 2010, 13.7 million shares for $103.0 million in fiscal 2009, 11.6 million shares for $105.6 million in fiscal 2008 and 6.4 million shares for $54.9 million in fiscal 2007. See Note 9, Common Stock, in Notes to Consolidated Financial Statements of this Form 10-K.
28
Item 7. Management's Discussion and Analysis of Financial Condition and Results of Operations
The following discussion should be read in conjunction with the selected consolidated financial data presented above, our Consolidated Financial Statements, the notes to those statements and other financial information appearing elsewhere in this Annual Report on Form 10-K.
Management Overview
General
Lawson Software, Inc. is a global provider of enterprise software. We provide business application software, consulting and maintenance to customers primarily in specific services, trade and manufacturing/distribution industries. We specialize in and target specific industries through our three reportable segments: S3 Strategic Industries segment which targets customers in the healthcare and public sector industries as well as the horizontal market for our Human Capital Management product line, M3 Strategic Industries segment which targets customers in the equipment service management & rental, food & beverage and fashion industries, and our General Industries segment which includes our services industries (S3) customers and manufacturing & distribution industries (M3) customers which are in industries not included in our other two industries groups.
Our software includes enterprise financial management, human capital management, business intelligence, asset management, enterprise performance management, supply chain management, service management, manufacturing operations, business project management and industry-tailored applications. Our applications help automate and integrate critical business processes, which enables our customers to collaborate with their partners, suppliers and employees. We support our customers' use of our applications through consulting services that primarily help our customers implement their Lawson applications, and through our maintenance programs that provide on-going support and product updates for our customers' continued use of our applications.
We believe our enterprise software solutions provide competitive advantages and business flexibility to our customers. Lawson's solutions fall within three main product lines and include related maintenance and consulting services. Our product lines are referred to as Lawson S3 Enterprise Management System, Lawson M3 Enterprise Management System, and Lawson Human Capital Management with many of the solutions in each product line having broad, cross-industry application. Our S3 solutions consist of business applications designed for service industries. Our M3 solutions consist of applications that are geared for manufacturing, distribution and trade businesses that face resource constraints and whose processes are often complex and industry-specific. Our Human Capital Management applications provide solutions for customers in any industry to strategically manage their workforce.
In the third quarter of fiscal 2010 we acquired Healthvision, a Dallas-based company providing integration and application technology and related services to hospitals and large healthcare organizations. The acquisition of Healthvision is a strategic fit for our healthcare customers within our S3 Strategic Industries segment. Total purchase consideration related to the Healthvision acquisition was $160.0 million, net of cash acquired, and resulted in the recognition of $95.5 million of amortizable intangible assets and $78.2 million in goodwill. Operating results of Healthvision have been included in our results of operations since the acquisition date of January 11, 2010. See Note 4, Business Combinations, in Notes to Consolidated Financial Statements of this Form 10-K for additional information.
Demand for our software products and services continues to be negatively impacted by the weakened global economy. This is particularly true in our EMEA region. The unprecedented disruption in the financial markets which began in the fall of 2008 continued to disrupt credit and equity markets worldwide leading to a weakened global economic environment, restricted credit availability, and
29
economic uncertainties throughout fiscal 2010. The effect of the weakened global economy and the fallout from the financial market turmoil continued to be a challenge for our license contracting and demand for our services in fiscal 2010. We have experienced a longer sales cycle and increased price sensitivity. Certain current and prospective customers have cancelled, delayed or downsized software purchases and implementation projects because of the adverse economy and their internal budget constraints. Continued economic uncertainties and/or further deterioration of economic conditions could cause further delay or reduce our current and prospective customers' software purchases or implementation projects which may negatively impact our future results. In addition, credit risks associated with our customers/vendors may also be adversely impacted by the current economic conditions. This challenging economic environment has also intensified the difficulty of forecasting software license and consulting services revenues. A decrease in licensing activity will typically lead to a decrease in services revenues in subsequent quarters. Lower licensing activity will also lower new maintenance revenues since maintenance fees for new product licenses are based on the amount of associated license fees.
In response to the continued uncertainty in the global economic environment, we have taken actions during fiscal 2010 to reduce our headcount, primarily within our consulting practice in our EMEA region and within our M3 operations in Europe, the U.S. and Manila. It is these areas of our business that have been particularly hard hit by the current global economic conditions. These actions included the elimination of approximately 225 employees, or less than 6.0% of our global workforce. Our results for fiscal 2010 include restructuring charges of approximately $13.2 million relating to these actions. See Note 3, Restructuring, in Notes to Consolidated Financial Statements of this Form 10-K for more information. We continue to closely monitor our discretionary spending while preserving targeted investments that we believe will enable Lawson's long-term growth and increase our operational efficiencies. We may consider possible future actions to reduce our operating costs if circumstances warrant.
On April 2, 2010, our Benefits Committee approved a plan to modify our defined benefit pension plan in Norway (the Plan). The modification of the Plan resulted in a curtailment of benefits in the fourth quarter of fiscal 2010, when the modifications were approved. Accordingly, we recorded a gain of approximately $1.8 million in the fourth quarter of fiscal 2010. The modification of the Plan also led to a settlement of active participants' projected benefits in the first quarter of fiscal 2011 for which we anticipate recording an additional gain of approximately $1.5 million in the first quarter of fiscal 2011. See Note 11, Profit Sharing and 401(k) Retirement Plan, in Notes to Consolidated Financial Statements of this Form 10-K for additional information.
During fiscal 2009 and prior years, we operated as one business segment, the development and marketing of computer software and related services including consulting, maintenance and customer support. Beginning in the first quarter of fiscal 2010, we reorganized our operations to provide greater focus on and better serve our targeted vertical markets. With this strategic organizational change, including a workforce realignment, we determined that we have three reportable segments that align with our three industries groups: S3 Strategic Industries, M3 Strategic Industries and General Industries. See Note 14, Segment and Geographic Information, in Notes to Consolidated Financial Statements of this Form 10-K for additional information. We continue to evaluate our vertical organizational structure and have changed certain management and reporting responsibilities effective June 1, 2010; eliminating our General Industries reportable segment and redistributing responsibility for management of the vertical markets that were part of this segment into our S3 Strategic Industries and M3 Strategic Industries segments. We believe the elimination of our General Industries segment will help us drive more efficiencies and better manage our operations. Commensurate with this organizational change, we expect to begin reporting operating results for two reportable segments in the first quarter of fiscal 2011.
30
Fiscal 2010 Results
During fiscal 2010, within our S3 Strategic Industries segment, we entered into significant transactions within our healthcare and public sector verticals and for our human capital management products. Our acquisition of Healthvision benefitted our healthcare business within this segment. Software spending in our healthcare and public sector verticals has proven more resilient in this weak economy than other industries in which we do business. Despite this resiliency, we believe that public sector budgetary shortfalls will continue to present challenges. Within our M3 Strategic Industries segment, our equipment service management & rental vertical also continued to perform well during fiscal 2010 with increased license fees and consulting revenues as compared to last year. This increase was largely driven by our ability to offer a new end-to-end solution for our customers in this vertical. Our channel partners, primarily third-party resellers, also contributed to the improved licensing activity within our M3 Strategic Industries segment during the year. Certain industry verticals covered by our General Industries segment, particularly manufacturing & distribution, retail and financial services have been hard hit by the continued global economic downturn. Fiscal 2010 licensing activity in this segment increased slightly primarily related to licensing in our services industries vertical, which was offset by decreases in maintenance and consulting revenues for the segment.
Revenues for fiscal 2010 were $736.4 million, down 2.8% compared to $757.3 million in fiscal 2009. Software revenues, consisting of license fees and maintenance services, increased $17.2 million, or 3.7%, in fiscal 2010 as compared to last year. Both our S3 Strategic Industries and M3 Strategic Industries segments experienced growth in fiscal 2010 software revenues. The increase included approximately $9.6 million within our S3 Strategic Industries segment related to our acquisition of Healthvision. Our General Industries segment software revenues declined in fiscal 2010 compared to fiscal 2009 by $8.2 million. Consulting revenues decreased $38.1 million, or 12.8%, in fiscal 2010 compared to last year primarily in our General Industries segment. The decrease was somewhat offset by the inclusion of Healthvision consulting revenues of $5.7 million in fiscal 2010 within our S3 Strategic Industries segment.
Geographically, the decrease in fiscal 2010 revenues was primarily related to our EMEA region which decreased $39.0 million, or 13.6%, as compared to last year. The decrease in EMEA revenues was primarily related to lower consulting revenues as we have maintained significantly fewer billable consultants in EMEA during fiscal 2010 as compared to last year and we have experienced lower bookings for our consulting and implementation services. This decrease was partially offset by a $14.0 million, or 3.2%, increase in our Americas region primarily related to our acquisition of Healthvision. Revenues in our APAC region also increased $4.1 million, or 13.2%, compared to last year. Our Americas region accounted for approximately 61.6% of our fiscal 2010 revenues while our EMEA and APAC regions accounted for 33.6% and 4.8%, respectively. As a majority of Healthvision's operations are in our Americas region, we anticipate that the Americas region will continue to represent a greater proportion of our total revenues in fiscal 2011.
Total gross margin as a percent of revenues for fiscal 2010 improved to 56.4% as compared to 52.6% last year primarily as result of improved gross margins related to our license fees and consulting revenues as well as a favorable mix of software revenues compared to consulting revenues. The improvement in our gross margin from consulting services primarily reflects the effects of our 2009 and 2010 restructuring activities. In addition, the inclusion of Healthvision's operations favorably impacted our consulting gross margins. In fiscal 2010 software revenues accounted for 64.8% of our total revenues as compared to 60.7% last year. We anticipate an increased software revenue mix relative to total revenues in fiscal 2011 as compared to fiscal 2010.
Fiscal 2010 operating expenses increased by $5.5 million, or 1.5%, compared to last year. As a percent of revenues, fiscal 2010 operating expenses were 48.8% compared to 46.7% last year. Current year operating expenses included $9.5 million related to the operations of Healthvision as well as
31
approximately $1.6 million in transaction and integration costs related to our acquisition of Healthvision.
Non-GAAP Financial Measures
Our results of operations in this Management's Discussion and Analysis are presented in accordance with U.S. GAAP. In addition to reporting our financial results in accordance with U.S. GAAP, we present certain non-GAAP financial measures to our investors in our quarterly earnings releases, in information posted on our website and in other public disclosures. These non-GAAP measures include non-GAAP revenues, non-GAAP operating income, non-GAAP operating margin, non-GAAP net income and non-GAAP net income per diluted share. For fiscal 2010, non-GAAP revenues of $742.2 million decreased $15.7 million, or 2.1%, compared to $757.9 million in fiscal 2009. Non-GAAP operating margin of $115.7 million in fiscal 2010 improved $24.3 million, or 26.6%, compared to $91.4 million in fiscal 2009. As a percentage of revenues, fiscal 2010 non-GAAP operating margin improved to 15.6% compared to 12.1% in fiscal 2009. Fiscal 2010 Non-GAAP net income was $68.6 million, or $0.42 per diluted share, compared to $58.9 million, or $0.35 per diluted share, in fiscal 2009. See Non-GAAP Financial Measure Reconciliations below for additional information regarding our use of these non-GAAP financial measures and reconciliations to the corresponding U.S. GAAP measures.
Foreign Currency
A significant portion of our business is conducted in currencies other than the U.S. Dollar, particularly the Euro and the Swedish Krona (SEK). Our revenues and operating expenses are affected by fluctuations in applicable foreign currency exchange rates. Despite the significant strengthening in the U.S. Dollar relative to the Euro and SEK in the fourth quarter, for our fiscal year ended May 31, 2010, the average exchange rates for the U.S. Dollar weakened against the Euro and the SEK as compared to the average exchange rates for the similar period last year. These fluctuations in the exchange rates affected our fiscal 2010 results as a decline in the U.S. Dollar to SEK and Euro exchange rates generally have the effect of increasing our revenues but also increasing our operating expenses denominated in currencies other than the U.S. Dollar. Similarly, strengthening in the U.S. Dollar to SEK and Euro exchange rates generally have the effect of reducing our revenues but also reducing our operating expenses denominated in currencies other than the U.S. Dollar.
In general, for financial activities denominated in a currency other than the U.S. Dollar, we calculate constant currency comparisons by converting the prior period financial activities at the average monthly exchange rates applicable to current periods. We believe these constant currency comparisons provide additional insight into our business performance during the applicable reporting periods exclusive of the effects of foreign currency exchange rate fluctuations, and should be considered in addition to, but not as a substitute for the actual changes in revenues, expenses, income or other financial measures presented in this Annual Report on Form 10-K.
32
The following table summarizes the year-over-year change, both in U.S. Dollars and percentages, in revenues and costs and expenses due to fluctuations in exchange rates and changes in activity and pricing on a constant currency basis:
Fiscal 2010 vs. Fiscal 2009
|
Change Due to Currency Fluctuations |
Change in Constant Currency |
Total Change as Reported |
Change Due to Currency Fluctuations |
Change in Constant Currency |
Total Change as Reported |
|||||||||||||||
|---|---|---|---|---|---|---|---|---|---|---|---|---|---|---|---|---|---|---|---|---|---|
| |
(in thousands) |
||||||||||||||||||||
Revenues: |
|||||||||||||||||||||
License fees |
$ | 1,663 | $ | 12,780 | $ | 14,443 | 1.7 | % | 11.5 | % | 13.2 | % | |||||||||
Maintenance services |
(2,988 | ) | 5,772 | 2,784 | (0.9 | ) | 1.7 | 0.8 | |||||||||||||
Software revenues |
(1,325 | ) | 18,552 | 17,227 | (0.3 | ) | 4.0 | 3.7 | |||||||||||||
Consulting |
5,204 | (43,351 | ) | (38,147 | ) | 1.5 | (14.3 | ) | (12.8 | ) | |||||||||||
Total revenues |
$ | 3,879 | $ | (24,799 | ) | $ | (20,920 | ) | 0.5 | % | (3.3 | )% | (2.8 | )% | |||||||
Total costs and operating expenses |
$ | 7,766 | $ | (39,822 | ) | $ | (32,056 | ) | 1.0 | % | (5.5 | )% | (4.5 | )% | |||||||
The fluctuations in foreign currency exchange rates had an unfavorable impact on our fiscal 2010 net income per basic and diluted share of approximately $0.02 per share.
Acquisitions
We account for our acquisitions under the purchase method of accounting. Accordingly, the assets and liabilities acquired were recorded at their estimated fair values at the effective date of the acquisitions and the results of operations have been included in our Consolidated Statements of Operations since the acquisition dates. In accordance with Financial Accounting Standards Board (FASB) guidance related to goodwill and other intangible assets, goodwill recorded as a result of these acquisitions is subject to an annual impairment test and is not amortized. These acquisitions are intended to enhance our focus on targeted vertical markets and to provide additional value-added products and services to our customers. See Note 4, Business Combinations, in Notes to Consolidated Financial Statements of this Form 10-K for additional information related to our recent acquisitions.
Critical Accounting Policies and Estimates
The discussion and analysis of our financial condition and results of operations are based upon our audited Consolidated Financial Statements, which have been prepared in accordance with U.S. GAAP. The preparation of these financial statements requires us to make estimates and assumptions that affect the reported amounts of assets and liabilities as of the date of our financial statements, the reported amounts of revenues and expenses during the reporting periods presented, as well as our disclosures of contingent assets and liabilities. On an on-going basis, we evaluate our estimates and assumptions, including, but not limited to, those related to revenue recognition, allowance for doubtful accounts and sales returns, fair value of investments, fair value of stock-based compensation, fair value of acquired intangible assets and goodwill, useful lives of intangible assets and property and equipment, income taxes, restructuring obligations and contingencies and litigation. We base our estimates and assumptions on our historical experience and on other information available to us at the time that these estimates and assumptions are made. We believe that these estimates and assumptions are reasonable under the circumstances and form the basis for making judgments about the carrying values of our assets and liabilities that are not readily apparent from other sources. Actual results and outcomes could differ from our estimates.
Our significant accounting policies are described in Note 2, Summary of Significant Accounting Policies, in Notes to Consolidated Financial Statements of this Form 10-K. We believe that the
33
following discussion addresses our critical accounting policies and reflect those areas that require more significant judgments, and use of estimates and assumptions in the preparation of our Consolidated Financial Statements.
Revenue Recognition. Revenue recognition rules for software businesses are very complex. We follow specific and detailed guidelines in determining the proper amount of revenue to be recorded. However, certain judgments affect the application of our revenue recognition policy. Revenue results are difficult to predict, and any shortfall in revenue or delay in recognizing revenue could cause our operating results to vary significantly from year to year.
The significant judgments for revenue recognition typically involve whether collectability can be considered probable and whether fees are fixed or determinable. In addition, our transactions often consist of multiple element arrangements, which typically include license fees, maintenance and support fees and consulting service fees. These multiple element arrangements must be analyzed to determine the relative fair value of each element, the amount of revenue to be recognized upon shipment, if any, and the period and conditions under which deferred revenue should be recognized.
We recognize revenue in accordance with the FASB guidance related to software revenue recognition. We license software under non-cancelable license agreements and provide related consulting services, including training, and implementation services, as well as on-going customer support and maintenance.
When our consulting, training and implementation services 1) are not considered essential to the functionality of our software products, 2) are sold separately and also 3) are available from a number of third-party service providers, our revenues from these services are generally recorded separately from license fees and recognized as the services are performed. License fees within software arrangements including services that do not meet any one or a combination of the three criteria listed above, are recognized in accordance with FASB guidance on revenue recognition, using contract accounting and the percentage-of-completion methodology based on labor hours input. Software arrangements which include certain fixed-fee service components are usually recognized as the services are performed while corresponding costs to provide these services are expensed as incurred.
From time to time, we enter into software arrangements that include software license, maintenance and consulting services which are considered essential to the functionality of the software. In these instances, we recognize revenue for the three revenue streams under two units of accounting, which are the (i) software license bundled together with consulting services and (ii) maintenance. For purposes of displaying revenues, we present applicable license fees, maintenance and consulting revenues in our Consolidated Statements of Operations using vendor specific objective evidence (VSOE) (or, if unavailable, other objective evidence) of fair value for the undelivered elements and assigning the remainder of the arrangement fee to the license.
The amounts of revenue and related expenses reported in our Consolidated Financial Statements may vary, due to the amount of judgment required to address significant assumptions, risks and uncertainties in applying the application of the percentage-of-completion methodology. Our specific revenue recognition policies are as follows:
- •
- Software License Fees—License fee revenues from end-users are recognized when the software product has been shipped, provided a non-cancelable license agreement has been signed, there are no uncertainties surrounding product acceptance, the fees are fixed or determinable and collection of the related receivable is considered probable. Provided the above criteria are met, license fee revenues from resellers are recognized when there is a sell-through by a reseller to an end-user. A sell-through is determined when we receive an order form from a reseller for a specific end-user sale. We do not generally offer rights of return, acceptance clauses or price protection to our customers. In situations where software license contracts include rights of
34
- •
- Maintenance and Support—Revenues from customer maintenance and
support contracts are deferred and recognized ratably over the term of the agreements. Revenues for maintenance and support that are bundled with license fees are deferred based on the VSOE of fair
value of the bundled maintenance and support and recognized over the term of the agreement. VSOE of fair value is based on the renewal rate for continued maintenance and support arrangements.
- •
- Consulting Services—Revenues from consulting services (including training and implementation services) are recognized as services are provided to customers. Revenues for consulting services that are bundled with license fees are deferred based on the VSOE of fair value of the bundled services and recognized when the services are performed. VSOE of fair value is based on the price charged when training and consulting services are sold separately. Our subscriptions contracts are comprised of recurring software licenses, related support and applicable hosting. Because these components work interdependently we consider them to be one accounting element for which we defer recognition of the subscription fee upon contract execution and recognize it ratably over the subscription period.
return or acceptance clauses, revenue is deferred until the clause expires. Typically, our software license fees are due within a 12-month period from the date of shipment. If the fee due from the customer is not fixed or determinable, or includes payment terms greater than twelve months from shipment, revenue is recognized as payments become due and all other conditions for revenue recognition have been satisfied. In software arrangements that include rights to multiple delivered elements such as software products or specified upgrades and undelivered elements such as support or services, we allocate the total arrangement fee according to the fair value of each element using VSOE. VSOE of fair value is determined using the price charged when that element is sold separately. In software arrangements in which we have fair value of all undelivered elements but not of a delivered element, we use the residual method to record revenue. Under the residual method, the fair value of the undelivered elements is deferred and the remaining portion of the arrangement fee is allocated to the delivered element and is recognized as revenue. In software arrangements in which we do not have VSOE of fair value of all undelivered elements, revenue is deferred until fair value is determined or all elements for which we do not have VSOE of fair value, have been delivered.
Allowance for Doubtful Accounts. We maintain an allowance for doubtful accounts at an amount we estimate to be sufficient to provide adequate protection against losses resulting from extending credit to our customers. In judging the adequacy of the allowance for doubtful accounts, we consider multiple factors including historical bad debt experience, the general economic environment, the need for specific customer reserves and the aging of our receivables. This provision is included in operating expenses as a general and administrative expense. A considerable amount of judgment is required in assessing these factors. If the factors utilized in determining the allowance do not reflect future performance, then a change in the allowance would be necessary in the period such determination is made which would affect future results of operations.
Sales Returns and Allowances. We do not generally provide a contractual right of return. However, in the course of arriving at practical business solutions to various warranty and other claims, we have allowed sales returns and allowances. We record a provision against revenue for estimated sales returns and allowances on licenses and consulting in the same period the related revenues are recorded or when current information indicates additional amounts are required. These estimates are based on historical experience determined by analysis of return activities, specifically identified customers and other known factors. If the historical data we utilize does not reflect expected future performance, a change in the allowances would be recorded in the period such determination is made affecting future results of operations.
35
Valuation of Long-Lived and Intangible Assets and Goodwill. The majority of our intangible assets and goodwill resulted from our April 2006 acquisition of Intentia and our January 2010 acquisition of Healthvision. We review identifiable intangible and other long-lived assets for impairment in accordance with FASB guidance on accounting for the impairment or disposal of long-lived assets, whenever events or changes in circumstances indicate the carrying amount may not be recoverable. Events or changes in circumstances that indicate the carrying amount may not be recoverable include, but are not limited to, a significant decrease in the market value of the business or asset acquired, a significant adverse change in the extent or manner in which the business or asset acquired is used or a significant adverse change in the business climate in which we operate. If such events or changes in circumstances are present, the undiscounted cash flows method is used to determine whether the long-lived or intangible asset is impaired. Cash flows would include the estimated terminal value of the asset and exclude any interest charges. If the carrying value of the asset exceeds the undiscounted cash flows over the estimated remaining life of the asset, the asset is considered impaired, and the impairment is measured by reducing the carrying value of the asset to its fair value using the discounted cash flows method. The discount rate utilized is based on management's best estimate of the related risks and return at the time the impairment assessment is made.
On an annual basis or if events or changes in circumstances indicate the carrying amount of goodwill may not be recoverable, we review our recorded goodwill for impairment in accordance with FASB guidance related to goodwill. We conduct our annual impairment test in the fourth quarter of each fiscal year. Testing for goodwill impairment is a two step process. The first step of the goodwill impairment test, used to identify potential impairment, compares the fair value of a reporting unit with its carrying amount, including goodwill. During fiscal 2009 and in prior years, we operated as one reporting unit and therefore compared the carrying amount of our goodwill to our market value. Market value was determined utilizing our market capitalization plus a control premium. If our market value exceeded our carrying amount, goodwill was considered not impaired, thus the second step of the impairment test was not necessary. If our carrying amount exceeded our market value, the second step of the goodwill impairment test would be performed to measure the amount of impairment loss, if any. The second step of the goodwill impairment test, used to measure the amount of impairment loss, compares the implied fair value of the goodwill with its carrying amount. If the carrying amount of the goodwill exceeds the implied fair value, an impairment loss would be recognized in an amount equal to the excess. Any loss recognized cannot exceed the carrying amount of goodwill. After a goodwill impairment loss is recognized, the adjusted carrying amount of goodwill is the new accounting basis. A subsequent reversal of a previously recognized goodwill impairment loss is prohibited once the measurement of that loss is completed and the loss has been recognized.
During the first quarter of fiscal 2010, with our strategic reorganization and workforce realignment, we determined that we operate under three reportable segments: S3 Strategic Industries, M3 Strategic Industries and General Industries. For purposes of our goodwill impairment testing, we have determined that we have four reporting units: S3 Strategic Industries group, M3 Strategic Industries group, the services industries component of our General Industries group and the manufacturing & distribution component of our General Industries group. Upon this change from one reporting unit to four reporting units, effective June 1, 2009, we were required to allocate our goodwill to each reporting unit based upon their relative fair values and we were required to perform a step one goodwill impairment test.
For purposes of allocating our recorded goodwill to our new reporting units, we estimated their fair values using a combination of an income approach (discounted cash flow method) and a market approach (market comparable method). Based on the results of the first step of our impairment test, the fair value exceeded the carrying value of the net assets for all of our reporting units as of June 1, 2009. Based on our year-end assessment performed in the fourth quarter of fiscal 2010, the calculated fair values of our reporting units exceeded their carrying values by amounts between approximately
36
$23.0 million and $550.0 million, or 40.0% to 185.0% of the reporting unit carrying values, as of May 31, 2010. Accordingly, there was no impairment of our goodwill. We have no accumulated impairment charges related to our goodwill.
Income Taxes. Our provision for income taxes consists of provisions for federal, state, and foreign income taxes. We operate in an international environment with significant operations in various locations outside of the United States. Accordingly, our consolidated income tax rate is a composite rate reflecting our operating results in various locations and the applicable rates.
Significant judgment is required in determining our worldwide income tax provision. In the ordinary course of a global business, there are many transactions and calculations where the ultimate tax outcome is uncertain. Our judgments, assumptions, and estimates relative to the provision for income taxes take into account current tax laws, our interpretation of current tax laws, and possible outcomes of current and future audits conducted by foreign and domestic tax authorities. Although we believe that our estimates are reasonable, the final tax outcome of matters could be different from that which is reflected in our historical income tax provision and accruals. Such differences, if identified in future periods, could have a material effect on the amounts recorded in our Consolidated Financial Statements.
In conjunction with preparing the global tax provision, we must assess temporary differences resulting from the different treatment of specific items for tax and financial reporting purposes. These differences result in deferred tax assets and liabilities, which are included within our Consolidated Balance Sheets. As part of this process we must also assess, on a jurisdictional basis, the likelihood that deferred tax assets will be realized from future taxable income, and based on this assessment establish a valuation allowance, if required. The determination of our valuation allowance is based upon a number of assumptions, judgments, and estimates, including historical operating results, forecasted earnings and future taxable income, and the relative proportions of revenue and income before taxes in the various domestic and international jurisdictions in which we operate. To the extent we establish a valuation allowance or change the valuation allowance in a period, we reflect the change with a corresponding increase or decrease to our tax provision.
Under the provisions of the FASB guidance related to accounting for income taxes, prior to fiscal 2010, reductions to the valuation allowance related to Intentia's deferred tax assets that existed as of the date of the acquisition of Intentia were first credited against goodwill, then to the other identifiable assets existing at the date of acquisition, and then, once these assets have been reduced to zero, credited to the income tax provision. A non-cash provision will be credited against goodwill for the utilization of pre-acquisition net operating losses that had been fully reserved in purchase accounting. With our adoption of the FASB guidance related to business combinations effective June 1, 2009, beginning in fiscal 2010 any release of valuation allowances recorded through purchase accounting in relation to our acquisitions are now included as a decrease in our income tax provision.
We recognize accrued interest related to unrecognized tax benefits in tax expense. Penalties, if incurred, are also recognized as a component of tax expense. In addition, the tax effect of discrete items is booked entirely in the quarter in which the discrete event occurs.
Contingencies. We may, from time to time, have unresolved regulatory, legal, tax or other matters. See Note 13, Commitments and Contingencies. We provide for contingent liabilities in accordance with FASB guidance related to accounting for contingencies. Pursuant to this guidance, a loss contingency is charged to income when it is probable that an asset has been impaired or a liability has been incurred at the date of the financial statements and the amount of the loss can be reasonably estimated. Disclosure in the notes to the financial statements is required for loss contingencies that do not meet both conditions if there is a reasonable possibility that a loss may have been incurred. Gain contingencies are not recorded until realized. We expense all legal costs incurred to resolve regulatory, legal, tax, or other matters in the period incurred.
37
Periodically, we review the status of each significant matter to assess our potential financial exposure. If a potential loss is considered probable and the amount can be reasonably estimated as defined by the guidance related to accounting for contingencies, we reflect the estimated loss in our results of operations. Significant judgment is required to determine the probability that a liability has been incurred and whether such liability can be reasonably estimated. Because of uncertainties related to these matters, accruals are based on the best information available to us at that time. Further, estimates of this nature are highly subjective, and the final outcome of these matters could vary significantly from the amounts that have been included in the accompanying Consolidated Financial Statements. As additional information becomes available, we reassess the potential liability related to any pending claims and litigation and may revise our estimates accordingly. Such revisions in the estimates of the potential liabilities could have a material impact on our future results of operations, financial position and cash flows.
Litigation Reserves. The establishment of litigation reserves requires significant judgments concerning the ultimate outcome of pending litigation against us and our subsidiaries. Reserves established in the normal course of business are based on the application of FASB guidance related to accounting for contingencies, which requires us to record a reserve if we believe an adverse outcome is probable and we are able to make a reasonable estimation of the probable loss. Reserves established in purchase accounting are based on fair value under the FASB guidance related to business combinations so long as fair value can be determined within the purchase price allocation period. All such reserves exclude legal costs which are treated as period expenses when incurred.
Litigation by its nature is uncertain and the determination of whether any particular case involves a probable loss and quantifying the amount of loss for purposes of establishing or adjusting applicable reserves requires us to exercise considerable judgment, which is applied as of a certain date. The required reserves may change in the future due to new matters, developments in existing matters or if we determine to change our strategy with respect to the resolution of any particular matter. See Note 13, Commitments and Contingencies.
Share-Based Compensation. Effective June 1, 2006, we adopted FASB guidance on share-based payments. Under this guidance, share-based employee compensation cost is recognized using the fair value based method for all new awards granted after June 1, 2006 and unvested awards outstanding at June 1, 2006. Compensation costs for unvested stock options and non-vested awards that were outstanding at June 1, 2006, are being recognized over the requisite service period based on the grant-date fair value of those options and awards as previously calculated using a straight-line method. We elected the modified-prospective method in adopting the FASB guidance, under which prior periods are not retroactively restated.
FASB guidance on share-based payments requires companies to estimate the fair value of share-based payment awards on the date of grant using an option-pricing model. We use the Black-Scholes option-pricing model which requires the input of significant assumptions including an estimate of the average period of time employees will retain stock options before exercising them, the estimated volatility of our common stock price over the expected term, the number of options that will ultimately be forfeited before completing vesting requirements and the risk-free interest rate. Changes in the assumptions can materially affect the estimate of fair value of share-based compensation and, consequently, the related expense recognized. The assumptions we use in calculating the fair value of share-based payment awards represent our best estimates, which involve inherent uncertainties and the application of management's judgment. As a result, if factors change and we use different assumptions, our share-based compensation expense could be materially different in the future. See Note 5, Share-Based Compensation and Stock Incentive Plans, in Notes to Consolidated Financial Statements of this Form 10-K for additional information.
38
Results of Operations
The following table sets forth certain line items in our Consolidated Statements of Operations as a percentage of total revenues for the periods indicated, the period-over-period percent actual increase (decrease) and the period-over-period percent increase (decrease) on a constant currency basis, see Foreign Currency, above:
| |
Percentage of Total Revenue | Percent of Dollar Change | ||||||||||||||||||||||
|---|---|---|---|---|---|---|---|---|---|---|---|---|---|---|---|---|---|---|---|---|---|---|---|---|
| |
Years Ended May 31, | 2010 vs. 2009 | 2009 vs. 2008 | |||||||||||||||||||||
| |
2010 | 2009 | 2008 | Actual | Constant Currency |
Actual | Constant Currency |
|||||||||||||||||
| |
|
(as adjusted) |
(as adjusted) |
|
|
|
|
|||||||||||||||||
Revenues: |
||||||||||||||||||||||||
License fees |
16.9 | % | 14.5 | % | 15.5 | % | 13.2 | % | 11.5 | % | (17.0 | )% | (12.2 | )% | ||||||||||
Maintenance services |
47.9 | 46.2 | 39.5 | 0.8 | 1.7 | 4.0 | 7.7 | |||||||||||||||||
Software revenues |
64.8 | 60.7 | 55.0 | 3.7 | 4.0 | (1.9 | ) | 2.2 | ||||||||||||||||
Consulting |
35.2 | 39.3 | 45.0 | (12.8 | ) | (14.3 | ) | (22.3 | ) | (16.9 | ) | |||||||||||||
Total revenues |
100.0 | 100.0 | 100.0 | (2.8 | ) | (3.3 | ) | (11.1 | ) | (6.3 | ) | |||||||||||||
Cost of revenues: |
||||||||||||||||||||||||
Cost of license fees |
3.2 | 3.2 | 3.4 | (1.5 | ) | (5.5 | ) | (15.4 | ) | (12.7 | ) | |||||||||||||
Cost of maintenance services |
9.3 | 8.5 | 7.7 | 5.7 | 4.8 | (2.1 | ) | 3.2 | ||||||||||||||||
Cost of software revenues |
12.5 | 11.7 | 11.1 | 3.7 | 1.9 | (6.1 | ) | (1.7 | ) | |||||||||||||||
Cost of consulting |
31.1 | 35.7 | 37.4 | (15.1 | ) | (16.3 | ) | (15.2 | ) | (9.3 | ) | |||||||||||||
Total cost of revenues |
43.6 | 47.4 | 48.5 | (10.5 | ) | (11.8 | ) | (13.1 | ) | (7.5 | ) | |||||||||||||
Gross profit |
56.4 | 52.6 | 51.5 | 4.2 | 4.5 | (9.2 | ) | (5.1 | ) | |||||||||||||||
Operating expenses: |
||||||||||||||||||||||||
Research and development |
12.3 | 10.9 | 10.0 | 9.6 | 8.9 | (3.5 | ) | 3.6 | ||||||||||||||||
Sales and marketing |
22.0 | 21.5 | 22.2 | (0.4 | ) | (1.0 | ) | (13.9 | ) | (9.5 | ) | |||||||||||||
General and administrative |
11.4 | 10.5 | 11.7 | 5.7 | 6.3 | (20.4 | ) | (17.0 | ) | |||||||||||||||
Restructuring |
1.8 | 2.6 | — | (34.1 | ) | (38.0 | ) | *NM | *NM | |||||||||||||||
Amortization of acquired intangibles |
1.3 | 1.2 | 1.6 | 6.5 | 4.7 | (35.0 | ) | (30.1 | ) | |||||||||||||||
Total operating expenses |
48.8 | 46.7 | 45.5 | 1.5 | 0.9 | (8.8 | ) | (3.8 | ) | |||||||||||||||
Operating income |
7.6 | 5.9 | 6.0 | 24.9 | 36.8 | (12.4 | ) | (14.6 | ) | |||||||||||||||
Total other income (expense), net |
(2.1 | ) | (1.2 | ) | (1.6 | ) | 72.9 | 89.0 | (34.0 | ) | (37.8 | ) | ||||||||||||
Income before income taxes |
5.5 | 4.7 | 4.4 | 13.1 | 23.9 | (4.8 | ) | (6.1 | ) | |||||||||||||||
Provision for income taxes |
3.7 | 2.8 | 3.3 | 27.1 | 25.0 | (23.5 | ) | (20.0 | ) | |||||||||||||||
Net income |
1.8 | % | 1.9 | % | 1.1 | % | (8.2 | )% | 21.7 | % | 52.2 | % | 28.1 | % | ||||||||||
- *
- NM Percentage not meaningful
The discussion that follows relating to our results of operations for the comparable fiscal years ended May 31, 2010, 2009 and 2008, should be read in conjunction with the accompanying audited Consolidated Financial Statements and related Notes and with the information presented in the above table. This analysis addresses the actual changes in our results of operations for the comparable fiscal years as presented in accordance with U.S. GAAP. For changes excluding the impact of foreign currency fluctuations, see the constant currency percentages in the above table.
39
Revenues
| |
Years Ended May 31, | |
|
|
|
|||||||||||||||||||
|---|---|---|---|---|---|---|---|---|---|---|---|---|---|---|---|---|---|---|---|---|---|---|---|---|
| |
2010 | 2009 | 2008 | 2010 vs. 2009 | 2009 vs. 2008 | |||||||||||||||||||
| |
(in thousands) |
|||||||||||||||||||||||
Revenues: |
||||||||||||||||||||||||
License fees |
$ | 124,126 | $ | 109,683 | $ | 132,156 | $ | 14,443 | 13.2 | % | $ | (22,473 | ) | (17.0 | )% | |||||||||
Maintenance services |
352,986 | 350,202 | 336,779 | 2,784 | 0.8 | 13,423 | 4.0 | |||||||||||||||||
Software revenues |
477,112 | 459,885 | 468,935 | 17,227 | 3.7 | (9,050 | ) | (1.9 | ) | |||||||||||||||
Consulting |
259,296 | 297,443 | 382,991 | (38,147 | ) | (12.8 | ) | (85,548 | ) | (22.3 | ) | |||||||||||||
Total revenues |
$ | 736,408 | $ | 757,328 | $ | 851,926 | $ | (20,920 | ) | (2.8 | )% | $ | (94,598 | ) | (11.1 | )% | ||||||||
The following table sets forth revenues by reportable segment:
| |
Years Ended May 31, | |
|
|
|
|||||||||||||||||||
|---|---|---|---|---|---|---|---|---|---|---|---|---|---|---|---|---|---|---|---|---|---|---|---|---|
| |
2010 | 2009 | 2008 | 2010 vs. 2009 | 2009 vs. 2008 | |||||||||||||||||||
| |
(in thousands) |
|||||||||||||||||||||||
S3 Strategic Industries: |
||||||||||||||||||||||||
License fees |
$ | 47,676 | $ | 41,580 | $ | 38,033 | $ | 6,096 | 14.7 | % | $ | 3,547 | 9.3 | % | ||||||||||
Maintenance services |
147,954 | 134,175 | 118,705 | 13,779 | 10.3 | 15,470 | 13.0 | |||||||||||||||||
Software revenues |
195,630 | 175,755 | 156,738 | 19,875 | 11.3 | 19,017 | 12.1 | |||||||||||||||||
Consulting |
78,997 | 84,089 | 90,659 | (5,092 | ) | (6.1 | ) | (6,570 | ) | (7.2 | ) | |||||||||||||
Total S3 revenues |
$ | 274,627 | $ | 259,844 | $ | 247,397 | $ | 14,783 | 5.7 | % | $ | 12,447 | 5.0 | % | ||||||||||
M3 Strategic Industries: |
||||||||||||||||||||||||
License fees |
$ | 43,196 | $ | 36,515 | $ | 43,479 | $ | 6,681 | 18.3 | % | $ | (6,964 | ) | (16.0 | )% | |||||||||
Maintenance services |
73,168 | 74,319 | 70,435 | (1,151 | ) | (1.5 | ) | 3,884 | 5.5 | |||||||||||||||
Software revenues |
116,364 | 110,834 | 113,914 | 5,530 | 5.0 | (3,080 | ) | (2.7 | ) | |||||||||||||||
Consulting |
116,747 | 116,954 | 156,507 | (207 | ) | (0.2 | ) | (39,553 | ) | (25.3 | ) | |||||||||||||
Total M3 revenues |
$ | 233,111 | $ | 227,788 | $ | 270,421 | $ | 5,323 | 2.3 | % | $ | (42,633 | ) | (15.8 | )% | |||||||||
General Industries: |
||||||||||||||||||||||||
License fees |
$ | 33,254 | $ | 31,588 | $ | 50,644 | $ | 1,666 | 5.3 | % | $ | (19,056 | ) | (37.6 | )% | |||||||||
Maintenance services |
131,864 | 141,708 | 147,639 | (9,844 | ) | (6.9 | ) | (5,931 | ) | (4.0 | ) | |||||||||||||
Software revenues |
165,118 | 173,296 | 198,283 | (8,178 | ) | (4.7 | ) | (24,987 | ) | (12.6 | ) | |||||||||||||
Consulting |
63,552 | 96,400 | 135,825 | (32,848 | ) | (34.1 | ) | (39,425 | ) | (29.0 | ) | |||||||||||||
Total GI revenues |
$ | 228,670 | $ | 269,696 | $ | 334,108 | $ | (41,026 | ) | (15.2 | )% | $ | (64,412 | ) | (19.3 | )% | ||||||||
Total Revenues. We generate revenues from licensing software, providing maintenance on licensed products and providing consulting services. We generally utilize written contracts as the means to establish the terms and conditions by which our products, maintenance and consulting services are sold to our customers. As our maintenance and consulting services are primarily attributable to our licensed products, growth in our maintenance and consulting services is generally tied to the level of our license contracting activity.
Fiscal 2010 total revenues decreased 2.8% to $736.4 million as compared to $757.3 million in fiscal 2009. The decrease was driven by a $38.1 million, or 12.8%, decrease in our consulting revenues. This decrease was partially offset by a $17.2 million, or 3.7%, increase in our year-over-year software revenues which included a $14.4 million, or 13.2%, increase in license fees revenues as well as a $2.8 million, or less than 1.0%, increase in our maintenance services revenues.
Fiscal 2009 total revenues decreased 11.1% to $757.3 million as compared to $851.9 million in fiscal 2008. The decrease was primarily driven by an $85.5 million, or 22.3%, decrease in consulting
40
revenues as well as a 17.0% decrease in license fees revenues. These decreases were partially offset by a 4.0% increase in our maintenance services revenues.
License Fees. Our license fees primarily consist of fees resulting from products licensed to customers on a perpetual basis. Product license fees result from a customer's licensing of a given software product for the first time or with a customer's licensing of additional users for previously licensed products.
For fiscal 2010, license fees revenues increased $14.4 million, or 13.2%, compared to fiscal 2009. The increase in license fees revenues was experienced in each of our reportable segments with S3 Strategic Industries, M3 Strategic Industries and General Industries segments up $6.1 million, $6.7 million and $1.7 million, or 14.7%, 18.3% and 5.3%, respectively, compared to last year. The increase in our S3 Strategic Industries segment was primarily related to our healthcare vertical which included $2.4 million related to the operations of Healthvision and the continued benefit of the targeted sales stimulus campaign we offered our existing S3 customer base during the second half of fiscal 2009, primarily during our fourth quarter. This program favorably impacted our healthcare and services industries verticals' revenues in the first quarter of fiscal 2010 as we recognized revenue previously deferred as all revenue recognition criteria related to these transactions were met in the first quarter of fiscal 2010. Our public sector vertical as well as our human capital management product line also showed year-over-year improvements in license fees revenues during fiscal 2010. The M3 Strategic Industries improvement related primarily to increases in our equipment service management & rental vertical including the recognition in the first quarter of fiscal 2010 of certain deferred revenues on previous transactions upon the completion of customer implementation project milestones in the first quarter. In addition, license fees revenues from our channel partners within the M3 Strategic Industries segment increased as compared to last year. The increase in our General Industries segment was primarily related to license activity in our services industries vertical. License fees revenues increased in all geographies with Americas, EMEA and APAC up $7.9 million, $5.4 million and $1.1 million, respectively, for fiscal 2010 compared to last year. The total number of licensing transactions decreased in fiscal 2010 by 128 to 1,080 as compared to 1,208 in fiscal 2009. The number of licensing transactions with new customers was 93 compared to 88 last year. In fiscal 2010 we entered into 20 license transactions between $0.5 million and $1.0 million compared to 36 last year. We entered into 16 licensing transactions greater than $1.0 million in fiscal 2010 compared to nine last year. Healthvision accounted for an additional 97 licensing transactions in the current year.
For fiscal 2009, license fees revenues decreased $22.5 million to $109.7 million, or 17.0%, compared to fiscal 2008. The weakened global economy lengthened our sales cycle which negatively affected our license fees revenues during fiscal 2009. This decrease in license fees revenues was experienced in all of our geographies with EMEA, the Americas and APAC down approximately $19.7 million, $1.2 million and $1.6 million; respectively. The EMEA decrease of 36.2% was due to lower sales of our M3 solutions in our manufacturing related verticals. The Americas' decrease was primarily related to lower license fees in services industries outside of our targeted verticals and lower M3 license fees in our manufacturing vertical. These decreases were somewhat offset by increased license fees revenues related to our equipment services management & rental, healthcare and human capital management verticals. The decrease in APAC license fees revenues in fiscal 2009 was primarily related to decreased M3 licenses fees. In addition, license fees revenues for fiscal 2009 were favorably impacted by a targeted sales campaign we offered to our existing S3 customer base during the second half of fiscal 2009, primarily our fourth quarter. This program provided special terms for our customers adding new products to their Lawson solutions. The total number of licensing transactions decreased in fiscal 2009 by 337 to 1,208 as compared to 1,545 in fiscal 2008. The number of licensing transactions with new customers was 88 compared to 129 in fiscal 2008. We entered into 36 and 33 license transactions between $0.5 million and $1.0 million in fiscal 2009 and 2008, respectively. We entered into nine licensing transactions greater than $1.0 million in fiscal 2009 compared to 14 in fiscal 2008.
41
Maintenance Services. Our maintenance services revenues represent the ratable recognition of fees to enroll and renew licensed products in our maintenance programs. These fees are typically charged annually and are based on the license fees initially paid by the customer. Maintenance services revenues can fluctuate based on the number and timing of new license contracts, renewal rates and price increases.
For fiscal 2010, maintenance services revenue increased $2.8 million, or less than 1.0%, compared to fiscal 2009. This increase primarily related to a $13.8 million, or 10.3%, increase in our S3 Strategic Industries maintenance services revenues which included $7.2 million related to the operations of Healthvision. The increase was partially offset by a decrease in maintenance services revenue in our General Industries segment of $9.8 million, or 6.9%, as well as a $1.2 million, or 1.5%, decrease in our M3 Strategic Industries segment. These decreases were the result of the impact of pricing pressure and lower renewal rates due to the global economic downturn. These decreases were partially offset by maintenance agreements associated with new customers in these segments. Certain customers have decided not to renew their maintenance agreements, which we believe relates primarily to cost saving measures, bankruptcies and mergers. This is particularly true for our General Industries segment customers in manufacturing & distribution, retail and financial services industries where the continued adverse economic environment has been very challenging. In addition, other customers have chosen to continue to use older versions of our software for which maintenance programs are no longer offered. For fiscal 2010, our Americas region maintenance services revenues improved $10.1 million over fiscal 2009 while EMEA was down $7.5 million. Maintenance services revenues in APAC were relatively flat year-over-year.
For fiscal 2009, maintenance revenues increased $13.4 million to $350.2 million, or 4.0%, compared to fiscal 2008. These increases were primarily driven by annual maintenance agreement renewals with associated price increases, the continued migration of our customers, primarily in our EMEA region, to new Lawson Bronze or Silver maintenance agreements, as well as maintenance agreements associated with new customers. These increases were somewhat offset by slightly higher cancellation rates as a result of the global economic downturn.
Consulting. Our consulting revenues consist of services related to software installations, software implementations, customized development and training services for customers who have licensed our products and revenues from software subscriptions. Consulting revenues have historically, and through the first quarter of fiscal 2009, included revenues associated with our hardware business. As of August 2008, we exited the hardware business, which represented a non-core component of our business, to better concentrate our efforts on providing our solutions and related services to our targeted industries.
For fiscal 2010 consulting revenues decreased $38.1 million, or 12.8%, compared to fiscal 2009. The decrease in consulting revenues was experienced in our General Industries segment which declined $32.8 million, or 34.1%, compared to last year and our S3 Strategic Industries segment which declined $5.1 million, or 6.1%. Our M3 Strategic Industries segments consulting revenues were relatively flat, down $0.2 million, or less than 1.0%. The decrease in our General Industries segments was experienced in both our service industries and manufacturing & distribution verticals as a result of a reduction in our number of billable consultants primarily in our M3 resources in our EMEA region in fiscal 2010 as compared to last year as well as lower bookings for our consulting and implementation services in our EMEA region. During fiscal 2010, we continued to reduce the size of our consulting staff as part of our strategy to move more implementation services to our partner channel as well as in response to the lower consulting demand. Over the past year, we have reduced our number of service consultants by approximately 25%, including actions taken in our second quarter and our most recent action announced on May 27, 2010. See Note 3, Restructuring, in Notes to Consolidated Financial Statements of this Form 10-K for more information about these actions. The decrease in our S3 Strategic Industries segment related primarily to our healthcare vertical where we were involved in larger consulting engagements in fiscal 2009 as compared to the current year. Within our S3 Strategic
42
Industries segment, Healthvision contributed consulting revenues of $5.7 million. Within our M3 Strategic Industries segment we were able to sustain our level of consulting revenues in fiscal 2010 despite the lower number of consultants primarily due to certain large engagements in our equipment services management & rental vertical. In fiscal 2010 our consulting revenues were down $36.9 million and $4.1 million in our EMEA and Americas regions, respectively, as compared to fiscal 2009. Consulting revenues in our APAC region were up $2.8 million in fiscal 2010 compared to fiscal 2009.
Consulting revenues for fiscal 2009 decreased $85.5 million to $297.4 million, or 22.3%, compared to fiscal 2008. This decrease was primarily related to us lowering the number of billable consultants in fiscal 2009 as compared to fiscal 2008 as well as lower bookings for our consulting and implementation services as a result of decreased licensing activity in fiscal 2009 for both new and existing customers. This decrease in consulting revenues was experienced in all our geographies with our EMEA region showing the largest decreases of $69.8 million to $144.8 million, or 32.5%, in fiscal 2009 as compared to fiscal 2008. EMEA's consulting revenues were also negatively impacted by execution issues which contributed to lower utilization as well as experiencing a lower billable rate per hour on certain fixed-price projects. In addition, hardware revenues decreased $8.1 in fiscal 2009 compared to fiscal 2008. The decrease in hardware revenues was the result of exiting this non-core component of our business during the first quarter of fiscal 2009.
Deferred Revenue. Certain of our revenues are deferred when all conditions of revenue recognition have not been met. Deferred revenue represents revenue that is to be recognized in future periods when such conditions have been satisfied related to certain license agreements, maintenance contracts and certain consulting arrangements as discussed above. We had total deferred revenues of $328.2 million at May 31, 2010 compared to $292.5 million at May 31, 2009.
The following table sets forth the components of deferred revenue (in thousands):
| |
May 31, 2010 | May 31, 2009 | ||||||
|---|---|---|---|---|---|---|---|---|
License fees |
$ | 39,221 | $ | 55,667 | ||||
Maintenance |
275,237 | 224,115 | ||||||
Consulting |
13,702 | 12,741 | ||||||
Total deferred revenue |
328,160 | 292,523 | ||||||
Less current portion |
(319,797 | ) | (279,041 | ) | ||||
Deferred revenue—non-current |
$ | 8,363 | $ | 13,482 | ||||
In general, changes in the balance of our deferred revenue are cyclical and primarily driven by the timing of our maintenance services renewal cycles. Our renewal dates occur in the third and fourth quarters of our fiscal year with revenues being recognized ratably over the applicable service periods. The increase in the May 31, 2010 balance as compared to May 31, 2009 was primarily due to the timing of billings and related collections associated with our maintenance contracts and the inclusion of deferred revenue balances related to our acquisition of Healthvision. These increases were somewhat offset by a decrease in deferred license revenues as we recognized certain deferred license fees revenues in the first half of fiscal 2010 primarily relating to contracts entered into in the fourth quarter of fiscal 2009 under our targeted sales campaign offered to our existing S3 customer base.
43
Cost of Revenues
| |
Years Ended May 31, | |
|
|
|
|||||||||||||||||||
|---|---|---|---|---|---|---|---|---|---|---|---|---|---|---|---|---|---|---|---|---|---|---|---|---|
| |
2010 | 2009 | 2008 | 2010 vs. 2009 | 2009 vs. 2008 | |||||||||||||||||||
| |
(in thousands) |
|||||||||||||||||||||||
Cost of revenues: |
||||||||||||||||||||||||
Cost of license fees |
$ | 23,987 | $ | 24,361 | $ | 28,782 | $ | (374 | ) | (1.5 | )% | $ | (4,421 | ) | (15.4 | )% | ||||||||
Cost of maintenance services |
68,233 | 64,533 | 65,885 | 3,700 | 5.7 | (1,352 | ) | (2.1 | ) | |||||||||||||||
Cost of software revenues |
92,220 | 88,894 | 94,667 | 3,326 | 3.7 | (5,773 | ) | (6.1 | ) | |||||||||||||||
Cost of consulting |
228,874 | 269,738 | 318,253 | (40,864 | ) | (15.1 | ) | (48,515 | ) | (15.2 | ) | |||||||||||||
Total cost of revenues |
$ | 321,094 | $ | 358,632 | $ | 412,920 | $ | (37,538 | ) | (10.5 | )% | $ | (54,288 | ) | (13.1 | )% | ||||||||
Gross profit: |
||||||||||||||||||||||||
License fees |
$ | 100,139 | $ | 85,322 | $ | 103,374 | $ | 14,817 | 17.4 | % | $ | (18,052 | ) | (17.5 | )% | |||||||||
Maintenance services |
284,753 | 285,669 | 270,894 | (916 | ) | (0.3 | ) | 14,775 | 5.5 | |||||||||||||||
Total software gross profit |
384,892 | 370,991 | 374,268 | 13,901 | 3.7 | (3,277 | ) | (0.9 | ) | |||||||||||||||
Consulting |
30,422 | 27,705 | 64,738 | 2,717 | 9.8 | (37,033 | ) | (57.2 | ) | |||||||||||||||
Total gross profit |
$ | 415,314 | $ | 398,696 | $ | 439,006 | $ | 16,618 | 4.2 | % | $ | (40,310 | ) | (9.2 | )% | |||||||||
Gross margin: |
||||||||||||||||||||||||
License fees |
80.7 | % | 77.8 | % | 78.2 | % | ||||||||||||||||||
Maintenance services |
80.7 | % | 81.6 | % | 80.4 | % | ||||||||||||||||||
Total software |
80.7 | % | 80.7 | % | 79.8 | % | ||||||||||||||||||
Consulting |
11.7 | % | 9.3 | % | 16.9 | % | ||||||||||||||||||
Total |
56.4 | % | 52.6 | % | 51.5 | % | ||||||||||||||||||
Cost of License Fees. Cost of license fees includes royalties to third-parties, amortization of acquired software and software delivery expenses. Our software solutions may include embedded components of third-party vendors for which a fee is paid to the vendor upon the sale of our products. In addition, we resell third-party products in conjunction with the license of our software solutions, which also results in a fee. The cost of license fees is higher, as a percentage of revenues, when we resell products of third-party vendors. As a result, license fees gross margins will vary depending on the proportion of third-party product sales in our revenue mix.
Cost of license fees remained relatively flat for fiscal 2010 compared to fiscal 2009, down less than $0.4 million, or 1.5%. The decrease was primarily related to lower third-party costs of $2.3 million primarily due to a favorable product mix. In addition, amortization expenses related to our acquired intellectual property excluding Healthvision decreased $1.1 million. These decreases were mostly offset by an increase of $4.3 million related to the operations of Healthvision. License fees gross margin for fiscal 2010 improved to 80.7%, as compared to 77.8% in fiscal 2009 as a result of higher license fees revenue in fiscal 2010 as well as a favorable product mix.
Cost of license fees decreased $4.4 million to $24.4 million, or 15.4%, in fiscal 2009 compared to fiscal 2008. This decrease was primarily due to a decrease in third-party royalty fees driven by lower license fees volume and the mix of products sold in fiscal 2009 as well as a decrease in amortization expenses related to our acquired intellectual property. License fees gross margin for fiscal 2009 was down slightly at 77.8% compared to 78.2% in fiscal 2008 due to the lower license volume.
Cost of Maintenance. Cost of maintenance includes salaries, employee benefits, related travel, third-party maintenance costs associated with embedded and non-embedded third-party products and the overhead costs of providing support.
Cost of maintenance for fiscal 2010 increased $3.7 million, or 5.7%, compared to fiscal 2009. This increase was primarily due to a $3.7 million increase related to the operations of Healthvision. In addition, net employee related costs increased $3.9 million. These increases were somewhat offset by a
44
$3.5 million decrease in third-party costs. Maintenance gross margin for fiscal 2010 was 80.7%, down slightly from 81.6% in fiscal 2009.
Cost of maintenance for fiscal 2009 decreased $1.4 million to $64.5 million, or 2.1%, compared to fiscal 2008. This decrease was primarily due to a $2.6 million decrease in subcontractors and other expenses related to intercompany support services, $0.6 million related to employee related costs and a $0.8 million decrease in amortization expense related to our acquired intellectual property. These decreases were somewhat offset by a $1.8 million increase in information technology and other infrastructure costs and a $0.7 million increase in third-party costs. Maintenance gross margin for fiscal 2009 was 81.6%, up from 80.4% in fiscal 2008 primarily as a result of continued leveraging of operational efficiencies.
Cost of Consulting. Cost of consulting includes salaries, employee benefits, third-party consulting costs, related travel, the overhead costs of providing implementation, installation, training and education services to customers. Cost of consulting also includes costs associated with our hardware business, which we exited in the first quarter of fiscal 2009.
For the comparable fiscal years 2010 and 2009, cost of consulting decreased $40.9 million or 15.1%. This decrease was primarily due to a $26.3 million decrease in employee related costs resulting from significantly lowering our billable headcount during fiscal 2010 as compared fiscal 2009. In addition, third-party costs decreased $14.3 million and billable travel decreased $4.7 million in-line with our lower consulting revenues. Partially offsetting these decreases was $4.2 million related to the operations of Healthvision. Consulting gross margin for fiscal 2010 improved to 11.7% compared to 9.3% in fiscal 2009 primarily due to the management of our costs of consulting and the favorable impact of Healthvision.
For fiscal 2009, cost of consulting decreased $48.5 million to $269.7 million, or 15.2%, as compared to fiscal 2008. This decrease was primarily driven by a $27.0 million decrease in employee related costs, a $13.5 million decrease in third-party costs relating to our lower consulting revenues, a $5.1 million decrease in hardware costs associated with exiting our hardware business, a $4.7 million decrease in billable travel and a $2.3 million decrease related to information technology and other infrastructure costs. These decreases were somewhat offset by a $2.4 million increase in costs related to our managed and hosted services offerings and a $1.7 million increase in other expenses related to intercompany support services. Consulting gross margin for fiscal 2009 decreased to 9.3% compared to 16.9% in fiscal 2008 as our decrease in consulting revenues has outpaced the decrease in our cost of consulting primarily due to the timing of the employee actions taken in conjunction with our fiscal 2009 restructuring plans. Certain of these actions occurred late in February 2009 and in May 2009 such that our fiscal 2009 operations did not fully benefit from the reduced headcount. Note 3, Restructuring, in Notes to Consolidated Financial Statements of this Form 10-K for more information.
45
Operating Expenses
| |
Years Ended May 31, | |
|
|
|
|||||||||||||||||||
|---|---|---|---|---|---|---|---|---|---|---|---|---|---|---|---|---|---|---|---|---|---|---|---|---|
| |
2010 | 2009 | 2008 | 2010 vs. 2009 | 2009 vs. 2008 | |||||||||||||||||||
| |
(in thousands) |
|||||||||||||||||||||||
Operating Expenses: |
||||||||||||||||||||||||
Research and development |
$ | 90,268 | $ | 82,377 | $ | 85,374 | $ | 7,891 | 9.6 | % | $ | (2,997 | ) | (3.5 | )% | |||||||||
Sales and marketing |
162,245 | 162,975 | 189,336 | (730 | ) | (0.4 | ) | (26,361 | ) | (13.9 | ) | |||||||||||||
General and administrative |
84,306 | 79,765 | 100,259 | 4,541 | 5.7 | (20,494 | ) | (20.4 | ) | |||||||||||||||
Restructuring |
13,154 | 19,954 | (731 | ) | (6,800 | ) | (34.1 | ) | 20,685 | *NM | ||||||||||||||
Amortization of acquired intangibles |
9,472 | 8,892 | 13,690 | 580 | 6.5 | (4,798 | ) | (35.0 | ) | |||||||||||||||
Total operating expenses |
$ | 359,445 | $ | 353,963 | $ | 387,928 | $ | 5,482 | 1.5 | % | $ | (33,965 | ) | (8.8 | )% | |||||||||
- *
- NM Percentage not meaningful
Research and Development. Research and development expenses consist primarily of salaries, employee benefits, related overhead costs and consulting fees associated with product development, testing, quality assurance, documentation, enhancements and upgrades.
Research and development expenses for fiscal 2010 increased $7.9 million, or 9.6%, compared to fiscal 2009. This increase was primarily due to a net increase in employee related costs of $5.5 million related to increased incentive compensation as well as an increase in our offshore capacity in Manila. The increased headcount also resulted in a $2.4 million increase in information technology and other infrastructure costs which was partially offset by a $1.7 million decrease in third-party costs as well as a $1.0 million decrease in professional fees. Healthvision's operations accounted for $2.3 million of the increase.
Research and development decreased $3.0 million to $82.4 million, or 3.5%, for fiscal 2009 compared to fiscal 2008. This decrease was primarily due to a decrease of $3.6 million in employee related costs, a $2.1 million decrease in third-party costs, and a $0.8 million decrease in the cost of computer leases and supplies. These increases were partially offset by a $4.1 million increase in information technology and other infrastructure costs.
Sales and Marketing. Sales and marketing expenses consist primarily of salaries and incentive compensation, employee benefits, travel and overhead costs related to our sales and marketing personnel, as well as trade show activities, advertising costs and other costs associated with our Company's marketing activities.
For the fiscal 2010, sales and marketing expenses decreased $0.7 million, or 0.4%, compared to the similar period in fiscal 2009. The decrease was primarily the result of a $1.8 million decrease in marketing program costs, a $1.0 million decrease in professional fees, a $0.6 million decrease in third-party costs and a $0.5 million decrease in employee related costs due to lower headcount and lower travel expenses. Partially offsetting these decreases was $3.3 million related to the operations of Healthvision.
Sales and marketing expenses decreased $26.4 million to $163.0 million, or 13.9%, in fiscal 2009 when compared to fiscal 2008. This decrease was primarily the result of a $25.3 million decrease in employee related costs due to lower headcount and decreased sales incentive compensation due to lower license contracting in fiscal 2009 compared to fiscal 2008. The decrease in employee related costs is net of the $1.9 million effect of a fourth quarter fiscal 2008 under accrual of sales incentive compensation in EMEA recorded in fiscal 2009. See Note 1, Nature of Business and Basis of Presentation—Fiscal 2009 Results of Operations. In addition, costs incurred for marketing programs decreased $3.3 million in fiscal 2009. These decreases were partially offset by a $3.0 million increase related to information technology and other infrastructure costs.
46
General and Administrative. General and administrative expenses consist primarily of salaries, employee benefits and related overhead costs for administrative employees, as well as legal and accounting expenses, consulting fees and bad debt expense. We deem certain of these items to be shared services and accordingly allocate the related expenses to other functional line items within cost of revenues and operating expenses, primarily based on headcount. These administration allocations have no impact on our overall operating margins for any of the fiscal periods presented.
General and administrative expenses increased $4.5 million, or 5.7%, in fiscal 2010 compared fiscal 2009. The increase was primarily the result of $4.4 million related to adjustments recorded to our pre-merger litigation reserve recorded in fiscal 2009 without comparable adjustments in fiscal 2010 (See Note 13, Commitments and Contingencies—Legal, in Notes to Consolidated Financial Statements of this Form 10-K for more information). Other increases included a $2.6 million increase in professional fees primarily legal fees, $1.6 million of acquisition transaction and merger related integration expenses, a write-off of certain capitalized software costs of $1.1 million, $1.0 million related to the impact of foreign currency translation and a $1.9 million increase related to the operations of Healthvision. These increases were mostly offset by a decrease of $6.7 million in infrastructure and computer lease costs and a decrease in bad debt expense of $1.7 million in fiscal 2010 compared fiscal 2009 primarily due to strong cash collections on accounts receivables.
General and administrative expenses decreased $20.5 million to $79.8 million, or 20.4%, in fiscal 2009 compared to fiscal 2008. This decrease was primarily due to a $7.6 million decrease related to information technology and other infrastructure costs, including allocations, a $4.3 million decrease in employee related costs, a $4.9 million decrease related to a change in the impact of foreign currency translations in fiscal 2009 compared to fiscal 2008, a $3.3 million decrease in contractor fees as we hired additional permanent finance and accounting personnel over the course of fiscal 2008 for positions previously filled by contractors, a $1.6 million decrease in professional fees and a $1.2 million decrease related to adjustments to our pre-merger litigation reserve as certain related claims settled at amounts less than anticipated and our receipt of insurance settlements in the second quarter of fiscal 2009. These decreases were partially offset by a $2.0 million increase in bad debt expense.
Restructuring. During fiscal 2010, we recorded restructuring charges of $13.2 million compared to restructuring charges of $20.0 million in fiscal 2009 and a restructuring accrual reversal of $0.7 million in fiscal 2008. The fiscal 2008 reversal relates to adjustments to the original accrual established in fiscal 2007.
Fiscal 2010 Restructurings
Fiscal 2010 Q2. On September 30, 2009, we approved a plan to further restructure our workforce. Under this plan, we reduced our workforce by approximately 65 employees. The majority of the reductions occurred within our consulting practice in our EMEA region. These actions were undertaken as a further refinement of our new vertical organization, including a resizing of our services business to leverage our partner channel, and in light of current demand for our consulting and implementation services in EMEA. The majority of the actions related to this plan were completed by the end of the second quarter of fiscal 2010. The restructuring action resulted in pre-tax charges of $4.6 million for severance pay and related benefits which we recorded in the second quarter of fiscal 2010. Substantially all of this amount will result in future cash expenditures. We expect that the majority of the remaining severance and related benefits will be paid by the third quarter of fiscal 2011. Annualized cost and expense savings from these actions are estimated to be approximately $6.0 million.
Fiscal 2010 Q4. On May 27, 2010, we approved and began implementing a plan to restructure our workforce including the elimination of approximately 160 employees. The workforce reduction relates primarily to our M3 operations in Europe, the United States and Manila within our M3 Strategic Industries and General Industries business segments. Departures of affected personnel are expected to be substantially completed by the end of the first quarter of fiscal 2011. In connection with these
47
actions we recorded pre-tax charges of $7.1 million in the fourth quarter of fiscal 2010 for severance pay and related benefits; substantially all of which will result in future cash expenditures. The majority of the severance and related benefits will be paid by the end of fiscal 2011. Annualized cost savings from this restructuring are estimated to be $15.0 million. We anticipate these cost savings will be offset by investments in other areas of the Company.
In relation to the fiscal 2010 restructuring actions, we made cash payments of approximately $2.9 million for severance pay and related benefits during the year. In addition, we recorded a $0.2 million net reduction in the second quarter of fiscal 2010 primarily as a result of a reduction in the number of affected employees.
Fiscal 2009 Restructurings
Fiscal 2009 Q2. On November 18, 2008, we announced the implementation of cost reduction measures in light of the uncertainty in global economic conditions and in light of other operating margin improvement initiatives. These cost reduction initiatives included a restructuring plan resulting in the reduction of approximately 285 employees and exiting certain leased facilities. In relation to these actions we recorded a pre-tax charge of approximately $7.9 million in the second quarter of fiscal 2009 and an additional $3.4 million in the third quarter of fiscal 2009. Actions related to severance were substantially completed by February 28, 2009, with related cash payments expected to continue through August 2010. Payments related to the exited facilities are expected to continue through November 2011.
Fiscal 2009 Q4. On May 18, 2009, we initiated a plan to restructure our workforce in preparation for the fiscal 2010 vertical realignment of our organization. The restructuring involved the reduction of our workforce by approximately 150 employees and the consolidation of space in certain of our leased facilities. Actions related to this plan were completed by the end of our third quarter of fiscal 2010. The plan resulted in pre-tax charges of approximately $5.3 million for severance and related benefits and the consolidation of leased facilities resulted in pre-tax charges of approximately $3.8 million which we recorded in the fourth quarter of fiscal 2009. We expect the majority of the severance and related benefits to continue through September 2010 while the leased facilities costs will be paid through December 2011.
In relation to the fiscal 2009 restructuring actions, we made cash payments of $5.8 million relating to severance and related benefits and $3.1 million related to the exited facilities during fiscal 2010. In addition, we recorded net adjustments to the accruals of approximately $0.4 million including additional expenses accrued related to exited leased facilities net of a change to accrued severance and related benefits due to a reduction in the number of affected employees. As of May 31, 2010, we had an accrual of $3.7 million: $0.7 million for severance and related benefits and $3.0 million for the estimated fair value of our liability for the exited facilities. As of May 31, 2009, the accrual totaled $12.0 million: $6.5 million for severance and related benefits and $5.5 million for the exited facilities.
Fiscal 2007 Restructuring
On February 28, 2007, we restructured our workforce by approximately 250 employees to rebalance our resources between various locations primarily in the U.S., Europe and our global support center in the Philippines. This reduction resulted in a pre-tax charge of $11.9 million which we recorded in the third quarter of fiscal 2007. As of May 31, 2009 we had an accrual of $0.8 million for severance and related benefits. In fiscal 2010, we paid severance and related benefits of $0.6 million and we recorded $0.2 million in adjustments to eliminate the remaining accrual.
Fiscal 2006 Restructuring
On April 26, 2006, in conjunction with our business combination with Intentia International AB (Intentia), we approved a plan designed to eliminate employee redundancies in both Intentia and
48
Legacy Lawson. These actions included the reduction of approximately 185 employees and the exit of or reduction in leased space. As of May 31, 2009, we had an accrual of $3.0 million for the exit or reduction of leased facilities. In fiscal 2010 we made cash payments of $0.8 million related to exited facilities. During the second and fourth quarters of fiscal 2010, we made adjustments to reduce lease exit costs of approximately $0.6 million for changes in estimates relating to the original lease restructuring plan. These adjustments resulted in a reduction of acquired goodwill. In addition, we recorded a $1.5 million increase in our lease accrual in the third quarter of fiscal 2010 as a result of an early exit by a subtenant. The remaining accrual as of May 31, 2010 was $2.9 million for the exit of or reduction in leased space. Actions relating to severance were completed in the third quarter of fiscal 2008. We expect cash payments related to exited facilities or reduced space to continue through June 2012.
As a result of our restructuring plans and the realignment of our workforce, we have experienced cost savings from the lower facility expenses and reduced headcount and expect these savings to continue.
Amortization of Acquired Intangibles. Amortization of acquired intangibles primarily relates to the on-going amortization of intangibles acquired in the Intentia merger, our acquisition of Healthvision as well as other acquisitions. For fiscal 2010, amortization increased $0.6 million, or 6.5%, to $9.5 million compared to fiscal 2009. This increase was primarily due to $2.0 million in amortization of intangible assets acquired in our acquisition of Healthvision. Partially offsetting this were decreases related to the amortization of certain intangible assets on an accelerated basis resulting in a higher rate of amortization in fiscal 2009 as compared to fiscal 2010 as well as certain intangibles being fully amortized in fiscal 2009 with no corresponding amortization recorded in the current periods of fiscal 2010.
For fiscal 2009, amortization decreased $4.8 million to $8.9 million, or 35.0%, as compared to fiscal 2008. This decrease was primarily due to certain intangibles being fully amortized in fiscal 2008, with no corresponding amortization in fiscal 2009, and the amortization of certain intangible assets on an accelerated basis resulting in higher amortization in fiscal 2008 as compared to fiscal 2009.
Other Income (Expenses), Net
Total other income (expense), net, consisting of interest income earned from cash, marketable securities and other investments, interest expense, and other associated costs, was a net expense of $15.2 million, $8.8 million and $13.3 million in fiscal 2010, 2009 and 2008, respectively.
The $6.4 million increase in other net expense in fiscal 2010 compared to 2009 was primarily due to a $5.4 million decrease in interest income resulting from lower yields due to lower market interest rates from our investments primarily in money market funds and time deposits and lower average investment balances including the impact of our cash used to acquire Healthvision. Interest expense also increased $0.6 million primarily due to the impact of our adoption of the FASB guidance on accounting for convertible debt securities which required us to record net additional non-cash interest of approximately $8.2 million and $7.7 million in fiscal 2010 and retrospectively in fiscal 2009, respectively.
The $4.5 million decrease in other net expense in fiscal 2009 compared to fiscal 2008 was primarily due to the impairment charges we recorded related to our investments in auction rate securities of $18.4 million in fiscal 2008. In addition, during 2009 we realized $13.8 million less of investment income primarily due to lower market interest rates and our more conservative asset allocation approach in response to economic conditions. The year-over-year decreases in our average investment balances and related investment income were also the result of our investments in auction rate securities being sold in the first quarter of fiscal 2009, as well as a decrease in our investments in marketable securities during fiscal 2009. We transitioned our investments to cash and cash equivalents,
49
primarily treasuries and money market funds, and as a result we experienced lower yields in fiscal 2009 as compared to fiscal 2008. In addition, interest expense decreased $0.4 million in fiscal 2009 compared to fiscal 2008 including the impact of our adoption of the FASB guidance on accounting for convertible debt securities which required us to retrospectively record net additional non-cash interest of approximately $7.7 million and $7.1 million in fiscal 2009 and fiscal 2008, respectively.
Provision for Income Taxes
For fiscal 2010 our global provision for income taxes was $27.6 million as compared to $21.7 million for fiscal 2009. Our global provision increased due to an increase in taxable income and to a lesser extent from the accrual of additional income tax provision that should have been recorded in previous periods. See Note 1, Nature of Business and Basis of Presentation—Fiscal 2010 Results of Operations. Our effective income tax rate for fiscal 2010 was 67.9%. Our effective rate for the year was negatively impacted by 28.9% for unbenefited foreign losses. See Note 12, Income Taxes, in Notes to Consolidated Financial Statements of this Form 10-K for our full rate reconciliation.
In addition, during fiscal 2010, we recorded income tax benefits of less than $0.1 million for tax deductions in excess of historical book deductions related to employee stock option exercises, as compared to $0.7 million in fiscal 2009. These tax benefits, which decreased current income taxes payable and increased additional paid-in capital by equal amounts, had no effect on our provision for income taxes; however, it did result in a decrease in the amount of our cash tax payments.
For fiscal 2009 our global provision for income taxes was $21.7 million as compared to $28.4 million for fiscal 2008. The decrease in our global provision was primarily related to the non-recurrence of a fiscal 2008 capital loss on an other-than-temporary impairment charge on auction rate securities for which no tax benefit was expected. Our effective income tax rate for fiscal 2009 was 60.5%. The rate for fiscal 2009 was positively impacted by 9.5% for discrete items related to the release of valuation allowances in various foreign jurisdictions in which it is now more likely than not that certain tax benefits associated with our deferred tax assets will be utilized prior to expiration. Our effective rate for the year was also negatively impacted by 35.6% for unbenefited foreign losses.
In April 2006, the Company acquired Intentia. As of the date of the acquisition, many of the Intentia legal entities had deferred tax assets for which future realization of tax benefits was uncertain and therefore had a full valuation allowance applied against them. Under the provisions of the FASB guidance related to accounting for income taxes, if acquired deferred tax assets are ultimately expected to be realized and related valuation allowances are reversed this will not result in a tax benefit but rather a reduction of goodwill. However, with our adoption of the FASB guidance related to business combinations effective June 1, 2009, beginning in fiscal 2010 any release of valuation allowances originally recorded through purchase accounting in relation to our acquisitions are included as a benefit in our tax provision rather than as an adjustment to goodwill.
Non-GAAP Financial Measure Reconciliations
We believe our presentation of non-GAAP revenues, operating income, operating margin, net income and diluted net income per share provide meaningful insight into our operating performance and an alternative perspective of our results of operations. We use these non-GAAP measures to assess our operating performance, to develop budgets, to serve as a measurement for incentive compensation awards and to manage expenditures. Presentation of these non-GAAP measures allows investors to review our results of operations from the same perspective as management and our Board of Directors. These non-GAAP financial measures provide investors an enhanced understanding of our operations, facilitate investors' analysis and comparisons of our current and past results of operations, facilitate comparisons of our operating results with those of our competitors and provide insight into the prospects of our future performance. We also believe that the non-GAAP measures are useful to investors because they provide supplemental information that research analysts frequently use to analyze software companies including those that have recently made significant acquisitions.
50
The method we use to produce non-GAAP results is not in accordance with U.S. GAAP and may differ from the methods used by other companies. These non-GAAP results should not be regarded as a substitute for corresponding U.S. GAAP measures but instead should be utilized as a supplemental measure of operating performance in evaluating our business. Non-GAAP measures do have limitations in that they do not reflect certain items that may have a material impact upon our reported financial results. As such, these non-GAAP measures should be viewed in conjunction with both our financial statements prepared in accordance with U.S. GAAP and the reconciliation of the supplemental non-GAAP financial measures to the comparable U.S. GAAP results provided for each period presented below (in thousands, except per share amounts):
| |
Years Ended May 31, | |
|
|
|
||||||||||||||||||
|---|---|---|---|---|---|---|---|---|---|---|---|---|---|---|---|---|---|---|---|---|---|---|---|
| |
2010 | 2009 | 2008 | 2010 vs. 2009 | 2009 vs. 2008 | ||||||||||||||||||
GAAP revenue |
$ | 736,408 | $ | 757,328 | $ | 851,926 | $ | (20,920 | ) | (2.8 | )% | $ | (94,598 | ) | (11.1 | )% | |||||||
Non-GAAP revenue adjustments: |
|||||||||||||||||||||||
Purchase accounting impact on maintenance revenues |
4,274 | 538 | 1,438 | ||||||||||||||||||||
Purchase accounting impact on consulting revenues |
1,473 | — | 232 | ||||||||||||||||||||
Non-GAAP revenue adjustments |
5,747 | 538 | 1,670 | ||||||||||||||||||||
Non-GAAP revenue |
$ | 742,155 | $ | 757,866 | $ | 853,596 | $ | (15,711 | ) | (2.1 | )% | $ | (95,730 | ) | (11.2 | )% | |||||||
| |
Years Ended May 31, | |
|
|
|
||||||||||||||||||
|---|---|---|---|---|---|---|---|---|---|---|---|---|---|---|---|---|---|---|---|---|---|---|---|
| |
2010 | 2009 | 2008 | 2010 vs. 2009 | 2009 vs. 2008 | ||||||||||||||||||
GAAP operating income |
$ | 55,869 | $ | 44,733 | $ | 51,078 | $ | 11,136 | 24.9 | % | $ | (6,345 | ) | (12.4 | )% | ||||||||
GAAP operating margin |
7.6 | % | 5.9 | % | 6.0 | % | |||||||||||||||||
Non-GAAP revenue adjustments |
5,747 | 538 | 1,670 | ||||||||||||||||||||
Non-GAAP costs/operating expense adjustments: |
|||||||||||||||||||||||
Purchase accounting impact on consulting costs |
— | 150 | 525 | ||||||||||||||||||||
Amortization of purchased maintenance contracts |
1,974 | 2,607 | 3,369 | ||||||||||||||||||||
Stock-based compensation |
17,026 | 8,519 | 6,741 | ||||||||||||||||||||
Pre-merger claims reserve adjustment |
(661 | ) | (5,021 | ) | (3,827 | ) | |||||||||||||||||
Acquisition transaction and integration costs |
1,571 | — | — | ||||||||||||||||||||
Pension gain |
(1,850 | ) | — | — | |||||||||||||||||||
Restructuring |
13,154 | 19,954 | (731 | ) | |||||||||||||||||||
Amortization of acquired intangibles |
22,877 | 19,934 | 25,988 | ||||||||||||||||||||
Total non-GAAP costs/operating expense adjustments |
54,091 | 46,143 | 32,065 | ||||||||||||||||||||
Non-GAAP operating income |
$ | 115,707 | $ | 91,414 | $ | 84,813 | $ | 24,293 | 26.6 | % | $ | 6,601 | 7.8 | % | |||||||||
Non-GAAP operating margin |
15.6 | % | 12.1 | % | 9.9 | % | |||||||||||||||||
| |
Years Ended May 31, | |
|
|
|
|||||||||||||||||
|---|---|---|---|---|---|---|---|---|---|---|---|---|---|---|---|---|---|---|---|---|---|---|
| |
2010 | 2009 | 2008 | 2010 vs. 2009 | 2009 vs. 2008 | |||||||||||||||||
GAAP net income(1) |
$ | 13,024 | $ | 14,191 | $ | 9,322 | $ | (1,167 | ) | (8.2 | )% | $ | 4,869 | 52.2 | % | |||||||
Non-GAAP revenue adjustments |
5,747 | 538 | 1,670 | |||||||||||||||||||
Non-GAAP costs/operating expense adjustments |
54,091 | 46,143 | 32,065 | |||||||||||||||||||
Non-cash interest expense related to convertible debt |
8,486 | 7,948 | 7,386 | |||||||||||||||||||
Impairment on long-term investments |
— | — | 18,413 | |||||||||||||||||||
Tax provision adjustment(2) |
(12,703 | ) | (9,962 | ) | (9,037 | ) | ||||||||||||||||
Non-GAAP net income |
$ | 68,645 | $ | 58,858 | $ | 59,819 | $ | 9,787 | 16.6 | % | $ | (961 | ) | (1.6 | )% | |||||||
51
| |
Years Ended May 31, | |
|
|
|
|||||||||||||||||
|---|---|---|---|---|---|---|---|---|---|---|---|---|---|---|---|---|---|---|---|---|---|---|
| |
2010 | 2009 | 2008 | 2010 vs. 2009 | 2009 vs. 2008 | |||||||||||||||||
GAAP net income per diluted share(1) |
$ | 0.08 | $ | 0.08 | $ | 0.05 | $ | 0.00 | (6.5 | )% | $ | 0.03 | 63.3 | % | ||||||||
Purchase accounting impact on revenue |
0.03 | 0.00 | 0.01 | |||||||||||||||||||
Purchase accounting impact on consulting costs |
— | 0.00 | 0.00 | |||||||||||||||||||
Amortization of purchased maintenance contracts |
0.01 | 0.02 | 0.02 | |||||||||||||||||||
Stock-based compensation |
0.10 | 0.05 | 0.04 | |||||||||||||||||||
Pre-merger claims reserve adjustment |
(0.00 | ) | (0.03 | ) | (0.02 | ) | ||||||||||||||||
Acquisition transaction and integration costs |
0.01 | — | — | |||||||||||||||||||
Pension gain |
(0.01 | ) | — | — | ||||||||||||||||||
Restructuring |
0.08 | 0.12 | (0.00 | ) | ||||||||||||||||||
Amortization of acquired intangibles |
0.14 | 0.12 | 0.14 | |||||||||||||||||||
Non-cash interest expense related to convertible debt |
0.05 | 0.05 | 0.04 | |||||||||||||||||||
Impairment on long-term investments |
— | — | 0.10 | |||||||||||||||||||
Tax provision adjustment |
(0.08 | ) | (0.06 | ) | (0.05 | ) | ||||||||||||||||
Non-GAAP net income per diluted share |
$ | 0.42 | $ | 0.35 | $ | 0.33 | $ | 0.07 | 17.8 | % | $ | 0.02 | 6.5 | % | ||||||||
Weighted average shares—basic |
161,442 | 164,011 | 177,283 | |||||||||||||||||||
Weighted average shares—diluted |
165,251 | 166,393 | 180,580 | |||||||||||||||||||
- (1)
- Adjusted
to reflect adoption of the FASB guidance on accounting for convertible debt securities. See Note 2, Summary of
Significant Accounting Policies, in Notes to Consolidated Financial Statements of this Form 10-K.
- (2)
- We estimate an annual global effective non-GAAP tax rate by excluding non-GAAP adjustments on a jurisdictional basis. The estimated global effective non-GAAP tax rate for fiscal 2010, 2009 and 2008 was 37.0%, 35.0% and 38.5%, respectively. The above tax provision adjustments were made to reflect these rates for the applicable periods.
The non-GAAP adjustments we make to our reported U.S. GAAP results are primarily related to purchase accounting and other acquisition matters, significant non-cash accounting charges and restructuring charges. Our primary non-GAAP reconciling items are as follows:
Purchase accounting impact on revenue. Our non-GAAP financial results include pro forma adjustments to increase maintenance and consulting revenues that we would have recognized if we had not adjusted acquired deferred revenues to their fair values as required by U.S.GAAP. Certain deferred revenue for maintenance and consulting on the acquired entity's balance sheet, at the time of the acquisition, was eliminated from U.S. GAAP results as part of the purchase accounting for the acquisition. As a result, our U.S. GAAP results do not, in management's view, reflect all of our maintenance and consulting activity. We believe the inclusion of the pro forma revenue adjustment provides investors a helpful alternative view of Lawson's maintenance and consulting operations.
Amortization of purchased maintenance contracts. We have excluded amortization of purchased maintenance contracts from our non-GAAP results. The purchase price related to these contracts is being amortized based upon the proportion of future cash flows estimated to be generated each period over the estimated useful lives of the contracts. We believe that the exclusion of the amortization expense related to the purchased maintenance contracts provides investors an enhanced understanding of our results of operations.
Stock-based compensation. Expense related to stock-based compensation has been excluded from our non-GAAP results of operations. These charges consist of the estimated fair value of share-based awards including stock options, restricted stock, restricted stock units and share purchases under our employee stock purchase plan. While the charges for stock-based compensation are of a recurring nature, as we grant stock-based awards to attract and retain quality employees and as an incentive to help achieve financial and other corporate goals, we exclude them from our results of operation in assessing our operating performance. These charges are typically non-cash and are often the result of
52
complex calculations using an option pricing model that estimates stock-based awards' fair value based on factors such as volatility and risk-free interest rates that are beyond our control. The expense related to stock-based awards is generally not controllable in the short-term and can vary significantly based on the timing, size and nature of awards granted. As such, we do not include such charges in our operating plans that we use to manage our business. In addition, we believe the exclusion of these charges facilitates comparisons of our operating results with those of our competitors who may have different policies regarding the use of stock-based awards.
Pre-merger claims reserve adjustment. We have excluded the adjustments to our pre-merger claims reserve from our non-GAAP results. As part of the purchase accounting relating to our Intentia acquisition in April 2006, we established a reserve for Intentia customer claims and disputes that arose before the acquisition which originally resulted in an increase in the acquired goodwill. As we are outside the period in which adjustments to such purchase accounting is allowed, adjustments to the reserve are recorded in our general and administrative expenses under U.S. GAAP. We do not consider the adjustments to this reserve established under purchase accounting in our assessment of our operating performance. Further, since the original reserve was established in purchase accounting, the original charge was not reflected in our operating results. We believe that the exclusion of the pre-merger claims reserve adjustments provides investors an appropriate alternative view of our results of operations and facilitates comparisons of our results period-over-period.
Acquisition transaction and integration costs. We have incurred various transaction and integration costs related to our acquisitions. The costs of integrating the operations of acquired businesses and Lawson are incremental to our historical costs and are charged to our U.S. GAAP results of operations in the periods incurred. Beginning in fiscal 2010, acquisition related transaction costs have also been charged to our U.S. GAAP results of operations. We do not consider these costs in our assessment of our operating performance. While these costs are not recurring with respect to our past acquisitions, we may incur similar costs in the future if we pursue other acquisitions. We believe that the exclusion of the non-recurring acquisition related transaction and integration costs provides investors a useful alternative view of our results of operations and facilitates comparisons of our results period-over-period.
Pension Gain. We have implemented certain modifications to our pension plan in Norway. These modifications resulted in a curtailment of benefits under the plan and resulted in our recording a gain related to the change in all active participants' projected benefit obligations resulting from the curtailment. While this gain is non-recurring, we may incur other gains related to these pension plan modifications in the future, including a gain that we expect in the first quarter of fiscal 2011. We do not consider these gains in our assessment of our operating performance. We believe that the exclusion of the non-recurring pension gains provide investors a useful alternative view of our results of operations and facilitates comparisons of our results period-over-period.
Restructuring. We have recorded various restructuring charges related to actions taken to reduce our cost structure to enhance operating effectiveness and improve profitability and to eliminate certain redundancies in connection with acquisitions. These restructuring activities impacted different functional areas of our operations in different locations and were undertaken to meet specific business objectives in light of the facts and circumstances at the time of each restructuring event. These charges include costs related to severance and other termination benefits as well as costs to exit leased facilities. These restructuring charges are excluded from management's assessment of our operating performance. We believe that the exclusion of the restructuring charges provides investors a useful alternative view of the cost structure of our operations and facilitates comparisons with the results of other periods that may not reflect such charges or may reflect different levels of such charges.
Amortization of acquired intangibles. We have excluded amortization of acquisition-related intangible assets including purchased technology, client lists, customer relationships, trademarks, order
53
backlog and non-compete agreements from our non-GAAP results. The fair value of the intangible assets, which was allocated to these assets through purchase accounting, is amortized using accelerated or straight-line methods which approximate the proportion of future cash flows estimated to be generated each period over the estimated useful lives of the applicable assets. While these non-cash amortization charges are recurring in nature and the underlying assets benefit our operations, this amortization expense can fluctuate significantly based on the nature, timing and size of our past acquisitions and may be affected by future acquisitions. This makes comparisons of our current and historic operating performance difficult. Therefore, we exclude such expenses when analyzing the results of our operations including those of acquired entities. We believe that the exclusion of the amortization expense of acquired intangible assets provides investors useful information facilitating comparison of our results period-over-period and with other companies in the software industry as they each have their own acquisition histories and related non-GAAP adjustments.
Non-cash interest expense related to convertible debt. We have excluded the incremental non-cash interest expense related to our $240.0 million 2.5% senior convertible notes that we are required to recognize under U.S.GAAP for convertible debt securities from our non-GAAP results of operations for all periods presented. This accounting guidance requires us to recognize additional non-cash interest expense based on the market rate for similar debt instruments that do not contain a comparable conversion feature. We have allocated a portion of the proceeds from the issuance of the senior notes to the embedded conversion feature resulting in a discount on our senior notes. The debt discount is being amortized as additional non-cash interest expense over the term of the notes using the effective interest method. These non-cash interest charges are not included in our operating plans and are not included in management's assessment of our operating performance. We believe that the exclusion of the non-cash interest charges provides a useful alternative for investors to evaluate the cost structure of our operations in a manner consistent with our internal evaluation of our cost structure.
Impairment on long-term investments. The liquidity and fair value of our investments in marketable securities, including Auction Rate Securities (ARS), were negatively impacted by the uncertainty in the credit markets and exposure to the financial condition of bond insurance companies during fiscal 2008. As a result, we recorded impairment charges to reduce the carrying value of our ARS investments. The impairment charges related to our ARS investments have been excluded from our non-GAAP results of operations. These impairment charges were excluded from management's assessment of our operating performance. We believe that the exclusion of these unique charges provide investors a useful alternative view of our operations and facilitates comparisons with the results of other periods that do not reflect such charges.
Non-GAAP Tax Provision Adjustments. The non-GAAP tax provision adjustments are made to reflect the fact that our annual global effective non-GAAP tax rate is lower than our effective U.S. GAAP rate. These differences in effective rate are due to the increase in non-GAAP taxable income as compared to U.S. GAAP taxable income due to the non-GAAP reconciling items detailed in the above table and the jurisdictional mix of non-GAAP and U.S. GAAP taxable income. Our non-GAAP taxable income outside the U.S. exceeds the U.S. GAAP taxable income outside the U.S. This difference in jurisdictional mix leads to a higher proportion of our non-GAAP taxable income being taxed at substantially lower non-U.S. tax rates and a reduction in foreign losses for which no tax benefit can be taken. The non-GAAP tax provision adjustments are made to reflect the annual global effective non-GAAP tax rate for each period.
54
Liquidity and Capital Resources
| |
As of and for the Years Ended May 31, |
|
|
||||||||||||||
|---|---|---|---|---|---|---|---|---|---|---|---|---|---|---|---|---|---|
| |
2010 vs. 2009 | 2009 vs. 2008 | |||||||||||||||
| |
2010 | 2009 | 2008 | ||||||||||||||
| |
|
(as adjusted) |
(as adjusted) |
|
|
||||||||||||
| |
(in thousands) |
||||||||||||||||
Cash Flows |
|||||||||||||||||
Cash provided by (used in): |
|||||||||||||||||
Operating activities |
$ | 153,039 | $ | 71,288 | $ | 81,639 | 114.7 | % | (12.7 | )% | |||||||
Investing activities |
(178,757 | ) | 13,219 | (27,287 | ) | *NM | *NM | ||||||||||
Financing activities |
(4,426 | ) | (99,917 | ) | (97,247 | ) | (95.6 | ) | 2.7 | ||||||||
Effect of exchange rate changes on cash and cash equivalents |
(8,754 | ) | (4,896 | ) | 4,053 | 78.8 | *NM | ||||||||||
Net change in cash and cash equivalents |
$ | (38,898 | ) | $ | (20,306 | ) | $ | (38,842 | ) | 91.6 | % | (47.7 | )% | ||||
Capital Resources |
|||||||||||||||||
Working capital |
$ | 115,034 | $ | 213,997 | $ | 261,072 | (46.2 | )% | (18.0 | )% | |||||||
Cash and cash equivalents, marketable securities and short-term investments |
$ | 375,917 | $ | 414,815 | $ | 485,810 | (9.4 | )% | (14.6 | )% | |||||||
- *
- NM Percentage not meaningful
As of May 31, 2010, we had $375.9 million in cash, cash equivalents and $115.0 million in working capital. Our most significant source of operating cash flows is derived from license fees, maintenance and consulting fees related to services provided to our customers. Days sales outstanding (DSO), which is calculated on net receivables at period-end divided by revenue for the quarter times 90 days in the quarter, was 54 and 74 as of May 31, 2010 and May 31, 2009; respectively. The decrease in DSO was due to the reduction in our accounts receivable balance, primarily related to focused collection efforts on our global receivables in fiscal 2010. Our primary uses of cash from operating activities are for employee costs, third-party costs for licenses and services and facilities.
On January 11, 2010, we acquired privately held Healthvision, a Dallas-based provider of integration and application technology and related services to hospitals and large healthcare organizations for $160.0 million in cash, net of cash acquired. See Note 4, Business Combination, for more information.
We believe that cash flows from operations, together with our cash and cash equivalents, will be sufficient to meet our cash requirements for working capital, capital expenditures, restructuring activities, investments and share repurchases for fiscal 2011 and for the foreseeable future. As part of our business strategy, we may use cash to acquire additional companies or products from time-to-time to enhance our product lines, which could have a material effect on our capital resources.
Cash Flows from Operating Activities
Net cash provided by operating activities in fiscal 2010 was $153.0 million. Our fiscal 2010 sources of cash included our net income of $13.0 million which included non-cash charges of $46.7 million for depreciation and amortization, $17.0 million related to stock-based compensation, $9.5 million in amortization of debt discount and debt issuance costs related to our senior convertible notes, a $6.2 million provision for estimated warranty costs and doubtful accounts and a $7.5 million non-cash increase in deferred income taxes. Changes in working capital provided $52.8 million of operating cash. The cash provided by working capital included a $49.1 million decrease in accounts receivable due to
55
focused collection efforts on our accounts receivable, a $26.1 million increase in our deferred revenue primarily related to the timing of cash collections of annual service maintenance billings, and a decrease in prepaid expenses and other current assets of $1.6 million primarily related to receipt of certain foreign withholding tax refunds. The cash provided by working capital was partially offset by cash used for working capital purposes of $19.9 million related to a decrease in our accrued and other liabilities primarily related to the payment of certain foreign withholding and VAT taxes as well as payments of accrued severance and a decrease of $3.7 million in accounts payable.
Net cash provided by operating activities in fiscal 2009 was $71.3 million. Our fiscal 2009 sources of cash included our net income of $14.2 million which included non-cash charges of $39.6 million for depreciation and amortization, $9.0 million in amortization of debt discount and debt issuance costs related to our senior convertible notes, $8.5 million related to stock-based compensation and an $8.4 million provision for estimated warranty costs and doubtful accounts. Offsetting these sources of cash was a $6.6 million non-cash reduction in deferred income taxes and $1.2 million used for working capital purposes. The cash uses for working capital purposes included a $21.7 million decrease in our deferred revenue primarily related to the impact of foreign currency exchange rates as of our billing cycle date, a $7.7 million decrease in accounts payable primarily due to lower costs in fiscal 2009 over fiscal 2008 and $7.4 million related to an increase in prepaid expenses and other current assets. These working capital uses of cash were partially offset by a $25.8 million decrease in accounts receivable due to lower revenue volume and our collection of customer accounts and maintenance billings, $6.7 million related to an increase in our accrued and other liabilities and $2.9 million related to income taxes payable/receivable.
Net cash provided by operating activities in fiscal 2008 was $81.6 million. In addition to our net income of $9.3 million, which included non-cash charges of $43.3 million for depreciation and amortization, $8.5 million in amortization of debt discount and debt issuance costs related to our senior convertible notes and $6.7 million related to stock-based compensation, the $18.4 million impairment charge related to our investments in auction rate securities, a net $7.5 million provision for warranty and doubtful accounts, and a $5.8 million increase related to deferred income taxes. These sources of cash were partially offset by a net $15.4 million used for working capital purposes. The $15.4 million in cash used for working capital purposes included a $33.6 million decrease in accrued and other liabilities primarily related to a reduction in our pre-merger litigation and restructuring reserves as well as a decrease in our value added tax (VAT) payable, a $19.5 million increase in prepaid expenses reflecting an increase in VAT receivable relating to our Switzerland based shared service center, and a $6.4 million increase in trade accounts receivable related to a number of new customers' large contracts entered into in the second half of fiscal 2008 and a net increase in maintenance billings. These working capital uses of cash were mostly offset by $34.2 million in cash provided by deferred revenue and customer deposits related to deferrals of certain significant contracts and higher fourth quarter fiscal 2008 maintenance billings and an increase in prepaid license fees and a $9.9 million increase in income taxes payable.
Cash Flows from Investing Activities
Net cash used by investing activities was $178.8 million fiscal 2010. The primary use of cash was the $160.0 million net cash paid in conjunction with our acquisition of Healthvision (see Note 4, Business Combination) and $19.0 million used to purchase property and equipment primarily related to continued investments in our global information technology and business system infrastructure.
Net cash provided by investing activities was $13.2 million for fiscal 2009. The sources of cash included $50.7 million in proceeds from the sale of our investments in auction rate securities and the sale or maturity of marketable securities. These sources of cash were somewhat offset by the $29.3 million of cash used to purchase property and equipment primarily investments in our global information technology and business system infrastructure as well as expanding our off shore capacity
56
and an $8.1 million increase in restricted cash, primarily due to the $9.1 million held in our segregated brokerage account at Lehman OTC Derivatives Inc. (Lehman OTC) in connection with our accelerated share repurchase transaction. See Note 9, Common Stock, in Notes to Consolidated Financial Statements of this Form 10-K.
Net cash used in investing activities was $27.3 million for fiscal 2008 primarily related to $23.0 million of capital expenditures and $20.3 million used in conjunction with acquisition activities in fiscal 2008. These uses of cash were somewhat offset by net proceeds of $11.3 million related to marketable securities and other investments as well as a $4.7 million decrease in our restricted cash balance.
Cash Flows from Financing Activities
Net cash used for financing activities was $4.4 million for fiscal 2010. Cash used for financing activities during the period were related to $7.4 million used to repurchase shares of our common stock pursuant to our Board authorized share repurchase program and $3.7 million used to make payments on our long-term debt and capital lease obligations. These uses of cash were somewhat offset by $5.9 million in proceeds from the exercise of stock options and the issuance of shares of our common stock under our ESPP.
Net cash used for financing activities was $99.9 million for fiscal 2009. Financing activities for the period were primarily related to the $103.0 million used to repurchase shares of our common stock pursuant to our Board authorized share repurchase program including an accelerated share repurchase transaction we entered into in July 2008 (see Note 9, Common Stock, in Notes to Consolidated Financial Statements of this Form 10-K), $2.8 million used to make principal payments on our long term debt and capital lease obligations. These uses of cash were partially offset by $5.2 million in proceeds from the exercise of stock options and the issuance of shares of our common stock under our employee stock purchase plan.
Net cash used for financing activities was $97.2 million for fiscal 2008. Financing activities for fiscal 2008 were primarily related to the use of $105.6 million to repurchase our common stock in connection with our Board authorized share repurchase program and $3.6 million in payments related to long-term debt and capital lease obligations which were partially offset by $9.9 million in proceeds from of the exercise of stock options and the issuance of shares of our common stock under our employee stock purchase plan.
Effect of Exchange Rate Changes
In fiscal 2010, changes in foreign currency exchange rates resulted in an $8.8 million decrease in our cash and cash equivalents. Exchange rate changes decreased our cash and cash equivalents by $4.9 million and increased our cash and cash equivalents by $4.1 million in fiscal 2009 and 2008, respectively.
Credit Facilities
We have an uncommitted credit facility that consists of a guarantee line with Skandinaviska Enskilda Banken (SEB) in the amount of $3.8 million (30.0 million SEK). We had no borrowings outstanding under this line as of May 31, 2010.
Senior Convertible Notes
In April 2007, we issued $240.0 million of senior convertible notes with net proceeds, after expenses, of approximately $233.5 million. The notes mature on April 15, 2012. The notes bear interest at a rate of 2.5% per annum payable semi-annually in arrears, on April 15 and October 15 of each
57
year, beginning October 15, 2007. The notes do not contain any restrictive financial covenants. The notes are convertible, at the holder's option, into cash and, if applicable, shares of our common stock based on an initial conversion rate of 83.2293 shares of common stock per $1,000 principal amount of notes, which is equivalent to an initial conversion price of approximately $12.02 per share (which reflects a 35.0% conversion premium based on the closing sale price of $8.90 per share of Lawson common stock as reported by NASDAQ on April 17, 2007). At the issuance of these notes, we simultaneously entered into separate agreements to purchase call options and sell warrants. As discussed below, we exercised our right to terminate the call options and the warrants on October 10, 2008, which are referred to below as "note hedge transaction and a warrant transaction." In connection with the issuance of the notes, we entered into a registration rights agreement with the initial purchasers of the notes. On August 16, 2007, we filed the shelf registration statement, which became effective on that date. On October 19, 2009, all securities that remained unsold under the registration statement were deregistered as our contractual obligation to maintain the shelf registration terminated. See Note 7, Long-Term Debt and Credit Facilities, and Note 2, Summary of Significant Accounting Policies-Recent Accounting Pronouncements, in Notes to Consolidated Financial Statements of this Form 10-K for additional information.
We had certain business relationships with Lehman OTC, including a convertible note hedge transaction and a warrant transaction both entered into as part of the issuance of our senior convertible notes and an accelerated share repurchase transaction (see, Repurchase of Common Shares, below for additional information). On September 15, 2008, Lehman Brothers Holdings Inc. (Lehman Holdings) filed for protection under Chapter 11 of the United States Bankruptcy Code in the United States Bankruptcy Court in the Southern District of New York. Subsidiaries of Lehman Holdings, including Lehman Brothers Inc. (Lehman Brothers) and Lehman OTC, were not included in the filing. On September 19, 2008, Lehman Brothers was placed in liquidation under the Securities Investor Protection Act. In addition, on October 3, 2008, Lehman OTC filed for Chapter 11 bankruptcy.
Lehman Brothers was one of the original purchasers of our senior convertible notes. None of the net proceeds from the offering are on deposit with Lehman Brothers or any of its affiliates. In conjunction with the issuance of the notes, we entered into a convertible note hedge transaction with Lehman OTC, an affiliate of Lehman Brothers. In a separate agreement, we entered into a warrant transaction with Lehman OTC. Together, these transactions were designed to reduce the potential dilution resulting from the potential conversion of our senior convertible notes into shares of common stock and effectively increased the conversion price of the notes to $15.58 per share from the initial conversion price of the notes of $12.02 per share.
The bankruptcy filing by Lehman OTC was an event of default under the hedge transaction and warrant agreements. As a result of that default, we exercised our rights to terminate both the hedge transaction and the warrant transaction on October 10, 2008. As a result of our termination of the hedge transaction, terms of the original transaction provided us the right to seek recovery from Lehman OTC equal to the termination-date fair value of the common stock option instrument we issued in connection with the hedge transaction. At the time of termination, the instrument ceased being a hedge instrument and was effectively replaced by our claim against Lehman OTC. Accordingly, for financial reporting purposes, we recorded the estimated fair value of the related hedge transaction asset and the warrant liability during the second quarter of fiscal 2009, resulting in a decrease in our stockholders' equity equal to the net amount of the recorded asset and liability. As part of the convertible note hedge transaction, Lehman OTC agreed to have Lehman Holdings guarantee certain obligations of Lehman OTC. Based on the developments in the bankruptcy proceeding, we do not anticipate receiving a recovery from Lehman Holdings for the guaranty agreed to by Lehman OTC.
On June 4, 2009, counsel for Lehman Holdings and Lehman OTC demanded payment from us of the termination-date fair value of the warrant, asserted that in the contracts we have waived the right to setoff against the amounts owed to us under the hedge transaction and claimed we violated the
58
bankruptcy stay in asserting offset rights. We have refused payment and contend that the U.S. Bankruptcy Code gives us legal rights of offset in this dispute. Lehman OTC disagrees with our contention and claims that we waived our right of offset under the terms of the original transaction documents. As of the date of this filing we are in discussions with representatives of Lehman OTC regarding the resolution of the offset issue as well as other issues surrounding the hedge transaction asset and the warrant liability, including their proper valuation. We continue to closely monitor the Lehman Holdings bankruptcy situation, the liquidation of Lehman Brothers, as well as the Lehman OTC bankruptcy and our legal rights under our contractual relationships with Lehman OTC and Lehman Brothers.
For financial reporting purposes, we estimated the fair value of the hedge transaction asset and the warrant liability using the Black-Scholes option pricing model and considered the credit risk of Lehman OTC. The fair value of these obligations recorded for financial reporting purposes may differ from the values ultimately determined in various legal proceedings, including actions of the U.S. bankruptcy court. If the ultimate settlement of either of these obligations differs from the recorded amounts, we will be required to recognize any related gain or loss in our results of operations in the period such settlement is known. As of May 31, 2010, our claim against Lehman OTC and Lehman OTC's claim against us have not been settled.
The terms of the senior convertible notes and the rights of note holders are not affected by the status of Lehman Holdings or Lehman OTC or by the termination of the convertible note hedge or warrant transactions. We currently believe that the Lehman Holdings bankruptcy, and its potential impact on subsidiaries of Lehman Holdings, the liquidation of Lehman Brothers, and the bankruptcy of Lehman OTC, will not have a material adverse effect on our financial position, results of operations or cash flows.
Restricted Cash
We had $10.7 million held as restricted cash as of May 31, 2010 of which $0.7 million and $10.0 million have been classified as current and non-current assets respectively, on our Consolidated Balance Sheets. The non-current portion relates primarily to the $9.1 million held on our account at Lehman Brothers, which was reclassified from current to non-current in fiscal 2010 and is discussed below under Repurchase of Common Shares. The remainder of the restricted cash balance relates to various collateral arrangements related to our property leases worldwide.
We had $11.0 million held as restricted cash as of May 31, 2009 of which $9.2 million and $1.8 million have been classified as current and non-current assets respectively, on our Consolidated Balance Sheets. The current portion relates primarily to the $9.1 million held on our account at Lehman Brothers. The remainder of the restricted cash balance relates to various collateral arrangements related to our property leases worldwide.
Auction Rate Securities
As of May 31, 2008, we held a total of $45.2 million in short-term investments in auction rate securities reflecting $18.4 million impairment from their original par value of approximately $63.7 million. These investments were governed by our investment policy, the objective of which is to provide as high of a level of current income as is consistent with preservation of capital and the maintenance of liquidity. Approved investments include U.S. Government securities and investments in corporations and municipalities rated AA or higher, including investments in auction rate securities. Our investments in auction rate securities represented interests in collateralized debt obligations and were supported primarily by high grade, short-term commercial paper.
During fiscal 2008, uncertainties in the credit markets had a significant effect on our holdings in auction rate securities. Auctions related to our investments in auction rate securities became
59
unsuccessful and liquidity issues relating to these investments resulted in a decline in the fair value of our portfolio of auction rate securities. This resulted in our recording impairment losses related to these investments.
On July 7, 2008, we sold our auction rate securities portfolio for $45.2 million in cash, the carrying value as of May 31, 2008. In light of this transaction, the $2.9 million of impairment losses previously recorded in the second and third quarters of fiscal 2008 and originally determined to be temporary and reflected in a separate component of stockholders' equity were reclassified as other-than-temporary and included in our results of operations for fiscal 2008. As a result, we recorded an impairment charge of approximately $18.4 million for fiscal 2008, which was included in other income (expense), net in the accompanying Consolidated Statements of Operations.
Repurchase of Common Shares
Our Board of Directors approved a share repurchase program of up to $100.0 million of common stock in November 2006, and on July 10, 2008, increased the maximum authorized for repurchase under the program to $400.0 million. The share repurchases are funded using our existing cash balances and future cash flows and may occur through transactions structured through investment banking institutions as permitted by securities laws and other legal requirements, open market purchases, privately negotiated transactions and/or other mechanisms. Our share repurchase program allows us to repurchase shares at our discretion and market conditions influence the timing of the buybacks and the number of shares repurchased. There can be no assurance as to the amount, timing or repurchase price of future repurchases, if any, related to the share repurchase program. The program may also be modified, extended or terminated by our Board of Directors at any time.
In the fourth quarter of fiscal 2010, we did not repurchase any shares of our common stock under the share repurchase program. During fiscal 2010, we repurchased an aggregate of 1.3 million shares of our common stock at an average price of $5.92 per share under the share repurchase program. From inception of the repurchase program through May 31, 2010, we have used $270.9 million to repurchase approximately 32.9 million shares at an average price of $8.23 per share. The repurchased shares are recorded as treasury stock and result in a reduction to our stockholders' equity. The shares will be used for general corporate purposes. As of May 31, 2010, the maximum dollar value of shares that may yet be purchased under this program was $129.1 million.
During the first quarter of fiscal 2009, we purchased 11.5 million shares through an accelerated share repurchase transaction (the ASR) that we entered into with Lehman OTC on July 15, 2008. The average price per share of the shares purchased under the ASR transaction was $7.93. Lehman OTC delivered 11.5 million shares of our common stock to us through August 7, 2008. Under the agreement, Lehman OTC was obligated to deliver additional shares to us at maturity of the transaction based on the final per share purchase price and the total number of shares repurchased as determined primarily by the volume-weighted average price of our common stock during the term of the agreement. The agreement further required that Lehman OTC post cash collateral to a segregated brokerage account in our name in an amount equal to the value of the additional shares, or net cash, due to us if the ASR were terminated as of the current date. Upon an event of default by Lehman OTC, pursuant to our rights under the ASR, we issued a notice of default to Lehman OTC on September 24, 2008 and terminated the ASR agreement and requested the distribution of the $9.1 million of funds which Lehman OTC had previously deposited into our segregated brokerage account at Lehman Brothers as required under the ASR agreement. On March 25, 2009, we received a notice from the bankruptcy trustee for the Lehman Brothers estate that the trustee has allowed our customer claim for the $9.1 million. As of the filing date of this Annual Report on Form 10-K, we have not received payment of these funds.
60
The bankruptcy trustee for the Lehman Brothers estate has filed certain court papers against Lehman Brothers indicating that there were shortfalls in the reserves intended to cover customer claims such as Lawson's ASR claim for $9.1 million. The trustee sought permission to use assets other than the reserves to cover these customer claims. Several creditors (non-customers) objected and a compromise was reached in early March 2010, where funds could be used to cover what appears to be a significant part of the shortfall and the trustee could seek further authority to cover additional shortfalls. The trustee is continuing to investigate the reasons for the aggregate shortfalls in the reserve for all customer claims and other possible sources of funds to make up the aggregate shortfall. We had originally anticipated that we would receive payment of our approved $9.1 million claim in 2010 and had recorded these funds as restricted cash and reflected the funds as a current asset in our Consolidated Balance Sheet as of May 31, 2009. However, based on these developments relating to the Lehman Brothers estate, during the third quarter of fiscal 2010 we reclassified the funds to reflect them as a long-term asset. We continue to closely monitor the Lehman Brothers liquidation situation and its impact on our claim.
The $7.93 average price per share of the shares purchased under the ASR is inclusive of the $9.1 million discussed above. Any potential reduction in the amount we may receive related to our approved claim would be an adjustment to the average price per share of the related treasury stock and would not impact our future results of operations.
We currently believe that the Lehman Holdings bankruptcy, and its potential impact on subsidiaries of Lehman Holdings, the liquidation of Lehman Brothers, and the bankruptcy of Lehman OTC, will not have a material adverse effect on our financial position, results of operations or cash flows. We continue to closely monitor the Lehman Holdings bankruptcy situation, the liquidation of Lehman Brothers, as well as the Lehman OTC bankruptcy, and our legal rights under our contractual relationships with Lehman OTC.
Disclosures about Contractual Obligations and Commercial Commitments
The following summarizes our contractual obligations and commercial commitments as of May 31, 2010, and the effect these obligations and commitments are expected to have on our liquidity and cash flows in future periods (in thousands):
| |
Total | 1 Year or Less |
1-3 Years | 3-5 Years | More than 5 Years |
||||||||||||
|---|---|---|---|---|---|---|---|---|---|---|---|---|---|---|---|---|---|
Balance sheet contractual obligations: |
|||||||||||||||||
Long-term debt (gross, excluding debt discount) |
$ | 242,761 | $ | 1,661 | $ | 241,100 | $ | — | $ | — | |||||||
Interest on long-term debt |
12,138 | 6,107 | 6,031 | — | — | ||||||||||||
Capital leases |
1,628 | 1,031 | 580 | 17 | — | ||||||||||||
Total balance sheet contractual obligations |
256,527 | 8,799 | 247,711 | 17 | — | ||||||||||||
Other contractual obligations: |
|||||||||||||||||
Operating leases |
63,609 | 25,241 | 24,197 | 12,354 | 1,817 | ||||||||||||
Purchase obligations(1) |
7,744 | 5,334 | 2,168 | 242 | — | ||||||||||||
Total other contractual obligations |
71,353 | 30,575 | 26,365 | 12,596 | 1,817 | ||||||||||||
Total contractual obligations(2) |
$ | 327,880 | $ | 39,374 | $ | 274,076 | $ | 12,613 | $ | 1,817 | |||||||
- (1)
- Our
purchase obligations represent those commitments greater than $50,000.
- (2)
- Total unrecognized tax benefits of $9.7 million are not included in the above table as we are unable to reasonably estimate when these amounts will ultimately be settled. See Note 12, Income Taxes, in Notes to Consolidated Financial Statements of this Form 10-K for additional information.
61
Off-Balance-Sheet Arrangements
As of May 31, 2010, we did not have any off-balance-sheet arrangements, as defined in Item 303(a)(4)(ii) of SEC Regulation S-K. We do not use off-balance-sheet arrangements with unconsolidated entities, related parties or other forms of off-balance-sheet arrangements such as research and development arrangements. Accordingly, our liquidity and capital resources are not subject to off-balance-sheet risks from unconsolidated entities.
We have entered into operating leases for most of our U.S. and international sales and support offices and certain equipment in the normal course of business. These arrangements are often referred to as a form of off-balance-sheet financing. As of May 31, 2010, we leased facilities and certain equipment under non-cancelable operating leases expiring from 2010 to 2018. Rent expense under operating leases for fiscal 2010, 2009 and 2008 was $29.1 million, $26.9 million and $31.4 million, respectively. Future minimum lease payments under our operating leases as of May 31, 2010 are included above under Disclosures about Contractual Obligations and Commercial Commitments.
Recent Accounting Pronouncements
In June 2009, the FASB issued guidance which amends the consolidation guidance applicable to variable interest entities (VIE's). This guidance clarifies the determination of whether a company is required to consolidate a VIE, changes the approach to determining a VIE's primary beneficiary (the reporting entity that must consolidate the VIE), requires an ongoing reassessment of whether a company is the primary beneficiary of a VIE and requires additional disclosures about a company's involvement in VIE's. This guidance is effective for fiscal years beginning after November 15, 2009 (our fiscal 2011). We are currently evaluating how this may affect our accounting for VIE's, but we do not expect it to have a material impact on our financial position, results of operations or cash flows.
In October 2009, the FASB issued guidance which amends the existing guidance for revenue recognition of non-software elements of multiple element arrangements. Under the new guidance, when vendor-specific objective evidence or third party evidence for deliverables in an arrangement cannot be determined, companies will be required to develop a best estimate of the selling price to separate deliverables and allocate arrangement consideration based on the relative selling price method. The residual method of allocating arrangement consideration will no longer be permitted. This guidance is effective for fiscal years beginning on or after June 15, 2010 (our fiscal 2012), however early adoption is permitted. We are currently evaluating how this may affect our accounting for multiple element arrangements, but we do not expect it to have a material impact on our financial position, results of operations or cash flows.
In January 2010, the FASB issued guidance that expands the interim and annual disclosure requirements of fair value measurements, including the information about transfers into and out of Levels 1 and 2 of the three-tier fair value hierarchy established under the FASB's fair value measurement guidance. This guidance also requires separate disclosure for purchases, sales, issuances and settlements relating to Level 3 measurements. Except for the detailed disclosures related to the Level 3 reconciliation, which is effective for the fiscal years beginning after December 15, 2010 (our fiscal 2011), all the other disclosures under this guidance became effective during the fourth quarter of fiscal 2010. The adoption of the applicable portions of this guidance did not have a material impact on our financial position, results of operations or cash flows during fiscal 2010 and we do not expect the adoption of the guidance related to Level 3 disclosures to have a material impact on our future financial position, results of operations or cash flows.
62
Item 7A. Quantitative and Qualitative Disclosures About Market Risk
Foreign Currency. Our market risk includes the potential loss arising from adverse changes in foreign currency exchange rates. For fiscal 2010, approximately 40.2% of our revenue was denominated in a foreign currency.
We manage foreign currency market risk using forward contracts to offset the risk associated with the effects of certain foreign currency exposures. Increases or decreases in our foreign currency exposures are expected to be offset by gains or losses on forward contracts. This is expected to mitigate the possibility of significant foreign currency transaction gains or losses in future periods. Our foreign currency exposures are primarily related to non-functional currency intercompany loans and advances between our international subsidiaries as well as other balance sheet accounts, particularly accounts receivable, accounts payable and certain accrual accounts.
We do not use forward contracts for trading purposes. In fiscal 2010 and prior years, we have not designated these derivative contracts as hedge transactions under FASB guidance for derivatives and hedging, and have not used hedge accounting. Our foreign currency forward contracts are generally short term in nature, maturing within 90 days or less. We mark to market value all contracts at the end of each reporting period. These unrealized gains and losses largely offset gains and losses from non-functional currency balance sheet exposures previously recognized and are recorded as an offset to such gains and losses in general and administrative expenses in our Consolidated Statements of Operations. Our net realized gain or loss with respect to currency fluctuations will depend on the currency exchange rates and other factors in effect as the contracts mature. We recorded net foreign exchange gains inclusive of the impact of foreign currency forward contracts of $0.7 million for fiscal 2010 and $1.0 million for fiscal 2009 and net losses of $2.5 million for fiscal 2008. The corresponding net gains of $8.3 million and $8.5 million and net losses of $10.2 million in realized and unrealized gains/losses from foreign currency forward contracts were included in the accompanying Consolidated Statements of Operations during fiscal 2010, 2009 and 2008; respectively. The net fair value of our foreign currency forward contracts was a net asset of $6.5 million as of May 31, 2010, a net liability of $0.5 million as of May 31, 2009 and a net asset of $0.4 million as of May 31, 2008 and was included in other accrued liabilities and prepaid expenses and other current assets, respectively.
Interest Rates. Our investments consist of financial instruments, primarily money market funds. Investments with original maturities of three months or less are classified as cash and cash equivalents. As of May 31, 2010, the average maturity of our investment securities was less than three months. As of May 31, 2010, we consider the reported amounts of these investments to be reasonable approximations of fair values. We do not consider changes in the market interest rates related to these investments to be a significant risk.
Our senior convertible notes are due April 15, 2012 and bear interest at a fixed rate of 2.50% per year. We are exposed to interest rate risk with respect to the fair value of our senior convertible notes since the fair value of our senior convertible notes will fluctuate based on interest rate changes and the time to maturity. As of May 31, 2010, the adjusted net carrying value of our convertible senior notes was $220.5 million, including the debt discount of $17.5 million recorded upon adoption of the FASB guidance on accounting for convertible debt securities and $2.0 million of deferred debt issuance costs, and the fair value was approximately $240.0 million.
Item 8. Consolidated Financial Statements and Supplementary Data
The information required by this Item is included in Part IV Item 15(a)(1) and (2).
Item 9. Changes In and Disagreements with Accountants on Accounting and Financial Disclosure
None.
63
Item 9A. Controls and Procedures
Disclosure Controls and Procedures
We have established and maintained disclosure controls and procedures that are designed to ensure that information required to be disclosed in our reports filed under the Exchange Act is recorded, processed, summarized and reported within the time periods specified in the SEC's rules and forms and that such information is accumulated and communicated to our management, including our Chief Executive Officer and Chief Financial Officer, to allow timely decisions regarding required disclosure. As required by Rule 13a-15(e) under the Securities Exchange Act of 1934, as amended, we conducted an evaluation under the supervision and with the participation of management, including our Chief Executive Officer and Chief Financial Officer, of the effectiveness of our disclosure controls and procedures as of the end of the period covered by this Annual Report on Form 10-K. Based on this evaluation, our Chief Executive Officer and Chief Financial Officer concluded that our disclosure controls and procedures were effective as of May 31, 2010.
Management's Report on Internal Controls and Procedures
Our management is responsible for establishing and maintaining adequate internal control over financial reporting as defined in Securities Exchange Act Rules 13a-15(f) or 15d-15(f). Internal control over financial reporting is a process designed to provide reasonable assurance regarding the reliability of financial reporting and the preparation of financial statements for external reporting purposes in accordance with U.S. GAAP. Our internal control over financial reporting includes those policies and procedures that:
- •
- pertain to the maintenance of records that in reasonable detail accurately and fairly reflect the transactions and
dispositions of our assets;
- •
- provide reasonable assurance that transactions are recorded as necessary to permit preparation of financial statements in
accordance with U.S. GAAP, and that our receipts and expenditures are being made only in accordance with the authorizations of our management and directors; and
- •
- provide reasonable assurance regarding prevention or timely detection of unauthorized acquisition, use or disposition of our assets that could have a material effect on our financial statements.
All internal control systems, no matter how well designed, have inherent limitations. Therefore, even those systems determined to be effective can provide only reasonable assurance with respect to financial statement preparation and presentation and may not prevent or detect misstatements. In addition, projections of any evaluation of effectiveness to future periods are subject to the risks that controls may become inadequate because of changes in conditions, or that the degree of compliance with policies or procedures may deteriorate.
We conducted an assessment of the effectiveness of our internal control over financial reporting as of May 31, 2010, under the supervision and with the participation of management, including our Chief Executive Officer and Chief Financial Officer. This assessment was based on the guidelines set forth in Internal Control—Integrated Framework issued by the Committee of Sponsoring Organizations of the Treadway Commission (COSO). Based on the results of this evaluation, management concluded that our internal control over financial reporting was effective as of May 31, 2010.
Our independent registered public accounting firm, PricewaterhouseCoopers LLP, has audited the effectiveness of our internal control over financial reporting as of May 31, 2010. See Part IV, Item 15(a)—Financial Statements—Report of Independent Registered Public Accounting Firm, of this Form 10-K.
64
Changes in Internal Control over Financial Reporting
There have been no changes in our internal control over financial reporting (as defined in Rule 13a-15(f) of the Securities Exchange Act) during the quarter ended May 31, 2010 that have materially affected, or are reasonably likely to materially affect, our internal control over financial reporting.
None.
65
The information required by Part III, Items 10 through 14, is incorporated by reference from our definitive Proxy Statement for the 2010 Annual Meeting of Stockholders (the Proxy Statement), which we will file with the Securities and Exchange Commission pursuant to Regulation 14A within 120 days of May 31, 2010, the end of our fiscal year covered by this Annual Report on Form 10-K. Except for those portions specifically incorporated in this Form 10-K by reference to our Proxy Statement, no other portions of our Proxy Statement are deemed to be filed as part of this Form 10-K.
Item 10. Directors, Executive Officers and Corporate Governance
The information required by this Item as to our directors is incorporated by reference from information appearing in our Proxy Statement under the headings "Proposal Number 1—Election of Directors, Nominees and Directors," "Section 16(a) Beneficial Ownership Reporting Compliance" and "Audit Committee Report." The information concerning our executive officers required by this item is included in Part I hereof under the heading "Executive Officers."
We have adopted a Global Business Code of Conduct that applies to our principal executive officer, principal financial officer, principal accounting officer or controller, or persons performing similar functions, and all of our other employees and non-employee directors. A copy of our Global Business Code of Conduct is available on our website (www.lawson.com). We intend to satisfy the disclosure requirement under Item 10 of Form 8-K regarding an amendment to, or waiver from, a provision of the Global Business Code of Conduct that applies to our principal executive officer, principal financial officer, principal accounting officer or controller, or persons performing similar functions, by posting such information on our website, at the address specified above.
Copies of our Corporate Governance Policy and charters for each Committee of our Board of Directors are also available on our website. Our Global Business Code of Conduct, Corporate Governance Policy and committee charters are also available in print to any stockholder who submits a written request to: Lawson Software, Inc., Attn: Corporate Secretary, 380 St. Peter Street, St. Paul, Minnesota 55102.
Information on our website is not deemed to be incorporated by reference into this Annual Report on Form 10-K.
Item 11. Executive Compensation
Information required by this item is contained in the section entitled "Compensation of Executive Officers" in our Proxy Statement and is incorporated herein by reference.
66
Item 12. Security Ownership of Certain Beneficial Owners and Management and Related Stockholder Matters
Equity Compensation Plan Information
The following table reflects information related to our equity compensation plans as of May 31, 2010:
Plan Category
|
Number of Securities to be Issued Upon Exercise of Outstanding Options, Warrants and Rights(1) | Weighted-Average-Exercise Price of Outstanding Options, Warrants and Rights(2) | Number of Securities Remaining Available for Future Issuance Under Equity Compensation Plans(3) | |||||||
|---|---|---|---|---|---|---|---|---|---|---|
Plans approved by stockholders |
16,618,733 | $ | 6.24 | 32,360,700 | ||||||
Plans not approved by stockholders |
— | — | — | |||||||
Total |
16,618,733 | $ | 6.24 | 32,360,700 | ||||||
- (1)
- Includes
outstanding stock options, restricted stock awards and restricted stock units granted under our 1996 and 2001 Stock Incentive Plans.
- (2)
- This
reflects the weighted-average-exercise price of outstanding options only as the restricted stock awards and restricted stock units do not have stated
exercise prices.
- (3)
- Includes shares available under our 1996 and 2001 Stock Incentive Plans and our 2001 Employee Stock Purchase Plan.
Other information required by this item is contained in the section entitled "Ownership of Principal Stockholders, Directors and Management" in our Proxy Statement and is incorporated herein by reference.
Item 13. Certain Relationships and Related Transactions and Director Independence
Information required by this item is contained in the sections entitled "Certain Relationships and Related Transactions" and "Director Independence" in our Proxy Statement and is incorporated herein by reference.
Item 14. Principal Accounting Fees and Services
The information required by this item is contained in the section entitled "Proposal Number 2—Ratification of Appointment of our Independent Registered Public Accounting Firm" in our Proxy Statement and is incorporated herein by reference.
67
Item 15. Exhibits and Financial Statement Schedules
- (a)
- Documents filed as part of this report:
- 1.
- Financial Statements:
- 2.
- Financial Statement Schedules.
- 3.
- Exhibits.
Report
of Independent Registered Public Accounting Firm;
Consolidated Balance Sheets;
Consolidated Statements of Operations;
Consolidated Statements of Stockholders' Equity and Comprehensive Income (Loss);
Consolidated Statements of Cash Flows; and
Notes to Consolidated Financial Statements.
Schedules have been omitted because they are not applicable or are not required or the information required to be set forth in those schedules is included in the financial statements or related notes.
The Index to Exhibits attached to this report is incorporated by reference herein.
68
Pursuant to the requirements of Section 13 or 15(d) of the Securities Exchange Act of 1934, the Registrant has duly caused this Report to be signed on its behalf by the undersigned, thereunto duly authorized.
| LAWSON SOFTWARE, INC. | ||||
By: |
/s/ STEFAN B. SCHULZ Stefan B. Schulz Senior Vice President and Chief Financial Officer (principal financial and accounting officer) |
|||
| Dated: July 15, 2010 | ||||
KNOW ALL PERSONS BY THESE PRESENTS, that each person whose signature appears below hereby constitutes and appoints Harry Debes and Stefan B. Schulz, and each of them, his true and lawful attorney-in-fact and agents, with full powers of substitution and resubstitution, for him and in his name, place and stead, in any and all capacities, to sign any and all amendments to this Form 10-K and to file the same, with exhibits thereto and other documents in connection therewith, with the Securities and Exchange Commission, and hereby grants to such attorneys-in-fact and agents full power and authority to do and perform each and every act and thing requisite or necessary to be done, as fully to all intents and purposes as he might or could do in person, hereby ratifying and confirming all that said attorneys-in-fact and agents or his substitute or substitutes may lawfully do or cause to be done by virtue hereof.
Pursuant to the requirements of the Securities Act of 1934, the following persons in the capacities and on the dates indicated have signed this Annual Report on Form 10-K.
Signature
|
Title
|
Date
|
||
|---|---|---|---|---|
| /s/ H. RICHARD LAWSON H. Richard Lawson |
Director, Co-Chairman | July 15, 2010 | ||
/s/ ROMESH WADHWANI Romesh Wadhwani |
Director, Co-Chairman |
July 15, 2010 |
||
/s/ HARRY DEBES Harry Debes |
President and Chief Executive Officer and Director (principal executive officer) |
July 15, 2010 |
||
/s/ STEVEN CHANG Steven Chang |
Director |
July 15, 2010 |
||
/s/ DAVID R. HUBERS David R. Hubers |
Director |
July 15, 2010 |
||
/s/ MICHAEL A. ROCCA Michael A. Rocca |
Director |
July 15, 2010 |
69
Signature
|
Title
|
Date
|
||
|---|---|---|---|---|
| /s/ PAUL WAHL Paul Wahl |
Director | July 15, 2010 | ||
/s/ PETER GYENES Peter Gyenes |
Director |
July 15, 2010 |
||
/s/ ROBERT A. SCHRIESHEIM Robert A. Schriesheim |
Director |
July 15, 2010 |
70
Index to Financial Statements and Financial Statement Schedules—Item 15(a) 1-2
71
Report of Independent Registered Public Accounting Firm
To the Board of Directors and Stockholders of Lawson Software, Inc.
In our opinion, the accompanying consolidated balance sheets and the related consolidated statements of operations, stockholders' equity and comprehensive income (loss) and cash flows present fairly, in all material respects, the financial position of Lawson Software, Inc. and its subsidiaries at May 31, 2010 and 2009, and the results of their operations and their cash flows for each of the three years in the period ended May 31, 2010 in conformity with accounting principles generally accepted in the United States of America. Also in our opinion, the Company maintained, in all material respects, effective internal control over financial reporting as of May 31, 2010, based on criteria established in Internal Control—Integrated Framework issued by the Committee of Sponsoring Organizations of the Treadway Commission (COSO). The Company's management is responsible for these financial statements, for maintaining effective internal control over financial reporting and for its assessment of the effectiveness of internal control over financial reporting, included in Management's Report on Internal Controls and Procedures appearing under Item 9A. Our responsibility is to express opinions on these financial statements and on the Company's internal control over financial reporting based on our integrated audits. We conducted our audits in accordance with the standards of the Public Company Accounting Oversight Board (United States). Those standards require that we plan and perform the audits to obtain reasonable assurance about whether the financial statements are free of material misstatement and whether effective internal control over financial reporting was maintained in all material respects. Our audits of the financial statements included examining, on a test basis, evidence supporting the amounts and disclosures in the financial statements, assessing the accounting principles used and significant estimates made by management, and evaluating the overall financial statement presentation. Our audit of internal control over financial reporting included obtaining an understanding of internal control over financial reporting, assessing the risk that a material weakness exists, and testing and evaluating the design and operating effectiveness of internal control based on the assessed risk. Our audits also included performing such other procedures as we considered necessary in the circumstances. We believe that our audits provide a reasonable basis for our opinions.
As discussed in Note 2, effective June 1, 2009, the Company changed the manner in which it accounts for business combinations and for convertible debt instruments with conversion and other options.
A company's internal control over financial reporting is a process designed to provide reasonable assurance regarding the reliability of financial reporting and the preparation of financial statements for external purposes in accordance with generally accepted accounting principles. A company's internal control over financial reporting includes those policies and procedures that (i) pertain to the maintenance of records that, in reasonable detail, accurately and fairly reflect the transactions and dispositions of the assets of the company; (ii) provide reasonable assurance that transactions are recorded as necessary to permit preparation of financial statements in accordance with generally accepted accounting principles, and that receipts and expenditures of the company are being made only in accordance with authorizations of management and directors of the company; and (iii) provide reasonable assurance regarding prevention or timely detection of unauthorized acquisition, use, or disposition of the company's assets that could have a material effect on the financial statements.
Because of its inherent limitations, internal control over financial reporting may not prevent or detect misstatements. Also, projections of any evaluation of effectiveness to future periods are subject to the risk that controls may become inadequate because of changes in conditions, or that the degree of compliance with the policies or procedures may deteriorate.
| /s/ PRICEWATERHOUSECOOPERS LLP Minneapolis, Minnesota July 15, 2010 |
72
LAWSON SOFTWARE, INC.
CONSOLIDATED BALANCE SHEETS
(in thousands, except per share data)
| |
May 31, 2010 |
May 31, 2009 |
|||||||
|---|---|---|---|---|---|---|---|---|---|
| |
|
(as adjusted) |
|||||||
ASSETS |
|||||||||
Current assets: |
|||||||||
Cash and cash equivalents |
$ | 375,917 | $ | 414,815 | |||||
Restricted cash—current |
654 | 9,208 | |||||||
Trade accounts receivable, net |
117,976 | 152,666 | |||||||
Income taxes receivable |
4,664 | 4,242 | |||||||
Deferred income taxes—current |
18,957 | 18,909 | |||||||
Prepaid expenses and other current assets |
51,945 | 52,255 | |||||||
Total current assets |
570,113 | 652,095 | |||||||
Restricted cash—non-current |
10,070 | 1,786 | |||||||
Property and equipment, net |
54,671 | 55,641 | |||||||
Goodwill |
525,576 | 470,274 | |||||||
Other intangible assets, net |
159,665 | 91,701 | |||||||
Deferred income taxes—non-current(1) |
38,144 | 39,835 | |||||||
Other assets(1) |
13,805 | 13,149 | |||||||
Total assets |
$ | 1,372,044 | $ | 1,324,481 | |||||
LIABILITIES AND STOCKHOLDERS' EQUITY |
|||||||||
Current liabilities: |
|||||||||
Long-term debt—current |
$ | 2,646 | $ | 4,591 | |||||
Accounts payable |
12,085 | 14,018 | |||||||
Accrued compensation and benefits |
76,102 | 73,976 | |||||||
Income taxes payable(1) |
2,271 | 4,512 | |||||||
Deferred income taxes—current |
5,605 | 5,652 | |||||||
Deferred revenue—current |
319,797 | 279,041 | |||||||
Other current liabilities |
36,573 | 56,308 | |||||||
Total current liabilities |
455,079 | 438,098 | |||||||
Long-term debt—non-current(1) |
224,143 | 217,333 | |||||||
Deferred income taxes—non-current |
42,834 | 16,827 | |||||||
Deferred revenue—non-current |
8,363 | 13,482 | |||||||
Other long-term liabilities |
16,456 | 14,781 | |||||||
Total liabilities |
746,875 | 700,521 | |||||||
Commitments and contingencies (Note 13) |
|||||||||
Stockholders' equity: |
|||||||||
Preferred stock; $0.01 par value; 42,562 shares authorized; no shares issued or outstanding |
— | — | |||||||
Common stock; $0.01 par value; 750,000 shares authorized; 202,919 and 201,808 shares issued, respectively; 162,045 and 161,476 shares outstanding at May 31, 2010 and May 31, 2009; respectively |
2,029 | 2,018 | |||||||
Additional paid-in capital(1) |
887,349 | 870,722 | |||||||
Treasury stock, at cost; 40,874 and 40,332 shares at May 31, 2010 and May 31, 2009; respectively |
(326,925 | ) | (324,651 | ) | |||||
Retained earnings(1) |
53,742 | 40,718 | |||||||
Accumulated other comprehensive income |
8,974 | 35,153 | |||||||
Total stockholders' equity |
625,169 | 623,960 | |||||||
Total liabilities and stockholders' equity |
$ | 1,372,044 | $ | 1,324,481 | |||||
- (1)
- Adjusted
to reflect adoption of the FASB guidance on accounting for convertible debt securities (Note 2)
The accompanying Notes are an integral part of the Consolidated Financial Statements
73
LAWSON SOFTWARE, INC.
CONSOLIDATED STATEMENTS OF OPERATIONS
(in thousands, except per share data)
| |
Years Ended May 31, | |||||||||||
|---|---|---|---|---|---|---|---|---|---|---|---|---|
| |
2010 | 2009 | 2008 | |||||||||
| |
|
(as adjusted) |
(as adjusted) |
|||||||||
Revenues: |
||||||||||||
License fees |
$ | 124,126 | $ | 109,683 | $ | 132,156 | ||||||
Maintenance services |
352,986 | 350,202 | 336,779 | |||||||||
Software revenues |
477,112 | 459,885 | 468,935 | |||||||||
Consulting |
259,296 | 297,443 | 382,991 | |||||||||
Total revenues |
736,408 | 757,328 | 851,926 | |||||||||
Cost of revenues: |
||||||||||||
Cost of license fees |
23,987 | 24,361 | 28,782 | |||||||||
Cost of maintenance services |
68,233 | 64,533 | 65,885 | |||||||||
Cost of software revenues |
92,220 | 88,894 | 94,667 | |||||||||
Cost of consulting |
228,874 | 269,738 | 318,253 | |||||||||
Total cost of revenues |
321,094 | 358,632 | 412,920 | |||||||||
Gross profit |
415,314 | 398,696 | 439,006 | |||||||||
Operating expenses: |
||||||||||||
Research and development |
90,268 | 82,377 | 85,374 | |||||||||
Sales and marketing |
162,245 | 162,975 | 189,336 | |||||||||
General and administrative |
84,306 | 79,765 | 100,259 | |||||||||
Restructuring (Note 3) |
13,154 | 19,954 | (731 | ) | ||||||||
Amortization of acquired intangibles |
9,472 | 8,892 | 13,690 | |||||||||
Total operating expenses |
359,445 | 353,963 | 387,928 | |||||||||
Operating income |
55,869 | 44,733 | 51,078 | |||||||||
Other income (expense), net: |
||||||||||||
Interest income |
917 | 6,282 | 20,086 | |||||||||
Interest expense(1) |
(16,238 | ) | (15,625 | ) | (15,976 | ) | ||||||
Impairment and other income (expense), net |
88 | 532 | (17,455 | ) | ||||||||
Total other income (expense), net |
(15,233 | ) | (8,811 | ) | (13,345 | ) | ||||||
Income before income taxes |
40,636 | 35,922 | 37,733 | |||||||||
Provision for income taxes(1) |
27,612 | 21,731 | 28,411 | |||||||||
Net income |
$ | 13,024 | $ | 14,191 | $ | 9,322 | ||||||
Net income per share: |
||||||||||||
Basic |
$ | 0.08 | $ | 0.09 | $ | 0.05 | ||||||
Diluted |
$ | 0.08 | $ | 0.08 | $ | 0.05 | ||||||
Weighted average common shares outstanding: |
||||||||||||
Basic |
161,442 | 164,011 | 177,283 | |||||||||
Diluted |
165,251 | 166,393 | 180,580 | |||||||||
- (1)
- Adjusted to reflect adoption of the FASB guidance on accounting for convertible debt securities (Note 2)
The accompanying Notes are an integral part of the Consolidated Financial Statements
74
CONSOLIDATED STATEMENTS OF STOCKHOLDERS' EQUITY
AND COMPREHENSIVE INCOME (LOSS)
(in thousands)
| |
Common | |
|
|
Accumulated Other Comprehensive Income |
|
|
||||||||||||||||||
|---|---|---|---|---|---|---|---|---|---|---|---|---|---|---|---|---|---|---|---|---|---|---|---|---|---|
| |
Additional Paid-In Capital |
Treasury Stock |
Retained Earnings |
Total Stockholders' Equity |
Comprehensive Income (Loss) |
||||||||||||||||||||
| |
Shares | Amount | |||||||||||||||||||||||
| |
|
|
(as adjusted) |
|
(as adjusted) |
|
(as adjusted) |
(as adjusted) |
|||||||||||||||||
Balance at May 31, 2007 |
182,979 | $ | 1,994 | $ | 847,863 | $ | (123,207 | ) | $ | 17,205 | $ | 35,946 | $ | 779,801 | |||||||||||
Issuance of restricted stock, net |
414 |
— |
(1,171 |
) |
1,101 |
— |
— |
(70 |
) |
||||||||||||||||
Stock-based compensation |
— | — | 6,743 | — | — | — | 6,743 | ||||||||||||||||||
Exercise of stock options |
1,636 | 16 | 6,547 | — | — | — | 6,563 | ||||||||||||||||||
Tax benefit from stockholder transactions |
— | — | 2,534 | — | — | — | 2,534 | ||||||||||||||||||
Employee stock purchase plan |
380 | — | 853 | 2,137 | — | — | 2,990 | ||||||||||||||||||
Repurchase of common stock |
(11,584 | ) | — | — | (105,629 | ) | — | — | (105,629 | ) | |||||||||||||||
Tax benefit on purchase of call options |
— | — | (105 | ) | — | — | — | (105 | ) | ||||||||||||||||
Debt discount related to conversion feature(1) |
— | — | 77 | — | — | — | 77 | ||||||||||||||||||
Change in net unrealized gains/losses on investments, net of taxes |
— | — | — | — | — | 25 | 25 | $ | 25 | ||||||||||||||||
Translation adjustment |
— | — | — | — | — | 61,573 | 61,573 | 61,573 | |||||||||||||||||
Net income(1) |
— | — | — | — | 9,322 | — | 9,322 | 9,322 | |||||||||||||||||
Balance at May 31, 2008 |
173,825 | 2,010 | 863,341 | (225,598 | ) | 26,527 | 97,544 | 763,824 | 70,920 | ||||||||||||||||
Issuance of restricted stock, net |
3 | — | (351 | ) | 351 | — | — | — | |||||||||||||||||
Shares issued for vested restricted stock units |
— | — | (229 | ) | 229 | — | — | — | |||||||||||||||||
Stock-based compensation |
— | — | 8,519 | — | — | — | 8,519 | ||||||||||||||||||
Exercise of stock options |
783 | 8 | 2,218 | — | — | — | 2,226 | ||||||||||||||||||
Tax benefit from stockholder transactions |
— | — | 724 | — | — | — | 724 | ||||||||||||||||||
Employee stock purchase plan |
558 | — | (673 | ) | 3,371 | — | — | 2,698 | |||||||||||||||||
Repurchase of common stock |
(13,693 | ) | — | — | (103,004 | ) | — | — | (103,004 | ) | |||||||||||||||
Cancellation of stock warrants and call options (Note 7) |
— | — | (2,356 | ) | — | — | — | (2,356 | ) | ||||||||||||||||
Increased tax liability due to cancellation of bond hedge (Note 7) |
— | — | (471 | ) | — | — | — | (471 | ) | ||||||||||||||||
Pension and post retirement benefits, net of tax (Note 11) |
— | — | — | — | — | 2,934 | 2,934 | $ | 2,934 | ||||||||||||||||
Change in net unrealized gains/losses on investments, net of taxes |
— | — | — | — | — | (18 | ) | (18 | ) | (18 | ) | ||||||||||||||
Translation adjustment |
— | — | — | — | — | (65,307 | ) | (65,307 | ) | (65,307 | ) | ||||||||||||||
Net income(1) |
— | — | — | — | 14,191 | — | 14,191 | 14,191 | |||||||||||||||||
Balance at May 31, 2009 |
161,476 | 2,018 | 870,722 | (324,651 | ) | 40,718 | 35,153 | 623,960 | (48,200 | ) | |||||||||||||||
Issuance of restricted stock, net |
2 | — | (9 | ) | (38 | ) | — | — | (47 | ) | |||||||||||||||
Shares issued for vested restricted stock units |
282 | — | (3,553 | ) | 2,171 | — | — | (1,382 | ) | ||||||||||||||||
Stock-based compensation |
— | — | 17,028 | — | — | — | 17,028 | ||||||||||||||||||
Exercise of stock options |
1,110 | 11 | 3,506 | — | — | — | 3,517 | ||||||||||||||||||
Tax benefit from stockholder transactions |
— | — | 392 | — | — | — | 392 | ||||||||||||||||||
Employee stock purchase plan |
428 | — | (737 | ) | 3,016 | — | — | 2,279 | |||||||||||||||||
Repurchase of common stock |
(1,253 | ) | — | — | (7,423 | ) | — | — | (7,423 | ) | |||||||||||||||
Pension and post retirement benefits, net of tax (Note 11) |
— | — | — | — | — | (510 | ) | (510 | ) | $ | (510 | ) | |||||||||||||
Change in net unrealized gains/losses on investments, net of taxes |
— | — | — | — | — | 5 | 5 | 5 | |||||||||||||||||
Translation adjustment |
— | — | — | — | — | (25,674 | ) | (25,674 | ) | (25,674 | ) | ||||||||||||||
Net income |
— | — | — | — | 13,024 | — | 13,024 | 13,024 | |||||||||||||||||
Balance at May 31, 2010 |
162,045 | $ | 2,029 | $ | 887,349 | $ | (326,925 | ) | $ | 53,742 | $ | 8,974 | $ | 625,169 | $ | (13,155 | ) | ||||||||
- (1)
- Adjusted to reflect adoption of the FASB guidance on accounting for convertible debt securities (Note 2)
The accompanying notes are an integral part of the Consolidated Financial Statements
75
LAWSON SOFTWARE, INC.
CONSOLIDATED STATEMENTS OF CASH FLOWS
(in thousands)
| |
Years Ended May 31, | |||||||||||
|---|---|---|---|---|---|---|---|---|---|---|---|---|
| |
2010 | 2009 | 2008 | |||||||||
| |
|
(as adjusted) |
(as adjusted) |
|||||||||
Cash flows from operating activities: |
||||||||||||
Net income(1) |
$ | 13,024 | $ | 14,191 | $ | 9,322 | ||||||
Adjustments to reconcile net income to net cash provided by operating activities: |
||||||||||||
Depreciation and amortization |
46,684 | 39,647 | 43,295 | |||||||||
Amortization of debt issuance costs(1) |
1,040 | 1,022 | 1,034 | |||||||||
Amortization of debt discount(1) |
8,486 | 7,948 | 7,462 | |||||||||
Deferred income taxes(1) |
7,516 | (6,604 | ) | 5,776 | ||||||||
Provision for doubtful accounts |
1,312 | 1,489 | 1,110 | |||||||||
Warranty provision |
4,877 | 6,959 | 6,398 | |||||||||
Impairment on investments |
— | — | 18,414 | |||||||||
Net (gain) loss on disposal of assets |
1,122 | — | (311 | ) | ||||||||
Excess tax benefits from stock transactions |
(850 | ) | (648 | ) | (2,128 | ) | ||||||
Stock-based compensation expense |
17,028 | 8,519 | 6,743 | |||||||||
Amortization of discounts (premiums) on marketable securities |
— | 6 | (92 | ) | ||||||||
Changes in operating assets and liabilities (net of acquisitions): |
||||||||||||
Trade accounts receivable |
49,077 | 25,843 | (6,432 | ) | ||||||||
Prepaid expenses and other assets |
1,604 | (7,351 | ) | (19,498 | ) | |||||||
Accounts payable |
(3,724 | ) | (7,660 | ) | 73 | |||||||
Accrued expenses and other liabilities |
(19,937 | ) | 6,731 | (33,594 | ) | |||||||
Income taxes payable/receivable(1) |
(354 | ) | 2,906 | 9,911 | ||||||||
Deferred revenue |
26,134 | (21,710 | ) | 34,156 | ||||||||
Net cash provided by operating activities |
153,039 | 71,288 | 81,639 | |||||||||
Cash flows from investing activities: |
||||||||||||
Cash paid for acquisitions, net of cash acquired |
(160,000 | ) | — | (20,253 | ) | |||||||
Change in restricted cash |
230 | (8,105 | ) | 4,660 | ||||||||
Purchases of marketable securities and investments |
— | — | (205,095 | ) | ||||||||
Proceeds from maturities and sales of marketable securities and investments |
4 | 50,657 | 216,393 | |||||||||
Purchases of property and equipment |
(18,991 | ) | (29,333 | ) | (22,992 | ) | ||||||
Net cash provided by (used in) investing activities |
(178,757 | ) | 13,219 | (27,287 | ) | |||||||
Cash flows from financing activities: |
||||||||||||
Principal payments on long-term debt |
(1,462 | ) | (1,747 | ) | (2,267 | ) | ||||||
Payments on capital lease obligations |
(2,257 | ) | (1,043 | ) | (1,379 | ) | ||||||
Cash proceeds from exercise of stock options |
3,438 | 2,531 | 6,910 | |||||||||
Excess tax benefit from stock transactions |
850 | 648 | 2,128 | |||||||||
Cash proceeds from employee stock purchase plan |
2,428 | 2,698 | 2,990 | |||||||||
Repurchase of common stock from related parties |
— | (8,875 | ) | (36,800 | ) | |||||||
Repurchase of common stock—other |
(7,423 | ) | (94,129 | ) | (68,829 | ) | ||||||
Net cash used in financing activities |
(4,426 | ) | (99,917 | ) | (97,247 | ) | ||||||
Effect of exchange rate changes on cash and cash equivalents |
(8,754 | ) | (4,896 | ) | 4,053 | |||||||
Net decrease in cash and cash equivalents |
(38,898 | ) | (20,306 | ) | (38,842 | ) | ||||||
Cash and cash equivalents at the beginning of the period |
414,815 | 435,121 | 473,963 | |||||||||
Cash and cash equivalents at the end of the period |
$ | 375,917 | $ | 414,815 | $ | 435,121 | ||||||
Supplemental cash flow disclosures: |
||||||||||||
Interest paid |
$ | 6,723 | $ | 6,637 | $ | 6,814 | ||||||
Income taxes paid |
$ | 20,231 | $ | 22,087 | $ | 15,241 | ||||||
- (1)
- Adjusted to reflect adoption of the FASB guidance on accounting for convertible debt securities (Note 2)
The accompanying Notes are an integral part of the Consolidated Financial Statements
76
LAWSON SOFTWARE, INC.
NOTES TO CONSOLIDATED FINANCIAL STATEMENTS
1. Nature of Business and Basis of Presentation
Lawson Software is a global provider of enterprise software, services and support targeting customers in specific industries, including healthcare, service industries, manufacturing & distribution, equipment service management and rental, public sector (U.S.), food & beverage and fashion as well as the horizontal market for our human capital management product line. Lawson serves customers in three geographic regions: the Americas; Europe, Middle East, and Africa (EMEA); and Asia-Pacific, including Australia and New Zealand (APAC). We offer a broad range of software applications and industry-specific solutions that we believe help our customers improve their business processes and reduce costs, resulting in better business or operational performance. Lawson solutions help automate and integrate business processes and promote collaboration among our customers and their partners, suppliers and employees. Through our consulting services, we help our customers implement, learn to use, upgrade and optimize their Lawson applications. Through our support services, we provide ongoing maintenance and assistance to our customers.
Basis of Presentation
Our Consolidated Financial Statements are prepared in conformity with accounting principles generally accepted in the U.S. (U.S. GAAP) and include the accounts of Lawson Software, Inc., our branches and our wholly-owned and majority-owned subsidiaries operating in the Americas, EMEA, and APAC. All significant intercompany accounts and transactions have been eliminated. Our subsidiaries that are not majority-owned are accounted for under the equity method. The accompanying Consolidated Financial Statements reflect all adjustments, in the opinion of management, necessary to fairly state our consolidated financial position, results of operations and cash flows for the periods presented. These adjustments consist of normal, recurring items other than the out-of-period adjustments described below under Fiscal 2010 Results of Operations and Fiscal 2009 Results of Operations. The accompanying Consolidated Financial Statements for all fiscal year 2009 and 2008 periods also include certain adjustments related to the adoption of an accounting pronouncement that we were required to adopt retrospectively, as described in Note 2, Summary of Significant Accounting Policies—Adoption of New Accounting Pronouncements.
Use of Estimates
The preparation of financial statements in conformity with U.S. GAAP requires us to make estimates and assumptions that affect the reported amounts of assets and liabilities as of the date of our financial statements, the reported amounts of revenues and expenses during the reporting periods presented, as well as our disclosures of contingent assets and liabilities. On an on-going basis, we evaluate our estimates and assumptions, including those related to revenue recognition, allowance for doubtful accounts and sales returns, fair value of investments, fair value of stock-based compensation, fair value of acquired intangible assets and goodwill, useful lives of intangible assets and property and equipment, income taxes, restructuring obligations, contingencies and litigation, among others. We base our estimates and assumptions on our historical experience and various other pieces of information available to us when these estimates and assumptions are made. We believe that these estimates and assumptions are reasonable under the circumstances and form the basis for our making judgments about the carrying values of our assets and liabilities that are not readily apparent from other sources. Actual results and outcomes could differ from our estimates.
77
LAWSON SOFTWARE, INC.
NOTES TO CONSOLIDATED FINANCIAL STATEMENTS (Continued)
1. Nature of Business and Basis of Presentation (Continued)
Business Segments
During fiscal 2009 and prior years, we viewed our operations and managed our business as one reportable segment: the development and marketing of computer software and related services including consulting, maintenance and customer support. Beginning in the first quarter of fiscal 2010, we reorganized our operations to provide greater focus on and better serve our targeted vertical markets. With this strategic organizational change, including a workforce realignment, we determined that we have three reportable segments that align with our three industries groups: S3 Strategic Industries, M3 Strategic Industries and General Industries. See Note 14, Segment and Geographic Information, for applicable reportable segment disclosures.
Fiscal Year
Our fiscal year is from June 1 through May 31. Unless otherwise stated, references to the years 2010, 2009 and 2008 relate to the fiscal years ended May 31, 2010, 2009 and 2008; respectively. References to future years also relate to our fiscal years ending May 31.
Fiscal 2010 Results of Operations
Our results for fiscal 2010 include reductions to net income of approximately $0.8 million primarily as a result of $1.7 million of additional income tax provision recorded in the first quarter of fiscal 2010 that should have been recorded as a reduction of net income in the fourth quarter of 2009. An additional out-of-period adjustment was recorded in the first quarter of fiscal 2010 that increased pre-tax operating income by $0.9 million, related to the reversal of a services loss reserve that should have been reversed in the first quarter of fiscal 2008. We have determined that the impact of these out-of-period adjustments recorded in the first quarter of fiscal 2010 were immaterial to our results of operations in all applicable prior interim and annual periods and to our first quarter and our results of operations for fiscal 2010.
Fiscal 2009 Results of Operations
Our results for fiscal 2009 include reductions to net income of approximately $2.3 million primarily as a result of $1.9 million of under accruals of sales incentive compensation recorded in the first quarter of fiscal 2009 that should have been recorded as a reduction of net income in the fourth quarter of fiscal 2008. These accruals primarily related to sales incentive compensation in EMEA. The fourth quarter fiscal 2008 under accrual was primarily due to the fact that the previous accrual methodology utilized in EMEA did not sufficiently provide for (1) overachievement of sales quotas and related higher commission rates that were achieved in EMEA in fiscal 2008 when license contracting targets were greatly exceeded by various sales personnel, and (2) sales incentives payable to sales management employees. We have taken actions, such as redesigning the sales incentive accrual process and enhancing monitoring controls, to mitigate the potential for replicating this matter. Additional out-of-period adjustments were recorded in the second quarter of fiscal 2009 that increased pre-tax operating expenses by $0.4 million, primarily related to deferred third-party costs included in costs of license fees and in the fourth quarter of fiscal 2009 that resulted in an increase in service revenues for the fiscal year of $0.3 million. We have determined that the impact of the sales incentive compensation under accruals and the out-of-period adjustments recorded in the second and fourth quarters were immaterial to our fiscal 2009 results of operations.
78
LAWSON SOFTWARE, INC.
NOTES TO CONSOLIDATED FINANCIAL STATEMENTS (Continued)
2. Summary of Significant Accounting Policies
Adoption of New Accounting Pronouncements
On September 1, 2009, we adopted the Financial Accounting Standards Board (FASB) guidance on accounting standards codification and hierarchy of generally accepted accounting principles. This guidance was issued in June 2009 and established the FASB Accounting Standards Codification (the ASC) as the source for authoritative U.S. GAAP. The ASC supersedes all existing non-SEC accounting and reporting standards under U.S. GAAP for nongovernmental entities. It is not intended to nor does it change existing U.S. GAAP. Any additions/revisions to U.S. GAAP will be incorporated into the ASC through Accounting Standards Updates (ASU's). Our adoption of the ASC did not have any impact on our financial position, results of operations or cash flows.
On June 1, 2009, we adopted the FASB guidance related to accounting for convertible debt instruments with conversion and other options, which impacts the accounting treatment for convertible debt instruments that allow for either mandatory or optional cash settlements. This guidance, issued in May 2008, impacts the accounting associated with our $240.0 million senior convertible notes. See Note 7, Long-Term Debt and Credit Facilities, for additional information regarding our senior convertible notes. Under this guidance we are required to recognize additional (non-cash) interest expense based on the market rate for similar debt instruments that do not contain a comparable conversion feature. Furthermore, the guidance requires a retrospective adjustment for recognition of interest expense in prior periods. Accordingly, we have made certain adjustments to the presentation of our 2009 and 2008 Consolidated Financial Statements.
The adoption of the guidance on accounting for convertible debt instruments that may be settled in cash upon conversion required us to allocate the $240.0 million proceeds received from the issuance of our senior convertible notes between the applicable debt and equity components. Accordingly, we have allocated $197.7 million of the proceeds to the debt component of our senior convertible notes and $25.2 million, net of deferred taxes of $15.8 million and debt issuance costs of $1.3 million, to the equity conversion feature. The debt component allocation was based on the estimated fair value of similar debt instruments without a conversion feature as determined by using a discount rate of 6.77%, which represents our estimated borrowing rate for such debt as of the date of our senior convertible notes' issuance. The difference between the cash proceeds associated with our senior convertible notes and the debt component was recorded as a debt discount with a corresponding offset to additional paid-in-capital, net of applicable deferred taxes and allocated debt issuance costs, representing the equity conversion feature. The debt discount that we recorded is being amortized over five years, which is the expected term of our senior convertible notes (April 23, 2007 through April 15, 2012), using the effective interest method resulting in additional non-cash interest expense. The debt issuance costs have been allocated to the respective debt component and the equity conversion feature resulting in a reclassification of $1.3 million of debt issuance costs to additional paid-in-capital as of June 1, 2009. The debt issuance costs allocated to the debt component are also being amortized to interest expense over the expected term of our senior convertible notes. As of May 31, 2010, the remaining period over which the debt discount and debt issuance costs will be amortized is approximately 1.8 years.
79
LAWSON SOFTWARE, INC.
NOTES TO CONSOLIDATED FINANCIAL STATEMENTS (Continued)
2. Summary of Significant Accounting Policies (Continued)
The carrying amounts of our senior convertible notes included in our Consolidated Balance Sheets were as follows (in thousands):
| |
May 31, 2010 | May 31, 2009 | |||||
|---|---|---|---|---|---|---|---|
| |
|
(as adjusted) |
|||||
Principal balance |
$ | 240,000 | $ | 240,000 | |||
Debt discount |
(17,535 | ) | (26,022 | ) | |||
Senior convertible notes, net |
$ | 222,465 | $ | 213,978 | |||
We have recorded the following interest expense related to our senior convertible notes in the periods presented (in thousands):
| |
Years Ended May 31, | |||||||||
|---|---|---|---|---|---|---|---|---|---|---|
| |
2010 | 2009 | 2008 | |||||||
| |
|
(as adjusted) |
(as adjusted) |
|||||||
Coupon rate of interest (2.5%—cash interest) |
$ | 6,000 | $ | 6,000 | $ | 6,000 | ||||
Debt discount amortization |
8,486 | 7,948 | 7,386 | |||||||
Debt issuance cost amortization |
1,040 | 1,040 | 1,040 | |||||||
Net interest expense |
$ | 15,526 | $ | 14,988 | $ | 14,426 | ||||
The following tables reflect the impact that adoption of the FASB guidance on accounting for convertible debt securities had on our Consolidated Financial Statements (in thousands, except per share amounts) for the periods presented.
Consolidated Balance Sheet as of May 31, 2009:
| |
As Originally Reported |
Convertible Debt Adjustments |
As Adjusted | |||||||
|---|---|---|---|---|---|---|---|---|---|---|
Deferred income taxes—non-current (asset) |
$ | 49,565 | $ | (9,730 | ) | $ | 39,835 | |||
Other assets |
13,903 | (754 | ) | 13,149 | ||||||
Income taxes payable |
4,513 | (1 | ) | 4,512 | ||||||
Long-term debt—non-current |
243,355 | (26,022 | ) | 217,333 | ||||||
Additional paid-in capital |
845,522 | 25,200 | 870,722 | |||||||
Retained earnings |
50,379 | (9,661 | ) | 40,718 | ||||||
Consolidated Statement of Operations for fiscal 2009:
| |
As Originally Reported |
Convertible Debt Adjustments |
As Adjusted | |||||||
|---|---|---|---|---|---|---|---|---|---|---|
Interest expense |
$ | 7,939 | $ | 7,686 | $ | 15,625 | ||||
Provision from income taxes |
24,691 | (2,960 | ) | 21,731 | ||||||
Net income |
18,917 | (4,726 | ) | 14,191 | ||||||
Basic net income (loss) per share |
$ | 0.12 | $ | (0.03 | ) | $ | 0.09 | |||
Diluted net income (loss) per share |
$ | 0.11 | $ | (0.03 | ) | $ | 0.08 | |||
80
LAWSON SOFTWARE, INC.
NOTES TO CONSOLIDATED FINANCIAL STATEMENTS (Continued)
2. Summary of Significant Accounting Policies (Continued)
Consolidated Statement of Operations for fiscal 2008:
| |
As Originally Reported |
Convertible Debt Adjustments |
As Adjusted | |||||||
|---|---|---|---|---|---|---|---|---|---|---|
Interest expense |
$ | 8,844 | $ | 7,132 | $ | 15,976 | ||||
Provision from income taxes |
31,158 | (2,747 | ) | 28,411 | ||||||
Net income (loss) |
13,707 | (4,385 | ) | 9,322 | ||||||
Basic net income (loss) per share |
$ | 0.08 | $ | (0.03 | ) | $ | 0.05 | |||
Diluted net income (loss) per share |
$ | 0.08 | $ | (0.03 | ) | $ | 0.05 | |||
Consolidated Statement of Cash Flows for fiscal 2009:
| |
As Originally Reported |
Convertible Debt Adjustments |
As Adjusted | |||||||
|---|---|---|---|---|---|---|---|---|---|---|
Net income (loss) |
$ | 18,917 | $ | (4,726 | ) | $ | 14,191 | |||
Amortization of debt issuance costs |
1,284 | (262 | ) | 1,022 | ||||||
Amortization of debt discount |
— | 7,948 | 7,948 | |||||||
Deferred income taxes |
(3,645 | ) | (2,959 | ) | (6,604 | ) | ||||
Income taxes payable/receivable |
2,907 | (1 | ) | 2,906 | ||||||
Net cash used in operating activities |
71,288 | — | 71,288 | |||||||
Consolidated Statement of Cash Flows for fiscal 2008:
| |
As Originally Reported |
Convertible Debt Adjustments |
As Adjusted | |||||||
|---|---|---|---|---|---|---|---|---|---|---|
Net income (loss) |
$ | 13,707 | $ | (4,385 | ) | $ | 9,322 | |||
Amortization of debt issuance costs |
1,288 | (254 | ) | 1,034 | ||||||
Amortization of debt discount |
— | 7,462 | 7,462 | |||||||
Deferred income taxes |
8,599 | (2,823 | ) | 5,776 | ||||||
Net cash used in operating activities |
81,639 | — | 81,639 | |||||||
Effective June 1, 2008, we adopted the FASB guidance related to fair value measurements. This guidance was issued in September 2006 and establishes a common definition for fair value to be applied to U.S. GAAP guidance requiring use of fair value, establishes a framework for measuring fair value, and expands disclosure about such fair value measurements. In February 2008, the FASB issued additional guidance which removed certain leasing transactions from the scope of these provisions and partially deferred the effective date of this guidance for one year for certain nonfinancial assets and nonfinancial liabilities that are recognized at fair value on a nonrecurring basis (at least annually). Our June 1, 2008 adoption date for this guidance was effective for financial assets and liabilities and nonfinancial assets and liabilities that are recognized at fair value on a recurring basis. On June 1, 2009, we adopted the fair value guidance for our non-financial assets and liabilities that are recognized at fair value on a nonrecurring basis. Our adoption of this guidance did not have a significant impact on our financial position, results of operations or cash flows. See Fair Value Measurements for applicable information.
81
LAWSON SOFTWARE, INC.
NOTES TO CONSOLIDATED FINANCIAL STATEMENTS (Continued)
2. Summary of Significant Accounting Policies (Continued)
Effective June 1, 2009, we adopted the FASB guidance related to business combinations, which significantly changed how business acquisitions are accounted for and impacts financial statements both on the acquisition date and in subsequent periods. This guidance was issued in December 2007 and establishes principles and requirements for the recognition and measurement of identifiable assets acquired, the liabilities assumed, contractual contingencies, and contingent consideration at their fair value on the acquisition date. Some of the changes, such as the accounting for contingent consideration and exclusion of transaction costs from acquisition accounting, may introduce more volatility into earnings. Our accounting for business combinations changed on a prospective basis beginning with business combinations for which the acquisition date was after our adoption date of June 1, 2009, including our January 11, 2010 acquisition of Healthvision. See Note 4, Business Combinations. In addition, any restructuring liabilities established in connection with integration of an acquired entity will have a negative impact on our future operating results as they will not be accounted for as part of the business combination purchase price but will be expensed when accrued. In relation to previous acquisitions, this guidance requires any release of existing income tax valuation allowances initially established through purchase accounting to be included in our earnings rather than as an adjustment to goodwill. This would have the effect of reducing our income tax provision in future periods when such valuation allowances are reversed.
Effective June 1, 2009, we adopted the provisions related to accounting for assets acquired and liabilities assumed in a business combination that arise from contingencies. The guidance requires that assets and liabilities of contractual and noncontractual contingencies be recognized at fair value if the fair value can be reasonably determined during the measurement period and provides guidance on how to make that determination. This guidance applies prospectively to business combinations for which the acquisition date is after our adoption date of June 1, 2009. Our adoption of this guidance did not have a material impact on our financial position, results of operations or cash flows.
Effective June 1, 2009, we adopted the FASB guidance related to non-controlling interests in consolidated financial statements. This guidance, issued in December 2007, changed the accounting and reporting for minority interests, which are to be recharacterized as non-controlling interests and classified as a separate component of equity rather than as a liability. As of June 1, 2009, there were no non-controlling interests relating to any of our subsidiaries. Accordingly, our adoption of this guidance did not have a material impact on our financial position, results of operations or cash flows.
Effective June 1, 2009, we adopted the FASB guidance related to interim disclosures about fair value of financial instruments. This guidance, issued in April 2009, enhances consistency in financial reporting by requiring disclosures about the fair value of financial instruments in interim reporting periods as well as in annual financial statements. Our adoption of this guidance did not have a material impact on our financial position, results of operations or cash flows. See, Fair Value of Financial Instruments, below for applicable disclosures.
Fair Value of Financial Instruments
Our financial instruments consist primarily of cash equivalents, marketable securities, trade accounts receivable and accounts payable and foreign currency forward contracts for which the current carrying amounts approximate fair values, primarily due to their short periods to maturity. Our long-term debt is carried at its face value, net of applicable debt discount recorded upon adoption of the FASB guidance on accounting for convertible debt securities, as discussed above. The estimated fair
82
LAWSON SOFTWARE, INC.
NOTES TO CONSOLIDATED FINANCIAL STATEMENTS (Continued)
2. Summary of Significant Accounting Policies (Continued)
value of our 2.5% senior convertible notes, including current maturities, was $240.0 million as of May 31, 2010, based on quoted market prices. The remainder of our long-term debt has fair values that are not materially different from their aggregate carrying values of $4.3 million.
Cash Equivalents
All highly liquid investments with an original maturity of three months or less are considered to be cash equivalents. Our cash equivalents consist primarily of funds held in money market instruments. The carrying amount of cash equivalents approximates their fair value due to the short maturity of these instruments.
Accounts Receivable and Allowance for Doubtful Accounts
Accounts receivable are initially recorded at fair value upon the sale of software licenses and services to our customers. We maintain an allowance for doubtful accounts at an amount we estimate to be sufficient to provide adequate protection against losses resulting from extending credit to our customers. In judging the adequacy of the allowance for doubtful accounts, we consider multiple factors including historical bad debt experience, the general economic environment, the need for specific customer reserves and the aging of our receivables. This provision is included in operating expenses as a general and administrative expense. A considerable amount of judgment is required in assessing these factors. If the factors utilized in determining the allowance do not reflect future performance, a change in the allowance would be necessary in the period such determination is made which would affect future results of operations.
Marketable Securities and Other Investments
We account for our investments in marketable securities and other investments in accordance with the provisions of the FASB guidance on investments in debt and equity securities, which addresses the accounting and reporting for investments in fixed maturity securities and for equity securities with readily determinable fair values. We determine the appropriate classification of our investments in debt securities at the time of purchase and reevaluate such designation as of each balance sheet date. During fiscal 2008, all marketable securities we held were classified as available-for-sale and our entire auction rate securities portfolio was classified as short-term investments. Available-for-sale securities are carried at fair value as determined by market prices/quotes, with unrealized gains and losses, net of tax, reported as a separate component of stockholders' equity. Our investments in auction rate securities were carried at estimated fair value with the related impairment recorded in 2008 classified as other-than-temporary and recognized in our Consolidated Statements of Operations. We liquidated all of our auction rate securities during 2009 as discussed below, and held no marketable securities as of May 31, 2009. The cost basis of securities sold is determined using the specific identification method. Interest and dividends on securities classified as available-for-sale are included in interest income.
We review potential impairment of our investments in accordance with the FASB guidance on investments in debt and equity securities, to determine the classification of any impairment as temporary or other-than-temporary. A temporary impairment charge results in an unrealized loss being recorded in the other comprehensive income component of stockholders' equity. Such an unrealized loss does not reduce net income for the applicable accounting period because the loss is viewed as temporary. Losses are recognized in our statement of operations when a decline in fair value is
83
LAWSON SOFTWARE, INC.
NOTES TO CONSOLIDATED FINANCIAL STATEMENTS (Continued)
2. Summary of Significant Accounting Policies (Continued)
determined to be other-than-temporary. We review our investments on an ongoing basis for indications of possible impairment and proper classification of any impairment once identified. Determination of whether the impairment is temporary or other-than-temporary requires significant judgment. The primary factors we consider in classifying the impairment include the extent and time the fair value of each investment has been below cost, the expected holding or recovery period for each investment and our intent and ability to hold each investment until recovery.
On July 7, 2008, we sold our auction rate securities portfolio for $45.2 million in cash, the carrying value as of May 31, 2008. In light of this transaction, the $2.9 million of impairment losses previously recorded in the second and third quarters of fiscal 2008, and originally determined to be temporary and reflected in a separate component of stockholders' equity, were reclassified as other-than-temporary and included in our results of operations for fiscal 2008. As a result, we recorded an impairment charge of approximately $18.4 million in fiscal 2008 which is included in other income (expense), net in the accompanying Consolidated Statements of Operations.
Property and Equipment
Property and equipment includes equipment, office furniture and automobiles and is stated at cost less accumulated depreciation. Depreciation is computed using the straight-line method over the estimated useful lives of the assets, which generally range from three to seven years. Property and equipment also includes leasehold improvements which are stated at cost less accumulated amortization. Amortization is computed over the shorter of the economic life or the term of the underlying facility lease, which generally ranges from three to 16 years.
In addition, we capitalize certain costs related to our development of internal use software in accordance with applicable FASB guidance. Capitalized costs are amortized over the software's estimated useful life, which is generally five years. During fiscal 2010 and 2009, we capitalized approximately $5.5 million and $12.3 million of software development costs related to programs to be used solely to meet our internal needs. In addition, during fiscal 2010 we wrote-off $1.1 million in previously capitalized costs related to internally developed front-end sales cycle tools which we no longer intend to use. The resulting charge is included in general and administrative expense in the accompanying Consolidated Statements of Operations.
Depreciation and amortization expense related to property, plant and equipment, including internal use software, was $21.8 million, $17.1 million and $13.9 million for fiscal 2010, 2009 and 2008; respectively.
Lease Obligations
We recognize lease obligations with scheduled rent increases over the terms of the leases on straight-line basis in accordance with FASB guidance related to operating leases. Accordingly, the total amount of base rentals over the term of our leases is charged to expense using a straight-line method, with the amount of rental expense in excess of lease payments recorded as a deferred rent liability in our Consolidated Balance Sheets. As of May 31, 2010 and 2009, we had deferred rent liabilities of $2.9 million and $2.8 million; respectively, which are classified in other long-term liabilities. We also recognize capital lease obligations and record the underlying assets and liabilities in our Consolidated Balance Sheets (See Note 13, Commitments and Contingencies).
84
LAWSON SOFTWARE, INC.
NOTES TO CONSOLIDATED FINANCIAL STATEMENTS (Continued)
2. Summary of Significant Accounting Policies (Continued)
Revenue Recognition
Revenue recognition rules for software businesses are very complex. We follow specific and detailed guidelines in determining the proper amount of revenue to be recorded. However, certain judgments affect the application of our revenue recognition policy. Revenue results are difficult to predict, and any shortfall in revenue or delay in recognizing revenue could cause our operating results to vary significantly from year to year.
The significant judgments for revenue recognition typically involve determining whether collectability can be considered probable and whether fees are fixed or determinable. In addition, our transactions often consist of multiple element arrangements which typically include license fees, maintenance and support fees and consulting service fees. These multiple element arrangements must be analyzed to determine the relative fair value of each element, the amount of revenue to be recognized upon shipment, if any, and the period and conditions under which deferred revenue should be recognized.
We recognize revenue in accordance with the provisions of the FASB guidance on software revenue recognition. We license software under non-cancellable license agreements and provide related consulting services, including training and implementation services, as well as on-going customer support and maintenance.
When our consulting, training and implementation services 1) are not considered essential to the functionality of our software products, 2) are sold separately and also 3) are available from a number of third-party service providers, our revenues from these services are generally recorded separately from license fees and recognized as the services are performed. License fees within software arrangements, including services that do not meet any one or a combination of the three criteria listed above, are recognized in accordance with the applicable FASB guidance, using contract accounting and the percentage-of-completion methodology based on labor hours input. Software arrangements which include certain fixed-fee service components are usually recognized as the services are performed while corresponding direct service costs to provide these services are expensed as incurred.
From time-to-time, we enter into software arrangements that include software license, maintenance and consulting services which are considered essential to the functionality of the software. In these instances, we recognize revenue for the three revenue streams under two units of accounting, which are the (i) software license bundled together with consulting services and (ii) maintenance. For purposes of presenting revenues, we present applicable license fees, maintenance and consulting revenues in our Consolidated Statements of Operations using VSOE (or, if unavailable, other objective evidence) of fair value for the undelivered elements and assign the remainder of the arrangement fee to the license.
The amounts of revenue and related expenses reported in the Consolidated Financial Statements may vary due to the amount of judgment required to address significant assumptions, risks and uncertainties in applying the application of the percentage-of-completion methodology. Our specific revenue recognition policies are as follows:
- •
- Software License Fees—License fee revenues from end-users are recognized when the software product has been shipped, provided a non-cancellable license agreement has been signed, there are no uncertainties surrounding product acceptance, the fees are fixed or determinable and collection of the related receivable is considered probable. Provided the above criteria are met, license fee revenues from resellers are recognized when there is a sell-through by a reseller to
85
LAWSON SOFTWARE, INC.
NOTES TO CONSOLIDATED FINANCIAL STATEMENTS (Continued)
2. Summary of Significant Accounting Policies (Continued)
- •
- Maintenance and Support—Revenues from customer maintenance and
support contracts are deferred and recognized ratably over the term of the agreements. Revenues for maintenance and support that are bundled with license fees are deferred based on the VSOE of fair
value of the bundled maintenance and support and recognized over the term of the agreement. VSOE of fair value is based on the renewal rate for continued maintenance and support arrangements.
- •
- Consulting Services—Revenues from consulting services (including training and implementation services) are recognized as services are provided to customers. Revenues for consulting services that are bundled with license fees are deferred based on the VSOE of fair value of the bundled services and recognized when the services are performed. VSOE of fair value is based on the price charged when training and consulting services are sold separately. Our subscriptions contracts are comprised of recurring software licenses, related support and applicable hosting. Because these components work interdependently we consider them to be one accounting element for which we defer recognition of the subscription fee upon contract execution and recognize it ratably over the subscription period.
an end-user. A sell-through is determined when we receive an order form from a reseller for a specific end-user sale. We do not generally offer rights of return, acceptance clauses or price protection to our customers. In situations where software license contracts include rights of return or acceptance clauses, revenue is deferred until the clause expires. Typically, our software license fees are due within a 12-month period from the date of shipment. If the fee due from the customer is not fixed or determinable or includes payment terms greater than twelve months from shipment, revenue is recognized as payments become due and all other conditions for revenue recognition have been satisfied. In software arrangements that include rights to multiple delivered elements such as software products or specified upgrades and undelivered elements such as support or services, we allocate the total arrangement fee according to the fair value of each element using VSOE. VSOE of fair value is determined using the price charged when that element is sold separately. In software arrangements in which we have fair value of all undelivered elements but not of a delivered element, we use the residual method to record revenue. Under the residual method, the fair value of the undelivered elements is deferred and the remaining portion of the arrangement fee is allocated to the delivered element and is recognized as revenue. In software arrangements in which we do not have VSOE of fair value of all undelivered elements, revenue is deferred until fair value is determined or all elements for which we do not have VSOE of fair value have been delivered.
86
LAWSON SOFTWARE, INC.
NOTES TO CONSOLIDATED FINANCIAL STATEMENTS (Continued)
2. Summary of Significant Accounting Policies (Continued)
Deferred Debt Issuance Costs
Deferred debt issuance costs of $2.0 million and $3.0 million, net of amortization, are included in our Consolidated Balance Sheets as of May 31, 2010 and 2009, respectively, and are reflected in other assets. Deferred debt issuance costs are being amortized using the straight-line method (which approximates the effective interest method) over the estimated remaining maturity of the related convertible debt and are included in interest expense in our Consolidated Statements of Operations.
Sales Returns and Allowances
We do not generally provide a contractual right of return. However, in the course of arriving at practical business solutions to various warranty and other claims, we have allowed sales returns and allowances. We record a provision against revenue for estimated sales returns and allowances on license and consulting revenues in the same period the related revenues are recorded or when current information indicates additional allowances are required. These estimates are based on historical experience determined by analysis of return activities, specifically identified customers and other known factors. If the historical data we utilize does not reflect expected future performance, a change in the allowances would be recorded in the period such determination is made affecting future results of operations.
Following is a roll forward of our product warranty reserve (in thousands):
Balance, May 31, 2007 |
$ | 3,745 | |||
Provision |
6,398 | ||||
Write-offs |
(2,465 | ) | |||
Translation adjustment |
242 | ||||
Balance, May 31, 2008 |
7,920 | ||||
Provision |
6,959 | ||||
Write-offs |
(6,624 | ) | |||
Translation adjustment |
(350 | ) | |||
Balance, May 31, 2009 |
7,905 | ||||
Provision |
4,877 | ||||
Write-offs |
(4,137 | ) | |||
Translation adjustment |
(151 | ) | |||
Balance, May 31, 2010 |
$ | 8,494 | |||
Research and Development
Expenditures for software research and development are expensed as incurred. These expenses consist primarily of salaries, employee benefits, related overhead costs, and consulting fees associated with product development, testing, quality assurance, documentation, enhancements and upgrades for existing customers under maintenance. Such costs are required to be expensed until the point that technological feasibility of the software is established. We consider technological feasibility to have occurred when all design, coding and testing of the software product has been completed. Our software research and development costs primarily relate to our efforts during the period prior to technological feasibility and are charged to operations as incurred. To date, under our process for developing
87
LAWSON SOFTWARE, INC.
NOTES TO CONSOLIDATED FINANCIAL STATEMENTS (Continued)
2. Summary of Significant Accounting Policies (Continued)
software, the time period between the establishment of technological feasibility and completion of software development has been short and no significant development costs have been incurred during that period. Accordingly, we have not capitalized any software research and development.
Advertising Expense
We expense advertising costs as incurred. Advertising expenses of $11.0 million, $13.0 million and $16.2 million were charged to sales and marketing expenses during fiscal 2010, 2009 and 2008; respectively.
Income Taxes
Our provision for income taxes consists of provisions for federal, state, and foreign income taxes. We operate in an international environment with significant operations in various locations outside of the United States. Accordingly, our consolidated income tax rate is a composite rate reflecting our operating results in various locations and the applicable rates.
Significant judgment is required in determining our worldwide income tax provision. In the ordinary course of a global business, there are many transactions and calculations where the ultimate tax outcome is uncertain. Our judgments, assumptions, and estimates relative to the provision for income taxes take into account current tax laws, our interpretation of current tax laws, and possible outcomes of current and future audits conducted by foreign and domestic tax authorities. Although we believe that our estimates are reasonable, the final tax outcome of matters could be different from that which is reflected in our historical income tax provision and accruals. Such differences, if identified in future periods, could have a material effect on the amounts recorded in our Consolidated Financial Statements.
In conjunction with preparing the global tax provision, we must assess temporary differences resulting from the different treatment of specific items for tax and financial reporting purposes. These differences result in deferred tax assets and liabilities, which are included within our Consolidated Balance Sheets. As part of this process we must also assess, on a jurisdictional basis, the likelihood that deferred tax assets will be realized from future taxable income, and based on this assessment establish a valuation allowance, if required. The determination of our valuation allowance is based upon a number of assumptions, judgments, and estimates, including historical operating results, forecasted earnings and future taxable income, and the relative proportions of revenue and income before taxes in the various domestic and international jurisdictions in which we operate. To the extent we establish a valuation allowance or change the valuation allowance in a period, we reflect the change with a corresponding increase or decrease to our tax provision.
Under the provisions of the FASB guidance related to accounting for income taxes, prior to fiscal 2010, reductions to the valuation allowance related to Intentia's deferred tax assets that existed as of the date of the acquisition of Intentia were first credited against goodwill, then to the other identifiable assets existing at the date of acquisition, and then, once these assets have been reduced to zero, credited to the income tax provision. A non-cash provision will be credited against goodwill for the utilization of pre-acquisition net operating losses that had been fully reserved in purchase accounting. With our adoption of the FASB guidance related to business combinations effective June 1, 2009, beginning in fiscal 2010 any release of valuation allowances recorded through purchase accounting in
88
LAWSON SOFTWARE, INC.
NOTES TO CONSOLIDATED FINANCIAL STATEMENTS (Continued)
2. Summary of Significant Accounting Policies (Continued)
relation to our acquisitions are included as a decrease in our income tax provision rather than as an adjustment to goodwill.
We recognize accrued interest related to unrecognized tax benefits in tax expense. Penalties, if incurred, are also recognized as a component of tax expense. In addition, the tax effect of discrete items is booked entirely in the quarter in which the discrete event occurs.
Concentrations of Credit Risks
Financial instruments that potentially subject us to concentrations of credit risk consist primarily of cash and cash equivalents and trade accounts receivable. Cash equivalents consist primarily of money market instruments and highly liquid debt securities of corporations, the U.S. Government and its Agencies, with original maturities of three months or less at the date of purchase.
We grant credit to customers in the ordinary course of business. Concentrations of credit risk with respect to trade accounts receivable are limited due to the large number of customers comprising our customer base and their dispersion across different industries and geographic areas. No single customer accounted for 10% or more of our revenues for fiscal 2010, 2009 or 2008 or of trade accounts receivable at May 31, 2010 or 2009.
Contingent Liabilities
We may, from time to time, have unresolved regulatory, legal, tax and other matters (See Note 13, Commitments and Contingencies). We provide for contingent liabilities in accordance with the applicable FASB guidance. Pursuant to this guidance, a loss contingency is charged to income when it is probable that an asset has been impaired or a liability has been incurred at the date of the financial statements and the amount of the loss can be reasonably estimated. Disclosure in the notes to the financial statements is required for loss contingencies that do not meet both those conditions if there is a reasonable possibility that a loss may have been incurred. Gain contingencies are not recorded until realized. We expense all legal costs incurred to resolve regulatory, legal, tax, and other matters in the period incurred.
Periodically, we review the status of each significant matter to assess our potential financial exposure. If a potential loss is considered probable and the amount can be reasonably estimated, we reflect the estimated loss in our results of operations. Significant judgment is required to determine the probability that a liability has been incurred and whether such liability can be reasonably estimated. Because of uncertainties related to these matters, accruals are based on the best information available to us at each reporting period. Further, estimates of this nature are highly subjective, and the final outcome of these matters could vary significantly from the amounts that have been included in the accompanying Consolidated Financial Statements. As additional information becomes available, we reassess the potential liability related to any pending claims and litigation and may revise our estimates accordingly. Such revisions in the estimates of the potential liabilities could have a material impact on our future results of operations, financial position and cash flows.
89
LAWSON SOFTWARE, INC.
NOTES TO CONSOLIDATED FINANCIAL STATEMENTS (Continued)
2. Summary of Significant Accounting Policies (Continued)
Goodwill and Other Intangible Assets
During fiscal 2009 we operated as one reportable segment. The changes in the carrying amount of goodwill for fiscal 2009 were as follows (in thousands):
| |
|
||||
|---|---|---|---|---|---|
Balance as of June 1, 2008 |
$ | 546,578 | |||
Goodwill adjustments |
(8,118 | ) | |||
Currency translation effect |
(68,186 | ) | |||
Balance as of May 31, 2009 |
$ | 470,274 | |||
The $8.1 million of adjustments to goodwill recorded during fiscal 2009 include a reduction of $1.6 million related to our fiscal 2006 lease restructuring plan (See Note 3, Restructuring), as well as a $0.6 million reversal related to deferred revenue initially recognized with our purchase of Intentia. In addition, we determined that a portion of our foreign net operating losses were not sustainable. These NOLs related to pre-acquisition activity of Intentia. Accordingly, we recorded a reduction in the acquired deferred tax assets and a corresponding increase in goodwill of approximately $1.9 million. We also recorded an offsetting adjustment to reverse certain valuation allowances related to acquired deferred tax assets which we determined are now more likely than not to be realized which resulted in a reduction in goodwill of approximately $7.9 million. See Note 12, Income Taxes.
With the June 1, 2009, change in our reporting structure the following table reflects changes in the carrying amount of our goodwill by reportable segment for the fiscal year ended May 31, 2010 was as follows (in thousands):
| |
S3 Strategic Industries |
M3 Strategic Industries |
General Industries |
Consolidated Total |
||||||||||
|---|---|---|---|---|---|---|---|---|---|---|---|---|---|---|
Balance, May 31, 2009 |
$ | 201,885 | $ | 85,505 | $ | 182,884 | $ | 470,274 | ||||||
Goodwill acquired |
78,211 | — | — | 78,211 | ||||||||||
Goodwill adjustments |
(422 | ) | (178 | ) | (381 | ) | (981 | ) | ||||||
Currency translation effect |
(9,796 | ) | (3,865 | ) | (8,267 | ) | (21,928 | ) | ||||||
Balance, May 31, 2010 |
$ | 269,878 | $ | 81,462 | $ | 174,236 | $ | 525,576 | ||||||
Goodwill acquired during fiscal 2010 totaled $78.2 million related to our acquisition of Healthvision See Note 4, Business Combinations.
We recorded net adjustments of approximately $1.0 million to reduce goodwill during fiscal 2010; $0.6 million related to a correction of our lease restructuring accrual originally recorded when we acquired Intentia and $0.3 million related to the correction of certain income tax assets and liabilities originally recorded when we acquired Intentia.
In accordance with the FASB guidance related to goodwill and other intangible assets, we are required to assess the carrying amount of our goodwill for potential impairment annually or more frequently if events or a change in circumstances indicate that impairment may have occurred. We conduct our annual impairment test in the fourth quarter of each fiscal year.
Testing for goodwill impairment is a two step process. The first step screens for potential impairment and if there is an indication of possible impairment the second step must be completed to
90
LAWSON SOFTWARE, INC.
NOTES TO CONSOLIDATED FINANCIAL STATEMENTS (Continued)
2. Summary of Significant Accounting Policies (Continued)
measure the amount of impairment loss, if any. The first step of the goodwill impairment test used to identify potential impairment compares the fair value of a reporting unit with the carrying value of its net assets. In fiscal 2009 and prior years, we had only one reporting unit and therefore we compared our Company's fair value (as estimated based on our market value at year end) to the carrying value of our consolidated net assets to complete the first step of this test. If the fair value of the reporting unit had been less than the carrying value of the reporting unit, the second step of the goodwill impairment test would have been performed to measure the amount of impairment loss we would be required to record, if any. The second step, if required, would compare the implied fair value of Lawson's goodwill with the current carrying amount of our goodwill. If the implied fair value of our goodwill is less than the carrying value, an impairment charge would be recorded as a charge to our operations. The results of our annual assessment performed at the end of fiscal 2009 and 2008 did not indicate any impairment of our goodwill.
During the first quarter of fiscal 2010, with our strategic reorganization and workforce realignment, we determined that we now operate under three reportable segments: S3 Strategic Industries, M3 Strategic Industries and General Industries. See Note 14, Segment and Geographic Information, for additional information regarding our reportable segments. For purposes of our goodwill impairment testing, we have determined that we have four reporting units: S3 Strategic Industries group, M3 Strategic Industries group, the services industries component of our General Industries group and the manufacturing & distribution component of our General Industries group. Upon this change from one reporting unit to four reporting units, effective June 1, 2009, we were required to allocate our goodwill to each reporting unit based upon their relative fair values and we were required to perform a step one goodwill impairment test.
For purposes of allocating our recorded goodwill to our new reporting units, we estimated their fair values using a combination of an income approach (discounted cash flow method) and a market approach (market comparable method). Based on the results of the first step of our impairment test, the fair value exceeded the carrying value of the net assets for all of our reporting units as of June 1, 2009. Based on our year-end assessment performed in the fourth quarter of fiscal 2010, the calculated fair values of our reporting units exceeded their carrying values by amounts between approximately $23.0 million and $550.0 million, or 40.0% to 185.0% of the reporting unit carrying values, as of May 31, 2010. Accordingly, there was no impairment of our goodwill. We have no accumulated impairment charges related to our goodwill.
91
LAWSON SOFTWARE, INC.
NOTES TO CONSOLIDATED FINANCIAL STATEMENTS (Continued)
2. Summary of Significant Accounting Policies (Continued)
Acquired intangible assets subject to amortization were as follows (in thousands)
| |
May 31, 2010 | May 31, 2009 | |
|||||||||||||||||
|---|---|---|---|---|---|---|---|---|---|---|---|---|---|---|---|---|---|---|---|---|
| |
Gross Carrying Amounts | Accumulated Amortization | Net | Gross Carrying Amounts | Accumulated Amortization | Net | Estimated useful lives | |||||||||||||
Maintenance contracts |
$ | 22,940 | $ | 19,343 | $ | 3,597 | $ | 22,940 | $ | 17,511 | $ | 5,429 | Term | |||||||
Technology |
141,646 | 59,284 | 82,362 | 96,643 | 45,596 | 51,047 | 3-10 years | |||||||||||||
Client lists |
10,144 | 8,870 | 1,274 | 10,323 | 7,907 | 2,416 | 4-10 years | |||||||||||||
Customer relationships |
95,866 | 27,339 | 68,527 | 53,917 | 21,308 | 32,609 | 12-15 years | |||||||||||||
Trademarks |
8,945 | 5,141 | 3,804 | 5,263 | 5,263 | — | 2 years | |||||||||||||
Order backlog |
5,405 | 5,405 | — | 5,728 | 5,728 | — | 1 year | |||||||||||||
Non-compete agreements |
3,494 | 3,393 | 101 | 3,568 | 3,368 | 200 | 5 years | |||||||||||||
|
$ | 288,440 | $ | 128,775 | $ | 159,665 | $ | 198,382 | $ | 106,681 | $ | 91,701 | ||||||||
We amortize our intangible assets using underlying cash flow projections and accelerated and straight-line methods which approximate the proportion of future cash flows estimated to be generated in each period over the estimated useful life of the applicable asset. The balances reflected in the above table as of May 31, 2010 include the $95.5 million of intangible assets acquired in our January 2010 acquisition of Healthvision and applicable accumulated amortization. See Note 4, Business Combinations. Amortization expense for intangible assets was $24.9 million, $22.5 million and $29.4 million for fiscal years 2010, 2009 and 2008, respectively. Net intangible assets decreased in fiscal 2010 by approximately $2.4 million due to the effect of currency translation. Amortization expense is reported as a component of cost of revenues and as amortization of acquired intangibles in our Consolidated Statements of Operations.
The
estimated future annual amortization expense for identified intangible assets is as follows
(in thousands):
2011 |
$ | 29,592 | ||
2012 |
25,650 | |||
2013 |
22,200 | |||
2014 |
18,301 | |||
2015 |
21,915 | |||
Thereafter |
42,007 | |||
|
$ | 159,665 | ||
Share-Based Compensation
We account for share-based compensation in accordance with FASB guidance on share-based payments. This guidance requires us to estimate the fair value of our share-based payment awards on the date of grant using an option-pricing model. We use the Black-Scholes option-pricing model which requires the input of significant assumptions including an estimate of the average period of time employees will retain stock options before exercising them, the estimated volatility of our common stock price over the expected term and the applicable risk-free interest rate. The value of the portion
92
LAWSON SOFTWARE, INC.
NOTES TO CONSOLIDATED FINANCIAL STATEMENTS (Continued)
2. Summary of Significant Accounting Policies (Continued)
of awards that are ultimately expected to vest is recognized as expense over the requisite vesting periods in our Consolidated Statements of Operations.
The fair value of restricted stock and restricted stock unit (RSU) awards (together restricted stock awards) is estimated based on the grant date market value of our common stock. For restricted stock awards vesting based on service, compensation expense is recognized on a straight-line basis over the related service period. For restricted stock awards vesting based on obtaining certain performance targets, compensation expense is recognized over the related service period based on management's assessment of the probability of meeting such targets. In general, applicable compensation expense is recognized when we believe it is probable that the related performance targets will be met and no compensation expense is recorded, and any previously recognized expense reversed, when achievement of the performance targets is not deemed probable. Compensation expense related to our Employee Stock Purchase Plan (ESPP) is based on the 15% discount employees receive relative to the market value of our common stock at the end of the ESPP's quarterly offering periods and is recognized in the applicable quarter.
The amount of share-based compensation cost recognized during any given period is based on the value of the portion of the awards that are ultimately expected to vest. FASB guidance requires forfeitures to be estimated at the time of grant and revised, if necessary, in subsequent periods if actual forfeitures differ significantly from the original estimates. We estimate our forfeiture rate based on historic experience of our share-based plans and any adjustment to the estimated forfeiture rate results in a cumulative adjustment in the period that the estimate is changed. Ultimately, the total compensation expense recognized for any given share-based award over its vesting period will only be for those shares that actually vest.
Changes in the Black-Scholes valuation assumptions and our estimated forfeiture rate can affect the estimate of fair value of share-based compensation and the related expense recognized. The assumptions used in estimating the fair value of share-based payment awards and our estimated forfeiture rate represent management's best estimates which involve inherent uncertainties and the application of management's judgment. As a result, if factors change and different assumptions or forfeiture rates are used, our share-based compensation expense could be materially different in the future (See Note 5, Share-Based Compensation and Stock Incentive Plans).
Foreign Currency Translation
All assets and liabilities of our foreign branches and subsidiaries are translated from local currencies to U.S. Dollars at period-end exchange rates, while revenues and expenses are translated at the average exchange rate during the applicable period. The functional currency for each of our foreign branches and subsidiaries is the respective local currency with the exception of our shared service center located in Switzerland whose functional currency is the U.S. Dollar. Translation adjustments arising from the translation of net assets located in countries outside of the U.S. with functional currencies other than the U.S. Dollar are recorded as a separate component of stockholders' equity. The amounts included in our Consolidated Statements of Operations related to foreign currency transactions for fiscal 2010, 2009 and 2008 were net gains of $0.7 million, net gains of $1.0 million and net losses of $2.5 million; respectively.
93
LAWSON SOFTWARE, INC.
NOTES TO CONSOLIDATED FINANCIAL STATEMENTS (Continued)
2. Summary of Significant Accounting Policies (Continued)
Derivatives
We account for derivative instruments, consisting of foreign currency forward contracts, pursuant to the FASB guidance on accounting for derivatives instruments and hedging activities. This guidance requires us to measure derivative instruments at fair value and record them in our balance sheet as either an asset or liability. We do not use derivative instruments for trading purposes. In fiscal 2010 and prior years, we have not designated these derivative contracts as hedge transactions and have not used hedge accounting. We manage foreign currency market risk using forward contracts to offset the risk associated with the effects of certain foreign currency exposures primarily related to non-functional currency intercompany loans and advances between our international subsidiaries as well as other balance sheet accounts, particularly accounts receivable, accounts payable and certain accrual accounts. Our foreign currency forward contracts are generally short term in nature, typically maturing within 90 days or less. We revalue all contracts to their current market value at the end of each reporting period and unrealized gains and losses are included in our results of operations for that period. These gains and losses largely offset gains and losses recorded from the revaluation of our non-functional currency balance sheet exposures. We expect this to mitigate some foreign currency transaction gains or losses in future periods. Our net realized gain or loss with respect to currency fluctuations will depend on the currency exchange rates and other factors in effect as the contracts mature.
We record our foreign currency forward contracts on our Consolidated Balance Sheets as either prepaid expenses and other current assets or other current liabilities depending on whether the net fair value of such contracts is a net asset or net liability, respectively. All gains and losses from foreign currency forward contracts have been classified as general and administrative expense in our Consolidated Statements of Operations. See Fair Value Measurements, below, for more detail. We have recorded the following net fair values of our foreign currency forward contracts and the related net realized and unrealized gains and losses as of and for the periods indicated (in thousands):
| |
Net Asset | Net Liability | ||||||||||||
|---|---|---|---|---|---|---|---|---|---|---|---|---|---|---|
| |
Prepaid expenses and other current assets |
Other current liabilities | ||||||||||||
| |
May 31, 2010 | May 31, 2009 | May 31, 2010 | May 31, 2009 | ||||||||||
Fair values of derivatives not designated as hedging instruments: |
||||||||||||||
Foreign currency forward contracts |
$ | 6,527 | $ | — | $ | — | $ | 547 | ||||||
| |
Years Ended May 31, | |
|
|||||||||||
| |
2010 | 2009 | |
|
||||||||||
Gain (loss) recognized for derivatives not designated as hedging instruments: |
||||||||||||||
Foreign currency forward contracts |
$ | 8,338 | $ | 8,538 | ||||||||||
94
LAWSON SOFTWARE, INC.
NOTES TO CONSOLIDATED FINANCIAL STATEMENTS (Continued)
2. Summary of Significant Accounting Policies (Continued)
Fair Value Measurements
As previously discussed, effective June 1, 2008, we adopted the FASB guidance on financial assets and liabilities and nonfinancial assets and liabilities that are recognized at fair value on a recurring basis. We adopted this guidance for non-financial asset and liabilities that are recognized at fair value on a nonrecurring basis effective June 1, 2009. This guidance defines fair value, establishes a framework for measuring fair value and expands disclosures about fair value measurements. Fair value is defined as an "exit price" which represents the amount that would be received to sell an asset or paid to transfer a liability in an orderly transaction between market participants as of the measurement date. As such, fair value is a market-based measurement that should be determined based on assumptions that market participants would use in valuing an asset or liability. The above mentioned guidance also requires the use of valuation techniques to measure fair values that maximize the use of observable inputs and minimize the use of unobservable inputs. As a basis for considering such assumptions and inputs, the guidance establishes a fair value hierarchy which identifies and prioritizes three levels of inputs to be used in measuring fair value.
The three levels of the fair value hierarchy are as follows:
| Level 1 | — | Observable inputs such as quoted prices (unadjusted) in active markets for identical assets or liabilities. | ||
Level 2 |
— |
Inputs other than the quoted prices in active markets that are observable either directly or indirectly including: quoted prices for similar assets and liabilities in active markets; quoted prices for identical or similar assets and liabilities in markets that are not active; or other inputs that are observable or can be corroborated by observable market data. |
||
Level 3 |
— |
Unobservable inputs that are supported by little or no market data and require the reporting entity to develop its own assumptions. |
We measure certain financial assets and liabilities at fair value including our cash equivalents and foreign currency forward contracts. The following table summarizes the fair value of our financial assets and liabilities that were accounted for at fair value on a recurring basis as of May 31, 2010 and 2009 (in thousands):
| |
Fiscal 2010 | ||||||||||||||
|---|---|---|---|---|---|---|---|---|---|---|---|---|---|---|---|
| |
Fair Value Measurements Using Inputs Considered as |
|
|||||||||||||
| |
Fair Value at May 31, 2010 |
||||||||||||||
| |
Level 1 | Level 2 | Level 3 | ||||||||||||
Assets |
|||||||||||||||
Cash equivalents |
$ | — | $ | 198,445 | $ | — | $ | 198,445 | |||||||
Foreign currency forward contracts |
— | 6,974 | — | 6,974 | |||||||||||
Total |
$ | — | $ | 205,419 | $ | — | $ | 205,419 | |||||||
Liabilities |
|||||||||||||||
Foreign currency forward contracts |
$ | — | $ | 447 | $ | — | $ | 447 | |||||||
Total |
$ | — | $ | 447 | $ | — | $ | 447 | |||||||
95
LAWSON SOFTWARE, INC.
NOTES TO CONSOLIDATED FINANCIAL STATEMENTS (Continued)
2. Summary of Significant Accounting Policies (Continued)
| |
Fiscal 2009 | ||||||||||||||
|---|---|---|---|---|---|---|---|---|---|---|---|---|---|---|---|
| |
Fair Value Measurements Using Inputs Considered as |
|
|||||||||||||
| |
Fair Value at May 31, 2009 |
||||||||||||||
| |
Level 1 | Level 2 | Level 3 | ||||||||||||
Assets |
|||||||||||||||
Cash equivalents |
$ | 100,051 | $ | 122,054 | $ | — | $ | 222,105 | |||||||
Foreign currency forward contracts |
— | 64 | — | 64 | |||||||||||
Total |
$ | 100,051 | $ | 122,118 | $ | — | $ | 222,169 | |||||||
Liabilities |
|||||||||||||||
Foreign currency forward contracts |
$ | — | $ | 593 | $ | — | $ | 593 | |||||||
Total |
$ | — | $ | 593 | $ | — | $ | 593 | |||||||
Cash equivalents, primarily funds held in money market instruments, are reported at their current carrying value which approximates fair value due to the short-term nature of these instruments and are included in cash and cash equivalents in our Consolidated Balance Sheets. Our investments in treasuries are valued using quoted market prices and are included in Level 1 inputs. Our money market instruments are valued primarily using observable inputs other than quoted market prices and are included in Level 2 inputs.
Foreign currency forward contracts are valued based on observable market spot and forward rates as of our reporting date and are included in Level 2 inputs in the above table. All contracts are recorded at fair value and marked-to-market values at the end of each reporting period and realized and unrealized gains and losses are included in general and administrative expenses in our Consolidated Statements of Operations.
We have had no transfers of assets/liabilities into or out of Levels 1 and 2 during fiscal 2010.
In addition to the financial assets and liabilities included in the above table, certain of our nonfinancial assets and liabilities are to be measured at fair value on a nonrecurring basis in accordance with applicable U.S. GAAP. This includes items such as nonfinancial assets and liabilities initially measured at fair value in a business combination (but not measured at fair value in subsequent periods) and nonfinancial long-lived asset groups measured at fair value for an impairment assessment. In general, nonfinancial assets including goodwill, other intangible assets and property and equipment are measured at fair value when there is an indication of impairment and are recorded at fair value only when any impairment is recognized. As of May 31, 2010 we had not recorded any impairment related to such assets. In fiscal 2010 we wrote-off $1.1 million in previously capitalized costs related to internally developed software. We had no other material nonfinancial assets or liabilities requiring adjustments or write-downs to their current fair value.
We did not elect to apply the FASB guidance related to the fair value option for financial assets and liabilities to any of our currently eligible financial assets or liabilities. As of May 31, 2010 our material financial assets and liabilities not carried at fair value include our trade accounts receivable and accounts payable which are reported at their current carrying values which we believe approximate their fair values.
96
LAWSON SOFTWARE, INC.
NOTES TO CONSOLIDATED FINANCIAL STATEMENTS (Continued)
2. Summary of Significant Accounting Policies (Continued)
Comprehensive Income (Loss)
We report comprehensive income (loss) in accordance with the provisions of FASB guidance related to comprehensive income. In addition to net income (loss), comprehensive income (loss) includes other items such as foreign currency translation adjustments, unrealized actuarial gains and losses related to our defined benefit pension plans and unrealized gains and losses on certain marketable securities and investments. We report accumulated other comprehensive income as a separate line item in the stockholders' equity section of our Consolidated Balance Sheets and the components are detailed in our Consolidated Statements of Stockholders' Equity as comprehensive income (loss).
The following table summarizes the components of comprehensive income (loss) (in thousands):
| |
Years Ended May 31, | |||||||||||
|---|---|---|---|---|---|---|---|---|---|---|---|---|
| |
2010 | 2009 | 2008 | |||||||||
| |
|
(as adjusted) |
(as adjusted) |
|||||||||
Net income(1) |
$ | 13,024 | $ | 14,191 | $ | 9,322 | ||||||
Other comprehensive income (loss) |
||||||||||||
Unrealized gain (loss) on investments(2) |
5 | (18 | ) | 25 | ||||||||
Pension-unrealized actuarial gain (loss) |
(510 | ) | 2,934 | — | ||||||||
Foreign currency translation adjustment |
(25,674 | ) | (65,307 | ) | 61,573 | |||||||
Total other comprehensive income (loss) |
(26,179 | ) | (62,391 | ) | 61,598 | |||||||
Comprehensive income (loss) |
$ | (13,155 | ) | $ | (48,200 | ) | $ | 70,920 | ||||
- (1)
- Adjusted
to reflect adoption of the FASB guidance on accounting for convertible debt securities.
- (2)
- The unrealized gain (loss) on investments in the above table are net of taxes (tax benefit) of $3, $(11) and $16 for fiscal 2010, 2009 and 2008, respectively.
Total accumulated other comprehensive income and its components for the periods presented were as follows (in thousands):
| |
May 31, 2010 | May 31, 2009 | |||||
|---|---|---|---|---|---|---|---|
Foreign currency translation adjustment |
$ | 6,550 | $ | 32,224 | |||
Pension-unrealized actuarial gain |
2,424 | 2,934 | |||||
Unrealized gain (loss) on investments |
— | (5 | ) | ||||
Accumulated other comprehensive income |
$ | 8,974 | $ | 35,153 | |||
Per Share Data
We compute net income per share in accordance with the FASB guidance on earnings per share. Under this guidance, basic net income per share is computed by dividing net income by the weighted average number of common shares outstanding during the applicable period. Diluted net income per share is computed by dividing net income by the sum of the weighted average number of common shares outstanding plus the weighted average of dilutive shares outstanding during the period. In
97
LAWSON SOFTWARE, INC.
NOTES TO CONSOLIDATED FINANCIAL STATEMENTS (Continued)
2. Summary of Significant Accounting Policies (Continued)
addition, in periods of net loss, all potentially dilutive common shares are excluded from our computation of diluted weighted average shares outstanding, as their inclusion would have an anti-dilutive effect on net loss per share. We use the treasury stock method to calculate the weighted average dilutive shares related to "in-the-money" stock options and warrants, unvested restricted stock awards and shares issuable under our employee stock purchase plan. The dilutive effect of our senior convertible notes is calculated based on the average market price of our common stock during the applicable period and the senior convertible notes' conversion price. The senior convertible notes are excluded from our computation of diluted earnings per share when the per share conversion price is greater than the average market price of our common stock during the applicable periods.
The following table sets forth the computation of basic and diluted net income (loss) per share (in thousands, except per share amounts):
| |
Years Ended May 31, | ||||||||||||
|---|---|---|---|---|---|---|---|---|---|---|---|---|---|
| |
2010 | 2009 | 2008 | ||||||||||
| |
|
(as adjusted) |
(as adjusted) |
||||||||||
Basic net income per share computation: |
|||||||||||||
Net income(1) |
$ | 13,024 | $ | 14,191 | $ | 9,322 | |||||||
Weighted average common shares—basic |
161,442 | 164,011 | 177,283 | ||||||||||
Basic net income per share |
$ | 0.08 | $ | 0.09 | $ | 0.05 | |||||||
Diluted net income per share computation: |
|||||||||||||
Net income(1) |
$ | 13,024 | $ | 14,191 | $ | 9,322 | |||||||
Diluted weighted average shares calculation: |
|||||||||||||
Weighted average common shares |
161,442 | 164,011 | 177,283 | ||||||||||
Net dilutive effect of: |
|||||||||||||
Stock options |
1,977 | 1,781 | 3,007 | ||||||||||
Restricted stock awards |
1,818 | 577 | 274 | ||||||||||
ESPP shares |
14 | 24 | 16 | ||||||||||
Weighted average common shares—diluted |
165,251 | 166,393 | 180,580 | ||||||||||
Diluted net income per share |
$ | 0.08 | $ | 0.08 | $ | 0.05 | |||||||
- (1)
- Adjusted to reflect adoption of the FASB guidance on accounting for convertible debt securities.
Potentially dilutive shares of common stock related to share-based payments and warrants are excluded from the diluted net income per share computations when their exercise prices are greater than the average market price of our common stock during the applicable periods as their inclusion would be anti-dilutive.
98
LAWSON SOFTWARE, INC.
NOTES TO CONSOLIDATED FINANCIAL STATEMENTS (Continued)
2. Summary of Significant Accounting Policies (Continued)
The following table sets forth potentially dilutive weighted average shares which were excluded from our computation of diluted net income per share because their inclusion would have been anti-dilutive (in thousands):
| |
Years Ended May 31, | ||||||||||
|---|---|---|---|---|---|---|---|---|---|---|---|
| |
2010 | 2009 | 2008 | ||||||||
Stock options |
6,572 | 10,926 | 4,917 | ||||||||
Warrants |
— | 7,114 | 19,975 | ||||||||
Restricted stock awards |
1 | 12 | 254 | ||||||||
ESPP shares |
— | — | — | ||||||||
Total potentially dilutive shares |
6,573 | 18,052 | 25,146 | ||||||||
Recent Accounting Pronouncements
In June 2009, the FASB issued guidance which amends the consolidation guidance applicable to variable interest entities (VIE's). This guidance clarifies the determination of whether a company is required to consolidate a VIE, changes the approach to determining a VIE's primary beneficiary (the reporting entity that must consolidate the VIE), requires an ongoing reassessment of whether a company is the primary beneficiary of a VIE and requires additional disclosures about a company's involvement in VIE's. This guidance is effective for fiscal years beginning after November 15, 2009 (our fiscal 2011). We are currently evaluating how this may affect our accounting for VIE's but we do not expect it to have a material impact on our financial position, results of operations or cash flows.
In October 2009, the FASB issued guidance which amends the existing guidance for revenue recognition of non-software elements of multiple element arrangements. Under the new guidance, when vendor-specific objective evidence or third party evidence for deliverables in an arrangement cannot be determined, companies will be required to develop a best estimate of the selling price to separate deliverables and allocate arrangement consideration based on the relative selling price method. The residual method of allocating arrangement consideration will no longer be permitted. This guidance is effective for fiscal years beginning on or after June 15, 2010 (our fiscal 2012), however early adoption is permitted. We are currently evaluating how this may affect our accounting for multiple element arrangements but we do not expect it to have a material impact on our financial position, results of operations or cash flows.
In January 2010, the FASB issued guidance that expands the interim and annual disclosure requirements of fair value measurements, including the information about transfers into and out of Levels 1 and 2 of the three-tier fair value hierarchy established under the FASB's fair value measurement guidance. This guidance also requires separate disclosure for purchases, sales, issuances and settlements relating to Level 3 measurements. Except for the detailed disclosures related to the Level 3 reconciliation, which is effective for the fiscal years beginning after December 15, 2010 (our fiscal 2011), all the other disclosures under this guidance became effective during the fourth quarter of fiscal 2010. The adoption of the applicable portions of this guidance did not have a material impact on our financial position, results of operations or cash flows during fiscal 2010 and we do not expect the adoption of the guidance related to Level 3 disclosures will have a material impact on our future financial position, results of operations or cash flows.
99
LAWSON SOFTWARE, INC.
NOTES TO CONSOLIDATED FINANCIAL STATEMENTS (Continued)
3. Restructuring
We recorded restructuring charges of $13.2 million and $20.0 million during fiscal 2010 and 2009, respectively. During fiscal 2008 we recorded a net restructuring accrual reversal of $0.7 million. The fiscal 2008 reduction related to adjustments to the original estimates established in fiscal 2007. The following table sets forth the reserve activity related to our restructuring plans for the fiscal years indicated and the remaining reserve balances for severance and related benefits and exited leased facilities, which are included in accrued compensation and benefits and other current liabilities, respectively, in our Consolidated Balance Sheets as of May 31, 2010 and 2009 (in thousands):
| |
Restructuring Actions | ||||||||||||||||
|---|---|---|---|---|---|---|---|---|---|---|---|---|---|---|---|---|---|
| |
Total | Fiscal 2010 |
Fiscal 2009 |
Fiscal 2007 |
Fiscal 2006 |
||||||||||||
Balance, May 31, 2007 |
$ | 24,294 | $ | — | $ | — | $ | 10,474 | $ | 13,820 | |||||||
Cash payments |
(8,805 | ) | — | — | (5,443 | ) | (3,362 | ) | |||||||||
Adjustments to provision |
(731 | ) | — | — | (237 | ) | (494 | ) | |||||||||
Adjustments to provision—goodwill |
(4,431 | ) | — | — | — | (4,431 | ) | ||||||||||
Currency translation effect |
1,271 | — | — | (99 | ) | 1,370 | |||||||||||
Balance, May 31, 2008 |
11,598 | — | — | 4,695 | 6,903 | ||||||||||||
Provision for restructuring |
20,372 | — | 20,372 | — | — | ||||||||||||
Cash payments |
(13,517 | ) | — | (8,691 | ) | (3,599 | ) | (1,227 | ) | ||||||||
Adjustments to provision |
(418 | ) | — | (162 | ) | (204 | ) | (52 | ) | ||||||||
Adjustments to provision—goodwill |
(1,612 | ) | — | — | — | (1,612 | ) | ||||||||||
Currency translation effect |
(642 | ) | — | 478 | (110 | ) | (1,010 | ) | |||||||||
Balance, May 31, 2009 |
15,781 | — | 11,997 | 782 | 3,002 | ||||||||||||
Provision for restructuring |
11,659 | 11,659 | — | — | — | ||||||||||||
Cash payments |
(13,282 | ) | (2,929 | ) | (8,907 | ) | (633 | ) | (813 | ) | |||||||
Adjustments to provision |
1,495 | (241 | ) | 443 | (167 | ) | 1,460 | ||||||||||
Adjustments to provision—goodwill |
(606 | ) | — | — | — | (606 | ) | ||||||||||
Currency translation effect |
(273 | ) | (352 | ) | 189 | 18 | (128 | ) | |||||||||
Balance, May 31, 2010 |
$ | 14,774 | $ | 8,137 | $ | 3,722 | $ | — | $ | 2,915 | |||||||
Fiscal 2010 Restructurings
Fiscal 2010 Q2. On September 30, 2009, we approved a plan to further restructure our workforce. Under this plan, we reduced our workforce by approximately 65 employees. The majority of the reductions occurred within our consulting practice in our EMEA region. These actions were undertaken as a further refinement of our new vertical organization, including a resizing of our services business to leverage our partner channel, and in light of current demand for our consulting and implementation services in EMEA. The majority of the actions related to this plan were completed by the end of the second quarter of fiscal 2010. The restructuring action resulted in pre-tax charges of $4.6 million for severance pay and related benefits which we recorded in the second quarter of fiscal 2010. Substantially all of this amount will result in future cash expenditures. We expect that the majority of the remaining severance and related benefits will be paid by the third quarter of fiscal 2011.
Fiscal 2010 Q4. On May 27, 2010, we approved and began implementing a plan to restructure our workforce including the elimination of approximately 160 employees. The workforce reduction relates
100
LAWSON SOFTWARE, INC.
NOTES TO CONSOLIDATED FINANCIAL STATEMENTS (Continued)
3. Restructuring (Continued)
primarily to our M3 operations in Europe, the United States and Manila within our M3 Strategic Industries and General Industries business segments. Departures of affected personnel are expected to be substantially completed by the end of the first quarter of fiscal 2011. In connection with these actions we recorded pre-tax charges of $7.1 million in the fourth quarter of fiscal 2010 for severance pay and related benefits; substantially all of which will result in future cash expenditures. The majority of the severance and related benefits will be paid by the end of fiscal 2011.
In relation to the fiscal 2010 restructuring actions, we made cash payments of approximately $2.9 million for severance pay and related benefits during the year. In addition, we recorded a $0.2 million net reduction in the second quarter of fiscal 2010 accrual primarily as a result of a reduction in the number of affected employees.
Fiscal 2009 Restructurings
Fiscal 2009 Q2. On November 18, 2008, we announced the implementation of cost reduction measures in light of the uncertainty in global economic conditions and in light of other operating margin improvement initiatives. These cost reduction initiatives included a restructuring plan resulting in the reduction of approximately 285 employees and exiting certain leased facilities. In relation to these actions we recorded a pre-tax charge of approximately $7.9 million in the second quarter of fiscal 2009 and an additional $3.4 million in the third quarter of fiscal 2009. Actions related to severance were substantially completed by February 28, 2009, with related cash payments expected to continue through August 2010. Payments related to the exited facilities are expected to continue through November 2011.
Fiscal 2009 Q4. On May 18, 2009, we initiated a plan to restructure our workforce in preparation for the fiscal 2010 vertical realignment of our organization. The restructuring involved the reduction of our workforce by approximately 150 employees and the consolidation of space in certain of our leased facilities. Actions related to this plan were completed by the end of our third quarter of fiscal 2010. The plan resulted in pre-tax charges of approximately $5.3 million for severance and related benefits and the consolidation of leased facilities resulted in pre-tax charges of approximately $3.8 million which we recorded in the fourth quarter of fiscal 2009. We expect the majority of the severance and related benefits to continue through September 2010 while the leased facilities costs will be paid through December 2011.
In relation to the fiscal 2009 restructuring actions, we made cash payments of $5.8 million relating to severance and related benefits and $3.1 million related to the exited facilities during fiscal 2010. In addition, we recorded net adjustments to the accruals of approximately $0.4 million including additional expenses accrued related to exited leased facilities net of a change to accrued severance and related benefits due to a reduction in the number of affected employees. As of May 31, 2010, we had an accrual of $3.7 million: $0.7 million for severance and related benefits and $3.0 million for the estimated fair value of our liability for the exited facilities. As of May 31, 2009, the accrual totaled $12.0 million: $6.5 million for severance and related benefits and $5.5 million for the exited facilities.
101
LAWSON SOFTWARE, INC.
NOTES TO CONSOLIDATED FINANCIAL STATEMENTS (Continued)
3. Restructuring (Continued)
Fiscal 2007 Restructuring
On February 28, 2007, we restructured our workforce by approximately 250 employees to rebalance our resources between various locations primarily in the U.S., Europe and our global support center in the Philippines. This reduction resulted in a pre-tax charge of $11.9 million which we recorded in the third quarter of fiscal 2007. As of May 31, 2009 we had an accrual of $0.8 million for severance and related benefits. In fiscal 2010 we paid severance and related benefits of $0.6 million and we recorded $0.2 million in adjustments to eliminate the remaining accrual.
Fiscal 2006 Restructuring
On April 26, 2006, in conjunction with our business combination with Intentia International AB (Intentia), we approved a plan designed to eliminate employee redundancies in both Intentia and Legacy Lawson. These actions included the reduction of approximately 185 employees and the exit of or reduction in leased space. As of May 31, 2009, we had an accrual of $3.0 million for the exit or reduction of leased facilities. In fiscal 2010 we made cash payments of $0.8 million related to exited facilities. During the second and fourth quarters of fiscal 2010, we made adjustments to reduce lease exit costs of approximately $0.6 million for changes in estimates relating to the original lease restructuring plan. These adjustments resulted in a reduction of acquired goodwill. In addition, we recorded a $1.5 million increase in our lease accrual in the third quarter of fiscal 2010 as a result of an early exit by a subtenant. The remaining accrual as of May 31, 2010 was $2.9 million for the exit of or reduction in leased space. Actions relating to severance were completed in the third quarter of fiscal 2008. We expect cash payments related to exited facilities or reduced space to continue through June 2012.
As a result of our restructuring plans and the realignment of our workforce, we have experienced cost savings from the lower facility expenses and reduced headcount and expect these savings to continue.
4. Business Combinations
Healthvision
On January 11, 2010, we completed our acquisition of Healthvision through the acquisition of all the outstanding stock of privately held Quovadx Holdings, Inc., Healthvision's parent holding company. Healthvision is a Dallas-based company providing integration and application technology and related services to hospitals and large healthcare organizations. We believe the acquisition of Healthvision is a strategic fit for our S3 Strategic Industries segment. The results of operations of Healthvision have been included in our Consolidated Statements of Operations from the date of acquisition. Healthvision contributed revenues of $15.3 million in fiscal 2010 related to their operations from January 11, 2010 through May 31, 2010.
The cash purchase consideration totaled approximately $160.0 million in cash, net of approximately $10.4 million of acquired cash. We funded the purchase price from our available cash. We used the acquisition method to account for the acquisition in accordance with the FASB guidance on accounting for business combinations. Under the acquisition method, the purchase price was allocated to, and we recognized the fair values of, Healthvision's tangible and intangible assets acquired and liabilities assumed. The excess of the purchase price over the fair value of the net tangible and identifiable
102
LAWSON SOFTWARE, INC.
NOTES TO CONSOLIDATED FINANCIAL STATEMENTS (Continued)
4. Business Combinations (Continued)
intangible assets acquired has been recorded as goodwill. See Note 2, Summary of Significant Accounting Policies—Goodwill and Other Intangible Assets. We believe the goodwill arises from the benefits we expect to achieve from the additional revenue potential provided by our expanded product offerings and increased access to customers in our healthcare vertical within our S3 Strategic Industries segment.
Transaction and merger related integration costs of $0.5 million and $1.1 million, respectively, associated with Healthvision have been expensed as incurred and are reflected in our results of operations for fiscal 2010 in general and administrative expenses. These integration costs include approximately $0.4 million of severance and related benefits resulting from the elimination of certain positions that became redundant in the integration of Healthvision's operations. A majority of the affected employees will be working through the transition of their responsibilities and will be terminated during the next nine months.
We are responsible for determining the fair values of the acquired assets and liabilities. These fair values of the acquired assets and liabilities were based on our estimates as of the acquisition date of January 11, 2010 and were based on a number of factors, including valuations. Identified intangible assets acquired included existing technology, existing customer relationships and trade names. We used variations of the income approach method to value the intangible assets. Under these methods, fair value is estimated based upon the present value of cash flows that the applicable asset is expected to generate. The valuation of the existing technology and trade names were based on the relief-from-royalty method, and existing customer relationships were valued using the excess earnings method. The royalty rates used in the relief from royalty method were based on both a return-on-asset method and market comparable rates.
The following table summarizes our allocation of the Healthvision purchase consideration (in thousands):
Accounts receivable, net |
$ | 19,270 | ||||
Identified intangible assets: |
||||||
Existing technology |
45,500 | |||||
Existing customer relationships |
46,000 | |||||
Trade names |
4,000 | |||||
Goodwill |
78,211 | |||||
Deferred revenue |
(9,924 | ) | ||||
Deferred tax liabilities, net |
(20,888 | ) | ||||
All other net tangible assets (liabilities), net of cash acquired |
(2,169 | ) | ||||
Total fair value of purchase consideration |
$ | 160,000 | ||||
We expect that $6.1 million of the goodwill we acquired will be deductible for income tax purposes.
The following unaudited pro forma financial information is based on historical financial information of Lawson and Healthvision giving effect to the acquisition as if it had occurred at the beginning of the fiscal year for each period presented and applying certain assumptions and pro forma adjustments. These pro forma adjustments primarily relate to the amortization of acquired intangibles, recognition of deferred revenues, interest income, interest expense and the estimated impact on our
103
LAWSON SOFTWARE, INC.
NOTES TO CONSOLIDATED FINANCIAL STATEMENTS (Continued)
4. Business Combinations (Continued)
income tax provision. We believe that the assumptions used and the adjustments made are reasonable given the information available to us as of the date of this Annual Report on Form 10-K. This pro forma financial information is presented for illustrative purposes only and is not necessarily indicative of the operating results that would have been achieved had the acquisition occurred at such earlier times or of the results that may be achieved in the future. In addition, these pro forma financial statements do not reflect the realization of any cost savings that we may achieve from operating efficiencies, synergies or other restructuring activities that may result from the acquisition.
The following table summarizes the unaudited pro forma financial information of the combined Lawson and Healthvision as if the acquisition closed at the beginning of the fiscal year for each period presented (in thousands, except per share data):
| |
Years Ended May 31, | |||||||||
|---|---|---|---|---|---|---|---|---|---|---|
(unaudited)
|
2010 | 2009 | 2008 | |||||||
Total revenues |
$ | 774,701 | $ | 814,814 | $ | 883,080 | ||||
Net income |
$ | 16,609 | $ | 18,793 | $ | 11,851 | ||||
Net income per share—basic |
$ | 0.10 | $ | 0.11 | $ | 0.07 | ||||
Net income per share—diluted |
$ | 0.10 | $ | 0.11 | $ | 0.07 | ||||
VasTech
On March 3, 2008, we acquired all the outstanding stock of Visual Advance Systems Technology (VasTech), a provider of workforce management software and services based in Annapolis, Maryland for $13.1 million. With this acquisition, we are now offering our customers, primarily in the healthcare and hospitality industries, an advanced workforce management staffing and scheduling solution to complement our Lawson Human Capital Management offerings. The total cost of the acquisition included direct transaction costs of approximately $0.1 million. The purchase price in excess of the $1.7 million fair value of net tangible assets acquired was allocated $7.7 million to amortizable intangible assets and $4.3 million to goodwill. In addition, we recorded deferred revenue of $0.6 million as of the effective date of this transaction. The amortizable intangible assets included existing technology of $3.3 million, to be amortized over a five year period and customer relationships of $4.4 million, to be amortized over an eight year period. The goodwill we recorded is expected to be deductible for tax purposes. The results of operations of VasTech are included in our Consolidated Statements of Operations from the date of the acquisition.
PLM
On March 17, 2008, we acquired the Product Lifecycle Management (PLM) software division of San Francisco-based Freeborders® for $4.1 million. The addition of PLM capabilities to our portfolio of enterprise software offerings will help our customers in the fashion industry establish processes that we believe will enable them to cut the lead time from product concept to production to actual delivery to the retail store shelf. The total cost of the acquisition included approximately $0.1 million in transaction costs. The excess of the purchase price over the fair value of net tangible assets acquired was allocated $1.9 million to amortizable intangible assets, $2.8 million to goodwill and $0.6 million to deferred revenue. The amortizable intangible assets included existing technology of $1.1 million, to be amortized over a four year period and customer relationships of $0.8 million, to be amortized over a six year
104
LAWSON SOFTWARE, INC.
NOTES TO CONSOLIDATED FINANCIAL STATEMENTS (Continued)
4. Business Combinations (Continued)
period. The goodwill related to this acquisition is expected to be deductible for tax purposes. The results of operations of PLM are included in our Consolidated Statements of Operations from the date of the acquisition.
5. Share-Based Compensation and Stock Incentive Plans
Share-Based Compensation
We account for share-based compensation in accordance with the FASB guidance on share based payments, under which our share-based employee compensation cost is recognized using the fair value based method for all new awards granted after our adoption date of June 1, 2006 and unvested awards that were outstanding at June 1, 2006. We elected the modified-prospective method of adopting FASB guidance, under which prior periods were not retroactively restated.
The applicable FASB guidance requires us to estimate the fair value of our share-based payment awards on the date of grant using an option-pricing model. We use the Black-Scholes option-pricing model which requires the input of significant assumptions including an estimate of the average period of time employees will retain stock options before exercising them, the estimated volatility of our common stock price over the expected term and the applicable risk-free interest rate. Changes in these assumptions can materially affect the estimated fair value of our share-based compensation and, consequently, the related expense recognized. The value of the portion of awards that are ultimately expected to vest is recognized as expense over the requisite vesting periods in our Consolidated Statements of Operations.
The following table presents the weighted average fair value of options granted to employees and the related assumptions we used in the Black-Scholes option pricing model for the periods presented:
| |
Years Ended May 31, | ||||||||||
|---|---|---|---|---|---|---|---|---|---|---|---|
| |
2010 | 2009 | 2008 | ||||||||
Fair value of options granted (in thousands) |
$ | 6,428 | $ | 3,672 | $ | 5,452 | |||||
Weighted average per share fair value of options granted |
$ | 2.57 | $ | 1.43 | $ | 3.40 | |||||
Assumptions used for estimating fair value of option grants: |
|||||||||||
Expected term (years) |
4.3 | 4.2 | 4.2 | ||||||||
Risk-free interest rate |
2.5 | % | 2.5 | % | 3.5 | % | |||||
Volatility |
46.7 | % | 39.1 | % | 38.2 | % | |||||
Dividend yield |
— | — | — | ||||||||
- (1)
- Expected term: We calculate expected term based on historical observations and expectations of future
employee stock option behavior.
- (2)
- Risk-free interest rate: This rate is based on the U.S. Treasury zero-coupon yield
curve on the grant date for a maturity that correlates to the expected term of the options. For fiscal 2010 the range was 2.28% to 2.58%.
- (3)
- Volatility: We currently use historic volatility using a look-back period equal to the options' expected terms.
105
LAWSON SOFTWARE, INC.
NOTES TO CONSOLIDATED FINANCIAL STATEMENTS (Continued)
5. Share-Based Compensation and Stock Incentive Plans (Continued)
- (4)
- Dividend yield: We have not historically paid dividends and do not expect to issue dividends for the foreseeable future.
The amount of share-based compensation expense recognized in our Consolidated Statements of Operations for fiscal 2010, 2009 and 2008 included compensation expense for share-based payment awards granted on or prior to June 1, 2006 but not yet vested as of that date. Prior to June 1, 2006, we accounted for these awards using the intrinsic value method in accordance with the provisions of APB 25. Share-based employee compensation costs have been recognized using the fair value based method for all new awards granted after June 1, 2006. Compensation costs for unvested stock options and non-vested awards that were outstanding at June 1, 2006 were recognized over the requisite service periods based on the grant-date fair value of those options and awards as previously calculated for pro forma disclosures using the Black-Scholes option-pricing model.
In addition, FASB guidance for share based payments requires forfeitures to be estimated at the time of grant and revised, if necessary, in subsequent periods if actual forfeitures differ from those estimates. As a result, share-based compensation expense recognized in our Consolidated Statements of Operations for fiscal 2010, 2009 and 2008 was based on awards ultimately expected to vest. Our estimated forfeiture rate was calculated based on actual historical forfeitures experienced under our stock incentive plans. Changes to the forfeiture rate are accounted for in the period of such change. In the third quarter of fiscal 2008, we performed our periodic review of our estimated forfeiture rate and based on turnover during the previous twelve months, we adjusted our forfeiture rate from 6.1% to 17.4%. This change in estimated forfeiture rate resulted in a $0.7 million decrease in share-based compensation expense for fiscal 2008. In the third quarter of fiscal 2010 and 2009 we adjusted our forfeiture rate to 16.3% and 17.0%, respectively, which had a nominal effect on our share-based compensation expense in both years.
The following table presents share-based compensation expense recognized in our Consolidated Statements of Operations, by category, for the periods indicated (in thousands):
| |
Years Ended May 31, | ||||||||||
|---|---|---|---|---|---|---|---|---|---|---|---|
| |
2010 | 2009 | 2008 | ||||||||
Cost of revenues |
$ | 4,644 | $ | 1,032 | $ | 740 | |||||
Research and development |
1,032 | 634 | 452 | ||||||||
Sales and marketing |
6,759 | 1,617 | 1,105 | ||||||||
General and administrative |
4,593 | 5,236 | 4,446 | ||||||||
Stock-based compensation expense, before income tax |
17,028 | 8,519 | 6,743 | ||||||||
Income tax benefit |
(6,571 | ) | (3,279 | ) | (2,596 | ) | |||||
Stock-based compensation expense, net of tax |
$ | 10,457 | $ | 5,240 | $ | 4,147 | |||||
106
LAWSON SOFTWARE, INC.
NOTES TO CONSOLIDATED FINANCIAL STATEMENTS (Continued)
5. Share-Based Compensation and Stock Incentive Plans (Continued)
As of May 31, 2010, we had the following unrecognized share-based compensation which we expect to recognize over the weighted average periods indicated (in thousands):
| |
Outstanding Stock Options |
Restricted Stock Awards |
|||||
|---|---|---|---|---|---|---|---|
Unrecognized compensation expense |
$ | 8,580 | $ | 17,354 | |||
Recognition period |
1.32 years | 1.65 years | |||||
Stock Incentive Plans
Our 1996 Stock Incentive Plan (1996 Plan) provides for the granting of non-qualified stock options, restricted stock units, performance awards and other share-based awards. There are 27.7 million shares of our common stock reserved for issuance under the plan. As of May 31, 2010, there were 4.7 million awards outstanding under the 1996 Plan and approximately 1.1 million shares were available for future grant. Our 2001 Stock Incentive Plan (2001 Plan) provides for the granting of incentive stock options, non-qualified stock options, restricted stock or restricted stock units. There are 35.0 million shares of our common stock reserved for issuance under the 2001 Plan. As of May 31, 2010, there were 7.7 million awards outstanding under the 2001 Plan and 15.1 million shares were available for future grant.
Stock Options
The stock options we grant to our employees generally vest over a four-year to six-year period, are subject to acceleration under certain circumstances and expire seven to ten years from the date of grant. Option awards are granted with exercise prices equal to the fair market value of our common stock at the date of grant. Newly issued shares are used in settlement of stock option exercises.
107
LAWSON SOFTWARE, INC.
NOTES TO CONSOLIDATED FINANCIAL STATEMENTS (Continued)
5. Share-Based Compensation and Stock Incentive Plans (Continued)
The following table summarizes stock option activity for fiscal 2010, 2009 and 2008 (in thousands) and weighted average exercise prices and remaining contractual life (in years):
| |
Options Outstanding |
Weighted Average Exercise Price |
Weighted Average Remaining Life |
||||||||
|---|---|---|---|---|---|---|---|---|---|---|---|
Outstanding, May 31, 2007 |
12,463 | $ | 5.57 | ||||||||
Expired/forfeited/cancelled |
(316 | ) | 7.72 | ||||||||
Granted at fair market value |
1,605 | 9.56 | |||||||||
Exercised |
(1,672 | ) | 4.10 | ||||||||
Outstanding, May 31, 2008 |
12,080 | 6.25 | |||||||||
Expired/forfeited/cancelled |
(834 | ) | 7.35 | ||||||||
Granted at fair market value |
2,563 | 4.50 | |||||||||
Exercised |
(826 | ) | 3.07 | ||||||||
Outstanding, May 31, 2009 |
12,983 | 6.03 | |||||||||
Expired/forfeited/cancelled |
(1,256 | ) | 6.27 | ||||||||
Granted at fair market value |
2,499 | 6.34 | |||||||||
Exercised |
(1,780 | ) | 4.83 | ||||||||
Outstanding, May 31, 2010 |
12,446 | $ | 6.24 | 4.65 | |||||||
Exercisable, May 31, 2010 |
8,373 | $ | 6.27 | 4.15 | |||||||
The aggregate intrinsic value of options exercised during fiscal 2010, 2009 and 2008 (the amount by which the market price of our common stock on the date of exercise exceeded the exercise price of the option) was $3.8 million, $2.7 million and $9.3 million; respectively. Cash received from the exercise of stock options in fiscal 2010 was $3.6 million. The total tax benefit realized for the tax deductions from options exercised in fiscal 2010 was $0.2 million. Options exercised in fiscal 2010 include 650,000 options exercised in a net share exercise resulting in 10,196 net additional shares outstanding.
Stock options exercisable at May 31, 2010, 2009 and 2008 were 8.4 million, 8.4 million and 7.5 million; respectively. The total fair value of options vested during fiscal 2010, 2009 and 2008 was $5.8 million, $5.7 million and $5.6 million; respectively.
108
LAWSON SOFTWARE, INC.
NOTES TO CONSOLIDATED FINANCIAL STATEMENTS (Continued)
5. Share-Based Compensation and Stock Incentive Plans (Continued)
A summary of stock options as of May 31, 2010 is as follows (in thousands except per share data):
| |
Options Outstanding | Options Exercisable | ||||||||||||||||||||||||
|---|---|---|---|---|---|---|---|---|---|---|---|---|---|---|---|---|---|---|---|---|---|---|---|---|---|---|
Range of Exercise Prices
|
Number of Options |
Weighted- Average Remaining Contractual Life (Yrs) |
Weighted- Average Exercise Price |
Aggregate Intrinsic Value(1) |
Number of Options |
Weighted- Average Remaining Contractual Life (Yrs) |
Weighted- Average Exercise Price |
Aggregate Intrinsic Value(1) |
||||||||||||||||||
| $2.25 - $2.32 | 158 | 0.67 | $ | 2.32 | $ | 936 | 158 | 0.67 | $ | 2.32 | $ | 936 | ||||||||||||||
| $2.97 | 390 | 1.25 | $ | 2.97 | 2,056 | 390 | 1.25 | $ | 2.97 | 2,056 | ||||||||||||||||
| $3.91 - $7.19 | 8,800 | 5.36 | $ | 5.69 | 22,441 | 5,362 | 4.92 | $ | 5.71 | 13,566 | ||||||||||||||||
| $7.20 - $13.00 | 3,093 | 4.59 | $ | 8.41 | — | 2,459 | 4.56 | $ | 8.26 | — | ||||||||||||||||
| $14.00 | 5 | 1.64 | $ | 14.00 | — | 4 | 1.64 | $ | 14.00 | — | ||||||||||||||||
| $2.25 - $14.00 | 12,446 | 4.90 | $ | 6.24 | $ | 25,433 | 8,373 | 4.56 | $ | 6.27 | $ | 16,558 | ||||||||||||||
- (1)
- The aggregate intrinsic value was calculated based on the amount by which the market value of our common stock on May 31, 2010 of $8.25 exceeded the weighted-average exercise prices for all in-the-money options outstanding and options exercisable.
Restricted Stock and Restricted Stock Unit (RSU) Awards
The following table summarizes restricted stock award activity during the fiscal 2010, 2009 and 2008 (in thousands, except per share data):
| |
Restricted Stock Awards |
Weighted Average Grant Date Fair Value |
|||||
|---|---|---|---|---|---|---|---|
Nonvested, May 31, 2007 |
775 | $ | 7.57 | ||||
Granted |
728 | $ | 9.38 | ||||
Vested |
(50 | ) | $ | 5.25 | |||
Cancelled |
(100 | ) | $ | 7.96 | |||
Nonvested, May 31, 2008 |
1,353 | $ | 8.59 | ||||
Granted |
1,721 | $ | 4.42 | ||||
Vested |
(33 | ) | $ | 10.46 | |||
Cancelled |
(364 | ) | $ | 7.81 | |||
Nonvested, May 31, 2009 |
2,677 | $ | 6.00 | ||||
Granted |
2,713 | $ | 6.47 | ||||
Vested |
(463 | ) | $ | 7.83 | |||
Cancelled |
(368 | ) | $ | 6.09 | |||
Nonvested, May 31, 2010 |
4,559 | $ | 6.20 | ||||
On June 2, 2005, we granted a restricted stock award of 100,000 shares of common stock to our then newly appointed President and CEO. These shares had a $0.5 million market value at the date of grant, vested in two 50,000 share increments on June 1, 2006 and 2007, and were subject to acceleration upon certain events. The grant date market value of the restricted stock award was
109
LAWSON SOFTWARE, INC.
NOTES TO CONSOLIDATED FINANCIAL STATEMENTS (Continued)
5. Share-Based Compensation and Stock Incentive Plans (Continued)
recorded in additional paid in capital, a component of stockholders' equity, and was amortized to operating expenses over the respective vesting periods.
During fiscal 2008 we granted restricted stock and RSU awards to various executives of 430,200 shares and 298,125 shares, respectively. These awards had a combined $6.8 million market value at the date of grant, cliff vest three years from the date of grant and are subject to acceleration upon certain events. The grant date market value of the restricted stock and RSU awards is being amortized to operating expenses over the respective vesting periods.
In fiscal 2009 we granted 96,100 shares of restricted stock, 1,042,700 shares of service-based RSU awards and 582,500 shares of performance-based RSU awards to various executives.
The restricted stock grants and service-based RSU awards generally cliff vest three years from the date of grant and are subject to acceleration upon certain events. These restricted stock awards and the service-based RSU grants had a total estimated market value of approximately $0.5 million and $4.6 million; respectively at the date of grant that is being amortized to operating expenses over the applicable vesting periods.
The fiscal 2009 performance-based RSU awards vest based on Lawson's achievement of certain financial performance targets (currently based on our non-GAAP operating margin percentage); the first 50% were to vest upon achievement of the established performance target for fiscal 2009 and the second 50% vested upon achievement of the performance target established for fiscal 2010. Vesting of these awards is also subject to acceleration upon certain events. These awards are to be cancelled if the applicable performance targets are not met. We assess the likelihood or probability of achieving the performance target for each vesting tranche on a quarterly basis. In general, applicable compensation expense is recognized when we believe it is probable that the related performance targets will be met and no compensation expense is recorded, and any previously recognized compensation expense reversed, when achievement of the performance target is not deemed probable. For fiscal 2009, the performance target was not met. Accordingly, no compensation expense was recorded in fiscal 2009 related to the first 50% tranche of the performance-based RSU awards not vesting related to fiscal 2009 and they were cancelled in the first quarter of fiscal 2010. The second 50% tranche of the performance based RSU awards had a grant date market value of approximately $3.0 million that was amortized to operating expenses over the fiscal 2010 performance period as the fiscal 2010 performance target was achieved.
In fiscal 2010 we granted 2,121,589 shares of service-based RSU awards and 591,460 shares of performance-based RSU awards to various executives.
The service-based RSU awards generally cliff vest three years from the date of grant and are subject to acceleration upon certain events. The service-based RSU grants had a total estimated market value of approximately $13.8 million at the date of grant that is being amortized to operating expenses over the applicable vesting periods.
The fiscal 2010 performance-based RSU awards vest based on Lawson's achievement of certain financial performance targets (fiscal 2010 non-GAAP operating margin percentage). Vesting of these awards is also subject to acceleration upon certain events. These performance based RSU awards had a grant date market value of approximately $3.7 million that was amortized to operating expenses over the fiscal 2010 performance period as the fiscal 2010 performance target was achieved.
110
LAWSON SOFTWARE, INC.
NOTES TO CONSOLIDATED FINANCIAL STATEMENTS (Continued)
5. Share-Based Compensation and Stock Incentive Plans (Continued)
For fiscal 2010, 2009 and 2008 amortization of the unearned compensation related to restricted stock and RSU awards was $10.6 million, $2.4 million and $1.6 million; respectively.
During fiscal 2010 none of the criteria to trigger the acceleration of any of the vesting requirements related to the restricted stock awards or RSU awards occurred.
Employee Stock Purchase Plan
In 2001, our stockholders approved our 2001 Employee Stock Purchase Plan (ESPP), which was effective as of our initial public offering. Our ESPP is intended to be a qualified plan within the meaning of Section 423 of the Internal Revenue Code of 1986, as amended. Our ESPP, as amended, allows eligible employees to purchase our common stock at a price equal to 85% of the fair market value at the end of each quarter of the calendar year offering period. The ESPP originally terminated when all of the shares reserved under the plan were purchased or five years from the effective date unless our Board of Directors resolved to extend the ESPP for one or more additional periods of five years each. In June 2006, our Board of Directors approved an amendment to extend the ESPP for five years, which was approved by our stockholders. There are 20.8 million shares of our common stock reserved for issuance under the ESPP, of which approximately 16.2 million shares were available for issuance as of May 31, 2010. There have been 4.6 million shares issued under the ESPP through May 31, 2010.
Under FASB guidance related to share based payments, the estimated fair value of common stock issued under our ESPP is recognized as share-based compensation in our Consolidated Statements of Operations for fiscal 2010, 2009 and 2008. The fair value compensation costs of the shares issued under our ESPP is based on the 15% discount on our common stock provided employees at the end of each calendar quarterly offering period. ESPP share-based compensation of approximately $0.4 million was recorded in fiscal 2010 and approximately $0.5 million was recorded in both fiscal 2009 and 2008.
Tax Impacts of Share-based Compensation
In addition to the recognition of the fair value of our share-based awards as compensation expense in our Consolidated Statements of Operations, FASB guidance requires the benefits of tax deductions in excess of the compensation cost recognized for those options and stock awards to be classified as financing cash inflows rather than operating cash inflows. For fiscal 2010, 2009 and 2008, we had excess tax benefits from stock transactions of $0.9 million, $0.6 million and $2.1 million; respectively which have been classified as financing cash inflows. These amounts are shown as "Excess tax benefit from stock transactions" in our Consolidated Statements of Cash Flows.
6. Financial Statement Components
Supplemental Cash Flow Information
Supplemental disclosures of our non-cash investing and financing transactions (in thousands):
| |
Years Ended May 31, | |||||||||
|---|---|---|---|---|---|---|---|---|---|---|
| |
2010 | 2009 | 2008 | |||||||
Stock options exercised using common stock |
$ | 71 | $ | 307 | $ | 347 | ||||
Assets acquired under capital leases |
$ | 803 | $ | 3,039 | $ | 425 | ||||
111
LAWSON SOFTWARE, INC.
NOTES TO CONSOLIDATED FINANCIAL STATEMENTS (Continued)
6. Financial Statement Components (Continued)
Acquisition Related Costs
In fiscal 2010 we incurred acquisition costs of $1.6 million related to our January 2010 acquisition of Healthvision. During fiscal 2008, we incurred approximately $0.3 million in acquisition costs related to our VasTech and PLM acquisitions. In the accompanying Consolidated Statements of Cash Flows these costs are reflected within cash flows from operating activities within our net income in fiscal 2010 and within cash flows from investing activities as cash paid in conjunction with acquisitions in fiscal 2008. We incurred no acquisition costs in fiscal 2009.
Restricted Cash
We had $10.7 million held as restricted cash as of May 31, 2010, of which approximately $0.7 million and $10.0 million have been classified as current and non-current, respectively, on our Consolidated Balance Sheets. The non-current portion relates primarily to the $9.1 million held on our account at Lehman Brothers. See Note 9, Common Stock. The remainder of the restricted cash balances relate to various collateral arrangements related to our property leases worldwide.
We had $11.0 million held as restricted cash as of May 31, 2009; current and non-current balances were $9.2 million and $1.8 million, respectively on our Consolidated Balance Sheets. The current portion related primarily to the $9.1 million held on our account at Lehman Brothers. During fiscal 2010, when we obtained further information about the likely timing of the settlement of our claims against Lehman Brothers' estate, we reclassified this restricted cash to a long-term asset.
Accounts Receivable, Net
The components of our trade accounts receivable were as follows (in thousands):
| |
May 31, 2010 | May 31, 2009 | ||||||
|---|---|---|---|---|---|---|---|---|
Trade accounts receivable |
$ | 107,204 | $ | 141,436 | ||||
Unbilled accounts receivable |
14,259 | 14,752 | ||||||
Less: allowance for doubtful accounts |
(3,487 | ) | (3,522 | ) | ||||
Trade accounts receivable, net |
$ | 117,976 | $ | 152,666 | ||||
Unbilled accounts receivable as of the balance sheet dates represents revenue recognized on contracts for which billings have not yet been presented to our customers. These amounts have been earned but not billed due to the terms specified in applicable customer contracts.
112
LAWSON SOFTWARE, INC.
NOTES TO CONSOLIDATED FINANCIAL STATEMENTS (Continued)
6. Financial Statement Components (Continued)
Rollforward of Allowance for Doubtful Accounts
The following is a rollforward of our allowance for doubtful accounts (in thousands):
Balance, May 31, 2007 |
$ | 9,907 | |||
Acquired in business combination |
286 | ||||
Provision |
1,110 | ||||
Write-offs |
(6,362 | ) | |||
Recoveries |
11 | ||||
Translation adjustment |
673 | ||||
Balance, May 31, 2008 |
5,625 | ||||
Provision |
1,489 | ||||
Write-offs |
(3,283 | ) | |||
Recoveries |
14 | ||||
Translation adjustment |
(323 | ) | |||
Balance, May 31, 2009 |
3,522 | ||||
Provision |
1,312 | ||||
Write-offs |
(1,392 | ) | |||
Recoveries |
121 | ||||
Translation adjustment |
(76 | ) | |||
Balance, May 31, 2010 |
$ | 3,487 | |||
Property and Equipment, Net
Our property and equipment consisted of the following for the periods presented (in thousands):
| |
May 31, 2010 | May 31, 2009 | Useful Lives | ||||||
|---|---|---|---|---|---|---|---|---|---|
Buildings |
$ | 519 | $ | 589 | 50 years | ||||
Automobiles |
2,761 | 4,385 | 3-5 years | ||||||
Equipment |
91,281 | 70,577 | 1-5 years | ||||||
Office furniture |
16,520 | 21,740 | 5-7 years | ||||||
Leasehold improvements |
22,201 | 21,644 | 3-16 years | ||||||
Equipment under capital leases |
3,077 | 6,884 | 3-7 years | ||||||
Total property and equipment |
136,359 | 125,819 | |||||||
Less accumulated depreciation and amortization |
(81,688 | ) | (70,178 | ) | |||||
Property and equipment, net |
$ | 54,671 | $ | 55,641 | |||||
During fiscal 2010, we capitalized approximately $5.5 million of costs related to our implementation efforts of internal use software in accordance with the FASB guidance related to intangibles-goodwill and other. These costs are included in equipment in the above table and are being amortized over the software's estimated useful life of five years. We capitalized $12.3 million of similar costs in fiscal 2009. See Note 2, Summary of Significant Accounting Policies—Property and Equipment.
113
LAWSON SOFTWARE, INC.
NOTES TO CONSOLIDATED FINANCIAL STATEMENTS (Continued)
6. Financial Statement Components (Continued)
Depreciation expense for equipment under capital leases was $1.7 million, $1.2 million and $1.2 million for fiscal 2010, 2009 and 2008; respectively. Accumulated depreciation for equipment under capital leases was $2.3 million and $3.3 million as of May 31, 2010 and 2009; respectively.
Deferred Revenue
The components of deferred revenue were as follows (in thousands):
| |
May 31, 2010 | May 31, 2009 | ||||||
|---|---|---|---|---|---|---|---|---|
License fees |
$ | 39,221 | $ | 55,667 | ||||
Maintenance |
275,237 | 224,115 | ||||||
Consulting |
13,702 | 12,741 | ||||||
Total deferred revenue |
328,160 | 292,523 | ||||||
Less current portion |
(319,797 | ) | (279,041 | ) | ||||
Deferred revenue—non-current |
$ | 8,363 | $ | 13,482 | ||||
In general, changes in the balance of our deferred revenue are cyclical and primarily driven by the timing of our maintenance services renewal cycles. Our renewal dates occur in the third and fourth quarters of our fiscal year with revenues being recognized ratably over the applicable service periods. The increase in the May 31, 2010 balance as compared to May 31, 2009 was primarily due to the timing of billings and related collections associated with our maintenance contracts and the inclusion of deferred revenue balances related to our acquisition of Healthvision. These increases were somewhat offset by a decrease in deferred license revenues as we recognized certain deferred license fees revenues in the first half of fiscal 2010 primarily relating to contracts entered into in the fourth quarter of fiscal 2009 under our targeted sales campaign offered to our existing S3 customer base.
7. Long-Term Debt and Credit Facilities
Long-term debt consisted of the following (in thousands):
| |
May 31, 2010 | May 31, 2009 | ||||||
|---|---|---|---|---|---|---|---|---|
| |
|
(as adjusted) |
||||||
Senior convertible notes, interest at 2.5% |
$ | 240,000 | $ | 240,000 | ||||
Debt discount(1) |
(17,535 | ) | (26,022 | ) | ||||
Car loans, interest at average rate of 1.5% |
2,761 | 4,384 | ||||||
Capital lease obligations, interest at 3.0% |
1,563 | 3,562 | ||||||
Total long-term debt |
226,789 | 221,924 | ||||||
Less current maturities |
(2,646 | ) | (4,591 | ) | ||||
Total long-term debt—non-current |
$ | 224,143 | $ | 217,333 | ||||
- (1)
- Adjusted to reflect adoption of the FASB guidance on accounting for convertible debt securities.
114
LAWSON SOFTWARE, INC.
NOTES TO CONSOLIDATED FINANCIAL STATEMENTS (Continued)
7. Long-Term Debt and Credit Facilities (Continued)
The aggregate maturities of long-term debt for each of the five years subsequent to fiscal 2010 are as follows (in thousands):
2011 |
$ | 2,646 | |||
2012 |
223,962 | ||||
2013 |
164 | ||||
2014 |
17 | ||||
2015 |
— | ||||
Thereafter |
— | ||||
Total long-term debt |
$ | 226,789 | |||
Interest paid was $6.7 million, $6.6 million and $6.8 million in fiscal 2010, 2009 and 2008; respectively.
In April, 2007 we issued $240.0 million in aggregate principal amount of 2.50% senior convertible notes (the notes) with net proceeds, after expenses, of approximately $233.5 million. The notes mature on April 15, 2012. The notes bear interest at a rate of 2.50% per annum, which is payable semi-annually in arrears, on April 15 and October 15 of each year, beginning October 15, 2007. See Note 2, Summary of Significant Accounting Policies—Recent Accounting Pronouncements, for additional information regarding our accounting for the notes. The notes do not contain any restrictive financial covenants. The notes are convertible, at the holders' option, into cash and, if applicable, shares of our common stock based on an initial conversion rate of 83.2293 shares of common stock per $1,000 principal amount of notes, which is equivalent to an initial conversion price of approximately $12.02 (which reflects a 35% conversion premium based on the closing sale price of $8.90 per share of our common stock as reported by NASDAQ on April 17, 2007). At the issuance of the notes, we simultaneously entered into separate agreements to purchase call options and sell warrants. As discussed below, we exercised our right to terminate the call options and the warrants on October 10, 2008 which are referred to below as "note hedge transaction and a warrant transaction." The conversion rate may be adjusted from time-to-time in certain instances. The notes are convertible only under the following certain circumstances:
- •
- conversion based on the price of our common stock;
- •
- at any time on or after January 15, 2012;
- •
- conversion upon specified distributions to holders of our common stock or specified corporate transactions; and
- •
- conversion upon satisfaction of a trading price condition.
The notes are our senior unsecured obligations and are not guaranteed by any of our subsidiaries. The notes rank equally in right of payment with our existing and any future senior debt and senior in right of payment to any future subordinated debt. The notes are effectively junior to our existing and any future secured debt to the extent of the value of the related collateral. The notes are also effectively subordinated to all existing and future debt and other liabilities (including trade payables) of our subsidiaries. If a fundamental change (as defined in the governing indenture dated April 23, 2007) occurs at any time prior to the maturity date, then each holder of the notes shall have the right, at such holder's option, to require us to repurchase all of such holder's notes for cash, or any portion of the
115
LAWSON SOFTWARE, INC.
NOTES TO CONSOLIDATED FINANCIAL STATEMENTS (Continued)
7. Long-Term Debt and Credit Facilities (Continued)
principal amount thereof that is equal to $1,000 or an integral multiple thereof, on the date specified by us at a repurchase price equal to 100% of the principal amount thereof, plus accrued and unpaid interest thereon to, but excluding, the repurchase date.
We had certain business relationships with Lehman Brothers OTC Derivatives Inc. (Lehman OTC), including a convertible note hedge transaction and a warrant transaction both entered into as part of the issuance of our senior convertible notes and an accelerated share repurchase transaction (See Note 9, Common Stock). On September 15, 2008, Lehman Brothers Holdings Inc. (Lehman Holdings) filed for protection under Chapter 11 of the United States Bankruptcy Code in the United States Bankruptcy Court in the Southern District of New York. Subsidiaries of Lehman Holdings, including Lehman Brothers Inc. (Lehman Brothers) and Lehman OTC, were not included in the filing. On September 19, 2008, Lehman Brothers was placed in liquidation under the Securities Investor Protection Act. In addition, on October 3, 2008, Lehman OTC also filed for Chapter 11 bankruptcy.
Lehman Brothers was one of the original purchasers of our senior convertible notes. None of the net proceeds from the offering are on deposit with Lehman Brothers or any of its affiliates. In conjunction with the issuance of the notes, we also entered into a convertible note hedge transaction with Lehman OTC, an affiliate of Lehman Brothers. In a separate agreement, we entered into a warrant transaction with Lehman OTC. Together, these transactions were designed to reduce the potential dilution resulting from the potential conversion of our senior convertible notes into shares of common stock and effectively increased the conversion price of the notes to $15.58 per share from the initial conversion price of the notes of $12.02 per share. We paid $57.7 million ($35.7 million net of tax benefit) to acquire the call options and received $34.2 million as a result of the sale of the warrants. The purchase of the call options was recorded as a reduction to stockholders' equity and the sale of the warrants was recorded as an increase to stockholders' equity in accordance with applicable FASB guidance.
The bankruptcy filing by Lehman OTC was an event of default under the hedge transaction and warrant agreements. As a result of that default, we exercised our rights to terminate both the hedge transaction and the warrant transaction on October 10, 2008. As a result of our termination of the hedge transaction, terms of the original transaction provided us the right to seek recovery from Lehman OTC equal to the termination-date fair value of the common stock option instrument we issued in connection with the hedge transaction. At the time of termination, the instrument ceased being a hedge instrument and was effectively replaced by our claim against Lehman OTC. Accordingly, for financial reporting purposes, we recorded the estimated fair value of the related hedge transaction asset and the warrant liability during the second quarter of fiscal 2009, resulting in a decrease in our stockholders' equity equal to the net amount of the recorded asset and liability. As part of the convertible note hedge transaction, Lehman OTC agreed to have Lehman Holdings guarantee certain obligations of Lehman OTC. Based on the developments in the bankruptcy proceeding, we do not anticipate receiving a recovery from Lehman Holdings for the guaranty agreed to by Lehman OTC.
On June 4, 2009, counsel for Lehman Holdings and Lehman OTC demanded payment from us of the termination-date fair value of the warrant, asserted that in the contracts we have waived the right to setoff against the amounts owed to us under the hedge transaction and claimed we violated the bankruptcy stay in asserting offset rights. We have refused payment and contend that the U.S. Bankruptcy Code gives us legal rights of offset in this dispute. Lehman OTC disagrees with our contention and claims that we waived our right of offset under the terms of the original transaction
116
LAWSON SOFTWARE, INC.
NOTES TO CONSOLIDATED FINANCIAL STATEMENTS (Continued)
7. Long-Term Debt and Credit Facilities (Continued)
documents. As of the date of this filing we are in discussions with representatives of Lehman OTC regarding the resolution of the offset issue as well as other issues surrounding the hedge transaction asset and the warrant liability, including their proper valuation. We continue to closely monitor the Lehman Holdings bankruptcy situation, the liquidation of Lehman Brothers, as well as the Lehman OTC bankruptcy and our legal rights under our contractual relationships with Lehman OTC and Lehman Brothers.
For financial reporting purposes, we estimated the fair value of the hedge transaction asset and the warrant liability using the Black-Scholes option pricing model and considered the credit risk of Lehman OTC. The fair value of these obligations recorded for financial reporting purposes may differ from the values ultimately determined in various legal proceedings, including actions of the U.S. bankruptcy court. If the ultimate settlement of either of these obligations differs from the recorded amounts, we will be required to recognize any related gain or loss in our results of operations in the period such settlement is known. As of May 31, 2010, our claim against Lehman OTC and Lehman OTC's claim against us have not been settled.
The terms of the senior convertible notes and the rights of note holders are not affected by the status of Lehman Holdings or Lehman OTC or by the termination of the convertible note hedge or warrant transactions. We currently believe that the Lehman Holdings bankruptcy, and its potential impact on subsidiaries of Lehman Holdings, the liquidation of Lehman Brothers, and the bankruptcy of Lehman OTC, will not have a material adverse effect on our financial position, results of operations or cash flows.
We have an uncommitted credit facility that consists of a guarantee line with Skandinaviska Enskilda Banken (SEB) in the amount of $3.8 million (30.0 million SEK). We had no borrowings outstanding under this line as of May 31, 2010.
8. Non-controlling Interest and Investment in Unconsolidated Subsidiaries
Non-controlling Interest. As of May 31, 2010, we had an over 99% interest in our subsidiary in Poland. The non-controlling interest for our Poland subsidiary was in a deficit position as of May 31, 2010 and 2009 and therefore there was no non-controlling interest recorded on our Consolidated Balance Sheets.
Investment in Unconsolidated Subsidiaries. We recorded approximately $0.1 million or less of equity in earnings from investments in unconsolidated subsidiaries in each of fiscal 2010, 2009 and 2008. Net sales recorded related to these subsidiaries were immaterial. The equity method of accounting is used for companies and other investments for which we have significant influence, which generally represents common stock ownership or partnership equity of at least 20% and not more than 50%. As of May 31, 2010, our investment in unconsolidated subsidiaries included a 30% interest in Intentia Thailand Co. Ltd. and a 43% interest in Scase A/S. Both of these companies are involved in the sale of our M3 software, and the supporting services associated with the software. Investments in unconsolidated subsidiaries are included in other assets in our Consolidated Balance Sheets.
117
LAWSON SOFTWARE, INC.
NOTES TO CONSOLIDATED FINANCIAL STATEMENTS (Continued)
9. Common Stock
Our Board of Directors approved a share repurchase program of up to $100.0 million of common stock in November 2006 and on July 10, 2008, increased the maximum authorized for repurchase under the program to $400.0 million. The share repurchases are funded using our existing cash balances and future cash flows and may occur through transactions structured through investment banking institutions as permitted by securities laws and other legal requirements, open market purchases, privately negotiated transactions and/or other mechanisms. Our share repurchase program does not have an expiration date and allows us to repurchase shares at our discretion and market conditions influence the timing of the buybacks and the number of shares repurchased. There can be no assurance as to the amount, timing or repurchase price of future repurchases, if any, related to the share repurchase program. The program may also be modified, extended or terminated by our Board of Directors at any time.
In fiscal 2010, we repurchased an aggregate of 1.3 million shares of our common stock at an average price of $5.92 per share under the share repurchase program. From inception of the repurchase program through May 31, 2010, we have used $270.9 million to repurchase approximately 32.9 million shares at an average price of $8.23 per share. The repurchased shares are recorded as treasury stock and result in a reduction to our stockholders equity. The shares will be used for general corporate purposes. As of May 31, 2010, the maximum dollar value of shares that may yet be purchased under this program was $129.1 million.
During the first quarter of fiscal 2009 we purchased 11.5 million shares through an accelerated share repurchase transaction (the ASR) that we entered into with Lehman OTC on July 15, 2008. The average price per share of the shares purchased under the ASR transaction was $7.93. Lehman OTC delivered 11.5 million shares of our common stock to us through August 7, 2008. Under the agreement, Lehman OTC was obligated to deliver additional shares to us at maturity of the transaction based on the final per share purchase price and the total number of shares repurchased as determined primarily by the volume-weighted average price of our common stock during the term of the agreement. The agreement further required that Lehman post cash collateral to a segregated brokerage account in our name in an amount equal to the value of the additional shares, or net cash, due to us if the ASR were terminated as of the current date. Upon an event of default by Lehman OTC, pursuant to our rights under the ASR, we issued a notice of default to Lehman OTC on September 24, 2008 and terminated the ASR agreement and requested the distribution of all $9.1 million of funds which Lehman OTC had previously deposited into our segregated brokerage account at Lehman Brothers as required under the ASR agreement. On March 25, 2009, we received a notice from the bankruptcy trustee for the Lehman Brothers estate that the trustee has allowed our customer claim for that $9.1 million amount. As of the filing date of this Annual Report on Form 10-K, we have not received payment of these funds.
The bankruptcy trustee for the Lehman Brothers estate has filed certain court papers against Lehman Brothers indicating that there were shortfalls in the reserves intended to cover customer claims such as Lawson's ASR claim for $9.1 million. The trustee sought permission to use assets other than the reserves to cover these customer claims. Several creditors (non-customers) objected and a compromise was reached in early March where funds could be used to cover what appears to be a significant part of the shortfall and the trustee could seek further authority to cover additional shortfalls. The trustee is continuing to investigate the reasons for the aggregate shortfalls in the reserve for all customer claims and other possible sources of funds to make up the aggregate shortfall. We had originally anticipated that we would receive payment of our approved $9.1 million claim in 2010 and had recorded these funds as restricted cash and reflected the funds as a current asset in our
118
LAWSON SOFTWARE, INC.
NOTES TO CONSOLIDATED FINANCIAL STATEMENTS (Continued)
9. Common Stock (Continued)
Consolidated Balance Sheet as of May 31, 2009. However, based on these developments relating to the Lehman Brothers estate, during the third quarter of fiscal 2010 we reclassified the funds to reflect them as a long-term asset. We continue to closely monitor the Lehman Brothers bankruptcy situation and its impact on our claim.
The $7.93 average price per share of the shares purchased under the ASR is inclusive of the $9.1 million discussed above. Any potential reduction in the amount we may receive related to our approved claim would be an adjustment to the average price per share of the related treasury stock and would not impact our future results of operations.
We currently believe that the Lehman Holdings bankruptcy, and its potential impact on subsidiaries of Lehman Holdings, the liquidation of Lehman Brothers Inc., and the bankruptcy of Lehman OTC, will not have a material adverse effect on our financial position, results of operations or cash flows. We continue to closely monitor the Lehman Holdings bankruptcy situation, the liquidation of Lehman Brothers Inc., as well as the Lehman OTC bankruptcy, and our legal rights under our contractual relationships with Lehman OTC.
10. Shareholder Rights Plan
On July 26, 2004, our Board of Directors adopted a Shareholder Rights Plan in which preferred stock purchase rights (the Right(s)) were distributed as a non-taxable dividend at the rate of one Right for each share of common stock held as of the close of business on July 28, 2004. Each Right will entitle stockholders to buy one-one hundredth of a newly issued share of Series B Junior Participating Stock of the Company at an exercise price of $29.00. The Rights will be exercisable only if a person or group, other than an exempted person, acquires beneficial ownership of, or makes a tender for, 15% or more of our outstanding common stock.
If any person, other than an exempted person becomes the beneficial owner of 15% or more of our outstanding common stock, each Right not owned by such person or certain related parties will entitle its holder to purchase at the Right's then current exercise prices, shares of our common stock having a market value equal to twice the then current exercise price. In addition, if after a person becomes the beneficial owner of 15% or more of our outstanding common stock, we are involved in a merger or other business combination transaction with another person after which our common stock does not remain outstanding, or sells 50% or more of its assets or earning power to another person, each Right will entitle its holder to purchase at the Right's then current exercise price, shares of common stock of such other person having a market value equal to twice the current exercise price.
Our Board of Directors will be entitled to redeem the Rights at $0.01 per Right at any time prior to a person or group acquiring 15% or more of our common stock. Otherwise, the Rights will expire on July 28, 2014.
11. Profit Sharing and 401(k) Retirement Plan
We have a defined contribution profit sharing plan which we believe conforms to IRS provisions for 401(k) plans. Our employees are eligible to participate in the plan upon employment and are eligible for the Company match upon enrollment in the plan. Participants may contribute up to 15% of their gross earnings to the plan. We match 50% of the first 4% of employee contributions and may make additional contributions as determined by our Board of Directors. In addition, we have defined
119
LAWSON SOFTWARE, INC.
NOTES TO CONSOLIDATED FINANCIAL STATEMENTS (Continued)
11. Profit Sharing and 401(k) Retirement Plan (Continued)
contribution and defined benefit pension plans for certain of our international employees. The defined benefit plans cover approximately 210 employees in Norway, France and Switzerland. These plans generally provide pension benefits based on years of service and compensation level. Our aggregate projected benefit obligations under these plans was approximately $5.8 million as of May 31, 2010 and the aggregate fair value of assets available to fund these projected benefits as of May 31, 2010 was approximately $4.6 million. Under the provisions of FASB guidance related to compensation and retirement benefits, net unrealized actuarial gains of $2.4 million related to our defined benefit plans have been reflected in our stockholders' equity in accumulated other comprehensive income in fiscal 2010. Our contributions to the defined contribution plans were approximately $10.1 million, $13.5 million and $12.9 million for fiscal 2010, 2009 and 2008; respectively.
On April 2, 2010, our Benefits Committee approved a plan to modify our defined benefit pension plan in Norway (the Plan) such that beginning on June 1, 2010, active participants in the Plan no longer accumulated benefits for their services. Assets equivalent to the accumulated benefits of all active participants in the Plan have been transferred to a newly-established defined contribution plan in fiscal 2011. All retired participants will continue to receive benefits under the Plan. The modification of the Plan resulted in a curtailment of benefits in the fourth quarter of fiscal 2010 when the modifications were approved. Accordingly, we recorded a gain of approximately $1.8 million in the fourth quarter of fiscal 2010 related to the change in all active participants' projected benefit obligations resulting from the curtailment. This gain is reflected in general and administrative expenses in our fiscal 2010 Consolidated Statements of Operations. In addition, the modification of the Plan led to a settlement of active participants' projected benefit obligations in the first quarter of fiscal 2011. Therefore, we anticipate recording an additional gain of approximately $1.5 million in the first quarter of fiscal 2011 related to the pension settlement.
12. Income Taxes
The following tables related to our income (loss) before taxes, our provision for income taxes, the reconciliation of our income tax rate and the temporary differences that comprise our net deferred tax assets have been adjusted to reflect the adoption of the FASB guidance related to accounting for convertible debt securities. See Note 2, Summary of Significant Accounting Policies-Adoption of New Accounting Pronouncements, for more information.
Our income before income taxes consisted of the following components (in thousands):
| |
Years Ended May 31, | ||||||||||
|---|---|---|---|---|---|---|---|---|---|---|---|
| |
2010 | 2009 | 2008 | ||||||||
United States |
$ | 43,455 | $ | 50,894 | $ | 34,542 | |||||
International operations |
(2,819 | ) | (14,972 | ) | 3,191 | ||||||
Income before income taxes |
$ | 40,636 | $ | 35,922 | $ | 37,733 | |||||
120
LAWSON SOFTWARE, INC.
NOTES TO CONSOLIDATED FINANCIAL STATEMENTS (Continued)
12. Income Taxes (Continued)
The provision for income taxes consisted of the following components (in thousands):
| |
Years Ended May 31, | ||||||||||
|---|---|---|---|---|---|---|---|---|---|---|---|
| |
2010 | 2009 | 2008 | ||||||||
Current: |
|||||||||||
Federal |
$ | 12,917 | $ | 20,626 | $ | 15,887 | |||||
State |
1,870 | 3,515 | 2,324 | ||||||||
Foreign |
5,309 | 4,194 | 4,467 | ||||||||
Total current provision |
20,096 | 28,335 | 22,678 | ||||||||
Deferred: |
|||||||||||
Federal |
3,087 | (3,906 | ) | 1,155 | |||||||
State |
229 | (417 | ) | 1,069 | |||||||
Foreign |
4,200 | (2,281 | ) | 3,509 | |||||||
Total deferred provision |
7,516 | (6,604 | ) | 5,733 | |||||||
Total provision for income taxes |
$ | 27,612 | $ | 21,731 | $ | 28,411 | |||||
A reconciliation of the expected income tax provision at the U.S. statutory rate with the provision for income taxes was as follows:
| |
Years Ended May 31, | |||||||||
|---|---|---|---|---|---|---|---|---|---|---|
| |
2010 | 2009 | 2008 | |||||||
Taxes computed at statutory rate |
35.0 | % | 35.0 | % | 35.0 | % | ||||
State taxes—net of federal benefits |
3.6 | 5.2 | 3.2 | |||||||
Foreign earnings at other than U.S. statutory rates |
(1.7 | ) | (8.3 | ) | (11.1 | ) | ||||
Unbenefitted foreign losses |
28.9 | 35.6 | 27.2 | |||||||
Tax credits |
(2.1 | ) | (3.8 | ) | (2.0 | ) | ||||
Non-deductible expenses |
4.7 | 4.5 | 4.1 | |||||||
Tax exempt income |
— | — | (0.7 | ) | ||||||
Domestic manufacturer's deduction |
(2.0 | ) | (3.7 | ) | (2.4 | ) | ||||
Valuation allowance—capital losses |
— | — | 18.8 | |||||||
Valuation allowance—other |
(2.3 | ) | (9.5 | ) | (2.5 | ) | ||||
Other, net |
3.8 | 5.5 | 5.7 | |||||||
|
67.9 | % | 60.5 | % | 75.3 | % | ||||
121
LAWSON SOFTWARE, INC.
NOTES TO CONSOLIDATED FINANCIAL STATEMENTS (Continued)
12. Income Taxes (Continued)